Patrick County, VA Map & Demographics
Patrick County Map
Patrick County Overview
$32,883
PER CAPITA INCOME
$69,286
AVG FAMILY INCOME
$49,180
AVG HOUSEHOLD INCOME
24.1%
WAGE / INCOME GAP [ % ]
75.9¢/ $1
WAGE / INCOME GAP [ $ ]
0.48
INEQUALITY / GINI INDEX
17,660
TOTAL POPULATION
8,930
MALE POPULATION
8,730
FEMALE POPULATION
102.29
MALES / 100 FEMALES
97.76
FEMALES / 100 MALES
50.9
MEDIAN AGE
2.8
AVG FAMILY SIZE
2.2
AVG HOUSEHOLD SIZE
7,509
LABOR FORCE [ PEOPLE ]
50.2%
PERCENT IN LABOR FORCE
2.3%
UNEMPLOYMENT RATE
Income in Patrick County
Income Overview in Patrick County
Per Capita Income in Patrick County is $32,883, while median incomes of families and households are $69,286 and $49,180 respectively.
| Characteristic | Number | Measure |
| Per Capita Income | 17,660 | $32,883 |
| Median Family Income | 4,816 | $69,286 |
| Mean Family Income | 4,816 | $86,763 |
| Median Household Income | 7,779 | $49,180 |
| Mean Household Income | 7,779 | $73,580 |
| Income Deficit | 4,816 | $0 |
| Wage / Income Gap (%) | 17,660 | 24.14% |
| Wage / Income Gap ($) | 17,660 | 75.86¢ per $1 |
| Gini / Inequality Index | 17,660 | 0.48 |
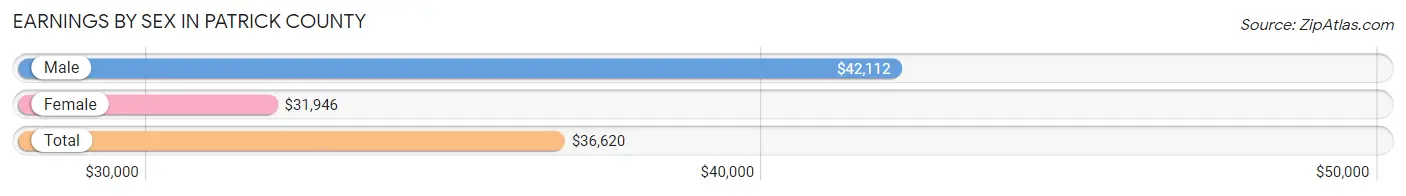
Earnings by Sex in Patrick County
Average Earnings in Patrick County are $36,620, $42,112 for men and $31,946 for women, a difference of 24.1%.
| Sex | Number | Average Earnings |
| Male | 4,433 (54.7%) | $42,112 |
| Female | 3,666 (45.3%) | $31,946 |
| Total | 8,099 (100.0%) | $36,620 |
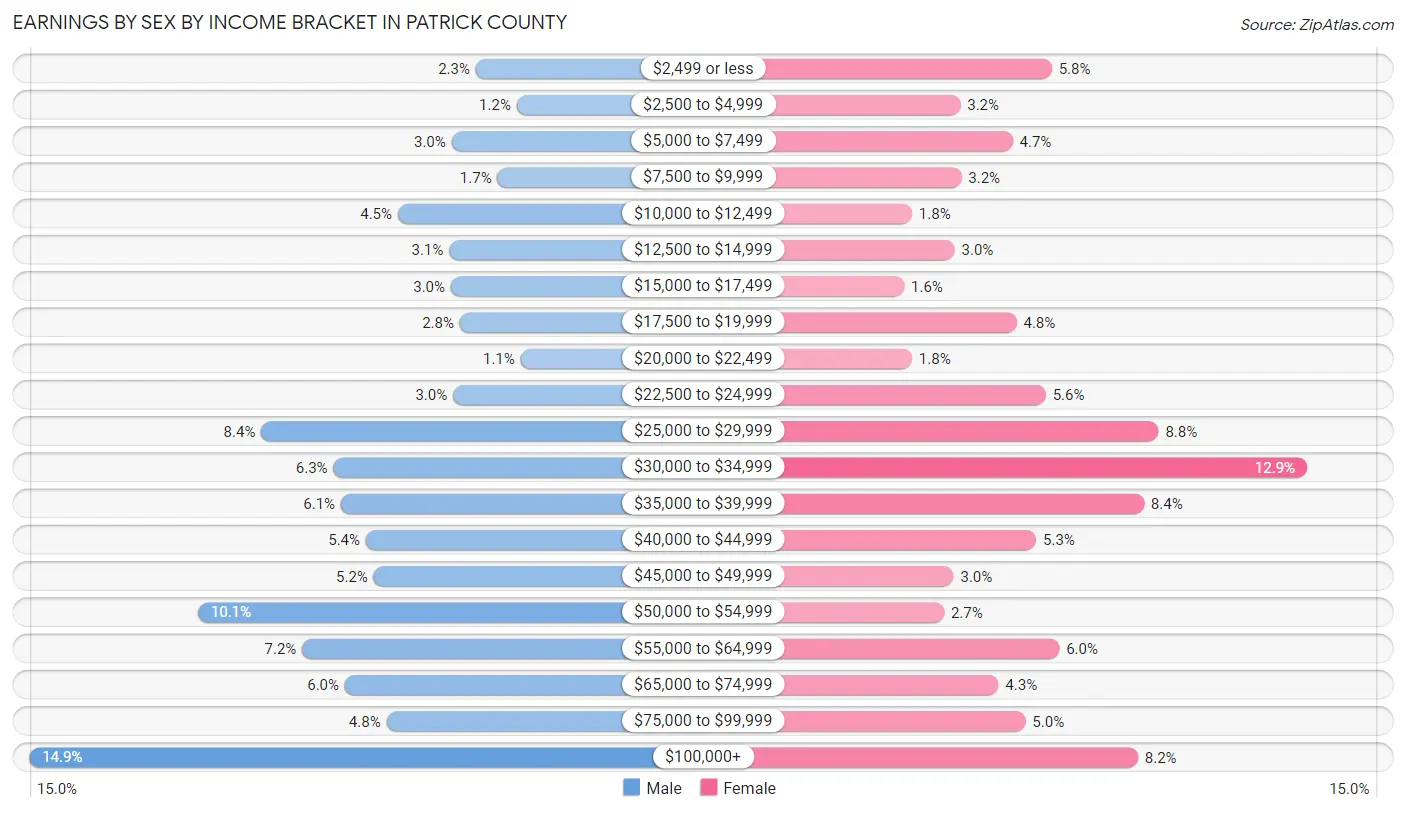
Earnings by Sex by Income Bracket in Patrick County
The most common earnings brackets in Patrick County are $100,000+ for men (659 | 14.9%) and $30,000 to $34,999 for women (474 | 12.9%).
| Income | Male | Female |
| $2,499 or less | 103 (2.3%) | 211 (5.8%) |
| $2,500 to $4,999 | 52 (1.2%) | 117 (3.2%) |
| $5,000 to $7,499 | 133 (3.0%) | 171 (4.7%) |
| $7,500 to $9,999 | 76 (1.7%) | 118 (3.2%) |
| $10,000 to $12,499 | 200 (4.5%) | 67 (1.8%) |
| $12,500 to $14,999 | 136 (3.1%) | 111 (3.0%) |
| $15,000 to $17,499 | 134 (3.0%) | 59 (1.6%) |
| $17,500 to $19,999 | 123 (2.8%) | 175 (4.8%) |
| $20,000 to $22,499 | 47 (1.1%) | 67 (1.8%) |
| $22,500 to $24,999 | 131 (3.0%) | 205 (5.6%) |
| $25,000 to $29,999 | 370 (8.4%) | 321 (8.8%) |
| $30,000 to $34,999 | 280 (6.3%) | 474 (12.9%) |
| $35,000 to $39,999 | 271 (6.1%) | 306 (8.4%) |
| $40,000 to $44,999 | 240 (5.4%) | 195 (5.3%) |
| $45,000 to $49,999 | 230 (5.2%) | 110 (3.0%) |
| $50,000 to $54,999 | 449 (10.1%) | 100 (2.7%) |
| $55,000 to $64,999 | 319 (7.2%) | 219 (6.0%) |
| $65,000 to $74,999 | 266 (6.0%) | 156 (4.3%) |
| $75,000 to $99,999 | 214 (4.8%) | 184 (5.0%) |
| $100,000+ | 659 (14.9%) | 300 (8.2%) |
| Total | 4,433 (100.0%) | 3,666 (100.0%) |
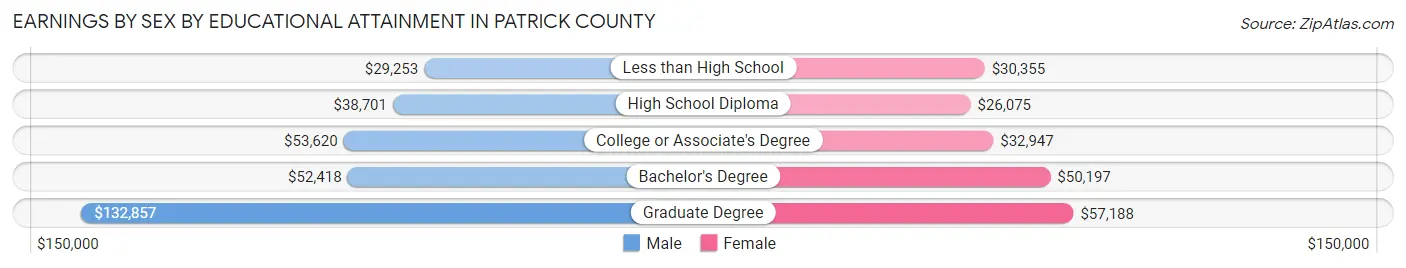
Earnings by Sex by Educational Attainment in Patrick County
Average earnings in Patrick County are $46,512 for men and $32,507 for women, a difference of 30.1%. Men with an educational attainment of graduate degree enjoy the highest average annual earnings of $132,857, while those with less than high school education earn the least with $29,253. Women with an educational attainment of graduate degree earn the most with the average annual earnings of $57,188, while those with high school diploma education have the smallest earnings of $26,075.
| Educational Attainment | Male Income | Female Income |
| Less than High School | $29,253 | $30,355 |
| High School Diploma | $38,701 | $26,075 |
| College or Associate's Degree | $53,620 | $32,947 |
| Bachelor's Degree | $52,418 | $50,197 |
| Graduate Degree | $132,857 | $57,188 |
| Total | $46,512 | $32,507 |
Family Income in Patrick County
Family Income Brackets in Patrick County
According to the Patrick County family income data, there are 949 families falling into the $35,000 to $49,999 income range, which is the most common income bracket and makes up 19.7% of all families. Conversely, the $10,000 to $14,999 income bracket is the least frequent group with only 125 families (2.6%) belonging to this category.
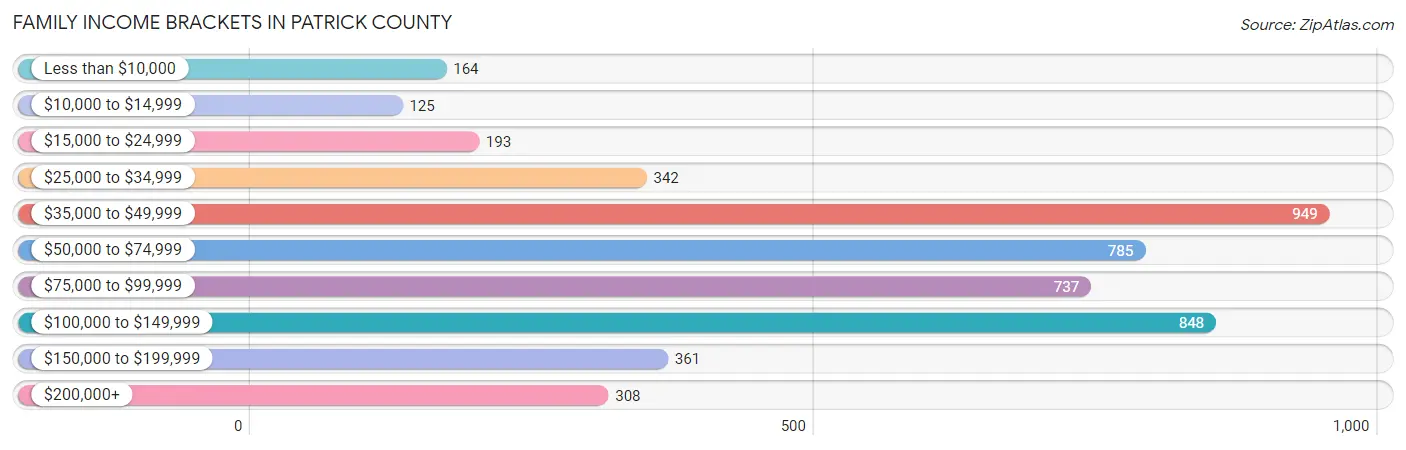
| Income Bracket | # Families | % Families |
| Less than $10,000 | 164 | 3.4% |
| $10,000 to $14,999 | 125 | 2.6% |
| $15,000 to $24,999 | 193 | 4.0% |
| $25,000 to $34,999 | 342 | 7.1% |
| $35,000 to $49,999 | 949 | 19.7% |
| $50,000 to $74,999 | 785 | 16.3% |
| $75,000 to $99,999 | 737 | 15.3% |
| $100,000 to $149,999 | 848 | 17.6% |
| $150,000 to $199,999 | 361 | 7.5% |
| $200,000+ | 308 | 6.4% |
Family Income by Famaliy Size in Patrick County
7+ person families (25 | 0.5%) account for the highest median family income in Patrick County with $165,662 per family, while 3-person families (1,001 | 20.8%) have the highest median income of $35,327 per family member.
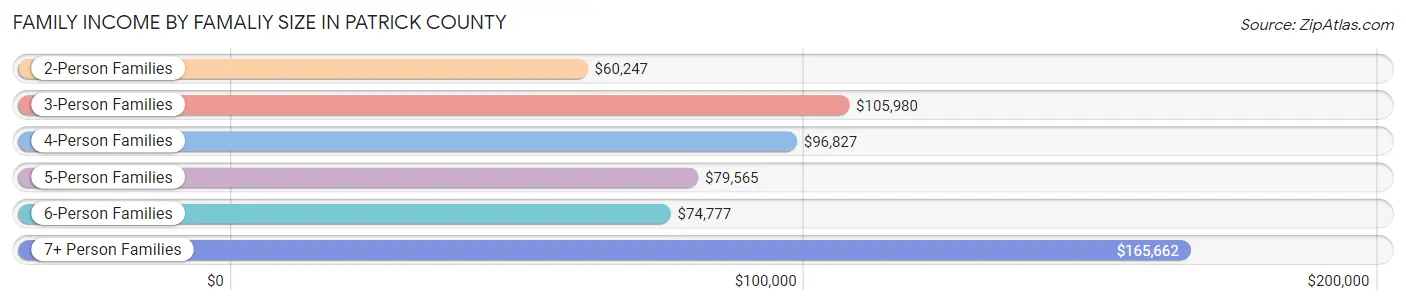
| Income Bracket | # Families | Median Income |
| 2-Person Families | 2,829 (58.7%) | $60,247 |
| 3-Person Families | 1,001 (20.8%) | $105,980 |
| 4-Person Families | 656 (13.6%) | $96,827 |
| 5-Person Families | 180 (3.7%) | $79,565 |
| 6-Person Families | 125 (2.6%) | $74,777 |
| 7+ Person Families | 25 (0.5%) | $165,662 |
| Total | 4,816 (100.0%) | $69,286 |
Family Income by Number of Earners in Patrick County
The median family income in Patrick County is $69,286, with families comprising 3+ earners (354) having the highest median family income of $129,833, while families with no earners (1,299) have the lowest median family income of $38,055, accounting for 7.3% and 27.0% of families, respectively.
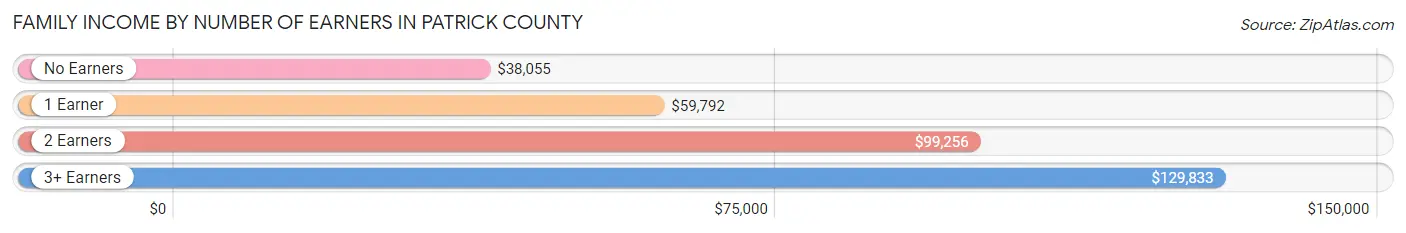
| Number of Earners | # Families | Median Income |
| No Earners | 1,299 (27.0%) | $38,055 |
| 1 Earner | 1,588 (33.0%) | $59,792 |
| 2 Earners | 1,575 (32.7%) | $99,256 |
| 3+ Earners | 354 (7.3%) | $129,833 |
| Total | 4,816 (100.0%) | $69,286 |
Household Income in Patrick County
Household Income Brackets in Patrick County
With 1,330 households falling in the category, the $35,000 to $49,999 income range is the most frequent in Patrick County, accounting for 17.1% of all households. In contrast, only 436 households (5.6%) fall into the $150,000 to $199,999 income bracket, making it the least populous group.
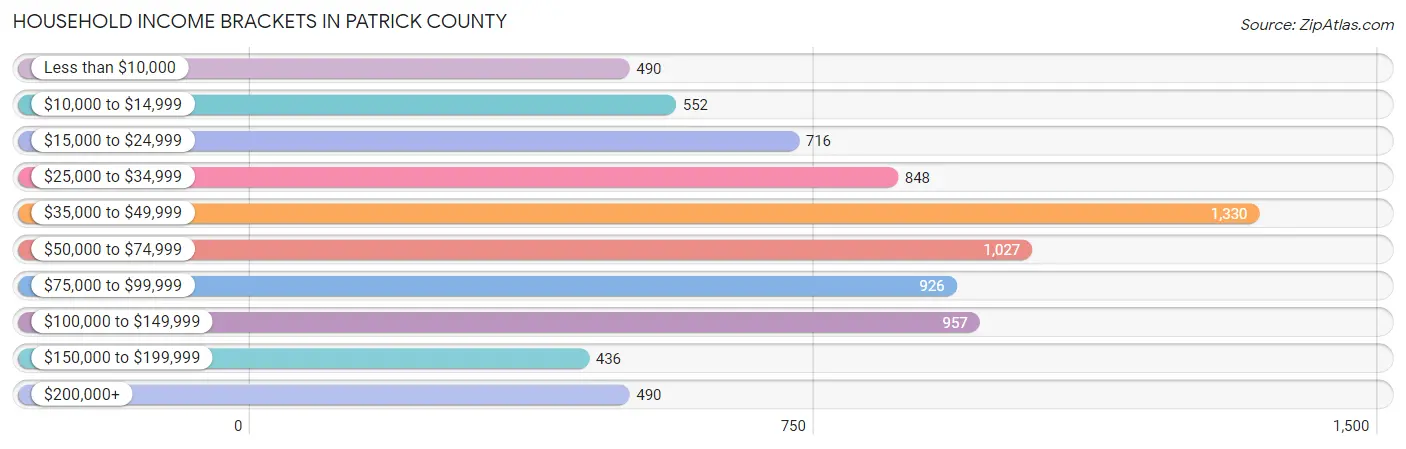
| Income Bracket | # Households | % Households |
| Less than $10,000 | 490 | 6.3% |
| $10,000 to $14,999 | 552 | 7.1% |
| $15,000 to $24,999 | 716 | 9.2% |
| $25,000 to $34,999 | 848 | 10.9% |
| $35,000 to $49,999 | 1,330 | 17.1% |
| $50,000 to $74,999 | 1,027 | 13.2% |
| $75,000 to $99,999 | 926 | 11.9% |
| $100,000 to $149,999 | 957 | 12.3% |
| $150,000 to $199,999 | 436 | 5.6% |
| $200,000+ | 490 | 6.3% |
Household Income by Householder Age in Patrick County
The median household income in Patrick County is $49,180, with the highest median household income of $74,071 found in the 25 to 44 years age bracket for the primary householder. A total of 1,354 households (17.4%) fall into this category. Meanwhile, the 15 to 24 years age bracket for the primary householder has the lowest median household income of $12,656, with 173 households (2.2%) in this group.
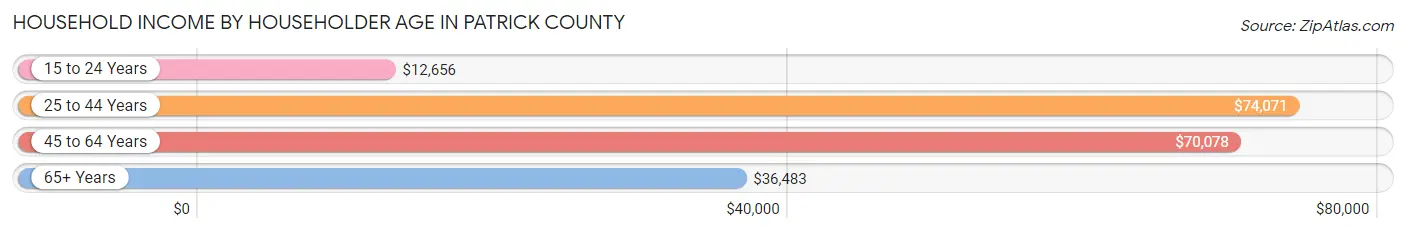
| Income Bracket | # Households | Median Income |
| 15 to 24 Years | 173 (2.2%) | $12,656 |
| 25 to 44 Years | 1,354 (17.4%) | $74,071 |
| 45 to 64 Years | 3,276 (42.1%) | $70,078 |
| 65+ Years | 2,976 (38.3%) | $36,483 |
| Total | 7,779 (100.0%) | $49,180 |
Poverty in Patrick County
Income Below Poverty by Sex and Age in Patrick County
With 9.9% poverty level for males and 13.0% for females among the residents of Patrick County, 5 year old males and 18 to 24 year old females are the most vulnerable to poverty, with 58 males (55.2%) and 139 females (27.9%) in their respective age groups living below the poverty level.
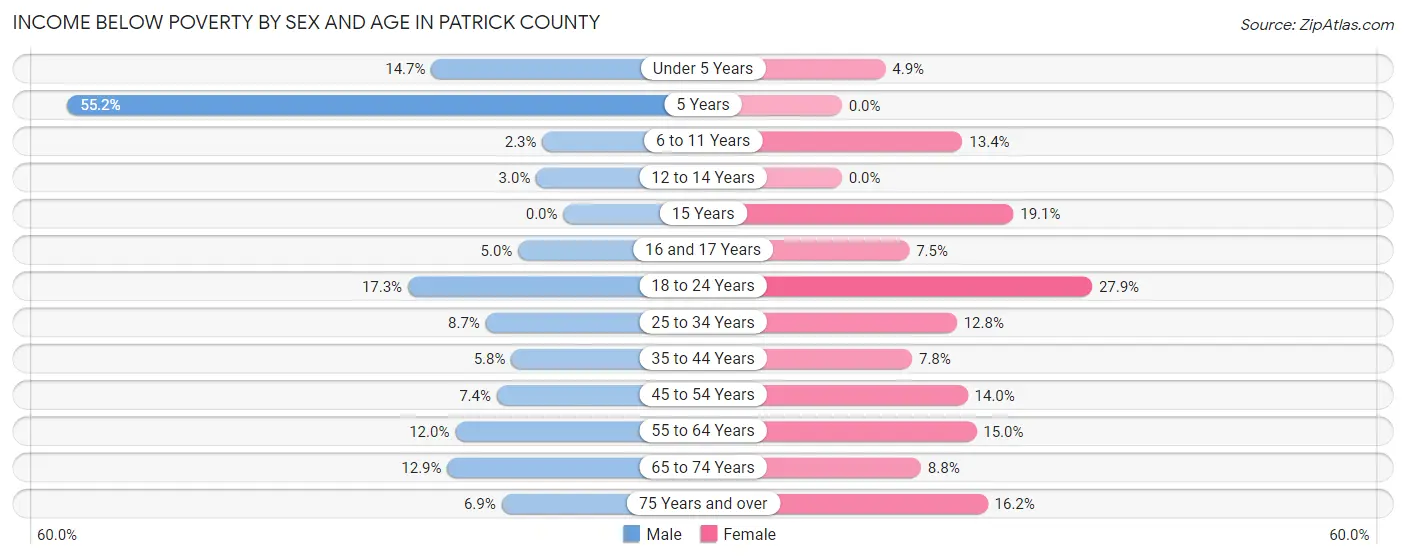
| Age Bracket | Male | Female |
| Under 5 Years | 60 (14.7%) | 18 (4.9%) |
| 5 Years | 58 (55.2%) | 0 (0.0%) |
| 6 to 11 Years | 12 (2.3%) | 83 (13.4%) |
| 12 to 14 Years | 9 (3.0%) | 0 (0.0%) |
| 15 Years | 0 (0.0%) | 17 (19.1%) |
| 16 and 17 Years | 10 (5.0%) | 13 (7.5%) |
| 18 to 24 Years | 90 (17.3%) | 139 (27.9%) |
| 25 to 34 Years | 68 (8.6%) | 91 (12.8%) |
| 35 to 44 Years | 48 (5.8%) | 63 (7.8%) |
| 45 to 54 Years | 97 (7.4%) | 175 (14.0%) |
| 55 to 64 Years | 180 (12.0%) | 217 (15.0%) |
| 65 to 74 Years | 166 (12.9%) | 115 (8.8%) |
| 75 Years and over | 57 (6.9%) | 178 (16.2%) |
| Total | 855 (9.9%) | 1,109 (13.0%) |
Income Above Poverty by Sex and Age in Patrick County
According to the poverty statistics in Patrick County, males aged 15 years and females aged 5 years are the age groups that are most secure financially, with 100.0% of males and 100.0% of females in these age groups living above the poverty line.
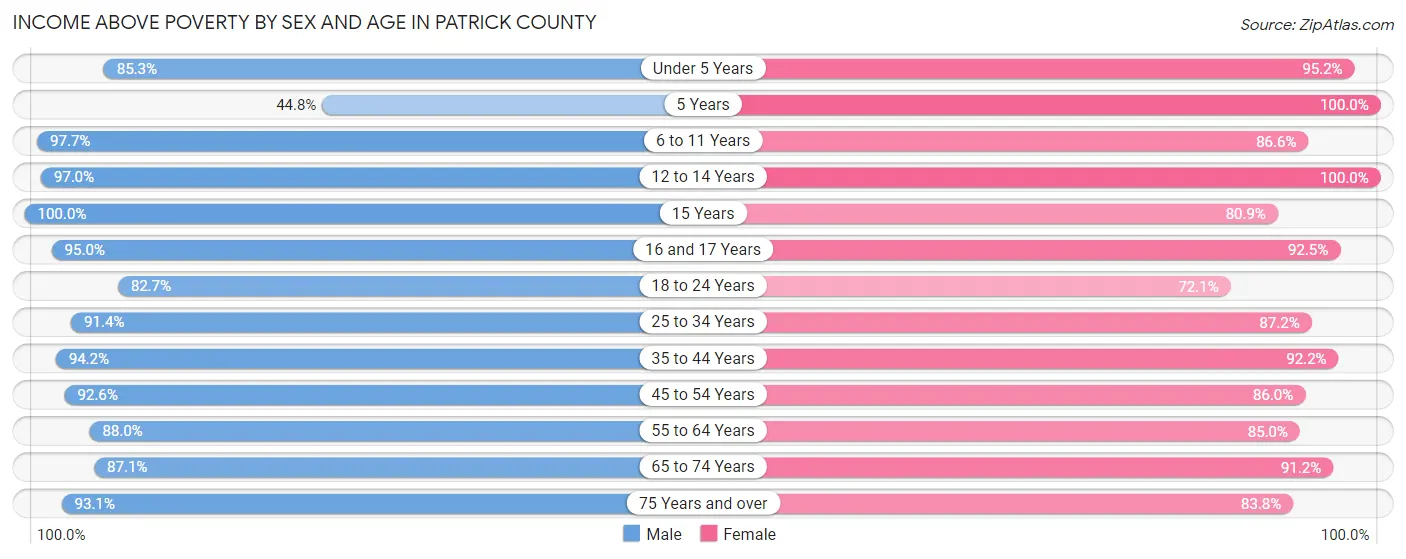
| Age Bracket | Male | Female |
| Under 5 Years | 348 (85.3%) | 353 (95.2%) |
| 5 Years | 47 (44.8%) | 61 (100.0%) |
| 6 to 11 Years | 501 (97.7%) | 535 (86.6%) |
| 12 to 14 Years | 289 (97.0%) | 93 (100.0%) |
| 15 Years | 94 (100.0%) | 72 (80.9%) |
| 16 and 17 Years | 189 (95.0%) | 160 (92.5%) |
| 18 to 24 Years | 430 (82.7%) | 360 (72.1%) |
| 25 to 34 Years | 718 (91.3%) | 620 (87.2%) |
| 35 to 44 Years | 779 (94.2%) | 743 (92.2%) |
| 45 to 54 Years | 1,212 (92.6%) | 1,074 (86.0%) |
| 55 to 64 Years | 1,315 (88.0%) | 1,232 (85.0%) |
| 65 to 74 Years | 1,119 (87.1%) | 1,191 (91.2%) |
| 75 Years and over | 772 (93.1%) | 918 (83.8%) |
| Total | 7,813 (90.1%) | 7,412 (87.0%) |
Income Below Poverty Among Married-Couple Families in Patrick County
The poverty statistics for married-couple families in Patrick County show that 6.5% or 254 of the total 3,915 families live below the poverty line. Families with 1 or 2 children have the highest poverty rate of 9.0%, comprising of 99 families. On the other hand, families with 3 or 4 children have the lowest poverty rate of 0.0%, which includes 0 families.
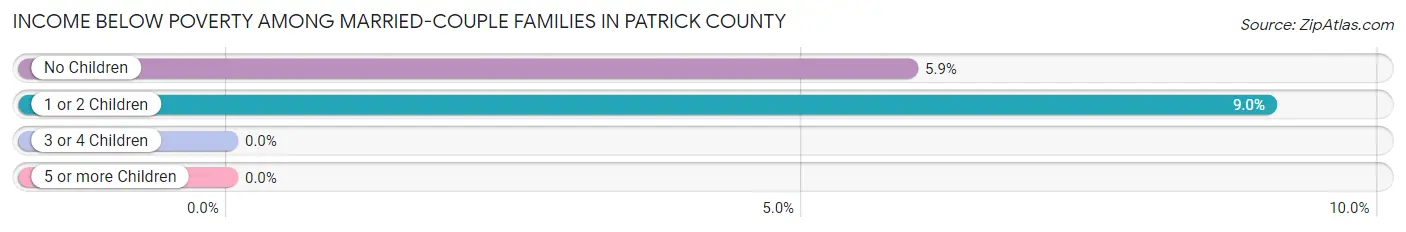
| Children | Above Poverty | Below Poverty |
| No Children | 2,463 (94.1%) | 155 (5.9%) |
| 1 or 2 Children | 996 (91.0%) | 99 (9.0%) |
| 3 or 4 Children | 202 (100.0%) | 0 (0.0%) |
| 5 or more Children | 0 (0.0%) | 0 (0.0%) |
| Total | 3,661 (93.5%) | 254 (6.5%) |
Income Below Poverty Among Single-Parent Households in Patrick County
According to the poverty data in Patrick County, 5.8% or 15 single-father households and 19.3% or 124 single-mother households are living below the poverty line. Among single-father households, those with 1 or 2 children have the highest poverty rate, with 12 households (19.4%) experiencing poverty. Likewise, among single-mother households, those with 3 or 4 children have the highest poverty rate, with 15 households (50.0%) falling below the poverty line.
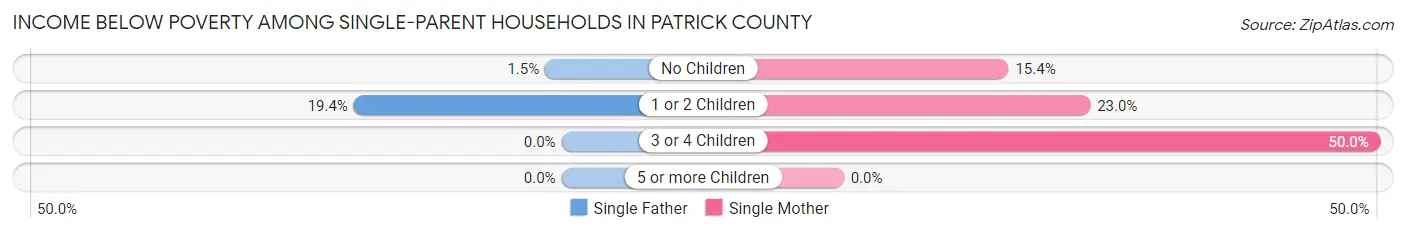
| Children | Single Father | Single Mother |
| No Children | 3 (1.5%) | 64 (15.3%) |
| 1 or 2 Children | 12 (19.4%) | 45 (23.0%) |
| 3 or 4 Children | 0 (0.0%) | 15 (50.0%) |
| 5 or more Children | 0 (0.0%) | 0 (0.0%) |
| Total | 15 (5.8%) | 124 (19.3%) |
Income Below Poverty Among Married-Couple vs Single-Parent Households in Patrick County
The poverty data for Patrick County shows that 254 of the married-couple family households (6.5%) and 139 of the single-parent households (15.4%) are living below the poverty level. Within the married-couple family households, those with 1 or 2 children have the highest poverty rate, with 99 households (9.0%) falling below the poverty line. Among the single-parent households, those with 3 or 4 children have the highest poverty rate, with 15 household (50.0%) living below poverty.
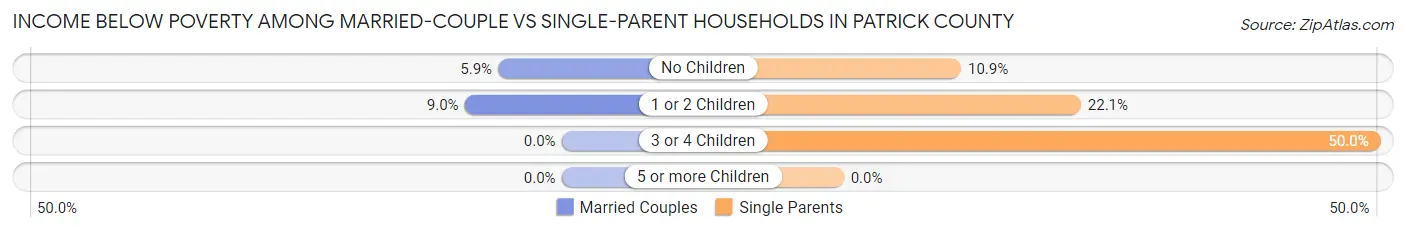
| Children | Married-Couple Families | Single-Parent Households |
| No Children | 155 (5.9%) | 67 (10.9%) |
| 1 or 2 Children | 99 (9.0%) | 57 (22.1%) |
| 3 or 4 Children | 0 (0.0%) | 15 (50.0%) |
| 5 or more Children | 0 (0.0%) | 0 (0.0%) |
| Total | 254 (6.5%) | 139 (15.4%) |
Race in Patrick County
The most populous races in Patrick County are White / Caucasian (16,087 | 91.1%), Black / African American (993 | 5.6%), and Hispanic or Latino (577 | 3.3%).
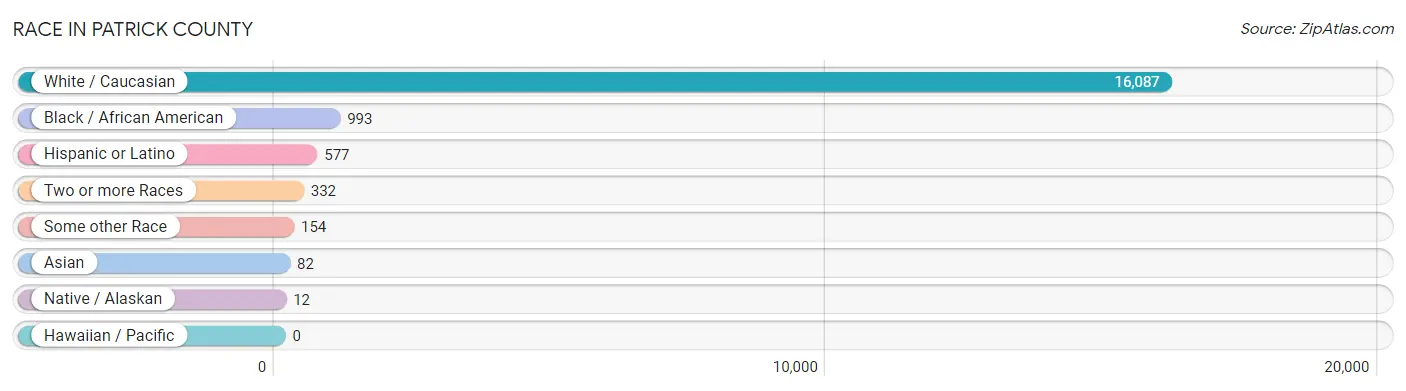
| Race | # Population | % Population |
| Asian | 82 | 0.5% |
| Black / African American | 993 | 5.6% |
| Hawaiian / Pacific | 0 | 0.0% |
| Hispanic or Latino | 577 | 3.3% |
| Native / Alaskan | 12 | 0.1% |
| White / Caucasian | 16,087 | 91.1% |
| Two or more Races | 332 | 1.9% |
| Some other Race | 154 | 0.9% |
| Total | 17,660 | 100.0% |
Ancestry in Patrick County
The most populous ancestries reported in Patrick County are American (6,510 | 36.9%), English (2,097 | 11.9%), German (1,409 | 8.0%), Irish (1,088 | 6.2%), and Scotch-Irish (379 | 2.1%), together accounting for 65.0% of all Patrick County residents.
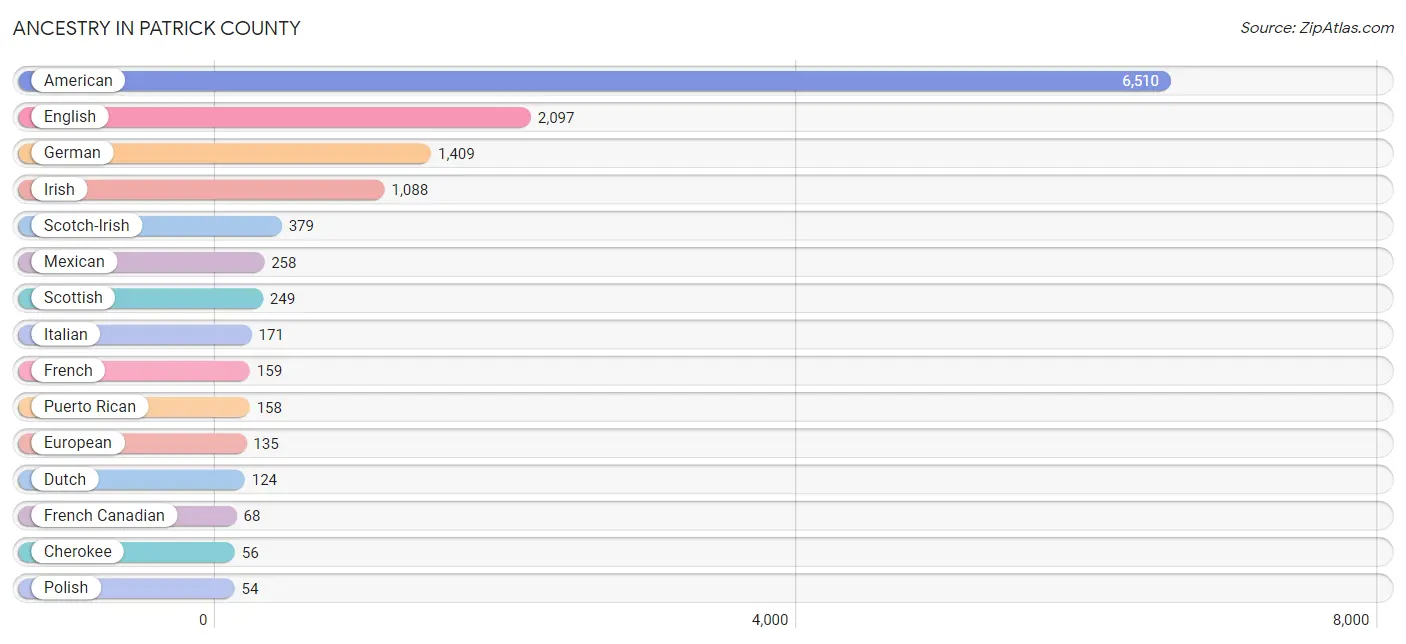
| Ancestry | # Population | % Population |
| American | 6,510 | 36.9% |
| Arab | 1 | 0.0% |
| Bhutanese | 5 | 0.0% |
| Blackfeet | 3 | 0.0% |
| British | 31 | 0.2% |
| Canadian | 35 | 0.2% |
| Central American | 48 | 0.3% |
| Cherokee | 56 | 0.3% |
| Colombian | 15 | 0.1% |
| Czech | 27 | 0.2% |
| Dutch | 124 | 0.7% |
| Eastern European | 22 | 0.1% |
| English | 2,097 | 11.9% |
| European | 135 | 0.8% |
| French | 159 | 0.9% |
| French Canadian | 68 | 0.4% |
| German | 1,409 | 8.0% |
| Guatemalan | 33 | 0.2% |
| Honduran | 2 | 0.0% |
| Indian (Asian) | 38 | 0.2% |
| Iraqi | 1 | 0.0% |
| Irish | 1,088 | 6.2% |
| Italian | 171 | 1.0% |
| Jamaican | 20 | 0.1% |
| Lithuanian | 13 | 0.1% |
| Mexican | 258 | 1.5% |
| Northern European | 12 | 0.1% |
| Norwegian | 21 | 0.1% |
| Polish | 54 | 0.3% |
| Portuguese | 7 | 0.0% |
| Puerto Rican | 158 | 0.9% |
| Russian | 4 | 0.0% |
| Salvadoran | 13 | 0.1% |
| Scandinavian | 25 | 0.1% |
| Scotch-Irish | 379 | 2.1% |
| Scottish | 249 | 1.4% |
| South American | 41 | 0.2% |
| Spaniard | 21 | 0.1% |
| Sri Lankan | 17 | 0.1% |
| Subsaharan African | 2 | 0.0% |
| Swedish | 22 | 0.1% |
| Swiss | 11 | 0.1% |
| Thai | 14 | 0.1% |
| Uruguayan | 26 | 0.2% |
| Welsh | 50 | 0.3% | View All 45 Rows |
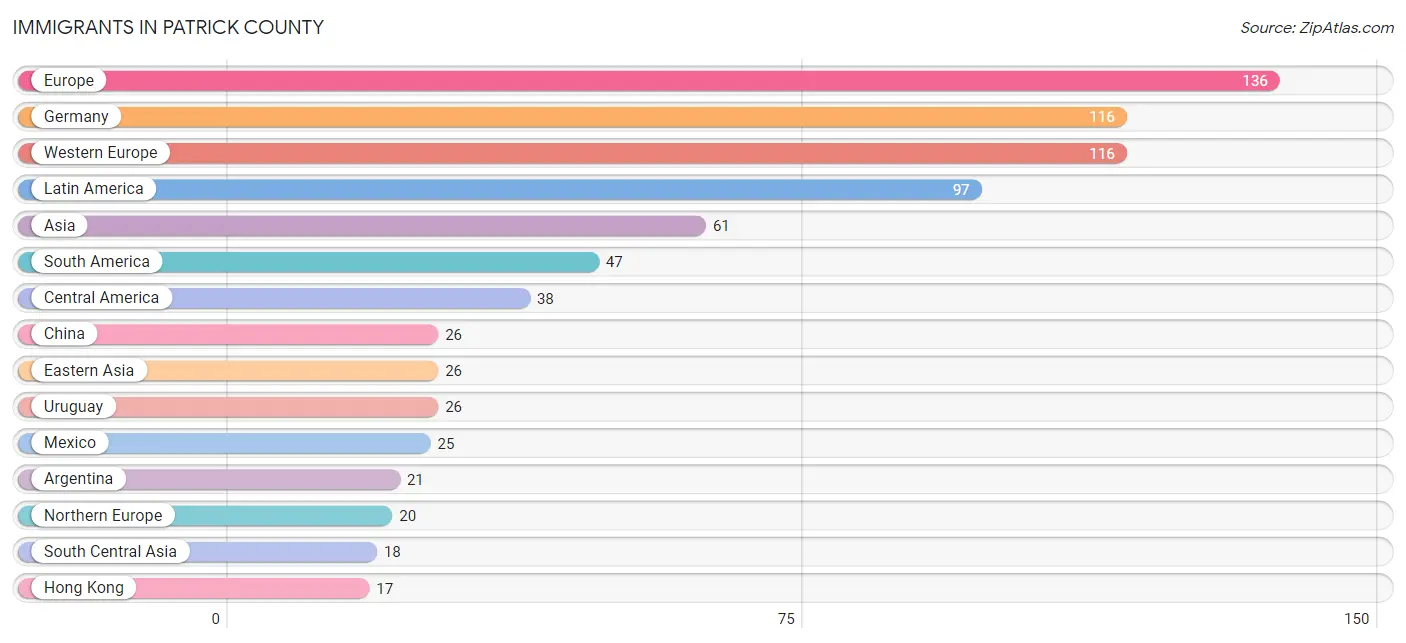
Immigrants in Patrick County
The most numerous immigrant groups reported in Patrick County came from Europe (136 | 0.8%), Germany (116 | 0.7%), Western Europe (116 | 0.7%), Latin America (97 | 0.5%), and Asia (61 | 0.4%), together accounting for 3.0% of all Patrick County residents.
| Immigration Origin | # Population | % Population |
| Africa | 9 | 0.1% |
| Argentina | 21 | 0.1% |
| Asia | 61 | 0.4% |
| Caribbean | 12 | 0.1% |
| Central America | 38 | 0.2% |
| China | 26 | 0.2% |
| Congo | 4 | 0.0% |
| Eastern Asia | 26 | 0.2% |
| El Salvador | 13 | 0.1% |
| Europe | 136 | 0.8% |
| Germany | 116 | 0.7% |
| Hong Kong | 17 | 0.1% |
| India | 10 | 0.1% |
| Jamaica | 12 | 0.1% |
| Latin America | 97 | 0.5% |
| Mexico | 25 | 0.1% |
| Middle Africa | 9 | 0.1% |
| Northern Europe | 20 | 0.1% |
| Pakistan | 8 | 0.1% |
| South America | 47 | 0.3% |
| South Central Asia | 18 | 0.1% |
| South Eastern Asia | 17 | 0.1% |
| Taiwan | 9 | 0.1% |
| Uruguay | 26 | 0.2% |
| Vietnam | 17 | 0.1% |
| Western Europe | 116 | 0.7% | View All 26 Rows |
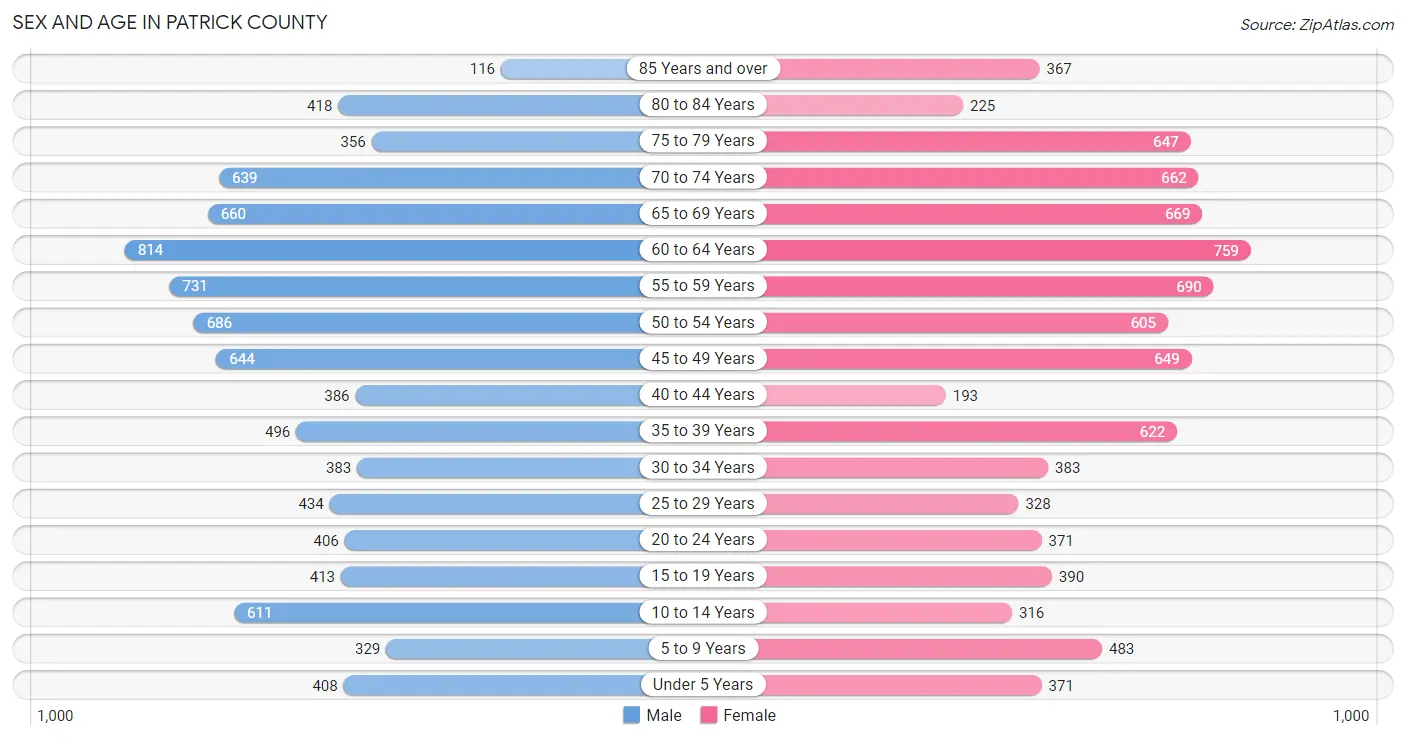
Sex and Age in Patrick County
Sex and Age in Patrick County
The most populous age groups in Patrick County are 60 to 64 Years (814 | 9.1%) for men and 60 to 64 Years (759 | 8.7%) for women.
| Age Bracket | Male | Female |
| Under 5 Years | 408 (4.6%) | 371 (4.3%) |
| 5 to 9 Years | 329 (3.7%) | 483 (5.5%) |
| 10 to 14 Years | 611 (6.8%) | 316 (3.6%) |
| 15 to 19 Years | 413 (4.6%) | 390 (4.5%) |
| 20 to 24 Years | 406 (4.5%) | 371 (4.3%) |
| 25 to 29 Years | 434 (4.9%) | 328 (3.8%) |
| 30 to 34 Years | 383 (4.3%) | 383 (4.4%) |
| 35 to 39 Years | 496 (5.6%) | 622 (7.1%) |
| 40 to 44 Years | 386 (4.3%) | 193 (2.2%) |
| 45 to 49 Years | 644 (7.2%) | 649 (7.4%) |
| 50 to 54 Years | 686 (7.7%) | 605 (6.9%) |
| 55 to 59 Years | 731 (8.2%) | 690 (7.9%) |
| 60 to 64 Years | 814 (9.1%) | 759 (8.7%) |
| 65 to 69 Years | 660 (7.4%) | 669 (7.7%) |
| 70 to 74 Years | 639 (7.2%) | 662 (7.6%) |
| 75 to 79 Years | 356 (4.0%) | 647 (7.4%) |
| 80 to 84 Years | 418 (4.7%) | 225 (2.6%) |
| 85 Years and over | 116 (1.3%) | 367 (4.2%) |
| Total | 8,930 (100.0%) | 8,730 (100.0%) |
Families and Households in Patrick County
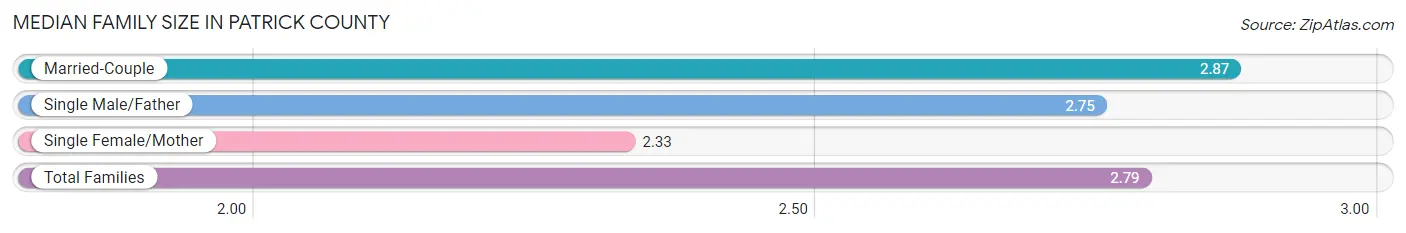
Median Family Size in Patrick County
The median family size in Patrick County is 2.79 persons per family, with married-couple families (3,915 | 81.3%) accounting for the largest median family size of 2.87 persons per family. On the other hand, single female/mother families (643 | 13.4%) represent the smallest median family size with 2.33 persons per family.
| Family Type | # Families | Family Size |
| Married-Couple | 3,915 (81.3%) | 2.87 |
| Single Male/Father | 258 (5.4%) | 2.75 |
| Single Female/Mother | 643 (13.4%) | 2.33 |
| Total Families | 4,816 (100.0%) | 2.79 |
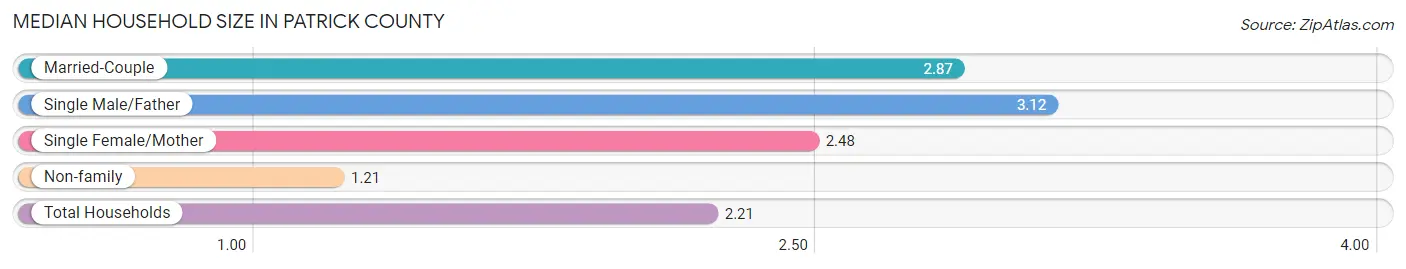
Median Household Size in Patrick County
The median household size in Patrick County is 2.21 persons per household, with single male/father households (258 | 3.3%) accounting for the largest median household size of 3.12 persons per household. non-family households (2,963 | 38.1%) represent the smallest median household size with 1.21 persons per household.
| Household Type | # Households | Household Size |
| Married-Couple | 3,915 (50.3%) | 2.87 |
| Single Male/Father | 258 (3.3%) | 3.12 |
| Single Female/Mother | 643 (8.3%) | 2.48 |
| Non-family | 2,963 (38.1%) | 1.21 |
| Total Households | 7,779 (100.0%) | 2.21 |
Household Size by Marriage Status in Patrick County
Out of a total of 7,779 households in Patrick County, 4,816 (61.9%) are family households, while 2,963 (38.1%) are nonfamily households. The most numerous type of family households are 2-person households, comprising 2,694, and the most common type of nonfamily households are 1-person households, comprising 2,393.
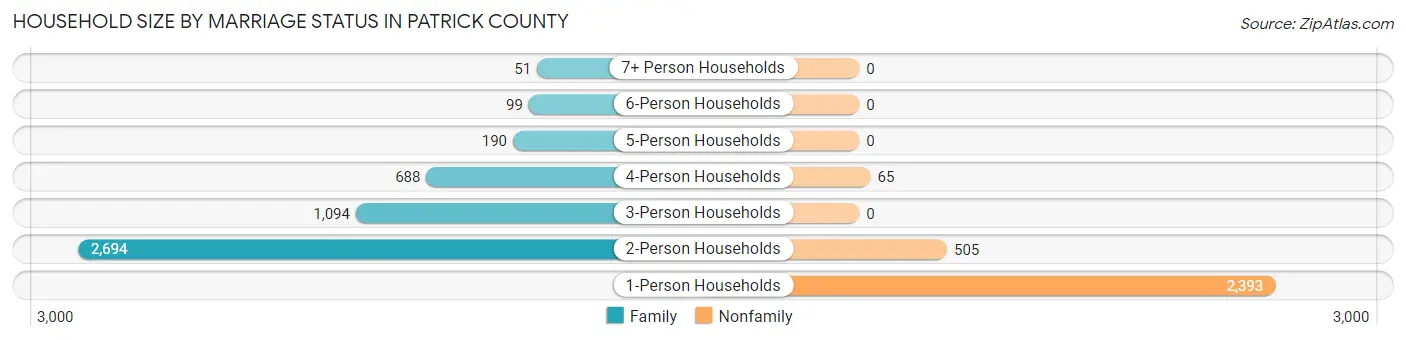
| Household Size | Family Households | Nonfamily Households |
| 1-Person Households | - | 2,393 (30.8%) |
| 2-Person Households | 2,694 (34.6%) | 505 (6.5%) |
| 3-Person Households | 1,094 (14.1%) | 0 (0.0%) |
| 4-Person Households | 688 (8.8%) | 65 (0.8%) |
| 5-Person Households | 190 (2.4%) | 0 (0.0%) |
| 6-Person Households | 99 (1.3%) | 0 (0.0%) |
| 7+ Person Households | 51 (0.7%) | 0 (0.0%) |
| Total | 4,816 (61.9%) | 2,963 (38.1%) |
Female Fertility in Patrick County
Fertility by Age in Patrick County
Average fertility rate in Patrick County is 54.0 births per 1,000 women. Women in the age bracket of 20 to 34 years have the highest fertility rate with 116.0 births per 1,000 women. Women in the age bracket of 20 to 34 years acount for 76.7% of all women with births.
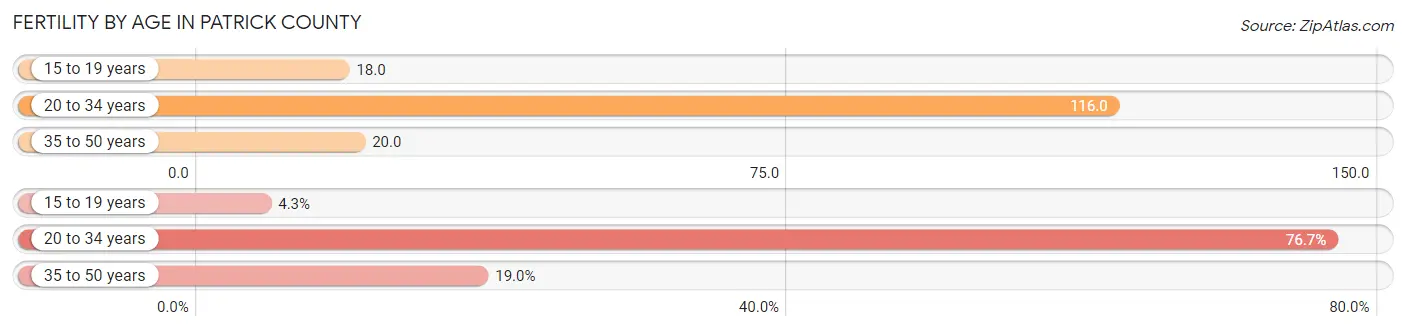
| Age Bracket | Women with Births | Births / 1,000 Women |
| 15 to 19 years | 7 (4.3%) | 18.0 |
| 20 to 34 years | 125 (76.7%) | 116.0 |
| 35 to 50 years | 31 (19.0%) | 20.0 |
| Total | 163 (100.0%) | 54.0 |
Fertility by Age by Marriage Status in Patrick County
78.5% of women with births (163) in Patrick County are married. The highest percentage of unmarried women with births falls into 15 to 19 years age bracket with 100.0% of them unmarried at the time of birth, while the lowest percentage of unmarried women with births belong to 35 to 50 years age bracket with 0.0% of them unmarried.
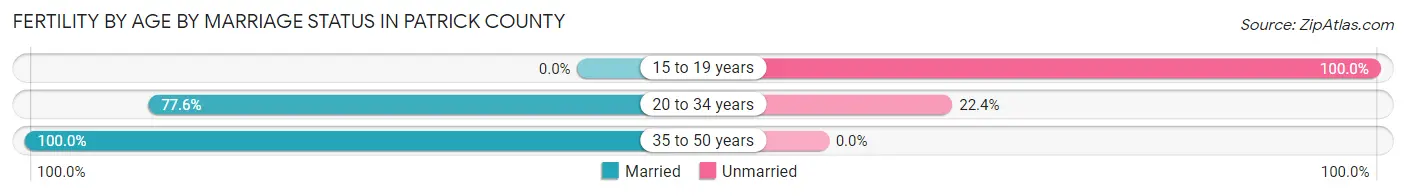
| Age Bracket | Married | Unmarried |
| 15 to 19 years | 0 (0.0%) | 7 (100.0%) |
| 20 to 34 years | 97 (77.6%) | 28 (22.4%) |
| 35 to 50 years | 31 (100.0%) | 0 (0.0%) |
| Total | 128 (78.5%) | 35 (21.5%) |
Fertility by Education in Patrick County
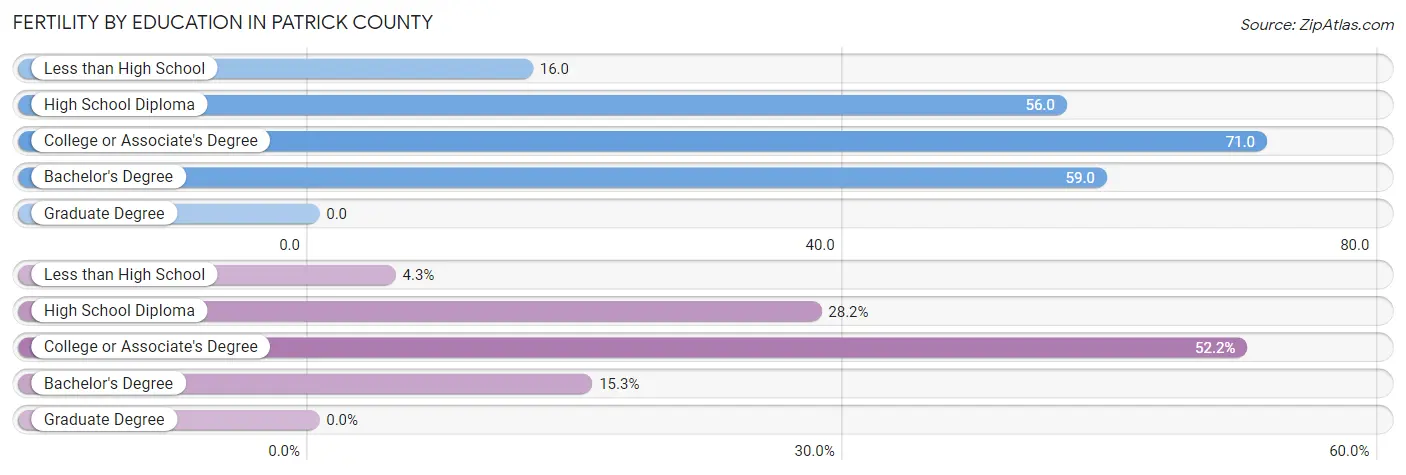
| Educational Attainment | Women with Births | Births / 1,000 Women |
| Less than High School | 7 (4.3%) | 16.0 |
| High School Diploma | 46 (28.2%) | 56.0 |
| College or Associate's Degree | 85 (52.1%) | 71.0 |
| Bachelor's Degree | 25 (15.3%) | 59.0 |
| Graduate Degree | 0 (0.0%) | 0.0 |
| Total | 163 (100.0%) | 54.0 |
Fertility by Education by Marriage Status in Patrick County
21.5% of women with births in Patrick County are unmarried. Women with the educational attainment of bachelor's degree are most likely to be married with 100.0% of them married at childbirth, while women with the educational attainment of less than high school are least likely to be married with 100.0% of them unmarried at childbirth.
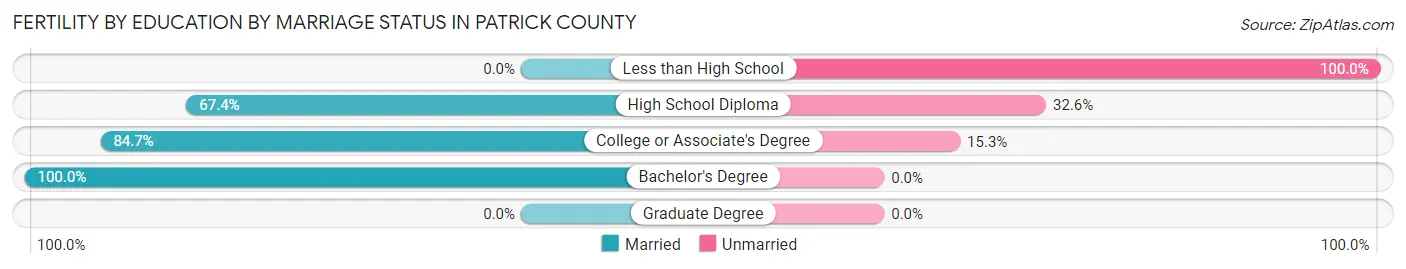
| Educational Attainment | Married | Unmarried |
| Less than High School | 0 (0.0%) | 7 (100.0%) |
| High School Diploma | 31 (67.4%) | 15 (32.6%) |
| College or Associate's Degree | 72 (84.7%) | 13 (15.3%) |
| Bachelor's Degree | 25 (100.0%) | 0 (0.0%) |
| Graduate Degree | 0 (0.0%) | 0 (0.0%) |
| Total | 128 (78.5%) | 35 (21.5%) |
Employment Characteristics in Patrick County
Employment by Class of Employer in Patrick County
Among the 7,210 employed individuals in Patrick County, private company employees (5,006 | 69.4%), local government employees (622 | 8.6%), and self-employed (not incorporated) (551 | 7.6%) make up the most common classes of employment.
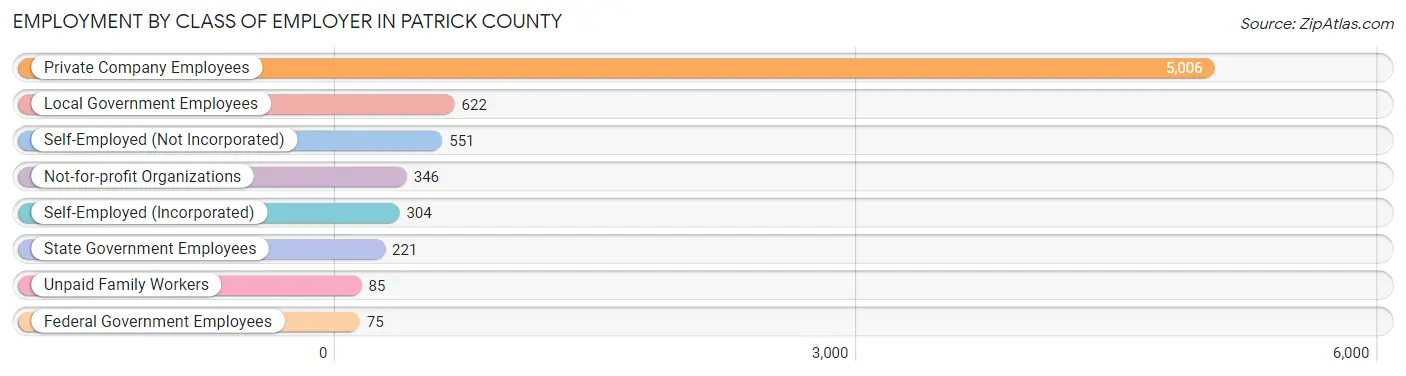
| Employer Class | # Employees | % Employees |
| Private Company Employees | 5,006 | 69.4% |
| Self-Employed (Incorporated) | 304 | 4.2% |
| Self-Employed (Not Incorporated) | 551 | 7.6% |
| Not-for-profit Organizations | 346 | 4.8% |
| Local Government Employees | 622 | 8.6% |
| State Government Employees | 221 | 3.1% |
| Federal Government Employees | 75 | 1.0% |
| Unpaid Family Workers | 85 | 1.2% |
| Total | 7,210 | 100.0% |
Employment Status by Age in Patrick County
According to the labor force statistics for Patrick County, out of the total population over 16 years of age (14,959), 50.2% or 7,509 individuals are in the labor force, with 2.3% or 173 of them unemployed. The age group with the highest labor force participation rate is 35 to 44 years, with 80.4% or 1,364 individuals in the labor force. Within the labor force, the 16 to 19 years age range has the highest percentage of unemployed individuals, with 20.3% or 28 of them being unemployed.
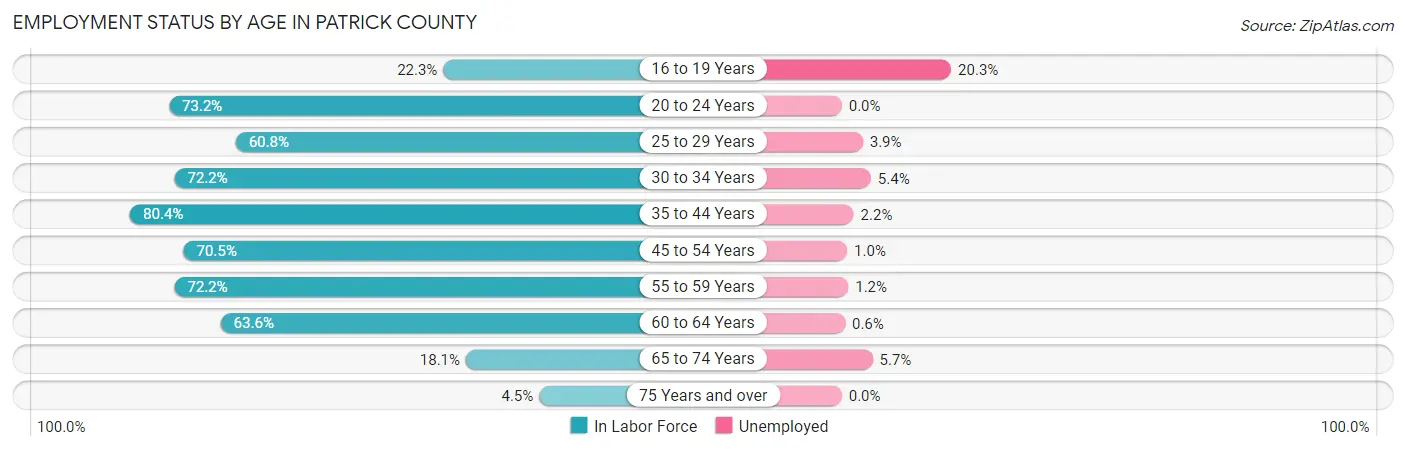
| Age Bracket | In Labor Force | Unemployed |
| 16 to 19 Years | 138 (22.3%) | 28 (20.3%) |
| 20 to 24 Years | 569 (73.2%) | 0 (0.0%) |
| 25 to 29 Years | 463 (60.8%) | 18 (3.9%) |
| 30 to 34 Years | 553 (72.2%) | 30 (5.4%) |
| 35 to 44 Years | 1,364 (80.4%) | 30 (2.2%) |
| 45 to 54 Years | 1,822 (70.5%) | 18 (1.0%) |
| 55 to 59 Years | 1,026 (72.2%) | 12 (1.2%) |
| 60 to 64 Years | 1,000 (63.6%) | 6 (0.6%) |
| 65 to 74 Years | 476 (18.1%) | 27 (5.7%) |
| 75 Years and over | 96 (4.5%) | 0 (0.0%) |
| Total | 7,509 (50.2%) | 173 (2.3%) |
Employment Status by Educational Attainment in Patrick County
According to labor force statistics for Patrick County, 70.8% of individuals (6,233) out of the total population between 25 and 64 years of age (8,803) are in the labor force, with 1.8% or 112 of them being unemployed. The group with the highest labor force participation rate are those with the educational attainment of bachelor's degree or higher, with 83.8% or 1,131 individuals in the labor force. Within the labor force, individuals with high school diploma education have the highest percentage of unemployment, with 4.2% or 90 of them being unemployed.
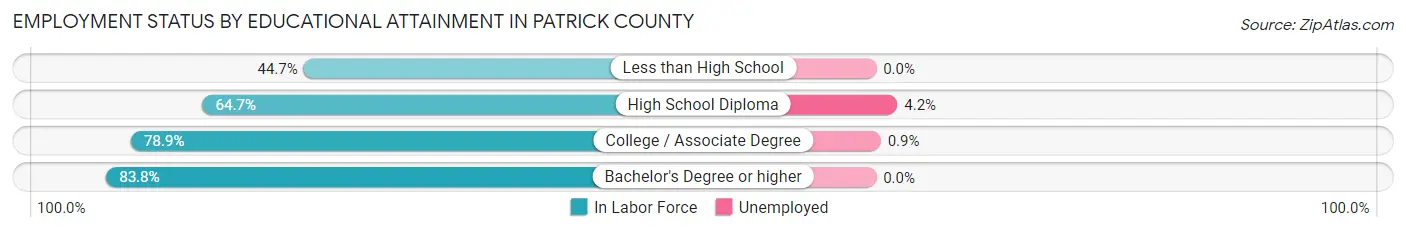
| Educational Attainment | In Labor Force | Unemployed |
| Less than High School | 407 (44.7%) | 0 (0.0%) |
| High School Diploma | 2,147 (64.7%) | 139 (4.2%) |
| College / Associate Degree | 2,543 (78.9%) | 29 (0.9%) |
| Bachelor's Degree or higher | 1,131 (83.8%) | 0 (0.0%) |
| Total | 6,233 (70.8%) | 158 (1.8%) |
Employment Occupations by Sex in Patrick County
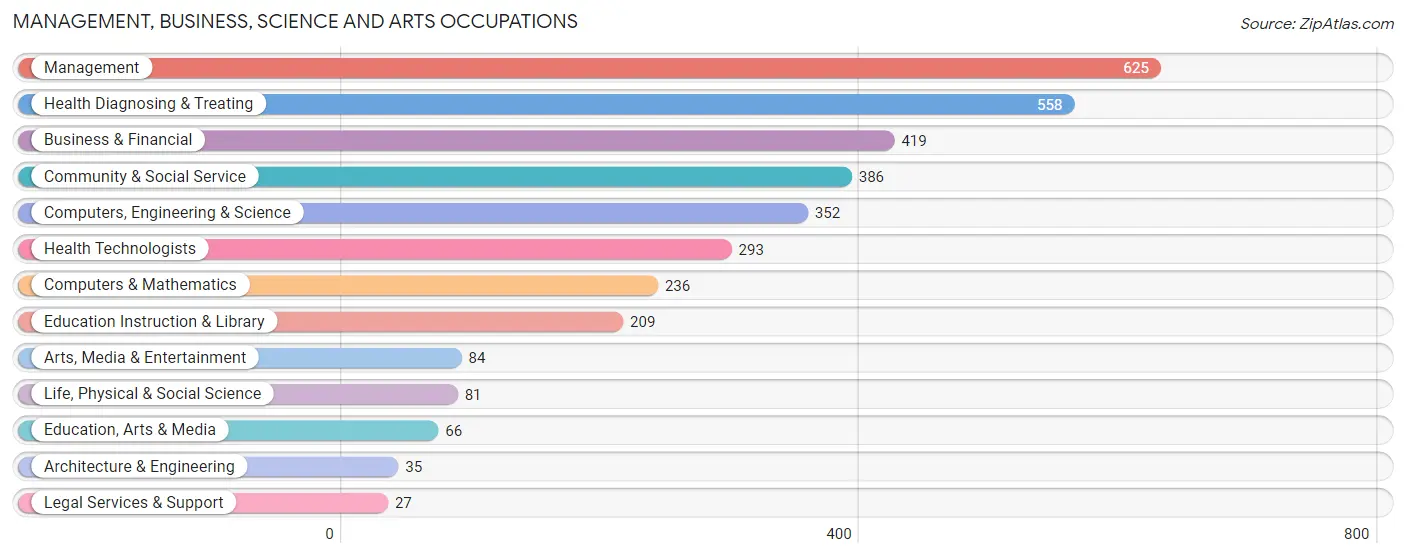
Management, Business, Science and Arts Occupations
The most common Management, Business, Science and Arts occupations in Patrick County are Management (625 | 8.5%), Health Diagnosing & Treating (558 | 7.6%), Business & Financial (419 | 5.7%), Community & Social Service (386 | 5.3%), and Computers, Engineering & Science (352 | 4.8%).
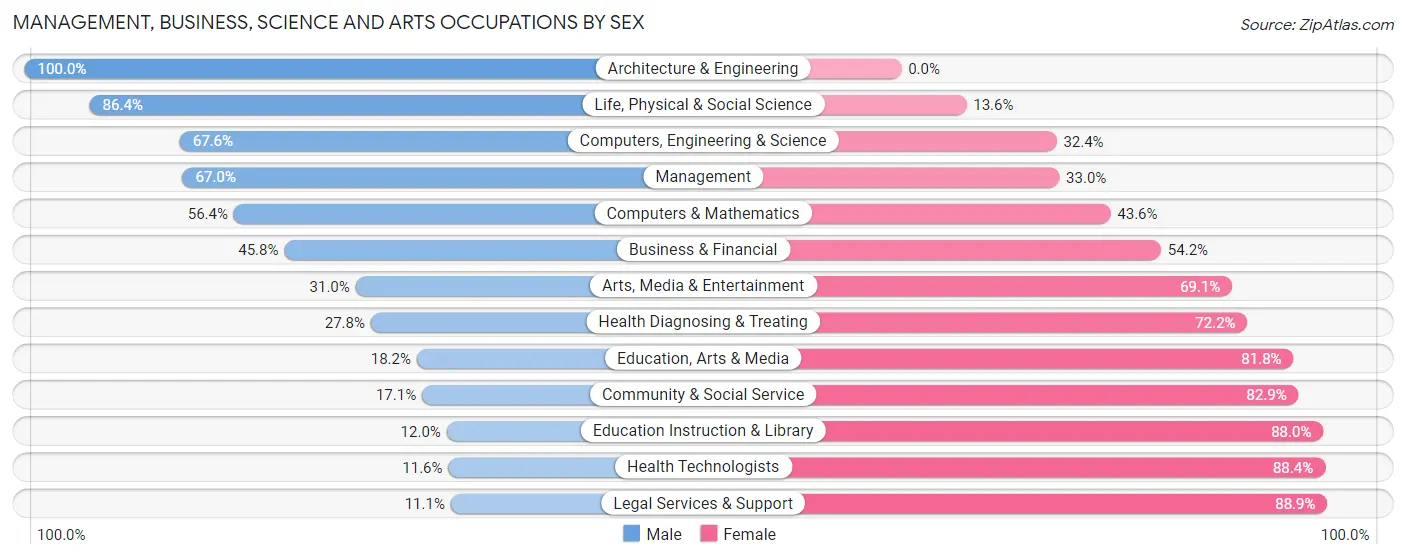
Management, Business, Science and Arts Occupations by Sex
Within the Management, Business, Science and Arts occupations in Patrick County, the most male-oriented occupations are Architecture & Engineering (100.0%), Life, Physical & Social Science (86.4%), and Computers, Engineering & Science (67.6%), while the most female-oriented occupations are Legal Services & Support (88.9%), Health Technologists (88.4%), and Education Instruction & Library (88.0%).
| Occupation | Male | Female |
| Management | 419 (67.0%) | 206 (33.0%) |
| Business & Financial | 192 (45.8%) | 227 (54.2%) |
| Computers, Engineering & Science | 238 (67.6%) | 114 (32.4%) |
| Computers & Mathematics | 133 (56.4%) | 103 (43.6%) |
| Architecture & Engineering | 35 (100.0%) | 0 (0.0%) |
| Life, Physical & Social Science | 70 (86.4%) | 11 (13.6%) |
| Community & Social Service | 66 (17.1%) | 320 (82.9%) |
| Education, Arts & Media | 12 (18.2%) | 54 (81.8%) |
| Legal Services & Support | 3 (11.1%) | 24 (88.9%) |
| Education Instruction & Library | 25 (12.0%) | 184 (88.0%) |
| Arts, Media & Entertainment | 26 (30.9%) | 58 (69.1%) |
| Health Diagnosing & Treating | 155 (27.8%) | 403 (72.2%) |
| Health Technologists | 34 (11.6%) | 259 (88.4%) |
| Total (Category) | 1,070 (45.7%) | 1,270 (54.3%) |
| Total (Overall) | 4,034 (55.0%) | 3,306 (45.0%) |
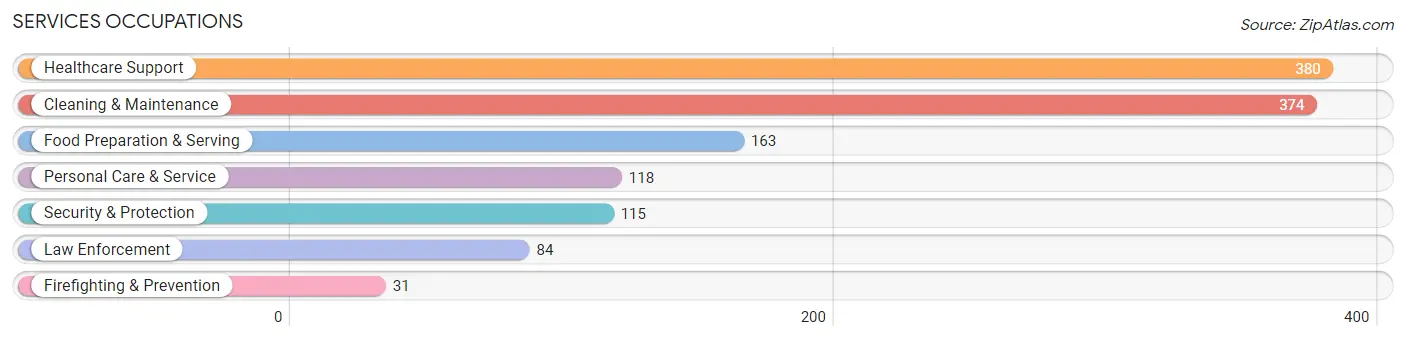
Services Occupations
The most common Services occupations in Patrick County are Healthcare Support (380 | 5.2%), Cleaning & Maintenance (374 | 5.1%), Food Preparation & Serving (163 | 2.2%), Personal Care & Service (118 | 1.6%), and Security & Protection (115 | 1.6%).
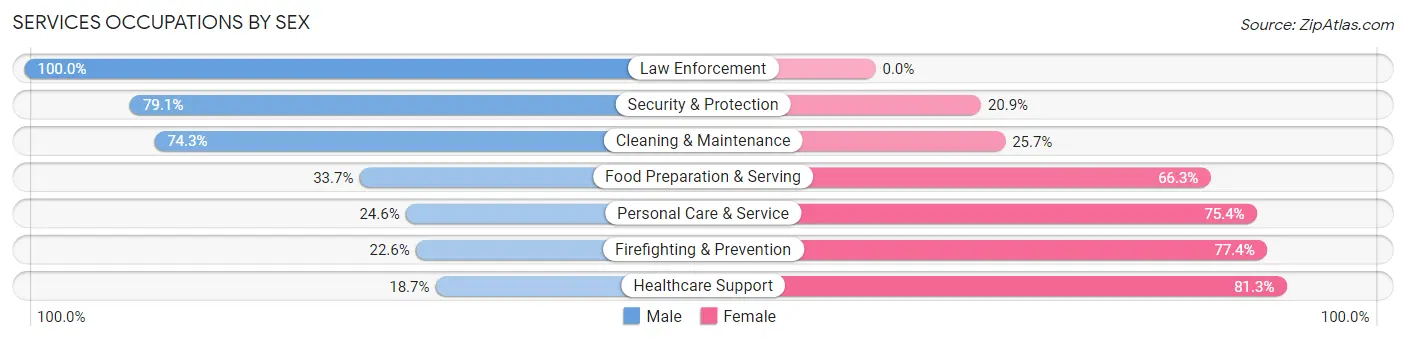
Services Occupations by Sex
Within the Services occupations in Patrick County, the most male-oriented occupations are Law Enforcement (100.0%), Security & Protection (79.1%), and Cleaning & Maintenance (74.3%), while the most female-oriented occupations are Healthcare Support (81.3%), Firefighting & Prevention (77.4%), and Personal Care & Service (75.4%).
| Occupation | Male | Female |
| Healthcare Support | 71 (18.7%) | 309 (81.3%) |
| Security & Protection | 91 (79.1%) | 24 (20.9%) |
| Firefighting & Prevention | 7 (22.6%) | 24 (77.4%) |
| Law Enforcement | 84 (100.0%) | 0 (0.0%) |
| Food Preparation & Serving | 55 (33.7%) | 108 (66.3%) |
| Cleaning & Maintenance | 278 (74.3%) | 96 (25.7%) |
| Personal Care & Service | 29 (24.6%) | 89 (75.4%) |
| Total (Category) | 524 (45.6%) | 626 (54.4%) |
| Total (Overall) | 4,034 (55.0%) | 3,306 (45.0%) |
Sales and Office Occupations
The most common Sales and Office occupations in Patrick County are Office & Administration (705 | 9.6%), and Sales & Related (565 | 7.7%).

Sales and Office Occupations by Sex

| Occupation | Male | Female |
| Sales & Related | 136 (24.1%) | 429 (75.9%) |
| Office & Administration | 124 (17.6%) | 581 (82.4%) |
| Total (Category) | 260 (20.5%) | 1,010 (79.5%) |
| Total (Overall) | 4,034 (55.0%) | 3,306 (45.0%) |
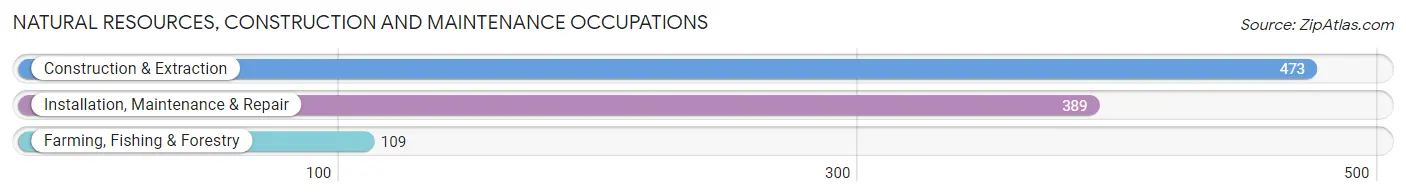
Natural Resources, Construction and Maintenance Occupations
The most common Natural Resources, Construction and Maintenance occupations in Patrick County are Construction & Extraction (473 | 6.4%), Installation, Maintenance & Repair (389 | 5.3%), and Farming, Fishing & Forestry (109 | 1.5%).
Natural Resources, Construction and Maintenance Occupations by Sex
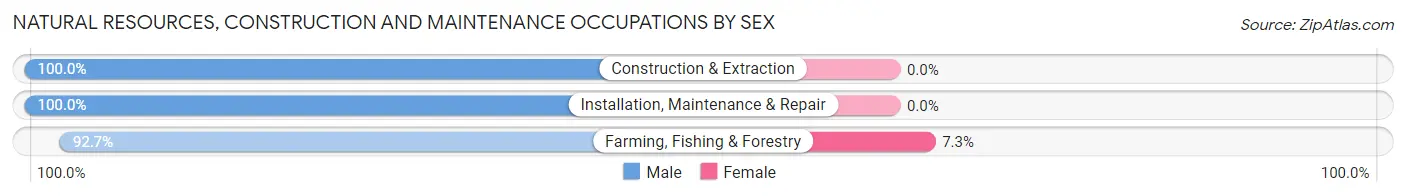
| Occupation | Male | Female |
| Farming, Fishing & Forestry | 101 (92.7%) | 8 (7.3%) |
| Construction & Extraction | 473 (100.0%) | 0 (0.0%) |
| Installation, Maintenance & Repair | 389 (100.0%) | 0 (0.0%) |
| Total (Category) | 963 (99.2%) | 8 (0.8%) |
| Total (Overall) | 4,034 (55.0%) | 3,306 (45.0%) |
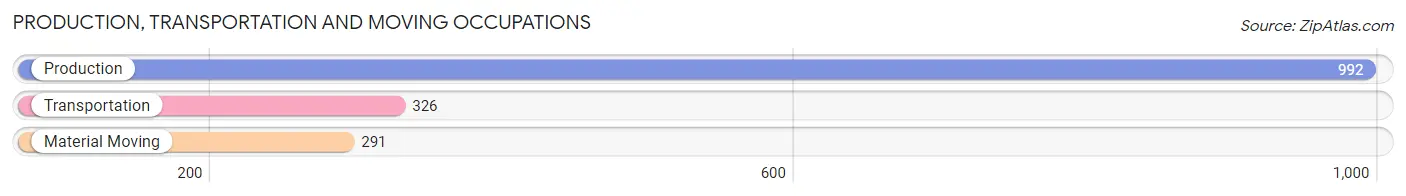
Production, Transportation and Moving Occupations
The most common Production, Transportation and Moving occupations in Patrick County are Production (992 | 13.5%), Transportation (326 | 4.4%), and Material Moving (291 | 4.0%).
Production, Transportation and Moving Occupations by Sex
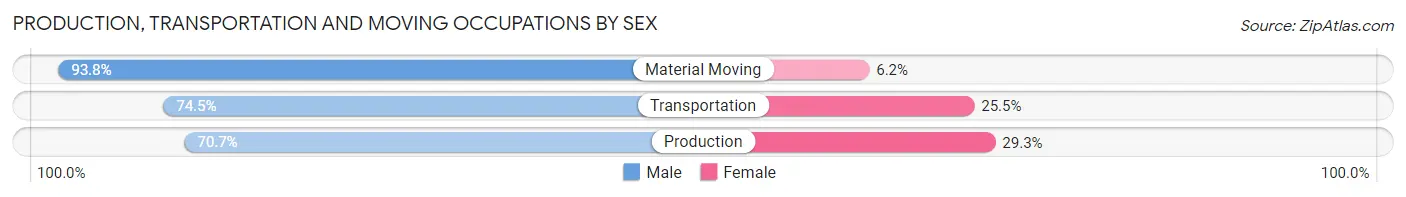
| Occupation | Male | Female |
| Production | 701 (70.7%) | 291 (29.3%) |
| Transportation | 243 (74.5%) | 83 (25.5%) |
| Material Moving | 273 (93.8%) | 18 (6.2%) |
| Total (Category) | 1,217 (75.6%) | 392 (24.4%) |
| Total (Overall) | 4,034 (55.0%) | 3,306 (45.0%) |
Employment Industries by Sex in Patrick County
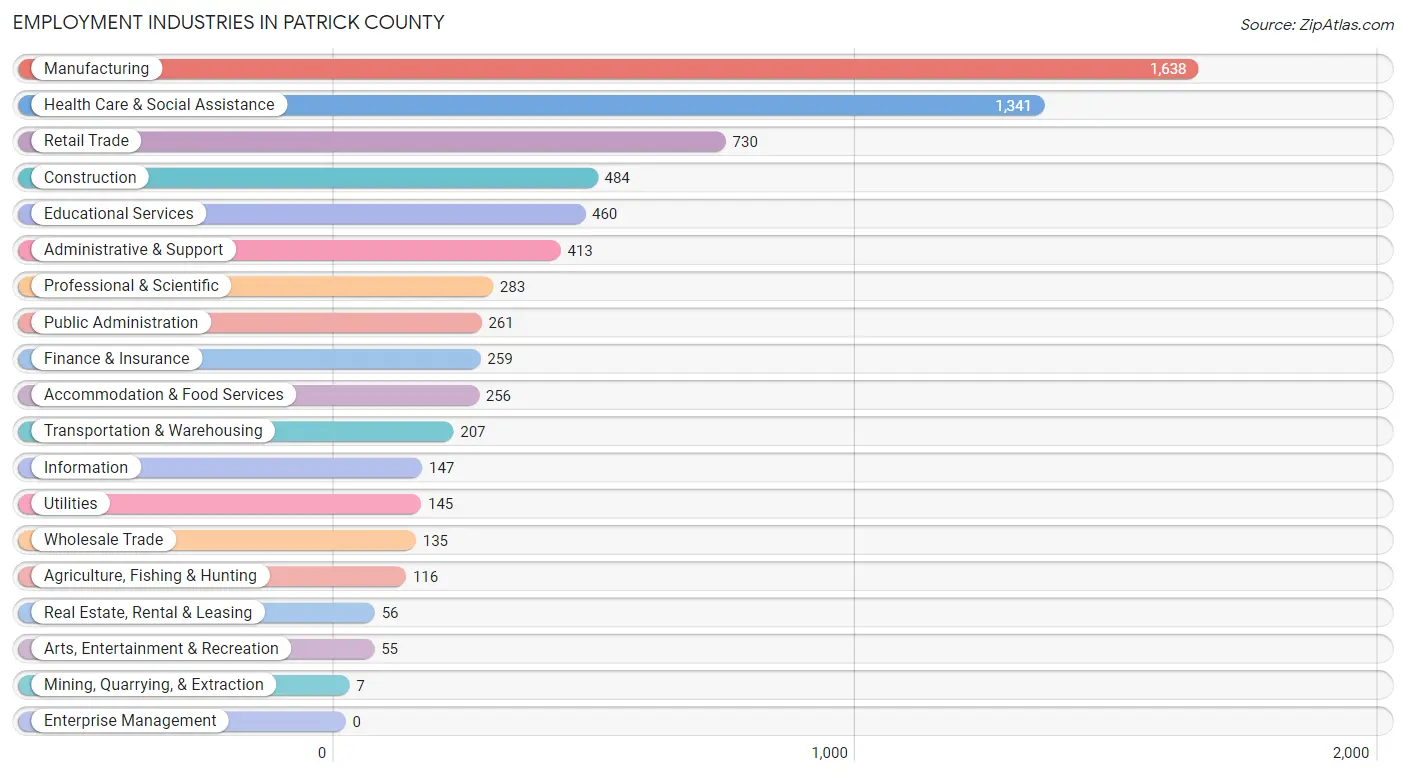
Employment Industries in Patrick County
The major employment industries in Patrick County include Manufacturing (1,638 | 22.3%), Health Care & Social Assistance (1,341 | 18.3%), Retail Trade (730 | 10.0%), Construction (484 | 6.6%), and Educational Services (460 | 6.3%).
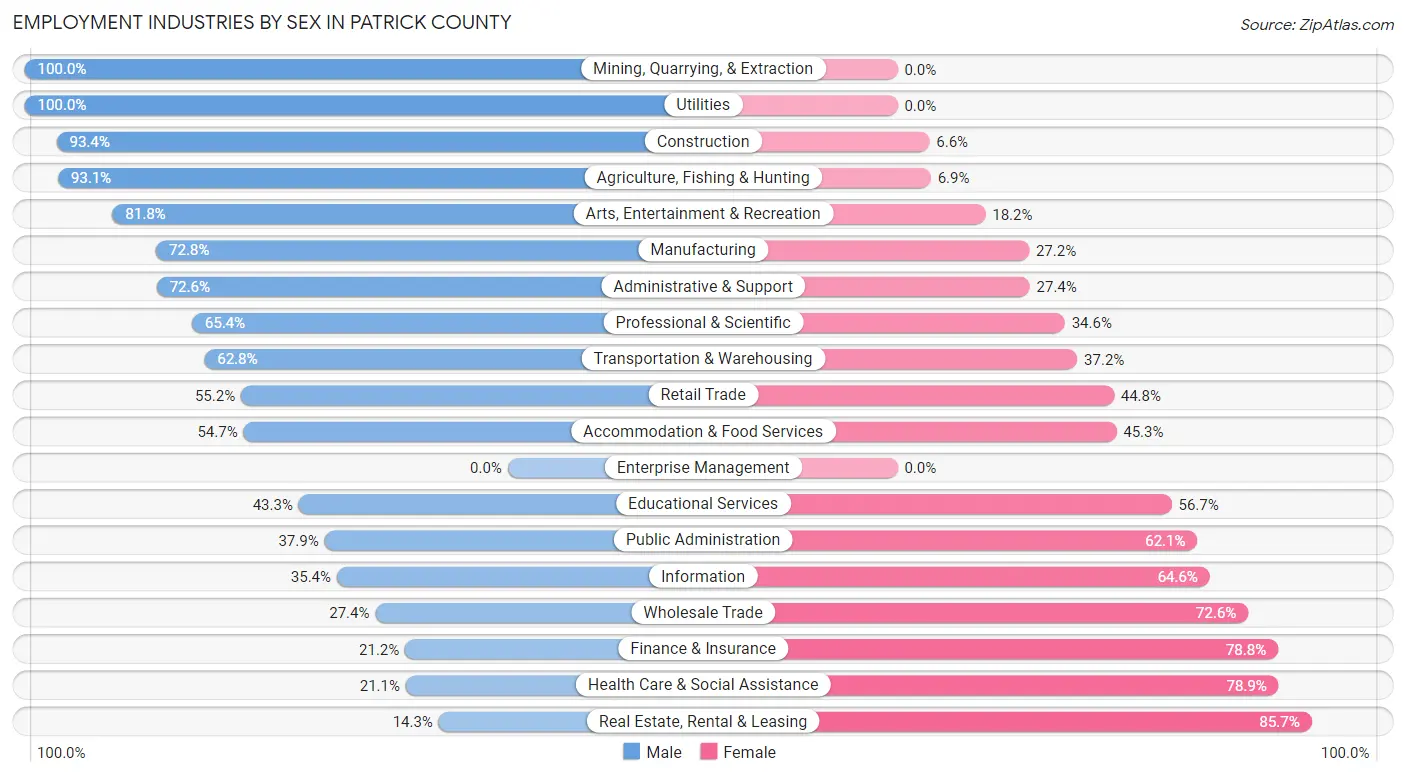
Employment Industries by Sex in Patrick County
The Patrick County industries that see more men than women are Mining, Quarrying, & Extraction (100.0%), Utilities (100.0%), and Construction (93.4%), whereas the industries that tend to have a higher number of women are Real Estate, Rental & Leasing (85.7%), Health Care & Social Assistance (78.9%), and Finance & Insurance (78.8%).
| Industry | Male | Female |
| Agriculture, Fishing & Hunting | 108 (93.1%) | 8 (6.9%) |
| Mining, Quarrying, & Extraction | 7 (100.0%) | 0 (0.0%) |
| Construction | 452 (93.4%) | 32 (6.6%) |
| Manufacturing | 1,192 (72.8%) | 446 (27.2%) |
| Wholesale Trade | 37 (27.4%) | 98 (72.6%) |
| Retail Trade | 403 (55.2%) | 327 (44.8%) |
| Transportation & Warehousing | 130 (62.8%) | 77 (37.2%) |
| Utilities | 145 (100.0%) | 0 (0.0%) |
| Information | 52 (35.4%) | 95 (64.6%) |
| Finance & Insurance | 55 (21.2%) | 204 (78.8%) |
| Real Estate, Rental & Leasing | 8 (14.3%) | 48 (85.7%) |
| Professional & Scientific | 185 (65.4%) | 98 (34.6%) |
| Enterprise Management | 0 (0.0%) | 0 (0.0%) |
| Administrative & Support | 300 (72.6%) | 113 (27.4%) |
| Educational Services | 199 (43.3%) | 261 (56.7%) |
| Health Care & Social Assistance | 283 (21.1%) | 1,058 (78.9%) |
| Arts, Entertainment & Recreation | 45 (81.8%) | 10 (18.2%) |
| Accommodation & Food Services | 140 (54.7%) | 116 (45.3%) |
| Public Administration | 99 (37.9%) | 162 (62.1%) |
| Total | 4,034 (55.0%) | 3,306 (45.0%) |
Education in Patrick County
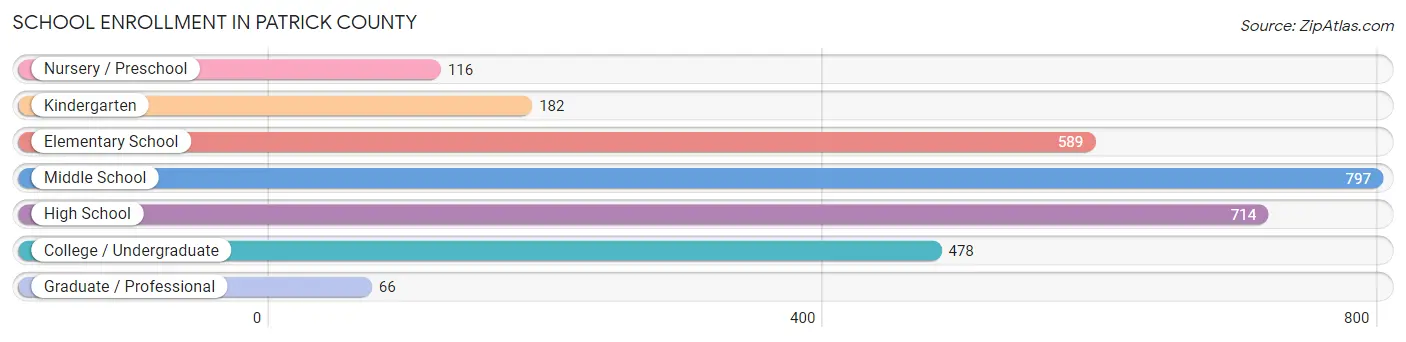
School Enrollment in Patrick County
The most common levels of schooling among the 2,942 students in Patrick County are middle school (797 | 27.1%), high school (714 | 24.3%), and elementary school (589 | 20.0%).
| School Level | # Students | % Students |
| Nursery / Preschool | 116 | 3.9% |
| Kindergarten | 182 | 6.2% |
| Elementary School | 589 | 20.0% |
| Middle School | 797 | 27.1% |
| High School | 714 | 24.3% |
| College / Undergraduate | 478 | 16.3% |
| Graduate / Professional | 66 | 2.2% |
| Total | 2,942 | 100.0% |
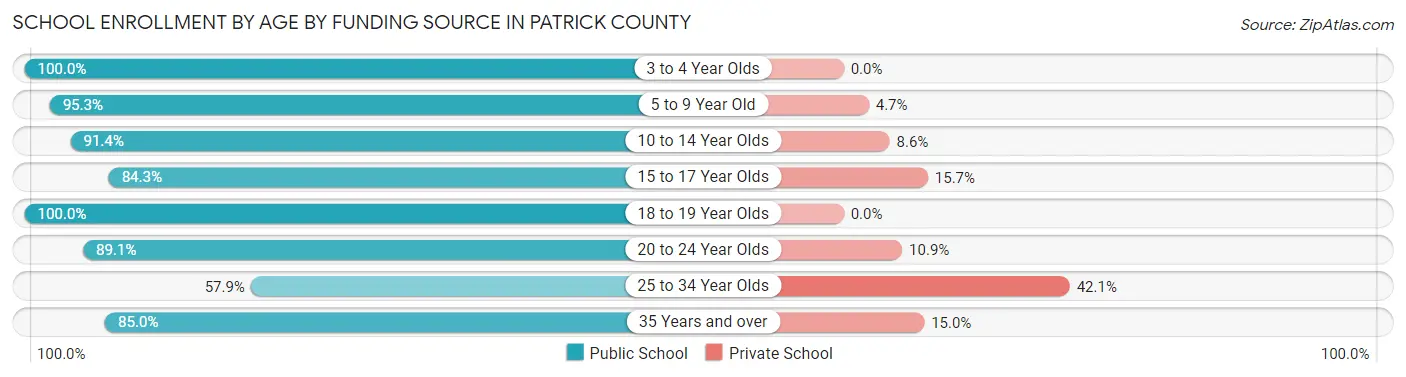
School Enrollment by Age by Funding Source in Patrick County
Out of a total of 2,942 students who are enrolled in schools in Patrick County, 303 (10.3%) attend a private institution, while the remaining 2,639 (89.7%) are enrolled in public schools. The age group of 25 to 34 year olds has the highest likelihood of being enrolled in private schools, with 56 (42.1% in the age bracket) enrolled. Conversely, the age group of 3 to 4 year olds has the lowest likelihood of being enrolled in a private school, with 68 (100.0% in the age bracket) attending a public institution.
| Age Bracket | Public School | Private School |
| 3 to 4 Year Olds | 68 (100.0%) | 0 (0.0%) |
| 5 to 9 Year Old | 692 (95.3%) | 34 (4.7%) |
| 10 to 14 Year Olds | 844 (91.4%) | 79 (8.6%) |
| 15 to 17 Year Olds | 468 (84.3%) | 87 (15.7%) |
| 18 to 19 Year Olds | 175 (100.0%) | 0 (0.0%) |
| 20 to 24 Year Olds | 180 (89.1%) | 22 (10.9%) |
| 25 to 34 Year Olds | 77 (57.9%) | 56 (42.1%) |
| 35 Years and over | 136 (85.0%) | 24 (15.0%) |
| Total | 2,639 (89.7%) | 303 (10.3%) |
Educational Attainment by Field of Study in Patrick County
Science & technology (417 | 18.3%), business (375 | 16.5%), education (319 | 14.0%), engineering (275 | 12.1%), and bio, nature & agricultural (172 | 7.5%) are the most common fields of study among 2,277 individuals in Patrick County who have obtained a bachelor's degree or higher.
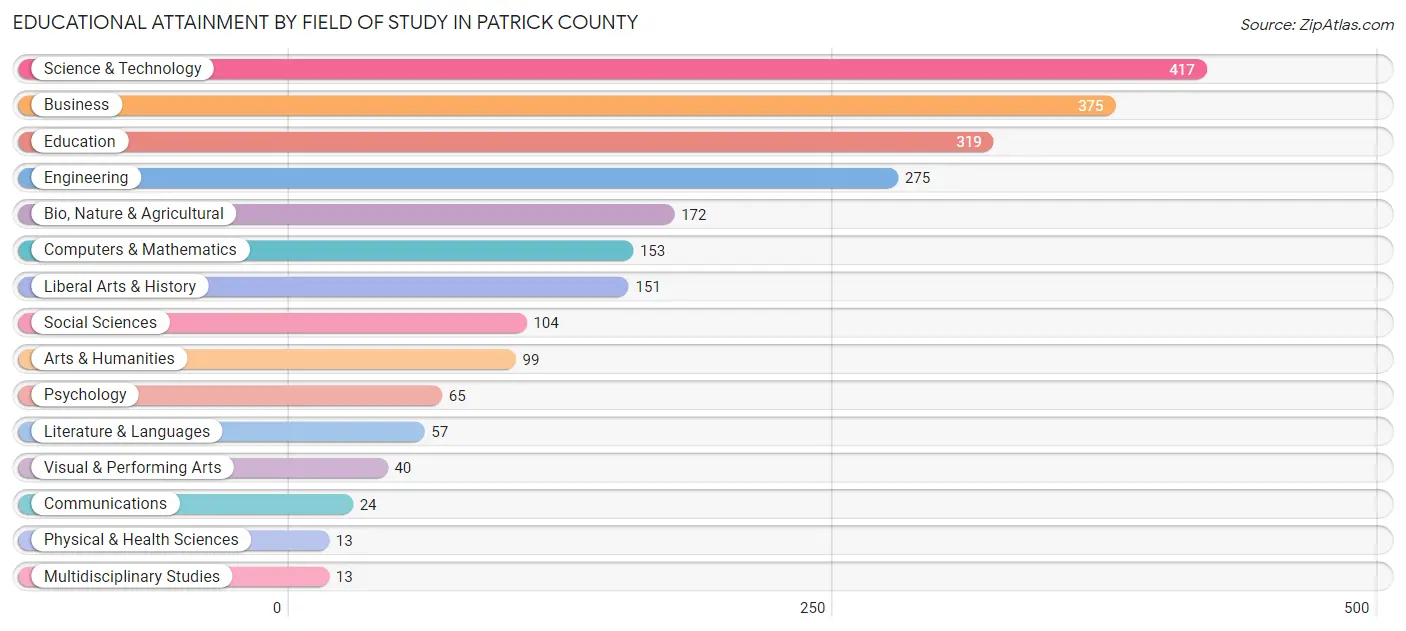
| Field of Study | # Graduates | % Graduates |
| Computers & Mathematics | 153 | 6.7% |
| Bio, Nature & Agricultural | 172 | 7.5% |
| Physical & Health Sciences | 13 | 0.6% |
| Psychology | 65 | 2.9% |
| Social Sciences | 104 | 4.6% |
| Engineering | 275 | 12.1% |
| Multidisciplinary Studies | 13 | 0.6% |
| Science & Technology | 417 | 18.3% |
| Business | 375 | 16.5% |
| Education | 319 | 14.0% |
| Literature & Languages | 57 | 2.5% |
| Liberal Arts & History | 151 | 6.6% |
| Visual & Performing Arts | 40 | 1.8% |
| Communications | 24 | 1.1% |
| Arts & Humanities | 99 | 4.3% |
| Total | 2,277 | 100.0% |
Transportation & Commute in Patrick County
Vehicle Availability by Sex in Patrick County
The most prevalent vehicle ownership categories in Patrick County are males with 2 vehicles (1,092, accounting for 27.4%) and females with 2 vehicles (959, making up 34.0%).
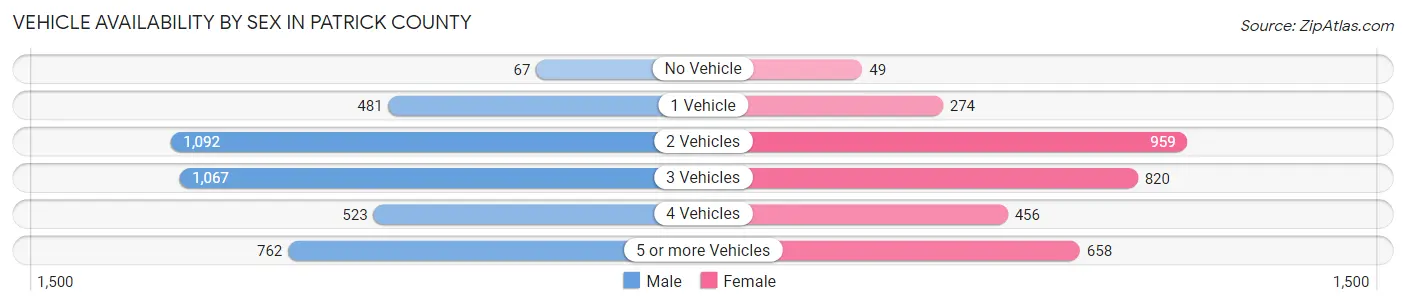
| Vehicles Available | Male | Female |
| No Vehicle | 67 (1.7%) | 49 (1.5%) |
| 1 Vehicle | 481 (12.0%) | 274 (8.5%) |
| 2 Vehicles | 1,092 (27.4%) | 959 (29.8%) |
| 3 Vehicles | 1,067 (26.7%) | 820 (25.5%) |
| 4 Vehicles | 523 (13.1%) | 456 (14.2%) |
| 5 or more Vehicles | 762 (19.1%) | 658 (20.5%) |
| Total | 3,992 (100.0%) | 3,216 (100.0%) |
Commute Time in Patrick County
The most frequently occuring commute durations in Patrick County are 15 to 19 minutes (1,003 commuters, 15.4%), 30 to 34 minutes (954 commuters, 14.7%), and 10 to 14 minutes (687 commuters, 10.6%).
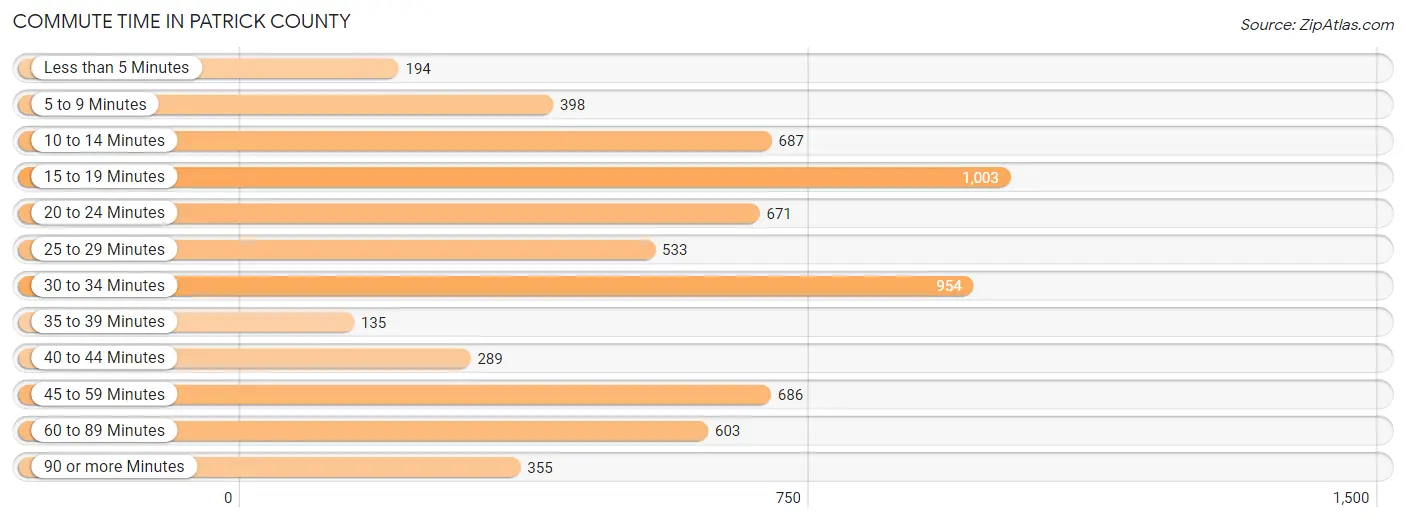
| Commute Time | # Commuters | % Commuters |
| Less than 5 Minutes | 194 | 3.0% |
| 5 to 9 Minutes | 398 | 6.1% |
| 10 to 14 Minutes | 687 | 10.6% |
| 15 to 19 Minutes | 1,003 | 15.4% |
| 20 to 24 Minutes | 671 | 10.3% |
| 25 to 29 Minutes | 533 | 8.2% |
| 30 to 34 Minutes | 954 | 14.7% |
| 35 to 39 Minutes | 135 | 2.1% |
| 40 to 44 Minutes | 289 | 4.4% |
| 45 to 59 Minutes | 686 | 10.5% |
| 60 to 89 Minutes | 603 | 9.3% |
| 90 or more Minutes | 355 | 5.4% |
Commute Time by Sex in Patrick County
The most common commute times in Patrick County are 30 to 34 minutes (571 commuters, 15.1%) for males and 15 to 19 minutes (501 commuters, 18.3%) for females.
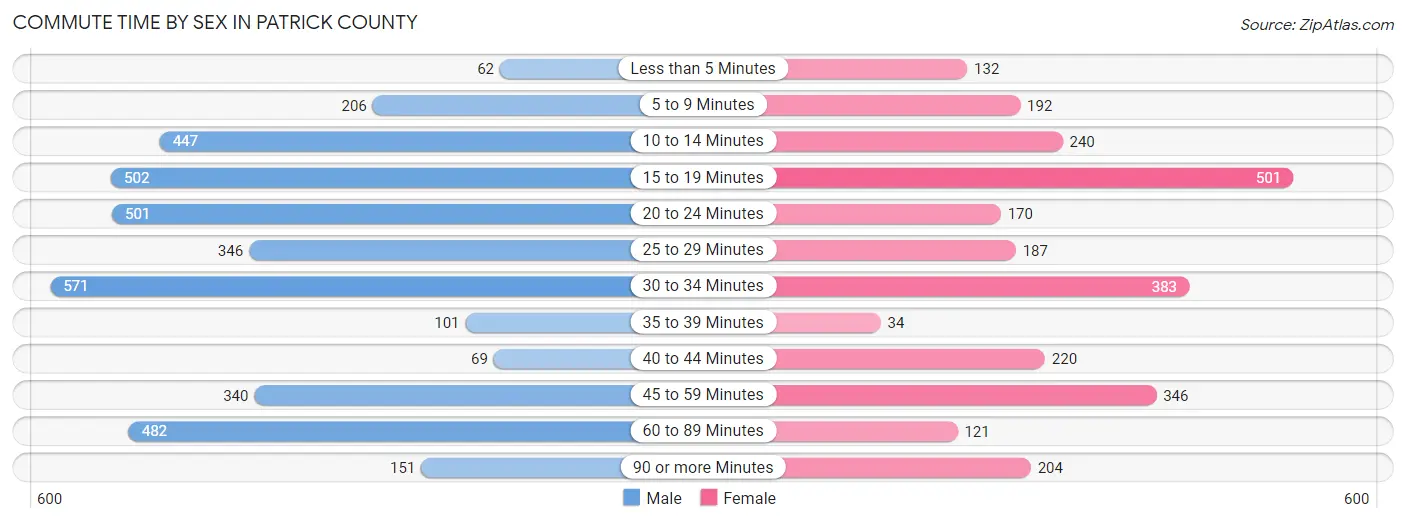
| Commute Time | Male | Female |
| Less than 5 Minutes | 62 (1.6%) | 132 (4.8%) |
| 5 to 9 Minutes | 206 (5.4%) | 192 (7.0%) |
| 10 to 14 Minutes | 447 (11.8%) | 240 (8.8%) |
| 15 to 19 Minutes | 502 (13.3%) | 501 (18.3%) |
| 20 to 24 Minutes | 501 (13.3%) | 170 (6.2%) |
| 25 to 29 Minutes | 346 (9.2%) | 187 (6.9%) |
| 30 to 34 Minutes | 571 (15.1%) | 383 (14.0%) |
| 35 to 39 Minutes | 101 (2.7%) | 34 (1.3%) |
| 40 to 44 Minutes | 69 (1.8%) | 220 (8.1%) |
| 45 to 59 Minutes | 340 (9.0%) | 346 (12.7%) |
| 60 to 89 Minutes | 482 (12.8%) | 121 (4.4%) |
| 90 or more Minutes | 151 (4.0%) | 204 (7.5%) |
Time of Departure to Work by Sex in Patrick County
The most frequent times of departure to work in Patrick County are 6:00 AM to 6:29 AM (662, 17.5%) for males and 7:30 AM to 7:59 AM (434, 15.9%) for females.
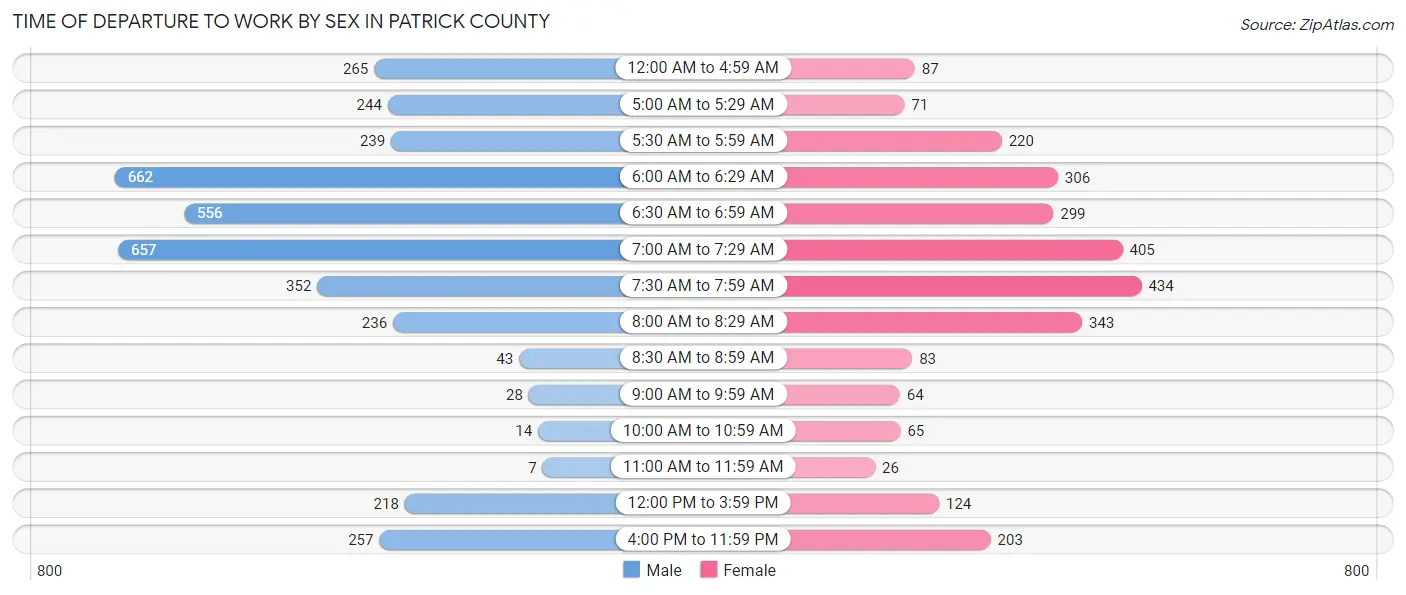
| Time of Departure | Male | Female |
| 12:00 AM to 4:59 AM | 265 (7.0%) | 87 (3.2%) |
| 5:00 AM to 5:29 AM | 244 (6.5%) | 71 (2.6%) |
| 5:30 AM to 5:59 AM | 239 (6.3%) | 220 (8.1%) |
| 6:00 AM to 6:29 AM | 662 (17.5%) | 306 (11.2%) |
| 6:30 AM to 6:59 AM | 556 (14.7%) | 299 (11.0%) |
| 7:00 AM to 7:29 AM | 657 (17.4%) | 405 (14.8%) |
| 7:30 AM to 7:59 AM | 352 (9.3%) | 434 (15.9%) |
| 8:00 AM to 8:29 AM | 236 (6.2%) | 343 (12.6%) |
| 8:30 AM to 8:59 AM | 43 (1.1%) | 83 (3.0%) |
| 9:00 AM to 9:59 AM | 28 (0.7%) | 64 (2.3%) |
| 10:00 AM to 10:59 AM | 14 (0.4%) | 65 (2.4%) |
| 11:00 AM to 11:59 AM | 7 (0.2%) | 26 (0.9%) |
| 12:00 PM to 3:59 PM | 218 (5.8%) | 124 (4.5%) |
| 4:00 PM to 11:59 PM | 257 (6.8%) | 203 (7.4%) |
| Total | 3,778 (100.0%) | 2,730 (100.0%) |
Housing Occupancy in Patrick County
Occupancy by Ownership in Patrick County
Of the total 7,779 dwellings in Patrick County, owner-occupied units account for 6,140 (78.9%), while renter-occupied units make up 1,639 (21.1%).
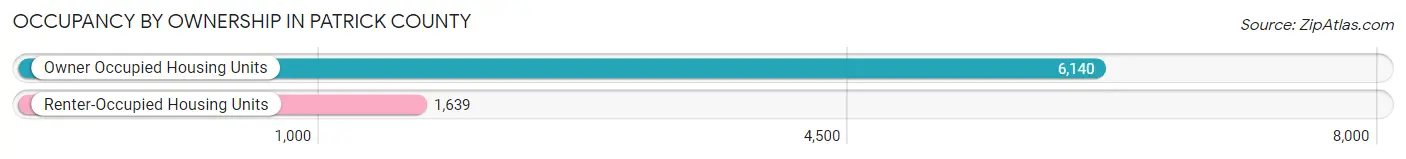
| Occupancy | # Housing Units | % Housing Units |
| Owner Occupied Housing Units | 6,140 | 78.9% |
| Renter-Occupied Housing Units | 1,639 | 21.1% |
| Total Occupied Housing Units | 7,779 | 100.0% |
Occupancy by Household Size in Patrick County
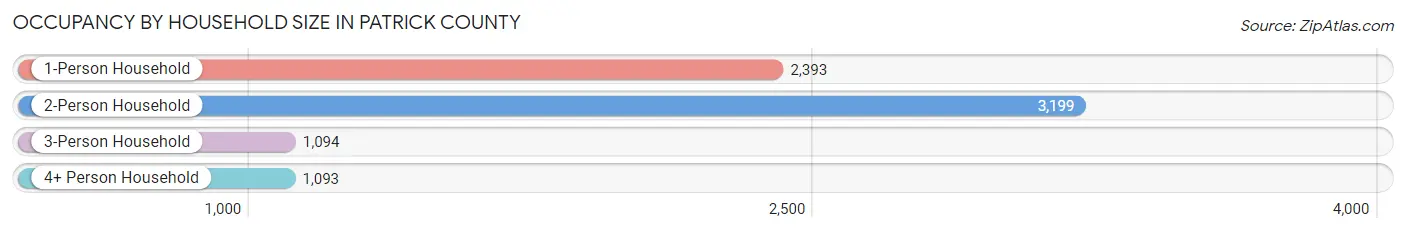
| Household Size | # Housing Units | % Housing Units |
| 1-Person Household | 2,393 | 30.8% |
| 2-Person Household | 3,199 | 41.1% |
| 3-Person Household | 1,094 | 14.1% |
| 4+ Person Household | 1,093 | 14.1% |
| Total Housing Units | 7,779 | 100.0% |
Occupancy by Ownership by Household Size in Patrick County
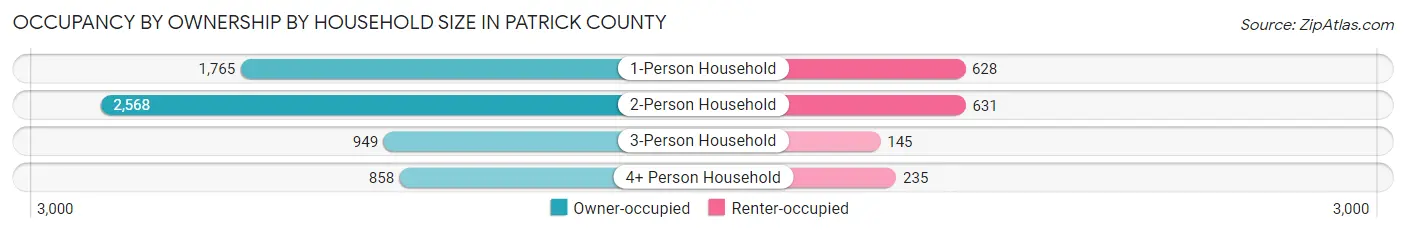
| Household Size | Owner-occupied | Renter-occupied |
| 1-Person Household | 1,765 (73.8%) | 628 (26.2%) |
| 2-Person Household | 2,568 (80.3%) | 631 (19.7%) |
| 3-Person Household | 949 (86.8%) | 145 (13.3%) |
| 4+ Person Household | 858 (78.5%) | 235 (21.5%) |
| Total Housing Units | 6,140 (78.9%) | 1,639 (21.1%) |
Occupancy by Educational Attainment in Patrick County
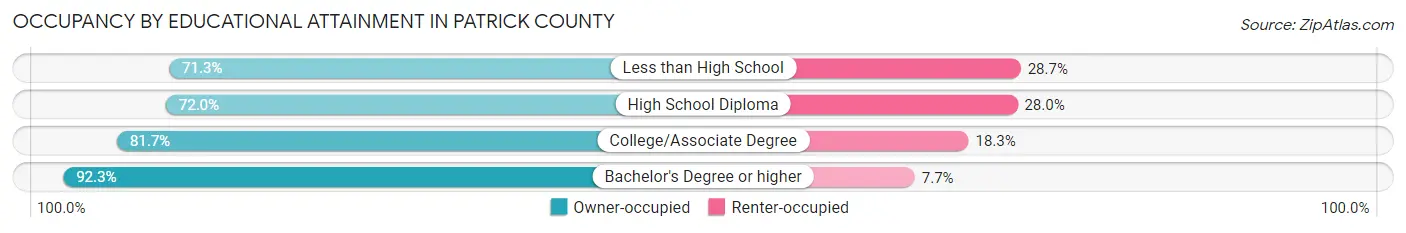
| Household Size | Owner-occupied | Renter-occupied |
| Less than High School | 896 (71.3%) | 360 (28.7%) |
| High School Diploma | 1,798 (72.0%) | 700 (28.0%) |
| College/Associate Degree | 2,074 (81.7%) | 465 (18.3%) |
| Bachelor's Degree or higher | 1,372 (92.3%) | 114 (7.7%) |
Occupancy by Age of Householder in Patrick County
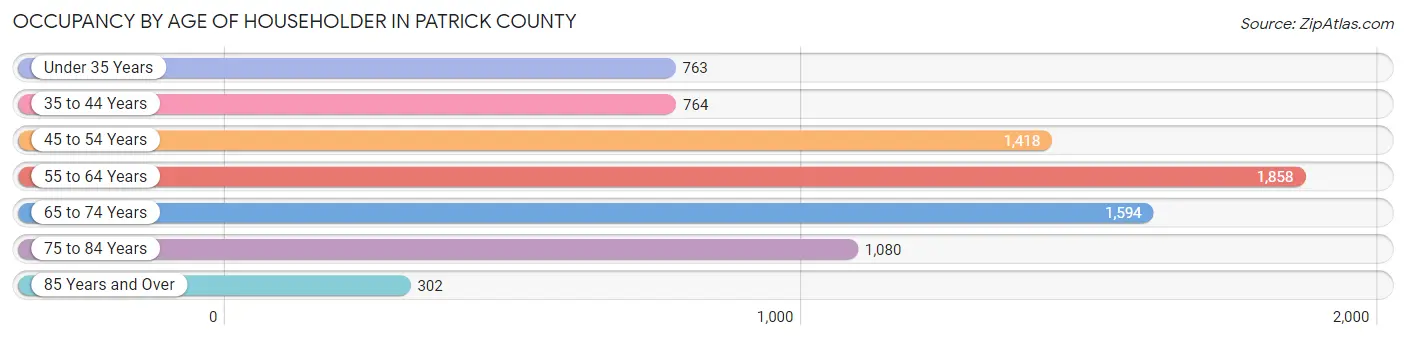
| Age Bracket | # Households | % Households |
| Under 35 Years | 763 | 9.8% |
| 35 to 44 Years | 764 | 9.8% |
| 45 to 54 Years | 1,418 | 18.2% |
| 55 to 64 Years | 1,858 | 23.9% |
| 65 to 74 Years | 1,594 | 20.5% |
| 75 to 84 Years | 1,080 | 13.9% |
| 85 Years and Over | 302 | 3.9% |
| Total | 7,779 | 100.0% |
Housing Finances in Patrick County
Median Income by Occupancy in Patrick County
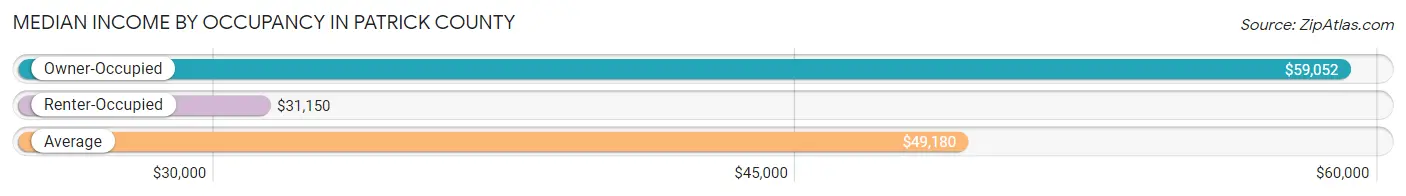
| Occupancy Type | # Households | Median Income |
| Owner-Occupied | 6,140 (78.9%) | $59,052 |
| Renter-Occupied | 1,639 (21.1%) | $31,150 |
| Average | 7,779 (100.0%) | $49,180 |
Occupancy by Householder Income Bracket in Patrick County
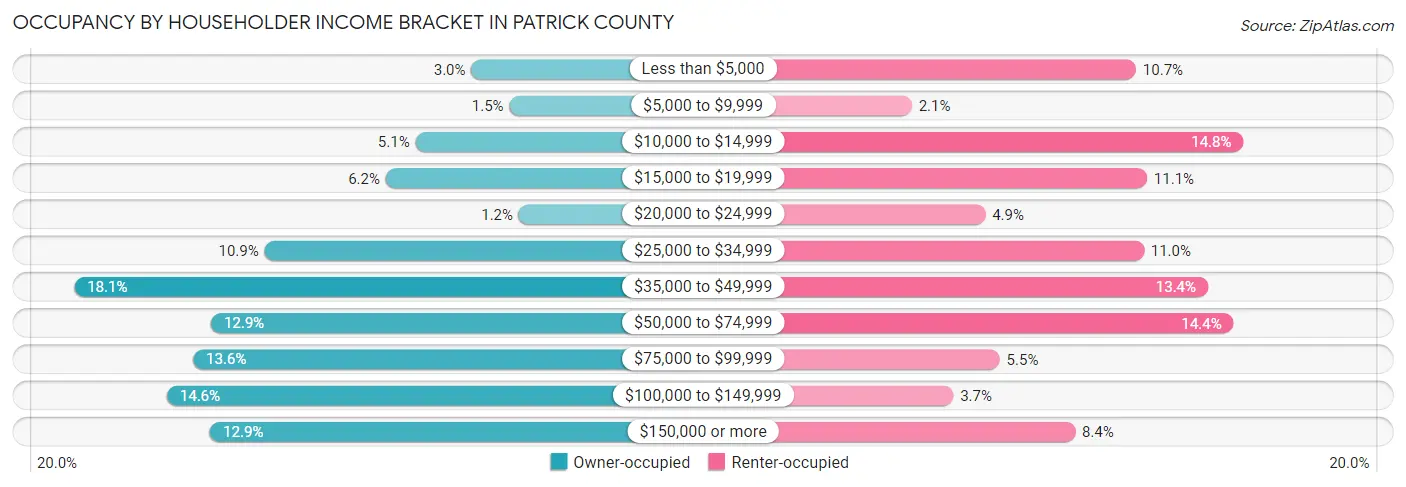
| Income Bracket | Owner-occupied | Renter-occupied |
| Less than $5,000 | 183 (3.0%) | 175 (10.7%) |
| $5,000 to $9,999 | 94 (1.5%) | 35 (2.1%) |
| $10,000 to $14,999 | 314 (5.1%) | 242 (14.8%) |
| $15,000 to $19,999 | 383 (6.2%) | 182 (11.1%) |
| $20,000 to $24,999 | 72 (1.2%) | 81 (4.9%) |
| $25,000 to $34,999 | 667 (10.9%) | 180 (11.0%) |
| $35,000 to $49,999 | 1,112 (18.1%) | 220 (13.4%) |
| $50,000 to $74,999 | 792 (12.9%) | 236 (14.4%) |
| $75,000 to $99,999 | 834 (13.6%) | 90 (5.5%) |
| $100,000 to $149,999 | 895 (14.6%) | 61 (3.7%) |
| $150,000 or more | 794 (12.9%) | 137 (8.4%) |
| Total | 6,140 (100.0%) | 1,639 (100.0%) |
Monthly Housing Cost Tiers in Patrick County
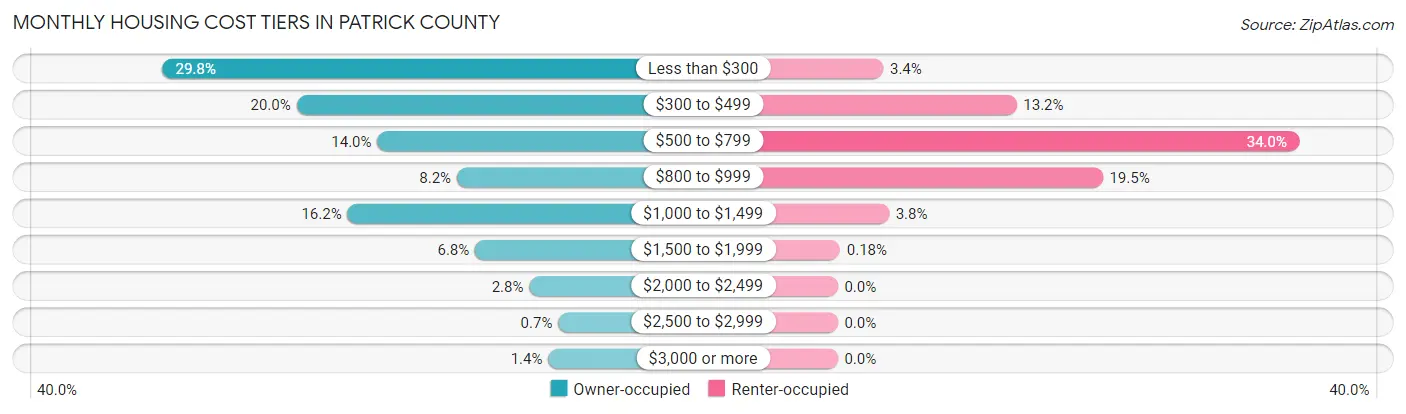
| Monthly Cost | Owner-occupied | Renter-occupied |
| Less than $300 | 1,832 (29.8%) | 55 (3.4%) |
| $300 to $499 | 1,226 (20.0%) | 216 (13.2%) |
| $500 to $799 | 861 (14.0%) | 557 (34.0%) |
| $800 to $999 | 501 (8.2%) | 320 (19.5%) |
| $1,000 to $1,499 | 996 (16.2%) | 62 (3.8%) |
| $1,500 to $1,999 | 419 (6.8%) | 3 (0.2%) |
| $2,000 to $2,499 | 174 (2.8%) | 0 (0.0%) |
| $2,500 to $2,999 | 43 (0.7%) | 0 (0.0%) |
| $3,000 or more | 88 (1.4%) | 0 (0.0%) |
| Total | 6,140 (100.0%) | 1,639 (100.0%) |
Physical Housing Characteristics in Patrick County
Housing Structures in Patrick County
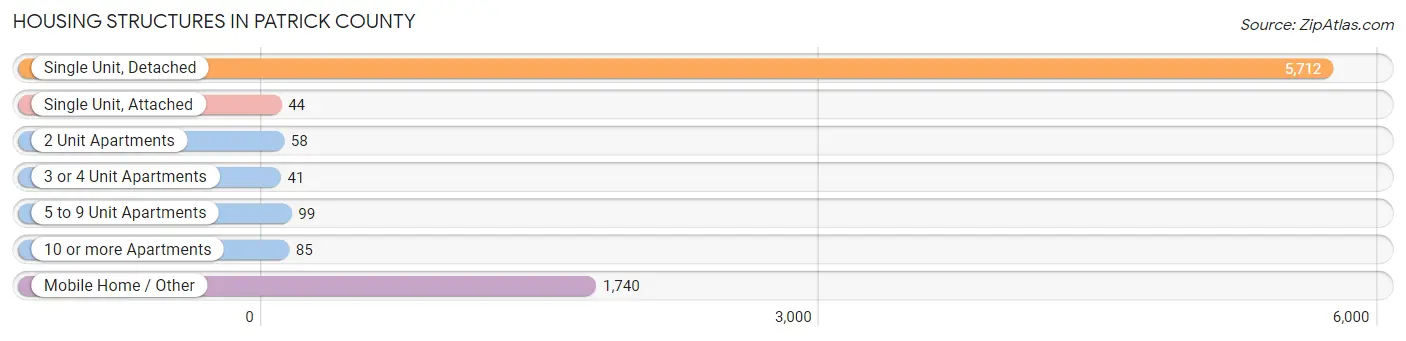
| Structure Type | # Housing Units | % Housing Units |
| Single Unit, Detached | 5,712 | 73.4% |
| Single Unit, Attached | 44 | 0.6% |
| 2 Unit Apartments | 58 | 0.7% |
| 3 or 4 Unit Apartments | 41 | 0.5% |
| 5 to 9 Unit Apartments | 99 | 1.3% |
| 10 or more Apartments | 85 | 1.1% |
| Mobile Home / Other | 1,740 | 22.4% |
| Total | 7,779 | 100.0% |
Housing Structures by Occupancy in Patrick County
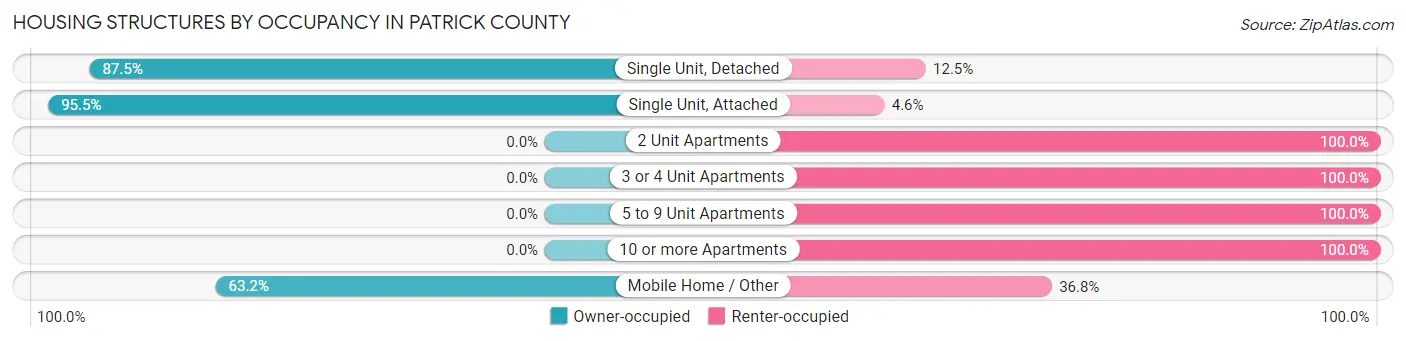
| Structure Type | Owner-occupied | Renter-occupied |
| Single Unit, Detached | 4,998 (87.5%) | 714 (12.5%) |
| Single Unit, Attached | 42 (95.5%) | 2 (4.5%) |
| 2 Unit Apartments | 0 (0.0%) | 58 (100.0%) |
| 3 or 4 Unit Apartments | 0 (0.0%) | 41 (100.0%) |
| 5 to 9 Unit Apartments | 0 (0.0%) | 99 (100.0%) |
| 10 or more Apartments | 0 (0.0%) | 85 (100.0%) |
| Mobile Home / Other | 1,100 (63.2%) | 640 (36.8%) |
| Total | 6,140 (78.9%) | 1,639 (21.1%) |
Housing Structures by Number of Rooms in Patrick County
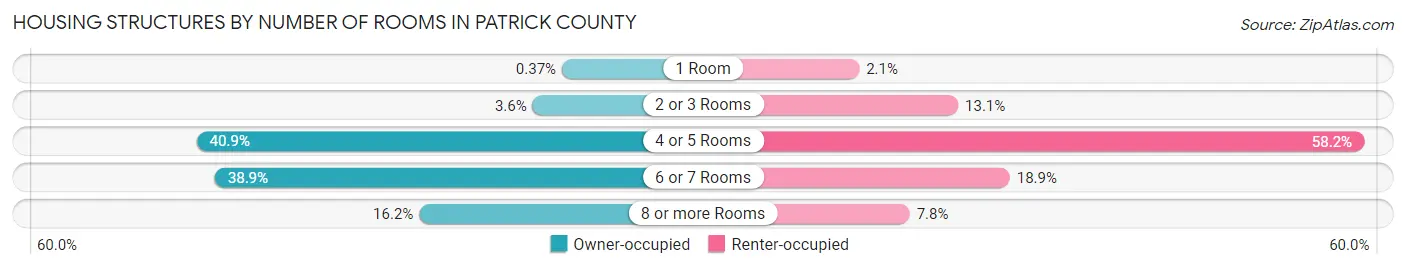
| Number of Rooms | Owner-occupied | Renter-occupied |
| 1 Room | 23 (0.4%) | 35 (2.1%) |
| 2 or 3 Rooms | 223 (3.6%) | 215 (13.1%) |
| 4 or 5 Rooms | 2,512 (40.9%) | 953 (58.2%) |
| 6 or 7 Rooms | 2,387 (38.9%) | 309 (18.9%) |
| 8 or more Rooms | 995 (16.2%) | 127 (7.7%) |
| Total | 6,140 (100.0%) | 1,639 (100.0%) |
Housing Structure by Heating Type in Patrick County
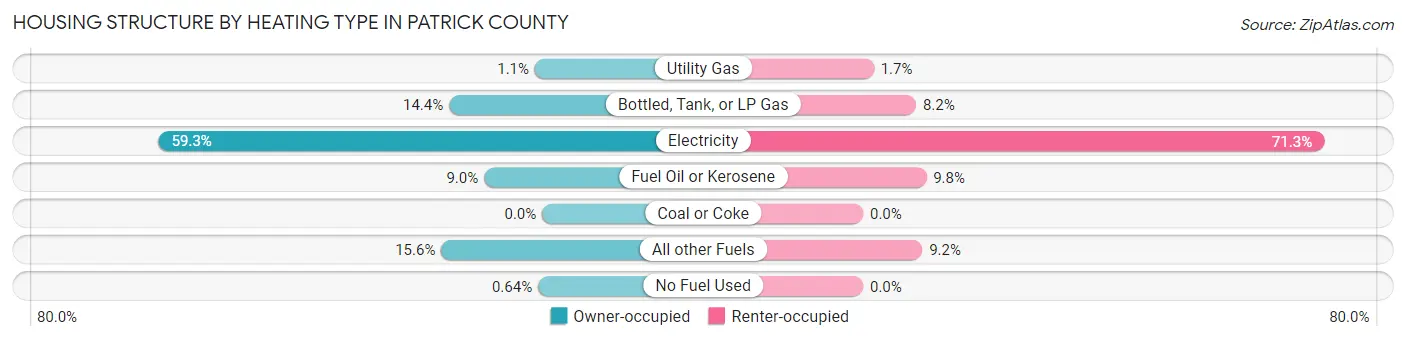
| Heating Type | Owner-occupied | Renter-occupied |
| Utility Gas | 69 (1.1%) | 27 (1.7%) |
| Bottled, Tank, or LP Gas | 883 (14.4%) | 134 (8.2%) |
| Electricity | 3,641 (59.3%) | 1,168 (71.3%) |
| Fuel Oil or Kerosene | 551 (9.0%) | 160 (9.8%) |
| Coal or Coke | 0 (0.0%) | 0 (0.0%) |
| All other Fuels | 957 (15.6%) | 150 (9.1%) |
| No Fuel Used | 39 (0.6%) | 0 (0.0%) |
| Total | 6,140 (100.0%) | 1,639 (100.0%) |
Household Vehicle Usage in Patrick County
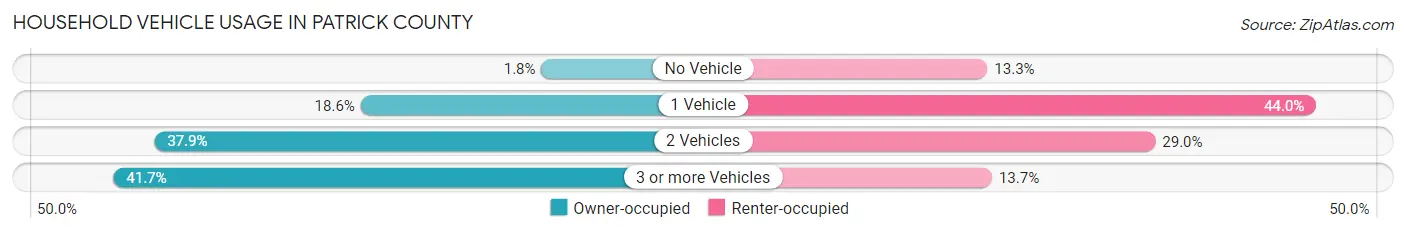
| Vehicles per Household | Owner-occupied | Renter-occupied |
| No Vehicle | 108 (1.8%) | 218 (13.3%) |
| 1 Vehicle | 1,144 (18.6%) | 721 (44.0%) |
| 2 Vehicles | 2,327 (37.9%) | 475 (29.0%) |
| 3 or more Vehicles | 2,561 (41.7%) | 225 (13.7%) |
| Total | 6,140 (100.0%) | 1,639 (100.0%) |
Real Estate & Mortgages in Patrick County
Real Estate and Mortgage Overview in Patrick County
| Characteristic | Without Mortgage | With Mortgage |
| Housing Units | 3,481 | 2,659 |
| Median Property Value | $106,900 | $162,600 |
| Median Household Income | $40,830 | $474 |
| Monthly Housing Costs | $296 | $81 |
| Real Estate Taxes | $725 | $65 |
Property Value by Mortgage Status in Patrick County
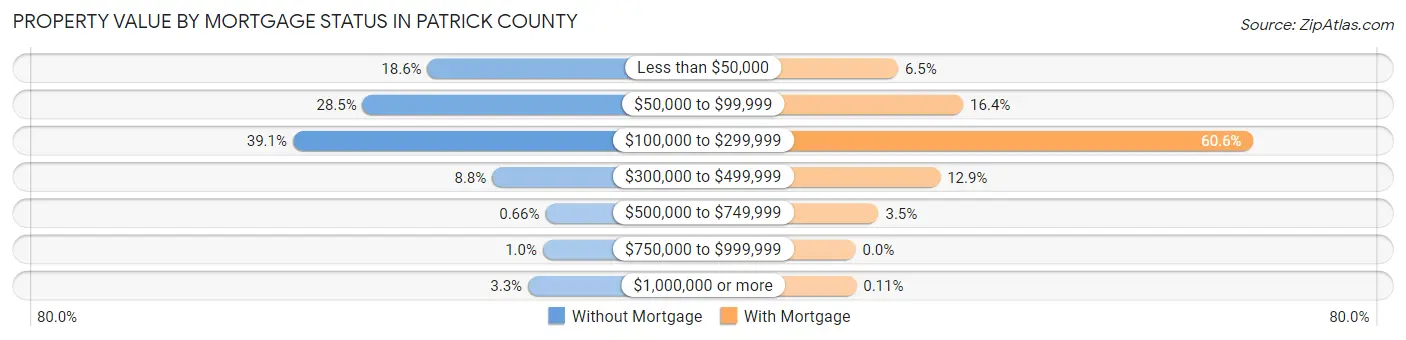
| Property Value | Without Mortgage | With Mortgage |
| Less than $50,000 | 648 (18.6%) | 172 (6.5%) |
| $50,000 to $99,999 | 992 (28.5%) | 436 (16.4%) |
| $100,000 to $299,999 | 1,362 (39.1%) | 1,612 (60.6%) |
| $300,000 to $499,999 | 305 (8.8%) | 343 (12.9%) |
| $500,000 to $749,999 | 23 (0.7%) | 93 (3.5%) |
| $750,000 to $999,999 | 36 (1.0%) | 0 (0.0%) |
| $1,000,000 or more | 115 (3.3%) | 3 (0.1%) |
| Total | 3,481 (100.0%) | 2,659 (100.0%) |
Household Income by Mortgage Status in Patrick County
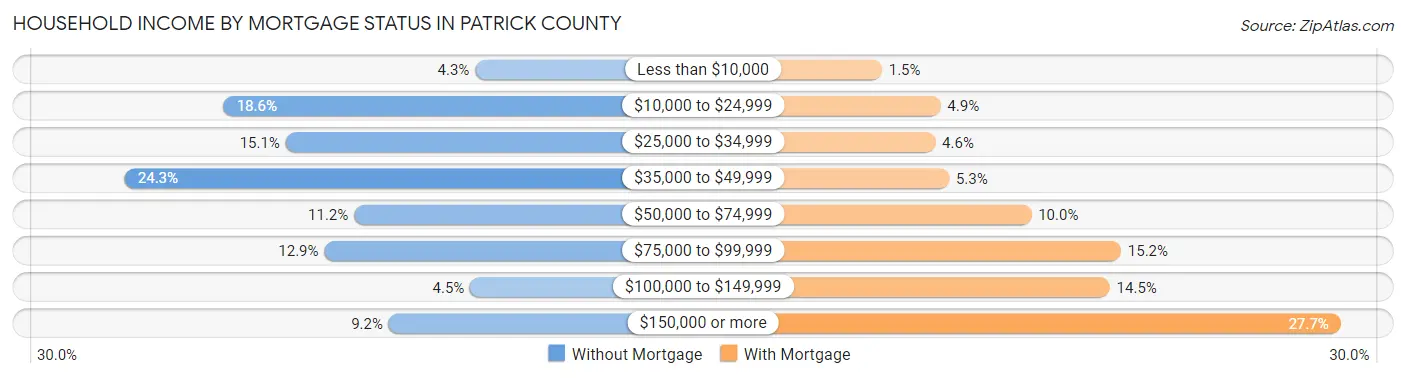
| Household Income | Without Mortgage | With Mortgage |
| Less than $10,000 | 148 (4.3%) | 40 (1.5%) |
| $10,000 to $24,999 | 648 (18.6%) | 129 (4.9%) |
| $25,000 to $34,999 | 525 (15.1%) | 121 (4.5%) |
| $35,000 to $49,999 | 845 (24.3%) | 142 (5.3%) |
| $50,000 to $74,999 | 389 (11.2%) | 267 (10.0%) |
| $75,000 to $99,999 | 448 (12.9%) | 403 (15.2%) |
| $100,000 to $149,999 | 158 (4.5%) | 386 (14.5%) |
| $150,000 or more | 320 (9.2%) | 737 (27.7%) |
| Total | 3,481 (100.0%) | 2,659 (100.0%) |
Property Value to Household Income Ratio in Patrick County
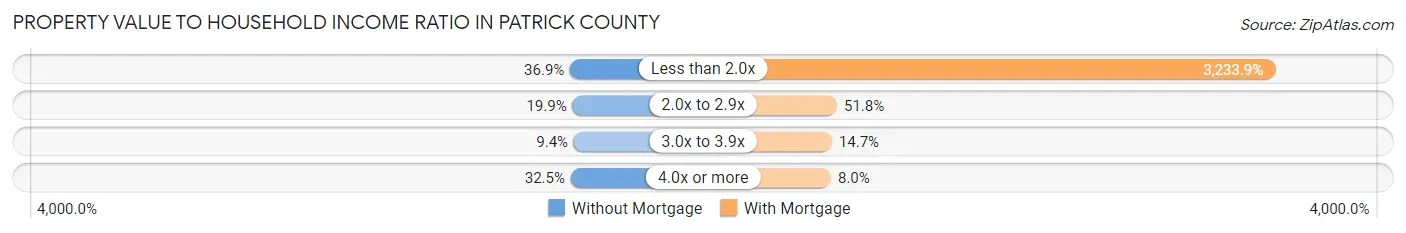
| Value-to-Income Ratio | Without Mortgage | With Mortgage |
| Less than 2.0x | 1,286 (36.9%) | 85,990 (3,233.9%) |
| 2.0x to 2.9x | 692 (19.9%) | 1,378 (51.8%) |
| 3.0x to 3.9x | 326 (9.4%) | 391 (14.7%) |
| 4.0x or more | 1,131 (32.5%) | 213 (8.0%) |
| Total | 3,481 (100.0%) | 2,659 (100.0%) |
Real Estate Taxes by Mortgage Status in Patrick County
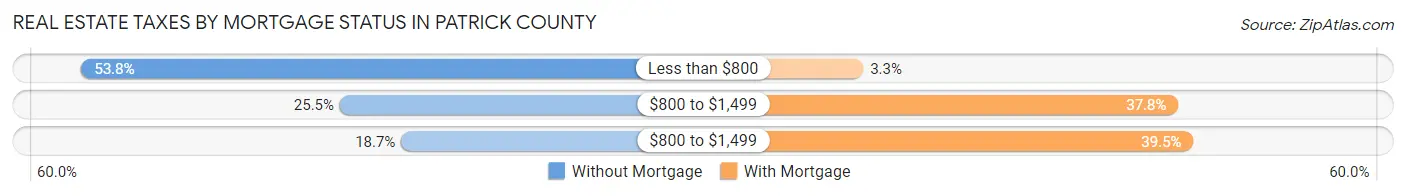
| Property Taxes | Without Mortgage | With Mortgage |
| Less than $800 | 1,872 (53.8%) | 88 (3.3%) |
| $800 to $1,499 | 886 (25.5%) | 1,006 (37.8%) |
| $800 to $1,499 | 652 (18.7%) | 1,050 (39.5%) |
| Total | 3,481 (100.0%) | 2,659 (100.0%) |
Health & Disability in Patrick County
Health Insurance Coverage by Age in Patrick County
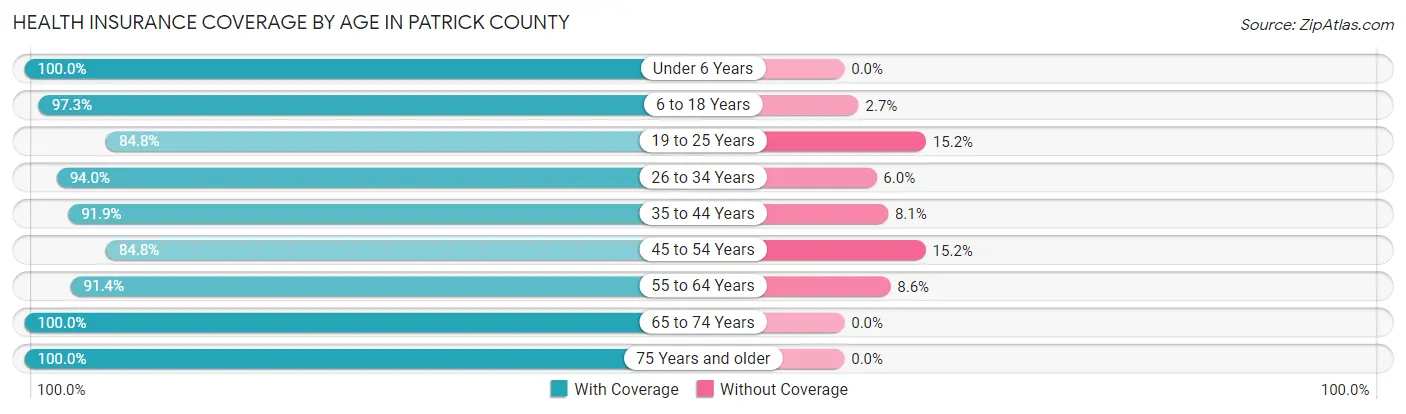
| Age Bracket | With Coverage | Without Coverage |
| Under 6 Years | 945 (100.0%) | 0 (0.0%) |
| 6 to 18 Years | 2,194 (97.3%) | 60 (2.7%) |
| 19 to 25 Years | 880 (84.8%) | 158 (15.2%) |
| 26 to 34 Years | 1,271 (94.0%) | 81 (6.0%) |
| 35 to 44 Years | 1,500 (91.9%) | 133 (8.1%) |
| 45 to 54 Years | 2,170 (84.8%) | 388 (15.2%) |
| 55 to 64 Years | 2,691 (91.4%) | 253 (8.6%) |
| 65 to 74 Years | 2,591 (100.0%) | 0 (0.0%) |
| 75 Years and older | 1,925 (100.0%) | 0 (0.0%) |
| Total | 16,167 (93.8%) | 1,073 (6.2%) |
Health Insurance Coverage by Citizenship Status in Patrick County
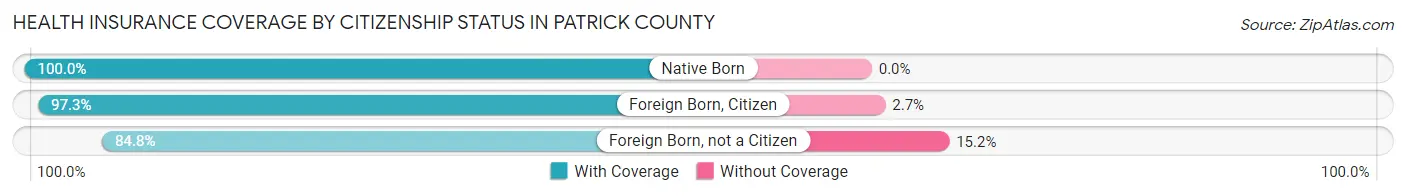
| Citizenship Status | With Coverage | Without Coverage |
| Native Born | 945 (100.0%) | 0 (0.0%) |
| Foreign Born, Citizen | 2,194 (97.3%) | 60 (2.7%) |
| Foreign Born, not a Citizen | 880 (84.8%) | 158 (15.2%) |
Health Insurance Coverage by Household Income in Patrick County
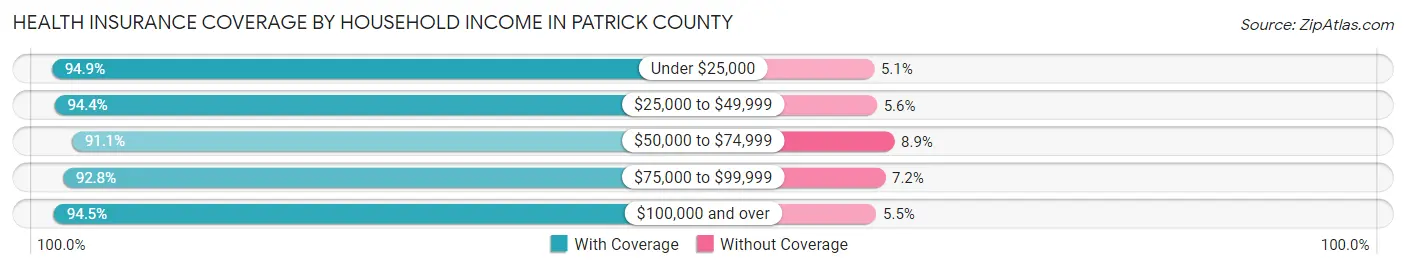
| Household Income | With Coverage | Without Coverage |
| Under $25,000 | 2,273 (94.9%) | 122 (5.1%) |
| $25,000 to $49,999 | 3,962 (94.4%) | 235 (5.6%) |
| $50,000 to $74,999 | 2,356 (91.1%) | 229 (8.9%) |
| $75,000 to $99,999 | 2,397 (92.8%) | 185 (7.2%) |
| $100,000 and over | 5,165 (94.5%) | 300 (5.5%) |
Public vs Private Health Insurance Coverage by Age in Patrick County
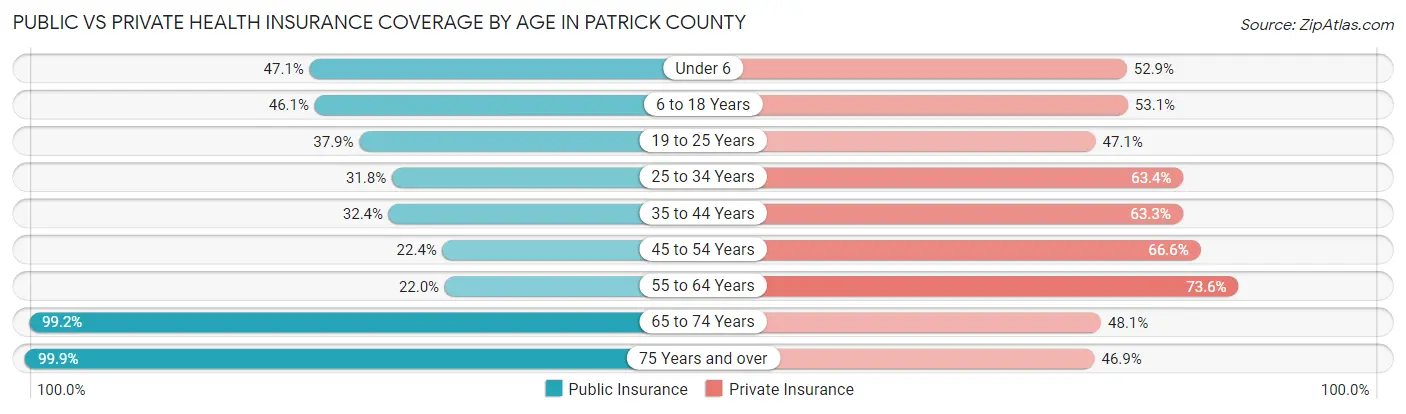
| Age Bracket | Public Insurance | Private Insurance |
| Under 6 | 445 (47.1%) | 500 (52.9%) |
| 6 to 18 Years | 1,040 (46.1%) | 1,197 (53.1%) |
| 19 to 25 Years | 393 (37.9%) | 489 (47.1%) |
| 25 to 34 Years | 430 (31.8%) | 857 (63.4%) |
| 35 to 44 Years | 529 (32.4%) | 1,033 (63.3%) |
| 45 to 54 Years | 573 (22.4%) | 1,703 (66.6%) |
| 55 to 64 Years | 647 (22.0%) | 2,167 (73.6%) |
| 65 to 74 Years | 2,570 (99.2%) | 1,247 (48.1%) |
| 75 Years and over | 1,923 (99.9%) | 903 (46.9%) |
| Total | 8,550 (49.6%) | 10,096 (58.6%) |
Disability Status by Sex by Age in Patrick County
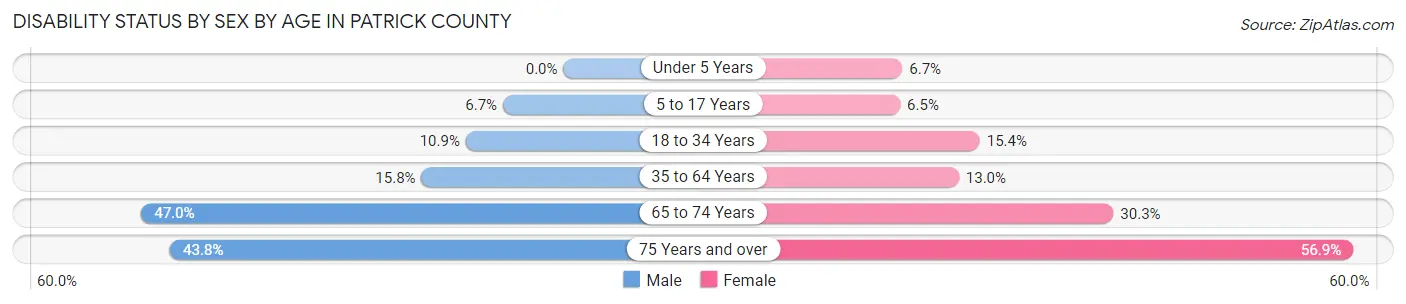
| Age Bracket | Male | Female |
| Under 5 Years | 0 (0.0%) | 25 (6.7%) |
| 5 to 17 Years | 83 (6.7%) | 69 (6.5%) |
| 18 to 34 Years | 142 (10.9%) | 186 (15.4%) |
| 35 to 64 Years | 574 (15.8%) | 457 (13.0%) |
| 65 to 74 Years | 604 (47.0%) | 395 (30.2%) |
| 75 Years and over | 363 (43.8%) | 624 (56.9%) |
Disability Class by Sex by Age in Patrick County
Disability Class: Hearing Difficulty
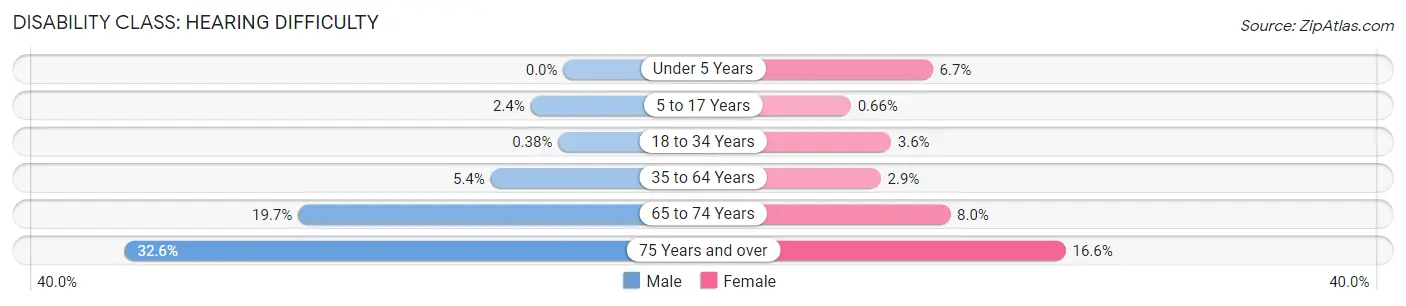
| Age Bracket | Male | Female |
| Under 5 Years | 0 (0.0%) | 25 (6.7%) |
| 5 to 17 Years | 30 (2.4%) | 7 (0.7%) |
| 18 to 34 Years | 5 (0.4%) | 44 (3.6%) |
| 35 to 64 Years | 196 (5.4%) | 101 (2.9%) |
| 65 to 74 Years | 253 (19.7%) | 105 (8.0%) |
| 75 Years and over | 270 (32.6%) | 182 (16.6%) |
Disability Class: Vision Difficulty
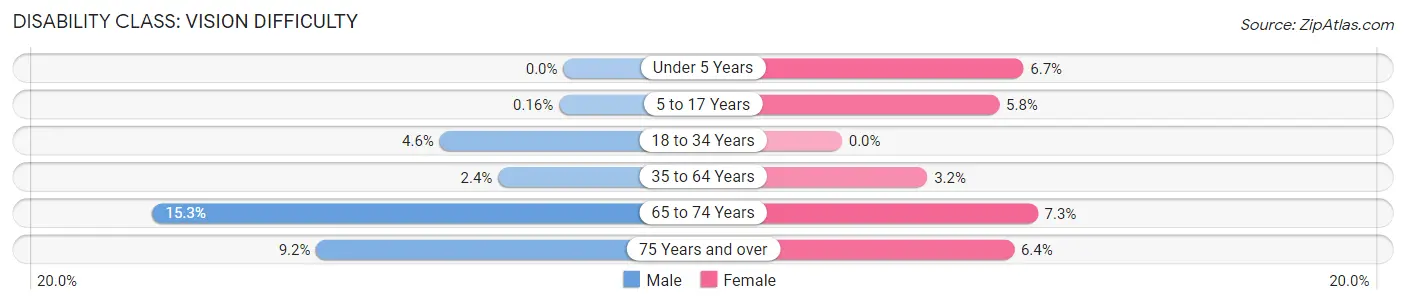
| Age Bracket | Male | Female |
| Under 5 Years | 0 (0.0%) | 25 (6.7%) |
| 5 to 17 Years | 2 (0.2%) | 62 (5.8%) |
| 18 to 34 Years | 60 (4.6%) | 0 (0.0%) |
| 35 to 64 Years | 88 (2.4%) | 111 (3.2%) |
| 65 to 74 Years | 196 (15.2%) | 95 (7.3%) |
| 75 Years and over | 76 (9.2%) | 70 (6.4%) |
Disability Class: Cognitive Difficulty
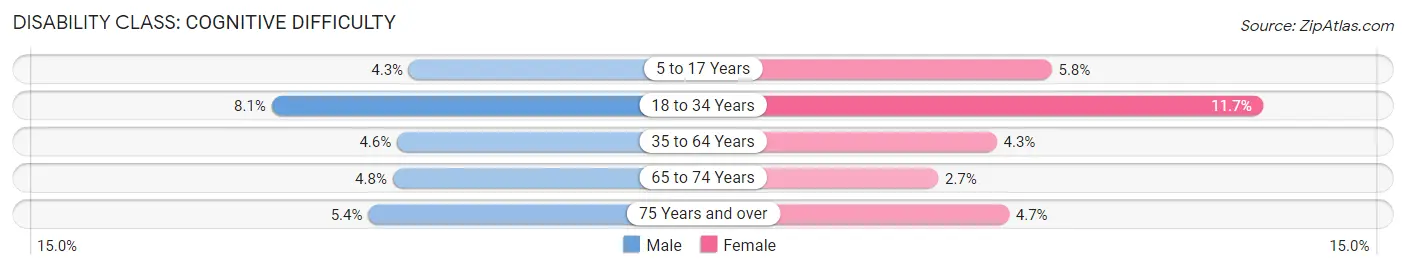
| Age Bracket | Male | Female |
| 5 to 17 Years | 53 (4.3%) | 62 (5.8%) |
| 18 to 34 Years | 106 (8.1%) | 142 (11.7%) |
| 35 to 64 Years | 168 (4.6%) | 151 (4.3%) |
| 65 to 74 Years | 61 (4.8%) | 35 (2.7%) |
| 75 Years and over | 45 (5.4%) | 51 (4.6%) |
Disability Class: Ambulatory Difficulty
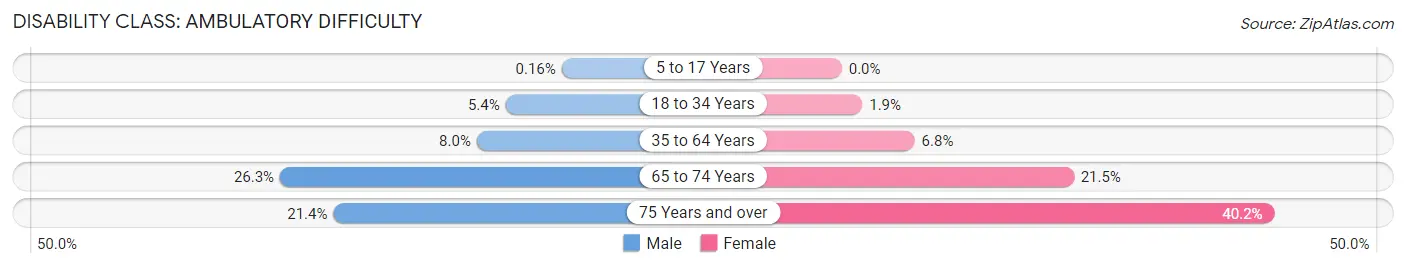
| Age Bracket | Male | Female |
| 5 to 17 Years | 2 (0.2%) | 0 (0.0%) |
| 18 to 34 Years | 70 (5.4%) | 23 (1.9%) |
| 35 to 64 Years | 292 (8.0%) | 237 (6.8%) |
| 65 to 74 Years | 338 (26.3%) | 281 (21.5%) |
| 75 Years and over | 177 (21.3%) | 440 (40.2%) |
Disability Class: Self-Care Difficulty
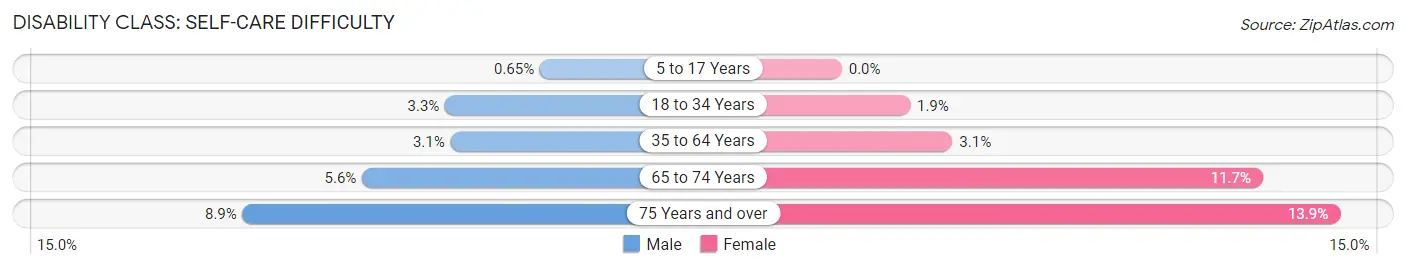
| Age Bracket | Male | Female |
| 5 to 17 Years | 8 (0.6%) | 0 (0.0%) |
| 18 to 34 Years | 43 (3.3%) | 23 (1.9%) |
| 35 to 64 Years | 114 (3.1%) | 108 (3.1%) |
| 65 to 74 Years | 72 (5.6%) | 153 (11.7%) |
| 75 Years and over | 74 (8.9%) | 152 (13.9%) |
Technology Access in Patrick County
Computing Device Access in Patrick County
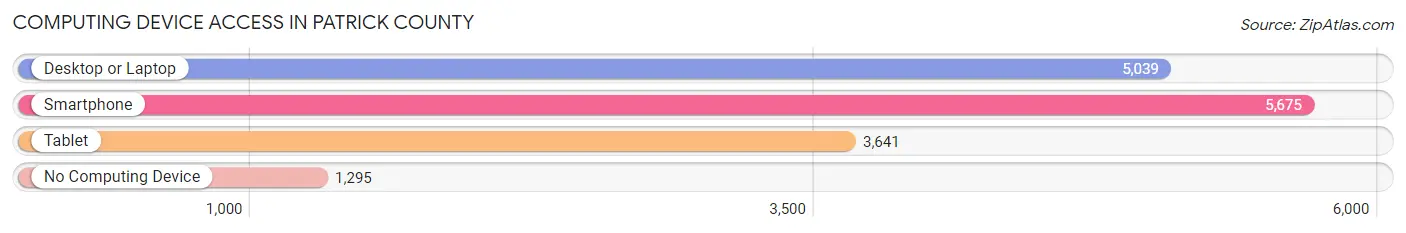
| Device Type | # Households | % Households |
| Desktop or Laptop | 5,039 | 64.8% |
| Smartphone | 5,675 | 73.0% |
| Tablet | 3,641 | 46.8% |
| No Computing Device | 1,295 | 16.7% |
| Total | 7,779 | 100.0% |
Internet Access in Patrick County
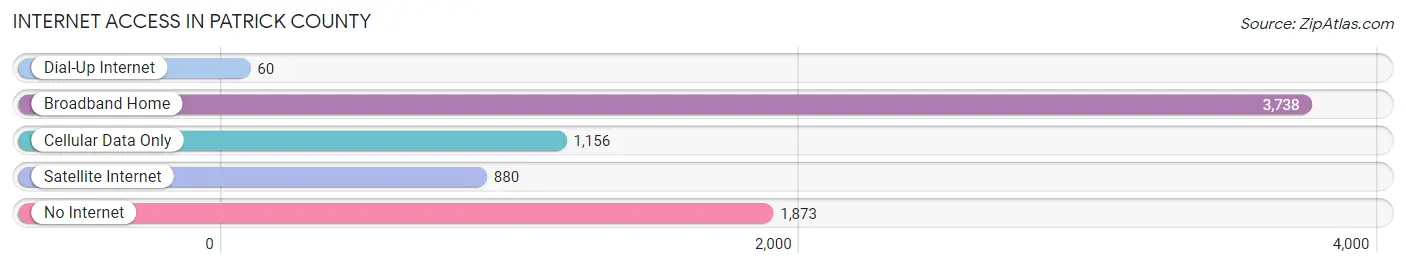
| Internet Type | # Households | % Households |
| Dial-Up Internet | 60 | 0.8% |
| Broadband Home | 3,738 | 48.0% |
| Cellular Data Only | 1,156 | 14.9% |
| Satellite Internet | 880 | 11.3% |
| No Internet | 1,873 | 24.1% |
| Total | 7,779 | 100.0% |
Patrick County Summary
Introduction
Patrick County is located in the Blue Ridge Mountains of southwestern Virginia. It is bordered by the counties of Henry, Franklin, Pittsylvania, and Carroll. The county seat is Stuart, and the county was named for Revolutionary War hero, Patrick Henry. The county has a total area of 437 square miles, and a population of 18,490 as of the 2010 census.
History
Patrick County was formed in 1790 from Henry County. It was named for Patrick Henry, the first Governor of Virginia and a leader of the American Revolution. The county was part of the area known as the “Great Valley” of Virginia, and was home to many Native American tribes, including the Monacan, Saponi, and Tutelo.
The first European settlers arrived in the area in the 1740s, and the county was officially established in 1790. The county was largely agricultural, and the economy was based on tobacco, corn, and livestock. The county was also home to several iron furnaces, which produced iron for the Confederate Army during the Civil War.
Geography
Patrick County is located in the Blue Ridge Mountains of southwestern Virginia. It is bordered by the counties of Henry, Franklin, Pittsylvania, and Carroll. The county has a total area of 437 square miles, and is mostly mountainous, with elevations ranging from 1,000 to 3,000 feet. The county is home to several rivers, including the Smith, Mayo, and Dan, as well as several creeks and streams.
The county is home to several state parks, including Fairy Stone State Park, Philpott Lake, and the Blue Ridge Parkway. The county is also home to several historic sites, including the Patrick Henry Memorial, the Mayo River State Park, and the Stuart Historic District.
Economy
The economy of Patrick County is largely based on agriculture and tourism. The county is home to several farms, which produce tobacco, corn, and livestock. The county is also home to several wineries, which produce wine from locally grown grapes.
The county is also home to several manufacturing companies, including a furniture manufacturer, a plastics manufacturer, and a textile manufacturer. The county is also home to several retail stores, restaurants, and other businesses.
Demographics
As of the 2010 census, Patrick County had a population of 18,490. The population was spread out, with 48.3% male and 51.7% female. The median age was 43.7 years. The racial makeup of the county was 94.2% White, 3.2% African American, 0.4% Native American, 0.3% Asian, 0.1% Pacific Islander, 0.7% from other races, and 1.1% from two or more races.
Conclusion
Patrick County is a rural county located in the Blue Ridge Mountains of southwestern Virginia. It has a population of 18,490, and is largely agricultural, with a strong tourism industry. The county is home to several state parks, historic sites, and manufacturing companies. It is a diverse county, with a mix of races and cultures.
Common Questions
What is Per Capita Income in Patrick County?
Per Capita income in Patrick County is $32,883.
What is the Median Family Income in Patrick County?
Median Family Income in Patrick County is $69,286.
What is the Median Household income in Patrick County?
Median Household Income in Patrick County is $49,180.
What is Income or Wage Gap in Patrick County?
Income or Wage Gap in Patrick County is 24.1%.
Women in Patrick County earn 75.9 cents for every dollar earned by a man.
What is Inequality or Gini Index in Patrick County?
Inequality or Gini Index in Patrick County is 0.48.
What is the Total Population of Patrick County?
Total Population of Patrick County is 17,660.
What is the Total Male Population of Patrick County?
Total Male Population of Patrick County is 8,930.
What is the Total Female Population of Patrick County?
Total Female Population of Patrick County is 8,730.
What is the Ratio of Males per 100 Females in Patrick County?
There are 102.29 Males per 100 Females in Patrick County.
What is the Ratio of Females per 100 Males in Patrick County?
There are 97.76 Females per 100 Males in Patrick County.
What is the Median Population Age in Patrick County?
Median Population Age in Patrick County is 50.9 Years.
What is the Average Family Size in Patrick County
Average Family Size in Patrick County is 2.8 People.
What is the Average Household Size in Patrick County
Average Household Size in Patrick County is 2.2 People.
How Large is the Labor Force in Patrick County?
There are 7,509 People in the Labor Forcein in Patrick County.
What is the Percentage of People in the Labor Force in Patrick County?
50.2% of People are in the Labor Force in Patrick County.
What is the Unemployment Rate in Patrick County?
Unemployment Rate in Patrick County is 2.3%.