Area Code 276 Map & Demographics
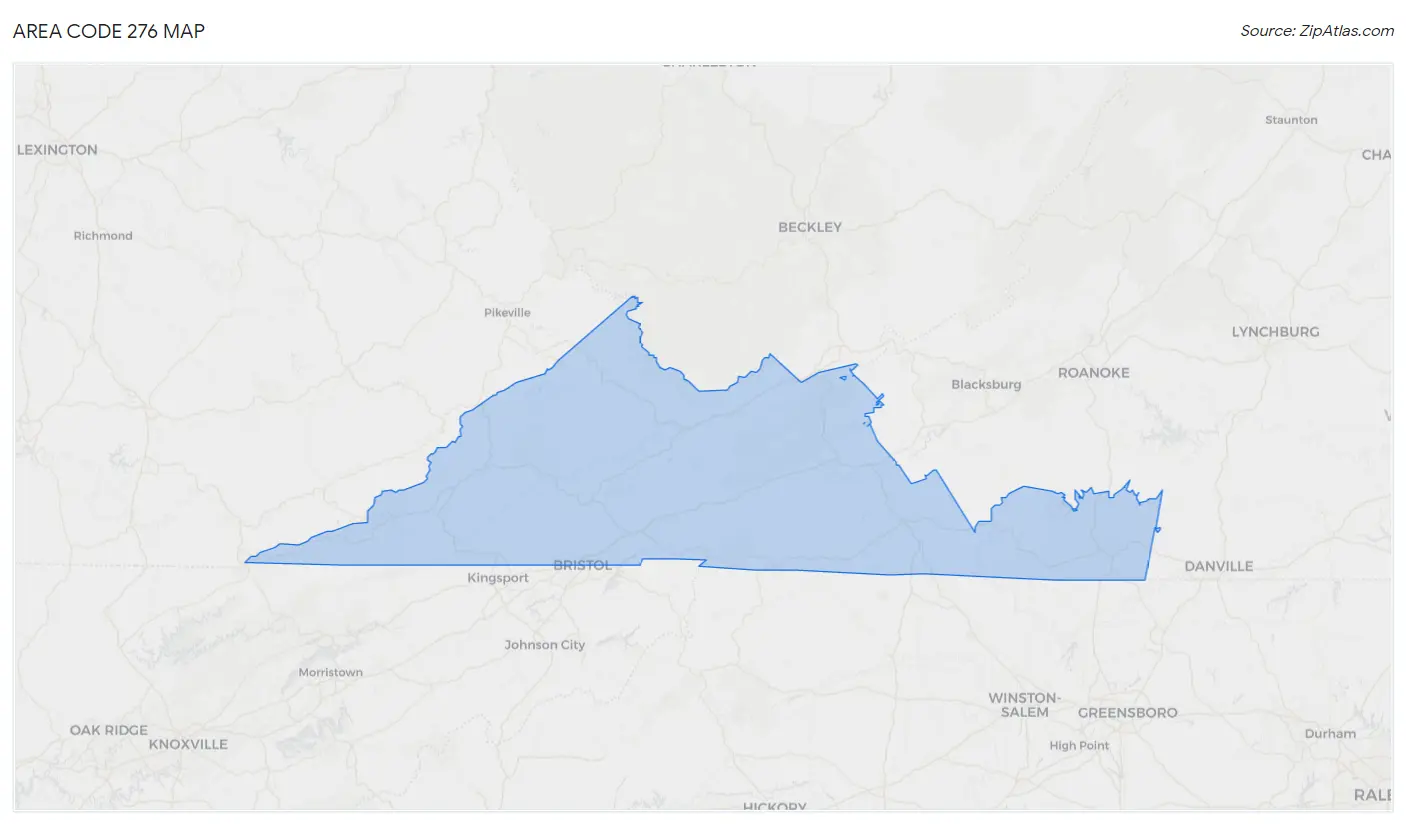
Area Code 276 Map
Area Code 276 Overview
$25,495
PER CAPITA INCOME
$59,129
AVG FAMILY INCOME
$46,240
AVG HOUSEHOLD INCOME
27.4%
WAGE / INCOME GAP [ % ]
72.6¢/ $1
WAGE / INCOME GAP [ $ ]
$10,262
FAMILY INCOME DEFICIT
46.55
INEQUALITY / GINI INDEX
451,261
TOTAL POPULATION
226,183
MALE POPULATION
225,078
FEMALE POPULATION
100.49
MALES / 100 FEMALES
99.51
FEMALES / 100 MALES
47.7
MEDIAN AGE
3.0
AVG FAMILY SIZE
2.5
AVG HOUSEHOLD SIZE
168,801
LABOR FORCE [ PEOPLE ]
44.8%
PERCENT IN LABOR FORCE
7.8%
UNEMPLOYMENT RATE
Income in Area Code 276
Income Overview in Area Code 276
Per Capita Income in Area Code 276 is $25,495, while median incomes of families and households are $59,129 and $46,240 respectively.
| Characteristic | Number | Measure |
| Per Capita Income | 451,261 | $25,495 |
| Median Family Income | 116,481 | $59,129 |
| Mean Family Income | 116,481 | $7,763,117 |
| Median Household Income | 182,832 | $46,240 |
| Mean Household Income | 182,832 | $6,513,281 |
| Income Deficit | 116,481 | $10,262 |
| Wage / Income Gap (%) | 451,261 | 27.39% |
| Wage / Income Gap ($) | 451,261 | 72.61¢ per $1 |
| Gini / Inequality Index | 451,261 | 46.55 |
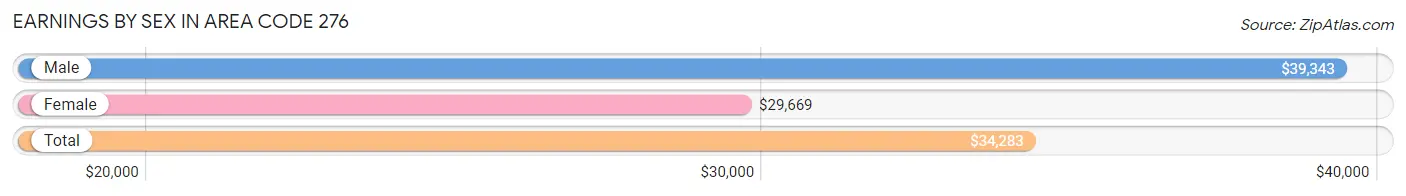
Earnings by Sex in Area Code 276
Average Earnings in Area Code 276 are $34,283, $39,343 for men and $29,669 for women, a difference of 24.6%.
| Sex | Number | Average Earnings |
| Male | 102,671 (52.9%) | $39,343 |
| Female | 91,376 (47.1%) | $29,669 |
| Total | 194,047 (100.0%) | $34,283 |
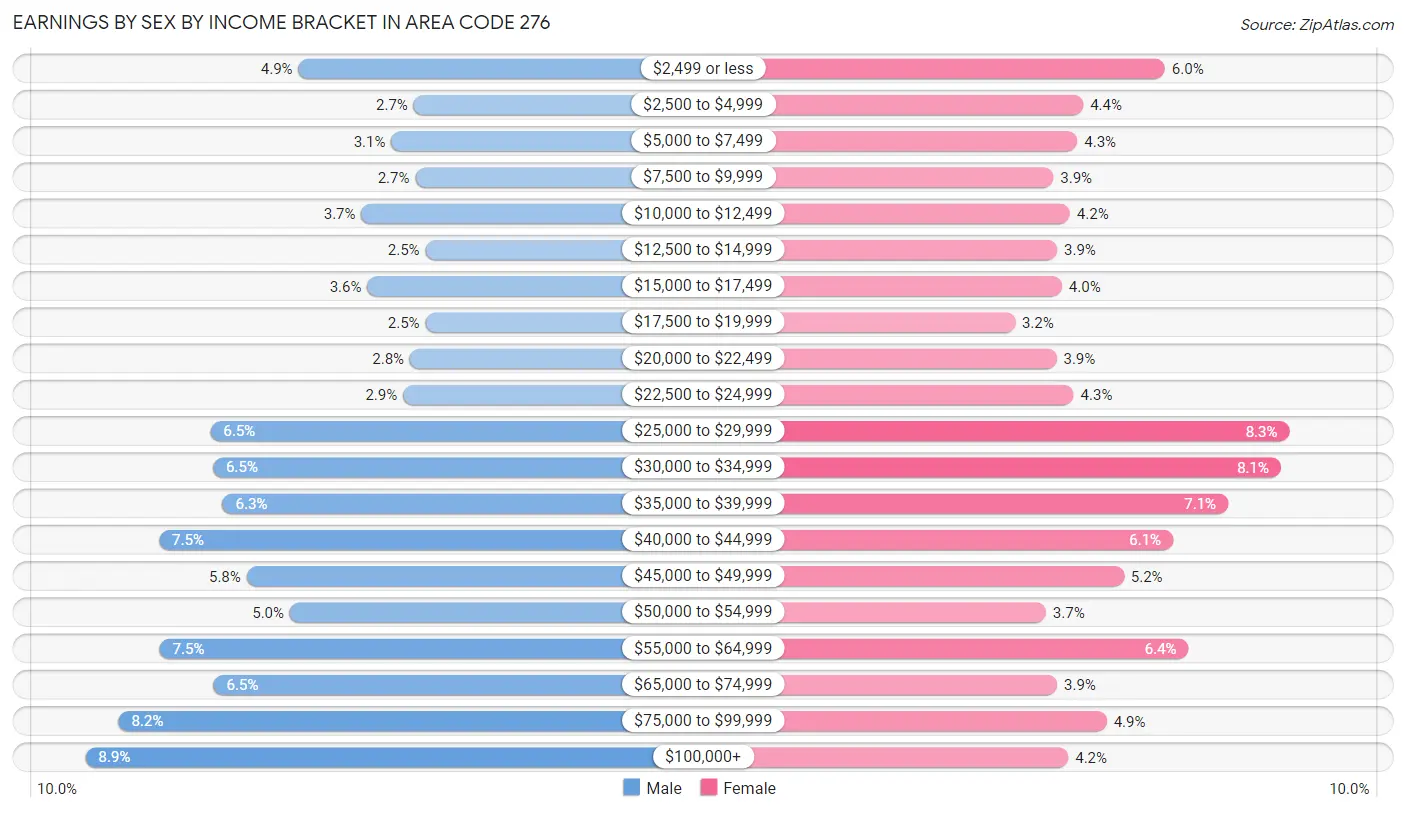
Earnings by Sex by Income Bracket in Area Code 276
The most common earnings brackets in Area Code 276 are $100,000+ for men (9,096 | 8.9%) and $25,000 to $29,999 for women (7,574 | 8.3%).
| Income | Male | Female |
| $2,499 or less | 5,004 (4.9%) | 5,445 (6.0%) |
| $2,500 to $4,999 | 2,778 (2.7%) | 4,052 (4.4%) |
| $5,000 to $7,499 | 3,212 (3.1%) | 3,949 (4.3%) |
| $7,500 to $9,999 | 2,752 (2.7%) | 3,538 (3.9%) |
| $10,000 to $12,499 | 3,788 (3.7%) | 3,823 (4.2%) |
| $12,500 to $14,999 | 2,557 (2.5%) | 3,598 (3.9%) |
| $15,000 to $17,499 | 3,677 (3.6%) | 3,682 (4.0%) |
| $17,500 to $19,999 | 2,559 (2.5%) | 2,874 (3.2%) |
| $20,000 to $22,499 | 2,854 (2.8%) | 3,587 (3.9%) |
| $22,500 to $24,999 | 2,987 (2.9%) | 3,881 (4.3%) |
| $25,000 to $29,999 | 6,699 (6.5%) | 7,574 (8.3%) |
| $30,000 to $34,999 | 6,639 (6.5%) | 7,425 (8.1%) |
| $35,000 to $39,999 | 6,462 (6.3%) | 6,522 (7.1%) |
| $40,000 to $44,999 | 7,680 (7.5%) | 5,586 (6.1%) |
| $45,000 to $49,999 | 5,998 (5.8%) | 4,738 (5.2%) |
| $50,000 to $54,999 | 5,167 (5.0%) | 3,405 (3.7%) |
| $55,000 to $64,999 | 7,673 (7.5%) | 5,850 (6.4%) |
| $65,000 to $74,999 | 6,632 (6.5%) | 3,602 (3.9%) |
| $75,000 to $99,999 | 8,457 (8.2%) | 4,452 (4.9%) |
| $100,000+ | 9,096 (8.9%) | 3,793 (4.2%) |
| Total | 102,671 (100.0%) | 91,376 (100.0%) |
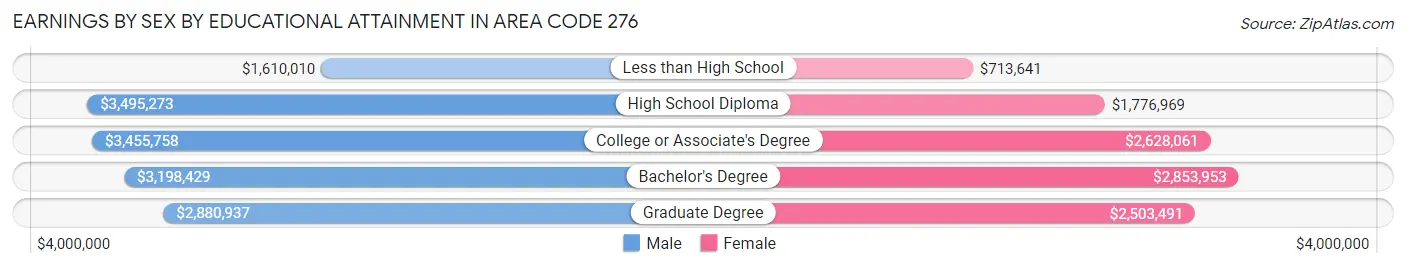
Earnings by Sex by Educational Attainment in Area Code 276
Average earnings in Area Code 276 are $4,117,646 for men and $3,060,752 for women, a difference of 25.7%. Men with an educational attainment of high school diploma enjoy the highest average annual earnings of $3,495,273, while those with less than high school education earn the least with $1,610,010. Women with an educational attainment of bachelor's degree earn the most with the average annual earnings of $2,853,953, while those with less than high school education have the smallest earnings of $713,641.
| Educational Attainment | Male Income | Female Income |
| Less than High School | $1,610,010 | $713,641 |
| High School Diploma | $3,495,273 | $1,776,969 |
| College or Associate's Degree | $3,455,758 | $2,628,061 |
| Bachelor's Degree | $3,198,429 | $2,853,953 |
| Graduate Degree | $2,880,937 | $2,503,491 |
| Total | $4,117,646 | $3,060,752 |
Family Income in Area Code 276
Family Income Brackets in Area Code 276
According to the Area Code 276 family income data, there are 2,606,728 families falling into the $50,000 to $74,999 income range, which is the most common income bracket and makes up 2,237.9% of all families. Conversely, the $200,000+ income bracket is the least frequent group with only 350,608 families (301.0%) belonging to this category.
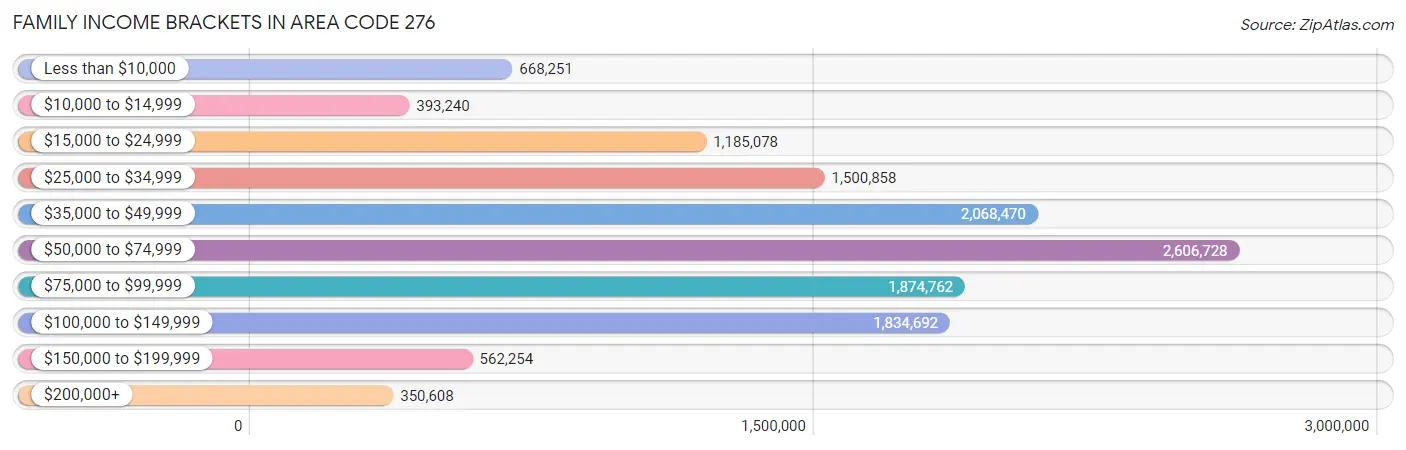
| Income Bracket | # Families | % Families |
| Less than $10,000 | 668,251 | 573.7% |
| $10,000 to $14,999 | 393,240 | 337.6% |
| $15,000 to $24,999 | 1,185,078 | 1,017.4% |
| $25,000 to $34,999 | 1,500,858 | 1,288.5% |
| $35,000 to $49,999 | 2,068,470 | 1,775.8% |
| $50,000 to $74,999 | 2,606,728 | 2,237.9% |
| $75,000 to $99,999 | 1,874,762 | 1,609.5% |
| $100,000 to $149,999 | 1,834,692 | 1,575.1% |
| $150,000 to $199,999 | 562,254 | 482.7% |
| $200,000+ | 350,608 | 301.0% |
Family Income by Famaliy Size in Area Code 276
4-person families (16,166 | 13.9%) account for the highest median family income in Area Code 276 with $89,056 per family, while 2-person families (64,924 | 55.7%) have the highest median income of $27,974 per family member.
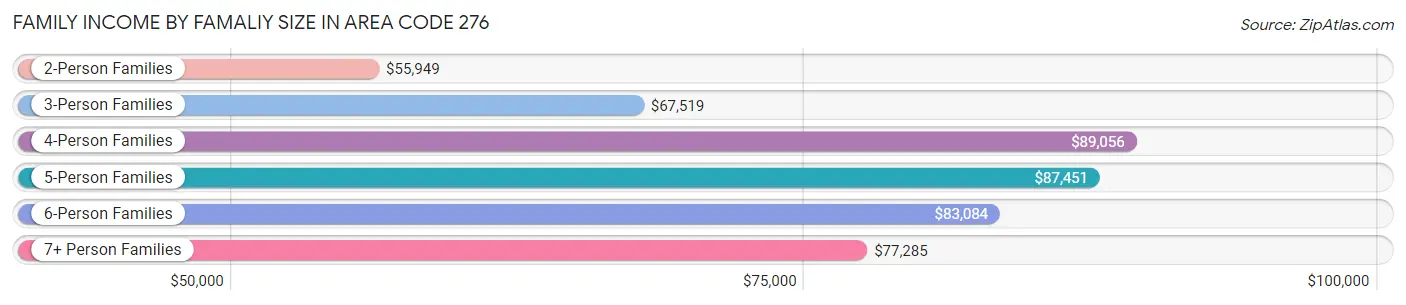
| Income Bracket | # Families | Median Income |
| 2-Person Families | 64,924 (55.7%) | $55,949 |
| 3-Person Families | 25,905 (22.2%) | $67,519 |
| 4-Person Families | 16,166 (13.9%) | $89,056 |
| 5-Person Families | 6,425 (5.5%) | $87,451 |
| 6-Person Families | 2,128 (1.8%) | $83,084 |
| 7+ Person Families | 933 (0.8%) | $77,285 |
| Total | 116,481 (100.0%) | $59,129 |
Family Income by Number of Earners in Area Code 276
The median family income in Area Code 276 is $59,129, with families comprising 3+ earners (8,226) having the highest median family income of $123,054, while families with no earners (31,645) have the lowest median family income of $36,102, accounting for 7.1% and 27.2% of families, respectively.
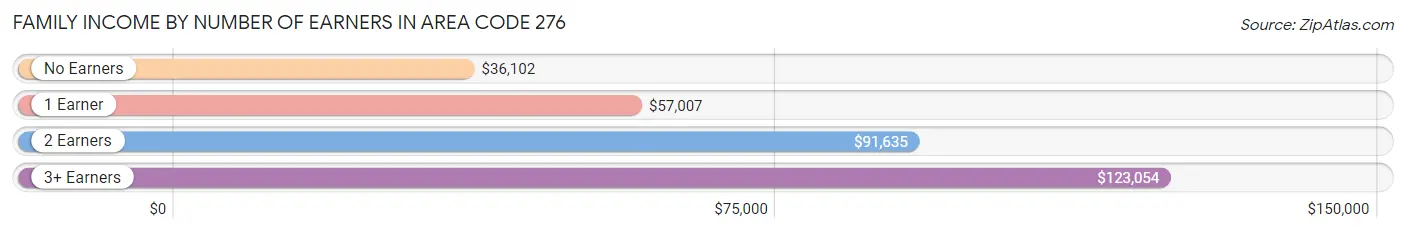
| Number of Earners | # Families | Median Income |
| No Earners | 31,645 (27.2%) | $36,102 |
| 1 Earner | 38,290 (32.9%) | $57,007 |
| 2 Earners | 38,320 (32.9%) | $91,635 |
| 3+ Earners | 8,226 (7.1%) | $123,054 |
| Total | 116,481 (100.0%) | $59,129 |
Household Income in Area Code 276
Household Income Brackets in Area Code 276
With 3,599,048 households falling in the category, the $50,000 to $74,999 income range is the most frequent in Area Code 276, accounting for 1,968.5% of all households. In contrast, only 422,159 households (230.9%) fall into the $200,000+ income bracket, making it the least populous group.
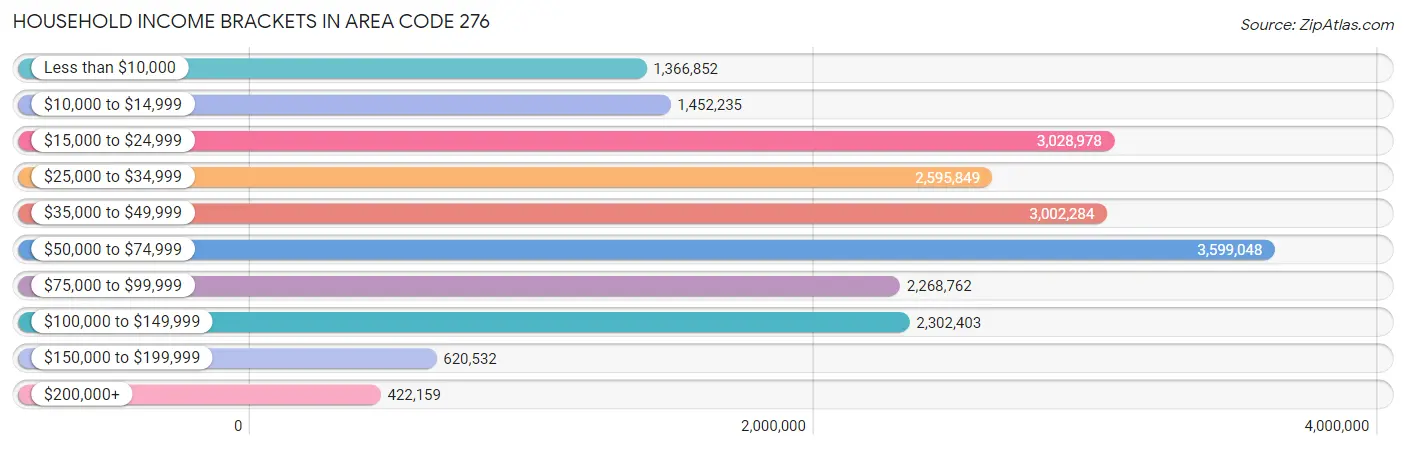
| Income Bracket | # Households | % Households |
| Less than $10,000 | 1,366,852 | 747.6% |
| $10,000 to $14,999 | 1,452,235 | 794.3% |
| $15,000 to $24,999 | 3,028,978 | 1,656.7% |
| $25,000 to $34,999 | 2,595,849 | 1,419.8% |
| $35,000 to $49,999 | 3,002,284 | 1,642.1% |
| $50,000 to $74,999 | 3,599,048 | 1,968.5% |
| $75,000 to $99,999 | 2,268,762 | 1,240.9% |
| $100,000 to $149,999 | 2,302,403 | 1,259.3% |
| $150,000 to $199,999 | 620,532 | 339.4% |
| $200,000+ | 422,159 | 230.9% |
Household Income by Householder Age in Area Code 276
The median household income in Area Code 276 is $46,240, with the highest median household income of $61,754 found in the 25 to 44 years age bracket for the primary householder. A total of 42,191 households (23.1%) fall into this category. Meanwhile, the 65+ years age bracket for the primary householder has the lowest median household income of $37,509, with 66,014 households (36.1%) in this group.
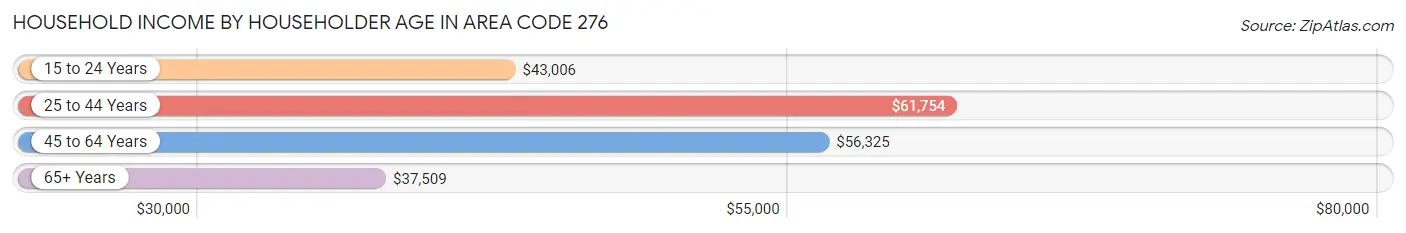
| Income Bracket | # Households | Median Income |
| 15 to 24 Years | 5,602 (3.1%) | $43,006 |
| 25 to 44 Years | 42,191 (23.1%) | $61,754 |
| 45 to 64 Years | 69,025 (37.8%) | $56,325 |
| 65+ Years | 66,014 (36.1%) | $37,509 |
| Total | 182,832 (100.0%) | $46,240 |
Poverty in Area Code 276
Income Below Poverty by Sex and Age in Area Code 276
With 16.5% poverty level for males and 19.4% for females among the residents of Area Code 276, 5 year old males and 15 year old females are the most vulnerable to poverty, with 631 males (27.7%) and 760 females (27.4%) in their respective age groups living below the poverty level.
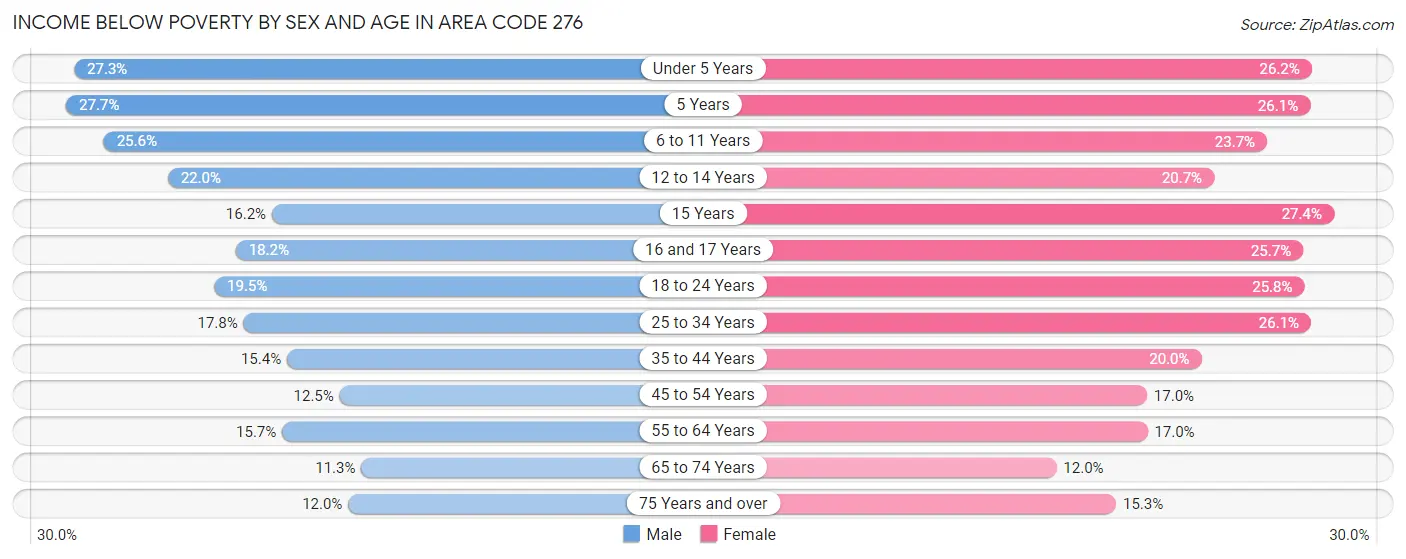
| Age Bracket | Male | Female |
| Under 5 Years | 2,809 (27.3%) | 2,546 (26.2%) |
| 5 Years | 631 (27.7%) | 595 (26.1%) |
| 6 to 11 Years | 3,630 (25.6%) | 3,184 (23.7%) |
| 12 to 14 Years | 1,780 (22.0%) | 1,493 (20.7%) |
| 15 Years | 520 (16.2%) | 760 (27.4%) |
| 16 and 17 Years | 903 (18.2%) | 1,308 (25.7%) |
| 18 to 24 Years | 3,184 (19.5%) | 3,996 (25.8%) |
| 25 to 34 Years | 4,195 (17.8%) | 5,857 (26.1%) |
| 35 to 44 Years | 3,761 (15.4%) | 4,900 (20.0%) |
| 45 to 54 Years | 3,641 (12.5%) | 4,909 (17.0%) |
| 55 to 64 Years | 5,095 (15.7%) | 5,774 (17.0%) |
| 65 to 74 Years | 3,150 (11.3%) | 3,650 (11.9%) |
| 75 Years and over | 2,137 (12.0%) | 3,712 (15.3%) |
| Total | 35,436 (16.5%) | 42,684 (19.4%) |
Income Above Poverty by Sex and Age in Area Code 276
According to the poverty statistics in Area Code 276, males aged 65 to 74 years and females aged 65 to 74 years are the age groups that are most secure financially, with 88.7% of males and 88.0% of females in these age groups living above the poverty line.
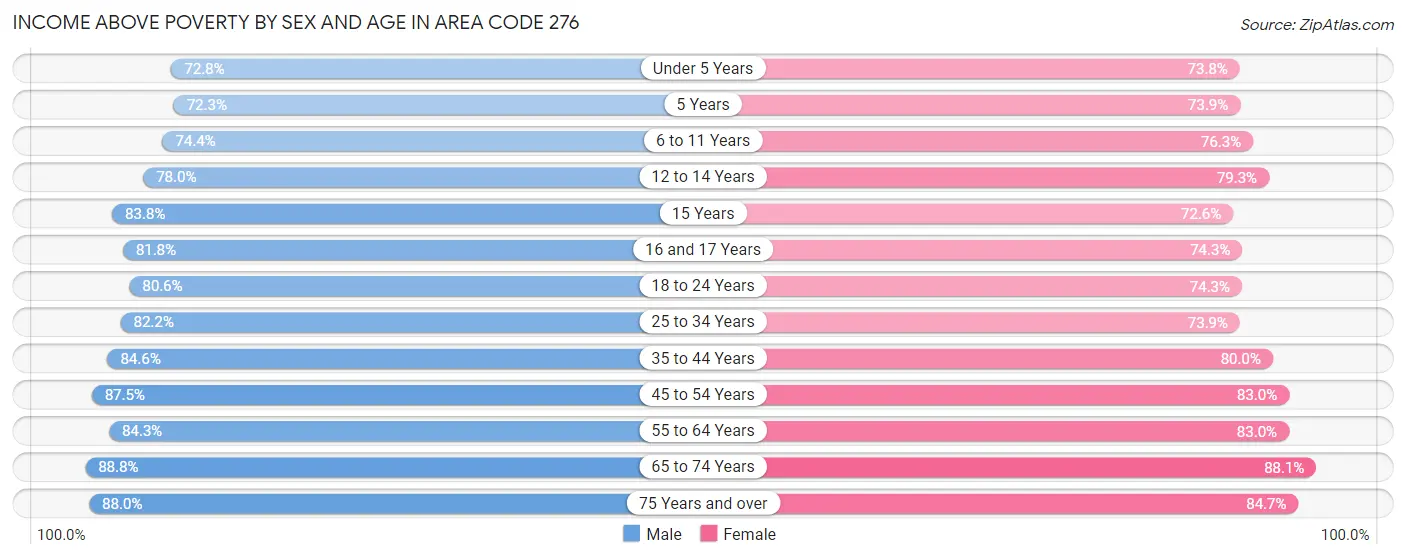
| Age Bracket | Male | Female |
| Under 5 Years | 7,498 (72.8%) | 7,188 (73.8%) |
| 5 Years | 1,648 (72.3%) | 1,687 (73.9%) |
| 6 to 11 Years | 10,555 (74.4%) | 10,270 (76.3%) |
| 12 to 14 Years | 6,300 (78.0%) | 5,711 (79.3%) |
| 15 Years | 2,683 (83.8%) | 2,015 (72.6%) |
| 16 and 17 Years | 4,047 (81.8%) | 3,785 (74.3%) |
| 18 to 24 Years | 13,185 (80.5%) | 11,521 (74.3%) |
| 25 to 34 Years | 19,359 (82.2%) | 16,565 (73.9%) |
| 35 to 44 Years | 20,673 (84.6%) | 19,574 (80.0%) |
| 45 to 54 Years | 25,585 (87.5%) | 23,980 (83.0%) |
| 55 to 64 Years | 27,430 (84.3%) | 28,151 (83.0%) |
| 65 to 74 Years | 24,838 (88.7%) | 26,891 (88.0%) |
| 75 Years and over | 15,698 (88.0%) | 20,595 (84.7%) |
| Total | 179,499 (83.5%) | 177,933 (80.6%) |
Income Below Poverty Among Married-Couple Families in Area Code 276
The poverty statistics for married-couple families in Area Code 276 show that 7.5% or 6,459 of the total 86,396 families live below the poverty line. Families with 5 or more children have the highest poverty rate of 45.3%, comprising of 192 families. On the other hand, families with no children have the lowest poverty rate of 6.4%, which includes 3,727 families.
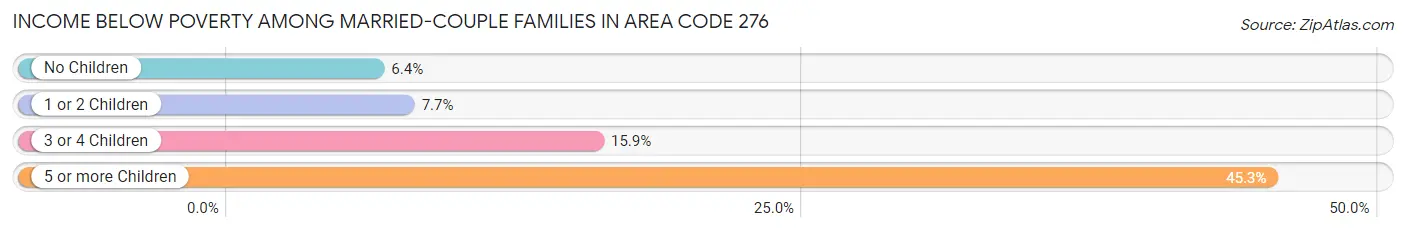
| Children | Above Poverty | Below Poverty |
| No Children | 54,736 (93.6%) | 3,727 (6.4%) |
| 1 or 2 Children | 20,647 (92.3%) | 1,721 (7.7%) |
| 3 or 4 Children | 4,322 (84.1%) | 819 (15.9%) |
| 5 or more Children | 232 (54.7%) | 192 (45.3%) |
| Total | 79,937 (92.5%) | 6,459 (7.5%) |
Income Below Poverty Among Single-Parent Households in Area Code 276
According to the poverty data in Area Code 276, 20.4% or 1,784 single-father households and 32.5% or 6,938 single-mother households are living below the poverty line. Among single-father households, those with 3 or 4 children have the highest poverty rate, with 331 households (43.6%) experiencing poverty. Likewise, among single-mother households, those with 3 or 4 children have the highest poverty rate, with 1,021 households (70.5%) falling below the poverty line.
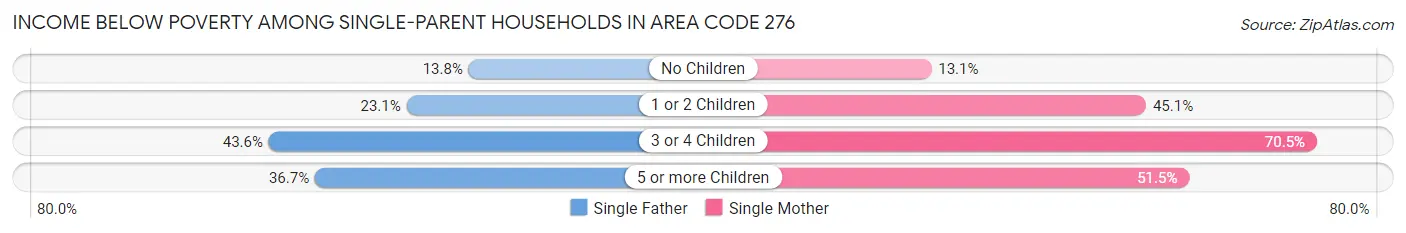
| Children | Single Father | Single Mother |
| No Children | 592 (13.8%) | 1,246 (13.1%) |
| 1 or 2 Children | 843 (23.1%) | 4,619 (45.1%) |
| 3 or 4 Children | 331 (43.6%) | 1,021 (70.5%) |
| 5 or more Children | 18 (36.7%) | 52 (51.5%) |
| Total | 1,784 (20.4%) | 6,938 (32.5%) |
Income Below Poverty Among Married-Couple vs Single-Parent Households in Area Code 276
The poverty data for Area Code 276 shows that 6,459 of the married-couple family households (7.5%) and 8,722 of the single-parent households (29.0%) are living below the poverty level. Within the married-couple family households, those with 5 or more children have the highest poverty rate, with 192 households (45.3%) falling below the poverty line. Among the single-parent households, those with 3 or 4 children have the highest poverty rate, with 1,352 household (61.3%) living below poverty.
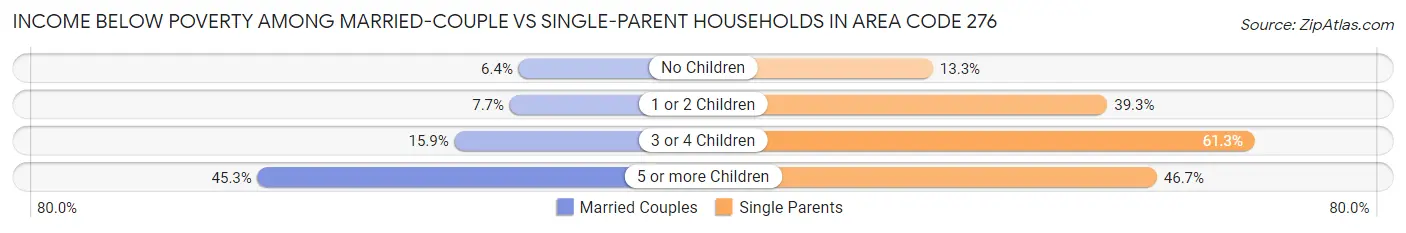
| Children | Married-Couple Families | Single-Parent Households |
| No Children | 3,727 (6.4%) | 1,838 (13.3%) |
| 1 or 2 Children | 1,721 (7.7%) | 5,462 (39.3%) |
| 3 or 4 Children | 819 (15.9%) | 1,352 (61.3%) |
| 5 or more Children | 192 (45.3%) | 70 (46.7%) |
| Total | 6,459 (7.5%) | 8,722 (29.0%) |
Race in Area Code 276
The most populous races in Area Code 276 are White / Caucasian (403,749 | 89.5%), Black / African American (29,812 | 6.6%), and Hispanic or Latino (12,744 | 2.8%).
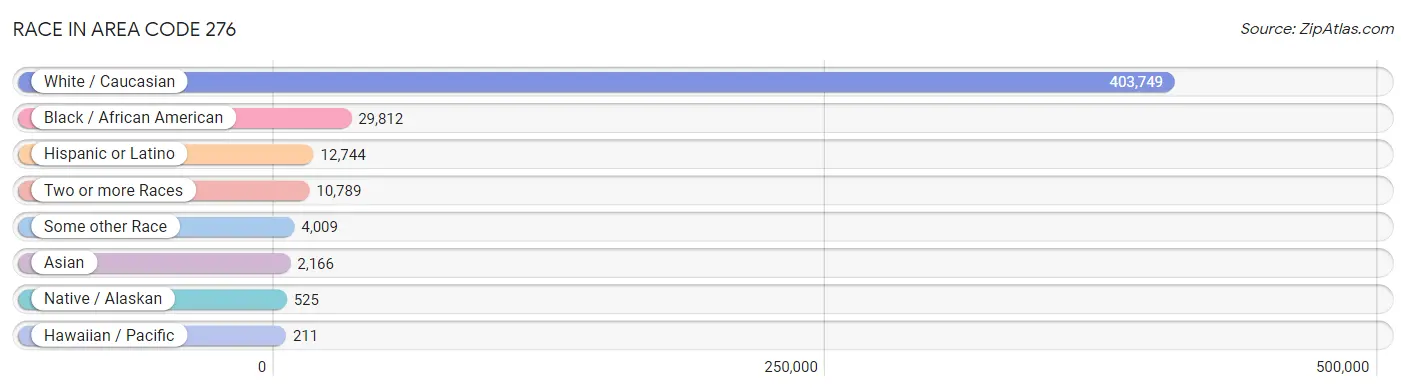
| Race | # Population | % Population |
| Asian | 2,166 | 0.5% |
| Black / African American | 29,812 | 6.6% |
| Hawaiian / Pacific | 211 | 0.1% |
| Hispanic or Latino | 12,744 | 2.8% |
| Native / Alaskan | 525 | 0.1% |
| White / Caucasian | 403,749 | 89.5% |
| Two or more Races | 10,789 | 2.4% |
| Some other Race | 4,009 | 0.9% |
| Total | 451,261 | 100.0% |
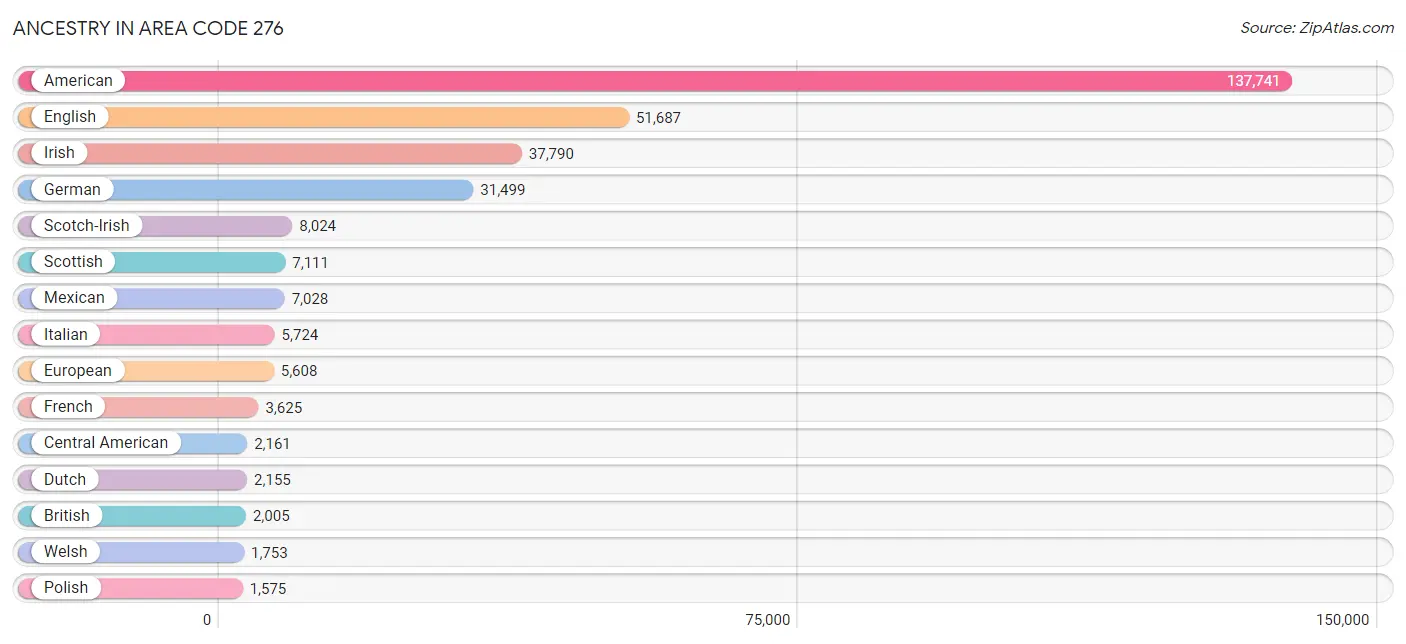
Ancestry in Area Code 276
The most populous ancestries reported in Area Code 276 are American (137,741 | 30.5%), English (51,687 | 11.5%), Irish (37,790 | 8.4%), German (31,499 | 7.0%), and Scotch-Irish (8,024 | 1.8%), together accounting for 59.1% of all Area Code 276 residents.
| Ancestry | # Population | % Population |
| African | 722 | 0.2% |
| Albanian | 12 | 0.0% |
| American | 137,741 | 30.5% |
| Apache | 33 | 0.0% |
| Arab | 683 | 0.2% |
| Argentinean | 14 | 0.0% |
| Assyrian / Chaldean / Syriac | 11 | 0.0% |
| Austrian | 255 | 0.1% |
| Barbadian | 5 | 0.0% |
| Basque | 17 | 0.0% |
| Belgian | 63 | 0.0% |
| Belizean | 37 | 0.0% |
| Bermudan | 19 | 0.0% |
| Bhutanese | 208 | 0.1% |
| Blackfeet | 82 | 0.0% |
| Bolivian | 131 | 0.0% |
| Brazilian | 99 | 0.0% |
| British | 2,005 | 0.4% |
| British West Indian | 14 | 0.0% |
| Burmese | 284 | 0.1% |
| Cajun | 30 | 0.0% |
| Cambodian | 10 | 0.0% |
| Canadian | 246 | 0.1% |
| Celtic | 24 | 0.0% |
| Central American | 2,161 | 0.5% |
| Central American Indian | 57 | 0.0% |
| Cherokee | 1,119 | 0.3% |
| Chickasaw | 7 | 0.0% |
| Chippewa | 74 | 0.0% |
| Choctaw | 17 | 0.0% |
| Colombian | 125 | 0.0% |
| Cree | 16 | 0.0% |
| Creek | 8 | 0.0% |
| Croatian | 52 | 0.0% |
| Cuban | 135 | 0.0% |
| Czech | 106 | 0.0% |
| Czechoslovakian | 49 | 0.0% |
| Danish | 128 | 0.0% |
| Delaware | 9 | 0.0% |
| Dominican | 88 | 0.0% |
| Dutch | 2,155 | 0.5% |
| Dutch West Indian | 31 | 0.0% |
| Eastern European | 315 | 0.1% |
| Ecuadorian | 36 | 0.0% |
| Egyptian | 259 | 0.1% |
| English | 51,687 | 11.5% |
| Ethiopian | 39 | 0.0% |
| European | 5,608 | 1.2% |
| Filipino | 10 | 0.0% |
| Finnish | 140 | 0.0% |
| French | 3,625 | 0.8% |
| French American Indian | 8 | 0.0% |
| French Canadian | 541 | 0.1% |
| German | 31,499 | 7.0% |
| Ghanaian | 25 | 0.0% |
| Greek | 261 | 0.1% |
| Guamanian / Chamorro | 33 | 0.0% |
| Guatemalan | 459 | 0.1% |
| Haitian | 694 | 0.2% |
| Honduran | 867 | 0.2% |
| Hungarian | 674 | 0.2% |
| Indian (Asian) | 277 | 0.1% |
| Iranian | 45 | 0.0% |
| Iraqi | 2 | 0.0% |
| Irish | 37,790 | 8.4% |
| Iroquois | 4 | 0.0% |
| Israeli | 25 | 0.0% |
| Italian | 5,724 | 1.3% |
| Jamaican | 130 | 0.0% |
| Japanese | 15 | 0.0% |
| Jordanian | 19 | 0.0% |
| Kenyan | 60 | 0.0% |
| Korean | 552 | 0.1% |
| Laotian | 9 | 0.0% |
| Latvian | 4 | 0.0% |
| Lebanese | 159 | 0.0% |
| Lithuanian | 221 | 0.1% |
| Lumbee | 13 | 0.0% |
| Mexican | 7,028 | 1.6% |
| Mexican American Indian | 61 | 0.0% |
| Mongolian | 3 | 0.0% |
| Moroccan | 121 | 0.0% |
| Native Hawaiian | 176 | 0.0% |
| Navajo | 124 | 0.0% |
| New Zealander | 26 | 0.0% |
| Nicaraguan | 77 | 0.0% |
| Nigerian | 118 | 0.0% |
| Northern European | 324 | 0.1% |
| Norwegian | 810 | 0.2% |
| Okinawan | 13 | 0.0% |
| Pakistani | 91 | 0.0% |
| Palestinian | 9 | 0.0% |
| Panamanian | 28 | 0.0% |
| Pennsylvania German | 60 | 0.0% |
| Peruvian | 130 | 0.0% |
| Polish | 1,575 | 0.4% |
| Portuguese | 262 | 0.1% |
| Puerto Rican | 1,426 | 0.3% |
| Romanian | 109 | 0.0% |
| Russian | 585 | 0.1% |
| Salvadoran | 730 | 0.2% |
| Samoan | 50 | 0.0% |
| Scandinavian | 487 | 0.1% |
| Scotch-Irish | 8,024 | 1.8% |
| Scottish | 7,111 | 1.6% |
| Seminole | 36 | 0.0% |
| Sioux | 37 | 0.0% |
| Slavic | 15 | 0.0% |
| Slovak | 68 | 0.0% |
| Slovene | 25 | 0.0% |
| South African | 90 | 0.0% |
| South American | 491 | 0.1% |
| South American Indian | 14 | 0.0% |
| Spaniard | 535 | 0.1% |
| Spanish | 244 | 0.1% |
| Spanish American | 23 | 0.0% |
| Sri Lankan | 189 | 0.0% |
| Subsaharan African | 1,124 | 0.3% |
| Swedish | 789 | 0.2% |
| Swiss | 616 | 0.1% |
| Syrian | 40 | 0.0% |
| Thai | 1,211 | 0.3% |
| Trinidadian and Tobagonian | 77 | 0.0% |
| Turkish | 34 | 0.0% |
| U.S. Virgin Islander | 14 | 0.0% |
| Ugandan | 4 | 0.0% |
| Ukrainian | 191 | 0.0% |
| Uruguayan | 46 | 0.0% |
| Venezuelan | 9 | 0.0% |
| Vietnamese | 14 | 0.0% |
| Welsh | 1,753 | 0.4% |
| West Indian | 7 | 0.0% |
| Yugoslavian | 27 | 0.0% | View All 133 Rows |
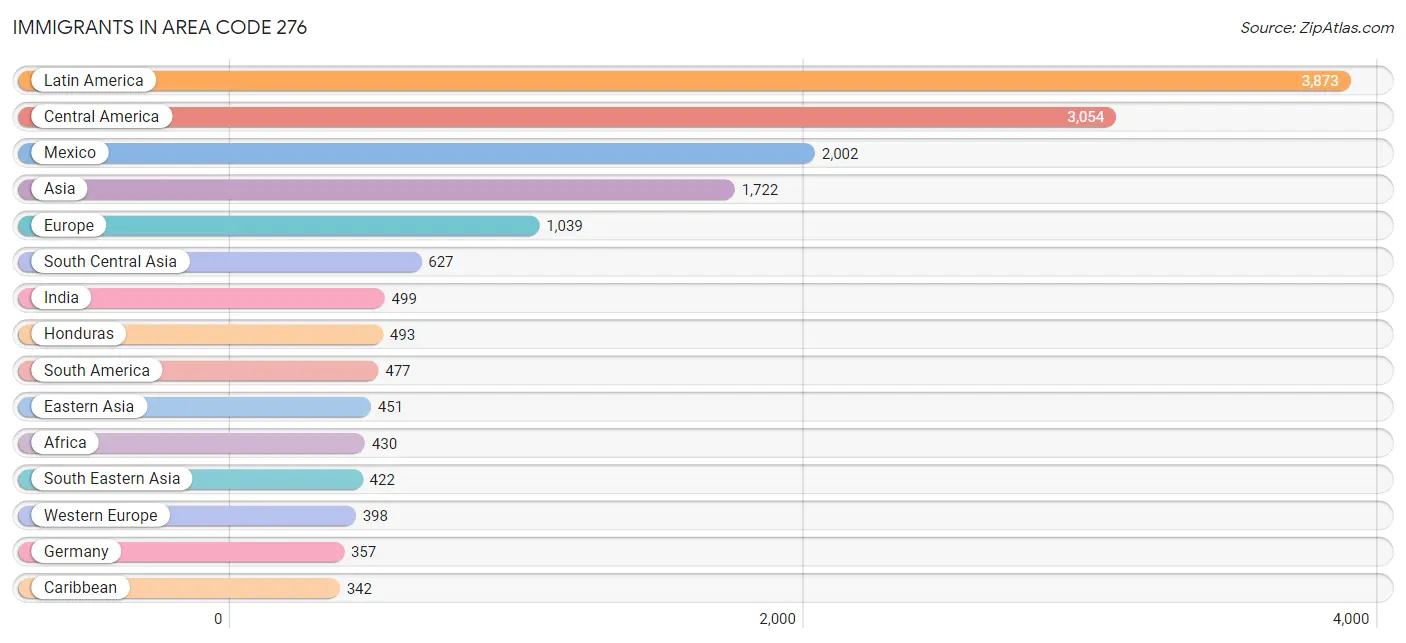
Immigrants in Area Code 276
The most numerous immigrant groups reported in Area Code 276 came from Latin America (3,873 | 0.9%), Central America (3,054 | 0.7%), Mexico (2,002 | 0.4%), Asia (1,722 | 0.4%), and Europe (1,039 | 0.2%), together accounting for 2.6% of all Area Code 276 residents.
| Immigration Origin | # Population | % Population |
| Afghanistan | 1 | 0.0% |
| Africa | 430 | 0.1% |
| Argentina | 21 | 0.0% |
| Asia | 1,722 | 0.4% |
| Australia | 16 | 0.0% |
| Bahamas | 17 | 0.0% |
| Bangladesh | 20 | 0.0% |
| Belarus | 10 | 0.0% |
| Belize | 19 | 0.0% |
| Bolivia | 180 | 0.0% |
| Brazil | 51 | 0.0% |
| Cambodia | 2 | 0.0% |
| Canada | 245 | 0.1% |
| Caribbean | 342 | 0.1% |
| Central America | 3,054 | 0.7% |
| Chile | 9 | 0.0% |
| China | 233 | 0.1% |
| Colombia | 33 | 0.0% |
| Congo | 13 | 0.0% |
| Cuba | 59 | 0.0% |
| Dominican Republic | 9 | 0.0% |
| Eastern Africa | 126 | 0.0% |
| Eastern Asia | 451 | 0.1% |
| Eastern Europe | 322 | 0.1% |
| Ecuador | 36 | 0.0% |
| Egypt | 80 | 0.0% |
| El Salvador | 309 | 0.1% |
| England | 79 | 0.0% |
| Ethiopia | 52 | 0.0% |
| Europe | 1,039 | 0.2% |
| France | 13 | 0.0% |
| Germany | 357 | 0.1% |
| Ghana | 53 | 0.0% |
| Guatemala | 151 | 0.0% |
| Haiti | 163 | 0.0% |
| Honduras | 493 | 0.1% |
| Hong Kong | 20 | 0.0% |
| Hungary | 8 | 0.0% |
| India | 499 | 0.1% |
| Indonesia | 9 | 0.0% |
| Iran | 48 | 0.0% |
| Iraq | 34 | 0.0% |
| Italy | 80 | 0.0% |
| Jamaica | 75 | 0.0% |
| Japan | 34 | 0.0% |
| Jordan | 9 | 0.0% |
| Kazakhstan | 22 | 0.0% |
| Kenya | 60 | 0.0% |
| Korea | 184 | 0.0% |
| Laos | 16 | 0.0% |
| Latin America | 3,873 | 0.9% |
| Lebanon | 79 | 0.0% |
| Malaysia | 3 | 0.0% |
| Mexico | 2,002 | 0.4% |
| Middle Africa | 18 | 0.0% |
| Moldova | 10 | 0.0% |
| Morocco | 68 | 0.0% |
| Netherlands | 19 | 0.0% |
| Nicaragua | 65 | 0.0% |
| Northern Africa | 170 | 0.0% |
| Northern Europe | 183 | 0.0% |
| Oceania | 46 | 0.0% |
| Pakistan | 37 | 0.0% |
| Panama | 15 | 0.0% |
| Peru | 75 | 0.0% |
| Philippines | 192 | 0.0% |
| Poland | 61 | 0.0% |
| Romania | 2 | 0.0% |
| Russia | 174 | 0.0% |
| Saudi Arabia | 2 | 0.0% |
| Scotland | 2 | 0.0% |
| Sierra Leone | 2 | 0.0% |
| Singapore | 13 | 0.0% |
| South Africa | 58 | 0.0% |
| South America | 477 | 0.1% |
| South Central Asia | 627 | 0.1% |
| South Eastern Asia | 422 | 0.1% |
| Southern Europe | 136 | 0.0% |
| Spain | 56 | 0.0% |
| Switzerland | 9 | 0.0% |
| Syria | 13 | 0.0% |
| Taiwan | 35 | 0.0% |
| Thailand | 26 | 0.0% |
| Trinidad and Tobago | 19 | 0.0% |
| Turkey | 34 | 0.0% |
| Ukraine | 47 | 0.0% |
| Uruguay | 46 | 0.0% |
| Venezuela | 13 | 0.0% |
| Vietnam | 161 | 0.0% |
| Western Africa | 58 | 0.0% |
| Western Asia | 222 | 0.1% |
| Western Europe | 398 | 0.1% |
| Yemen | 11 | 0.0% | View All 93 Rows |
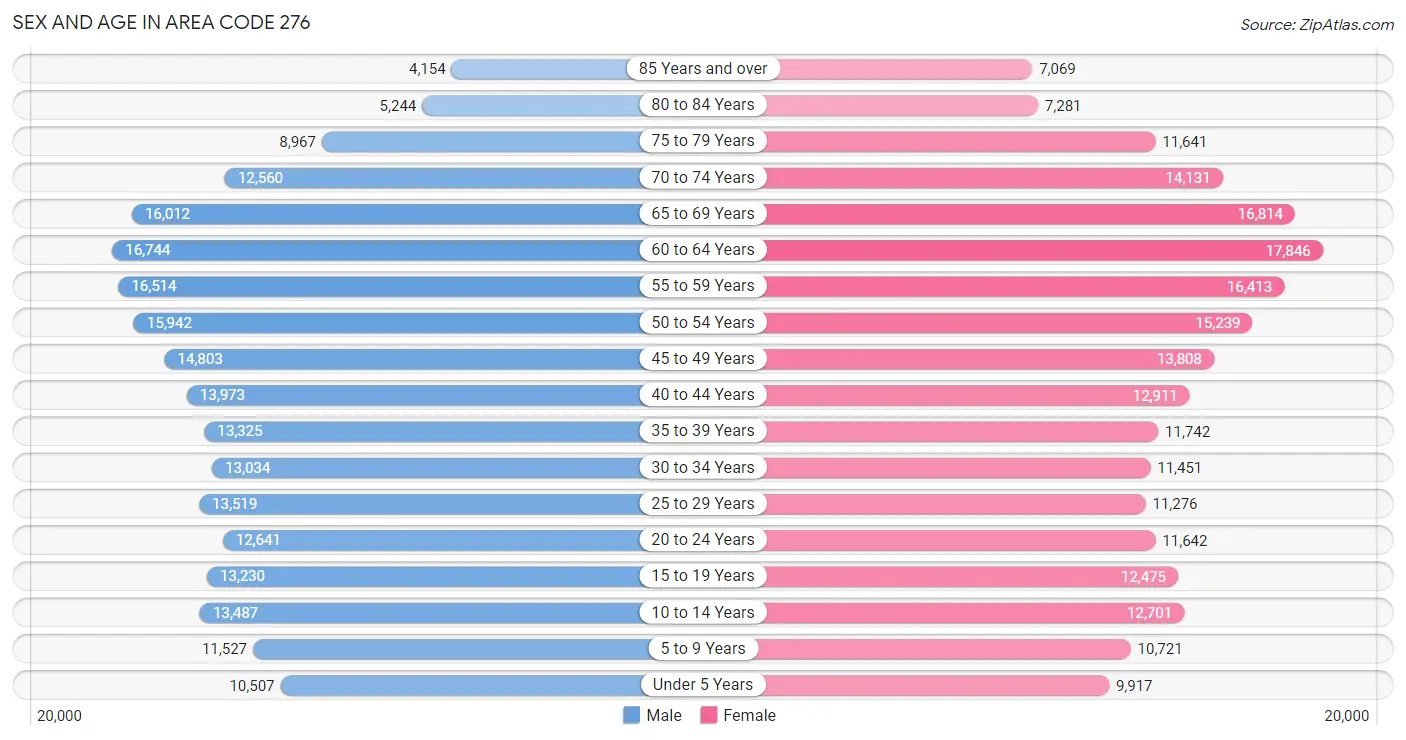
Sex and Age in Area Code 276
Sex and Age in Area Code 276
The most populous age groups in Area Code 276 are 60 to 64 Years (16,744 | 7.4%) for men and 60 to 64 Years (17,846 | 7.9%) for women.
| Age Bracket | Male | Female |
| Under 5 Years | 10,507 (4.6%) | 9,917 (4.4%) |
| 5 to 9 Years | 11,527 (5.1%) | 10,721 (4.8%) |
| 10 to 14 Years | 13,487 (6.0%) | 12,701 (5.6%) |
| 15 to 19 Years | 13,230 (5.9%) | 12,475 (5.5%) |
| 20 to 24 Years | 12,641 (5.6%) | 11,642 (5.2%) |
| 25 to 29 Years | 13,519 (6.0%) | 11,276 (5.0%) |
| 30 to 34 Years | 13,034 (5.8%) | 11,451 (5.1%) |
| 35 to 39 Years | 13,325 (5.9%) | 11,742 (5.2%) |
| 40 to 44 Years | 13,973 (6.2%) | 12,911 (5.7%) |
| 45 to 49 Years | 14,803 (6.5%) | 13,808 (6.1%) |
| 50 to 54 Years | 15,942 (7.0%) | 15,239 (6.8%) |
| 55 to 59 Years | 16,514 (7.3%) | 16,413 (7.3%) |
| 60 to 64 Years | 16,744 (7.4%) | 17,846 (7.9%) |
| 65 to 69 Years | 16,012 (7.1%) | 16,814 (7.5%) |
| 70 to 74 Years | 12,560 (5.6%) | 14,131 (6.3%) |
| 75 to 79 Years | 8,967 (4.0%) | 11,641 (5.2%) |
| 80 to 84 Years | 5,244 (2.3%) | 7,281 (3.2%) |
| 85 Years and over | 4,154 (1.8%) | 7,069 (3.1%) |
| Total | 226,183 (100.0%) | 225,078 (100.0%) |
Families and Households in Area Code 276
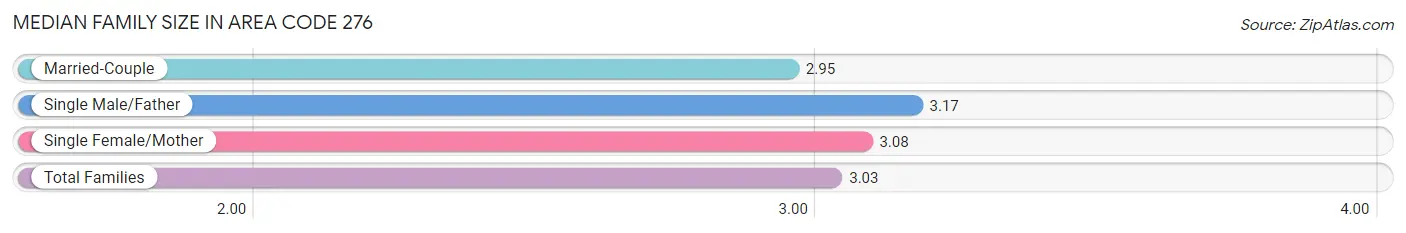
Median Family Size in Area Code 276
The median family size in Area Code 276 is 3.03 persons per family, with single male/father families (8,745 | 7.5%) accounting for the largest median family size of 3.17193 persons per family. On the other hand, married-couple families (86,396 | 74.2%) represent the smallest median family size with 2.95 persons per family.
| Family Type | # Families | Family Size |
| Married-Couple | 86,396 (74.2%) | 2.95 |
| Single Male/Father | 8,745 (7.5%) | 3.17 |
| Single Female/Mother | 21,340 (18.3%) | 3.08 |
| Total Families | 116,481 (100.0%) | 3.03 |
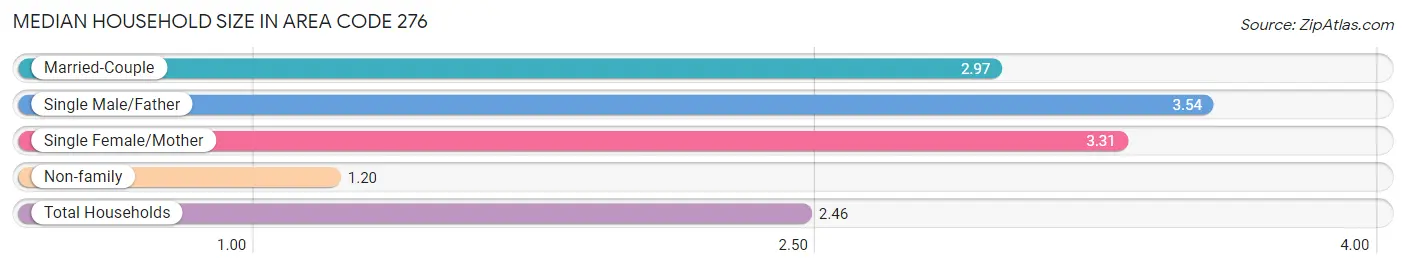
Median Household Size in Area Code 276
The median household size in Area Code 276 is 2.46 persons per household, with single male/father households (8,745 | 4.8%) accounting for the largest median household size of 3.53666 persons per household. non-family households (66,351 | 36.3%) represent the smallest median household size with 1.20 persons per household.
| Household Type | # Households | Household Size |
| Married-Couple | 86,396 (47.2%) | 2.97 |
| Single Male/Father | 8,745 (4.8%) | 3.54 |
| Single Female/Mother | 21,340 (11.7%) | 3.31 |
| Non-family | 66,351 (36.3%) | 1.20 |
| Total Households | 182,832 (100.0%) | 2.46 |
Household Size by Marriage Status in Area Code 276
Out of a total of 182,832 households in Area Code 276, 116,481 (63.7%) are family households, while 66,351 (36.3%) are nonfamily households. The most numerous type of family households are 2-person households, comprising 61,876, and the most common type of nonfamily households are 1-person households, comprising 58,613.
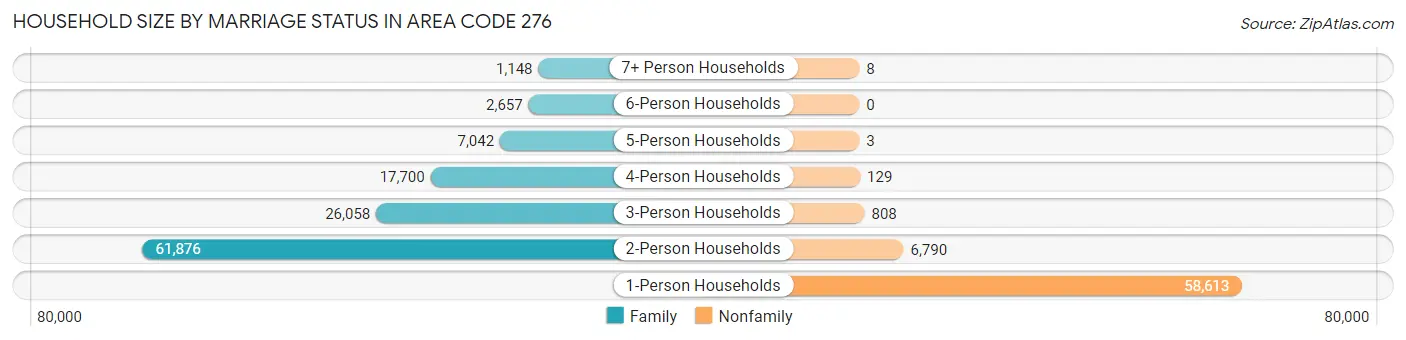
| Household Size | Family Households | Nonfamily Households |
| 1-Person Households | - | 58,613 (32.1%) |
| 2-Person Households | 61,876 (33.8%) | 6,790 (3.7%) |
| 3-Person Households | 26,058 (14.2%) | 808 (0.4%) |
| 4-Person Households | 17,700 (9.7%) | 129 (0.1%) |
| 5-Person Households | 7,042 (3.8%) | 3 (0.0%) |
| 6-Person Households | 2,657 (1.5%) | 0 (0.0%) |
| 7+ Person Households | 1,148 (0.6%) | 8 (0.0%) |
| Total | 116,481 (63.7%) | 66,351 (36.3%) |
Female Fertility in Area Code 276
Fertility by Age in Area Code 276
Average fertility rate in Area Code 276 is 70.5 births per 1,000 women. Women in the age bracket of 20 to 34 years have the highest fertility rate with 148.6 births per 1,000 women. Women in the age bracket of 20 to 34 years acount for 73.1% of all women with births.
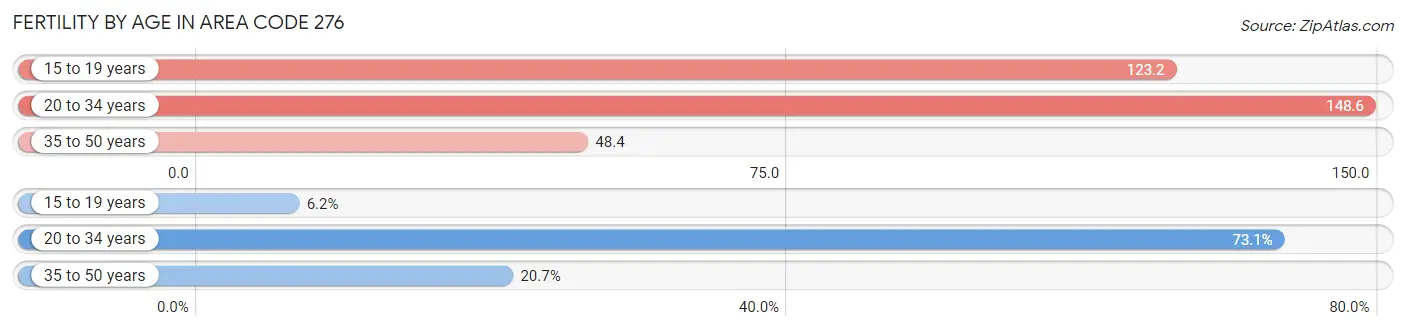
| Age Bracket | Women with Births | Births / 1,000 Women |
| 15 to 19 years | 309 (6.2%) | 123.2 |
| 20 to 34 years | 3,629 (73.1%) | 148.6 |
| 35 to 50 years | 1,030 (20.7%) | 48.4 |
| Total | 4,968 (100.0%) | 70.5 |
Fertility by Age by Marriage Status in Area Code 276
41.3% of women with births (4,968) in Area Code 276 are married. The highest percentage of unmarried women with births falls into 15 to 19 years age bracket with 96.1% of them unmarried at the time of birth, while the lowest percentage of unmarried women with births belong to 35 to 50 years age bracket with 61.5% of them unmarried.
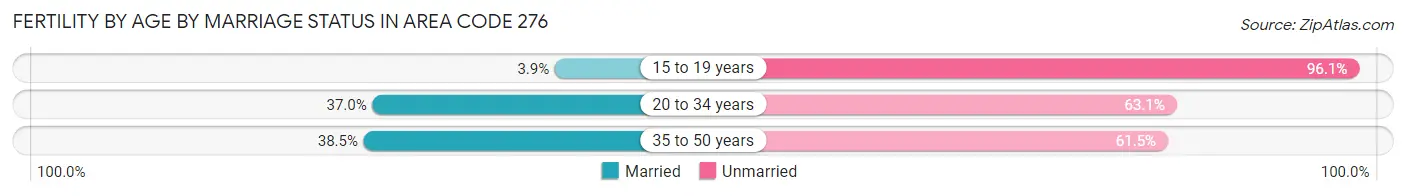
| Age Bracket | Married | Unmarried |
| 15 to 19 years | 12 (3.9%) | 297 (96.1%) |
| 20 to 34 years | 1,341 (36.9%) | 2,288 (63.0%) |
| 35 to 50 years | 397 (38.5%) | 633 (61.5%) |
| Total | 2,053 (41.3%) | 2,915 (58.7%) |
Fertility by Education in Area Code 276
Average fertility rate in Area Code 276 is 70.5 births per 1,000 women. Women with the education attainment of graduate degree have the highest fertility rate of 241.6 births per 1,000 women, while women with the education attainment of college or associate's degree have the lowest fertility at 93.7 births per 1,000 women. Women with the education attainment of college or associate's degree represent 36.9% of all women with births.
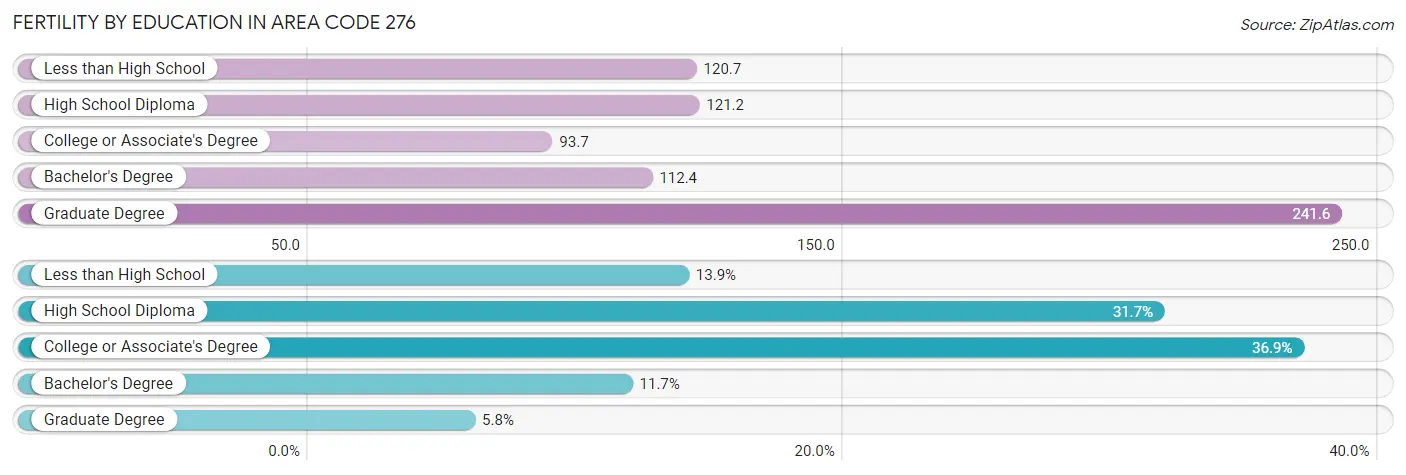
| Educational Attainment | Women with Births | Births / 1,000 Women |
| Less than High School | 688 (13.9%) | 120.7 |
| High School Diploma | 1,574 (31.7%) | 121.2 |
| College or Associate's Degree | 1,833 (36.9%) | 93.7 |
| Bachelor's Degree | 583 (11.7%) | 112.4 |
| Graduate Degree | 290 (5.8%) | 241.6 |
| Total | 4,968 (100.0%) | 70.5 |
Fertility by Education by Marriage Status in Area Code 276
58.7% of women with births in Area Code 276 are unmarried. Women with the educational attainment of bachelor's degree are most likely to be married with 48.2% of them married at childbirth, while women with the educational attainment of less than high school are least likely to be married with 92.3% of them unmarried at childbirth.
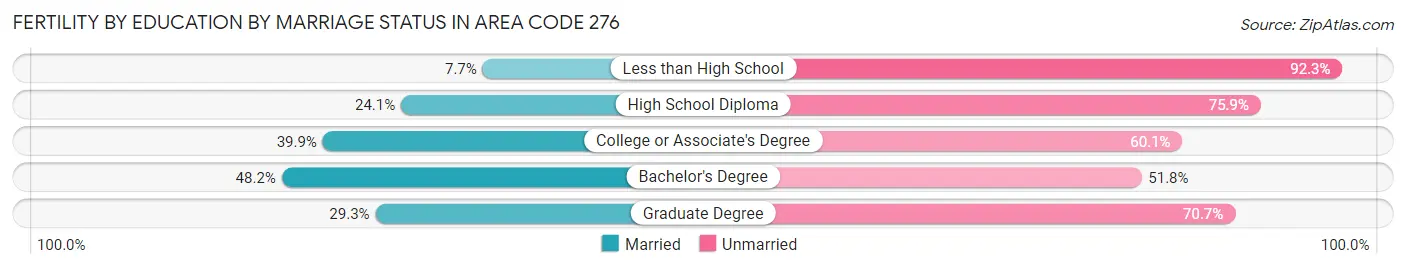
| Educational Attainment | Married | Unmarried |
| Less than High School | 53 (7.7%) | 635 (92.3%) |
| High School Diploma | 380 (24.1%) | 1,194 (75.9%) |
| College or Associate's Degree | 732 (39.9%) | 1,101 (60.1%) |
| Bachelor's Degree | 281 (48.2%) | 302 (51.8%) |
| Graduate Degree | 85 (29.3%) | 205 (70.7%) |
| Total | 2,053 (41.3%) | 2,915 (58.7%) |
Employment Characteristics in Area Code 276
Employment by Class of Employer in Area Code 276
Among the 170,626 employed individuals in Area Code 276, private company employees (114,810 | 67.3%), local government employees (16,135 | 9.5%), and state government employees (11,654 | 6.8%) make up the most common classes of employment.
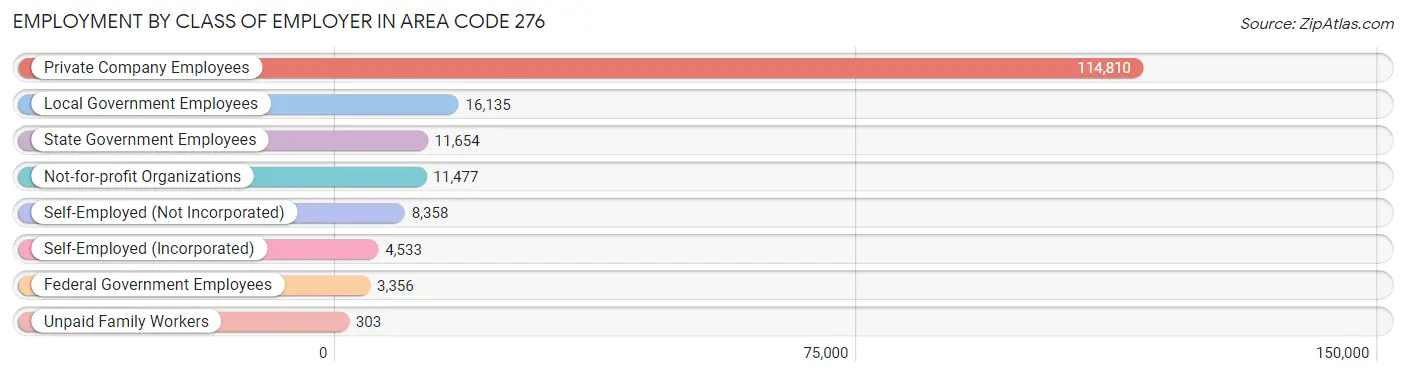
| Employer Class | # Employees | % Employees |
| Private Company Employees | 114,810 | 67.3% |
| Self-Employed (Incorporated) | 4,533 | 2.7% |
| Self-Employed (Not Incorporated) | 8,358 | 4.9% |
| Not-for-profit Organizations | 11,477 | 6.7% |
| Local Government Employees | 16,135 | 9.5% |
| State Government Employees | 11,654 | 6.8% |
| Federal Government Employees | 3,356 | 2.0% |
| Unpaid Family Workers | 303 | 0.2% |
| Total | 170,626 | 100.0% |
Employment Status by Age in Area Code 276
According to the labor force statistics for Area Code 276, out of the total population over 16 years of age (376,404), 44.9% or 168,817 individuals are in the labor force, with 7.8% or 13,168 of them unemployed. The age group with the highest labor force participation rate is 20 to 24 years, with 73.2% or 17,768 individuals in the labor force. Within the labor force, the 16 to 19 years age range has the highest percentage of unemployed individuals, with 1,463.0% or 125,306 of them being unemployed.
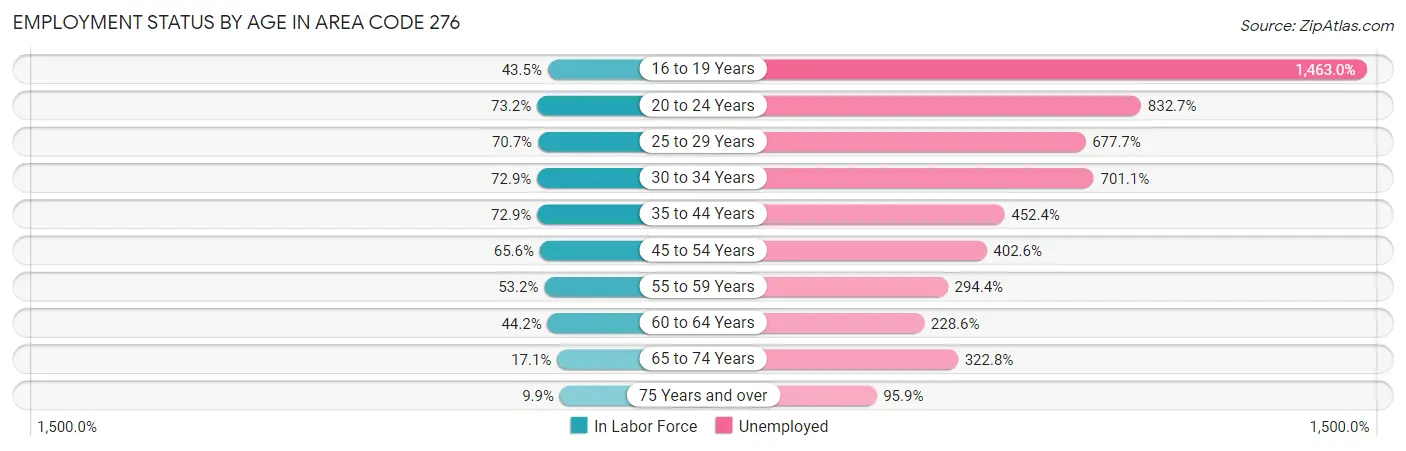
| Age Bracket | In Labor Force | Unemployed |
| 16 to 19 Years | 8,565 (43.5%) | 125,306 (1,463.0%) |
| 20 to 24 Years | 17,768 (73.2%) | 147,954 (832.7%) |
| 25 to 29 Years | 17,540 (70.7%) | 118,869 (677.7%) |
| 30 to 34 Years | 17,851 (72.9%) | 125,160 (701.1%) |
| 35 to 44 Years | 37,877 (72.9%) | 171,356 (452.4%) |
| 45 to 54 Years | 39,222 (65.6%) | 157,916 (402.6%) |
| 55 to 59 Years | 17,530 (53.2%) | 51,608 (294.4%) |
| 60 to 64 Years | 15,276 (44.2%) | 34,919 (228.6%) |
| 65 to 74 Years | 10,188 (17.1%) | 32,890 (322.8%) |
| 75 Years and over | 4,372 (9.9%) | 4,195 (95.9%) |
| Total | 168,801 (44.9%) | 13,166 (7.8%) |
Employment Status by Educational Attainment in Area Code 276
According to labor force statistics for Area Code 276, 60.1% of individuals (137,261) out of the total population between 25 and 64 years of age (228,540) are in the labor force, with 625.0% or 857,881 of them being unemployed. The group with the highest labor force participation rate are those with the educational attainment of bachelor's degree or higher, with 81.0% or 32,688 individuals in the labor force. Within the labor force, individuals with less than high school education have the highest percentage of unemployment, with 913.1% or 99,473 of them being unemployed.
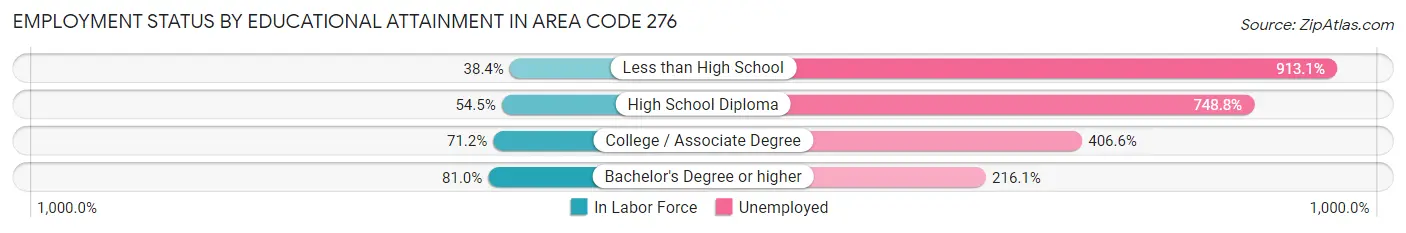
| Educational Attainment | In Labor Force | Unemployed |
| Less than High School | 10,895 (38.4%) | 258,782 (913.1%) |
| High School Diploma | 46,039 (54.5%) | 632,204 (748.8%) |
| College / Associate Degree | 53,708 (71.2%) | 306,658 (406.6%) |
| Bachelor's Degree or higher | 32,689 (81.0%) | 87,196 (216.1%) |
| Total | 137,254 (60.1%) | 1,428,375 (625.0%) |
Employment Occupations by Sex in Area Code 276
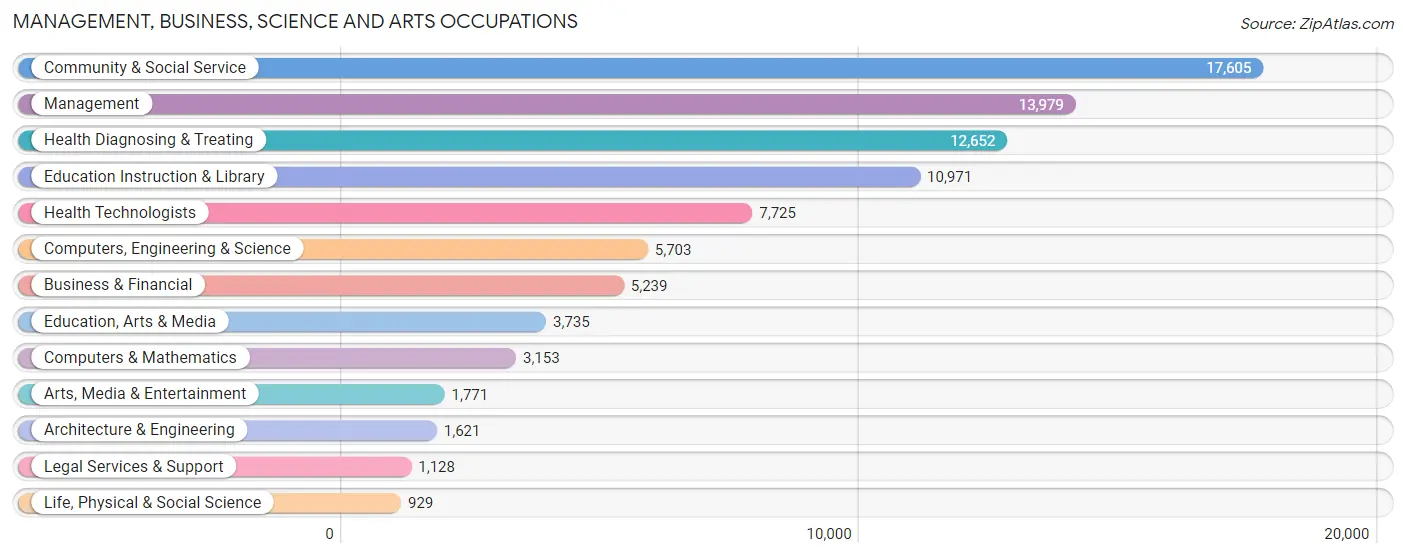
Management, Business, Science and Arts Occupations
The most common Management, Business, Science and Arts occupations in Area Code 276 are Community & Social Service (17,605 | 10.1%), Management (13,979 | 8.0%), Health Diagnosing & Treating (12,652 | 7.2%), Education Instruction & Library (10,971 | 6.3%), and Health Technologists (7,725 | 4.4%).
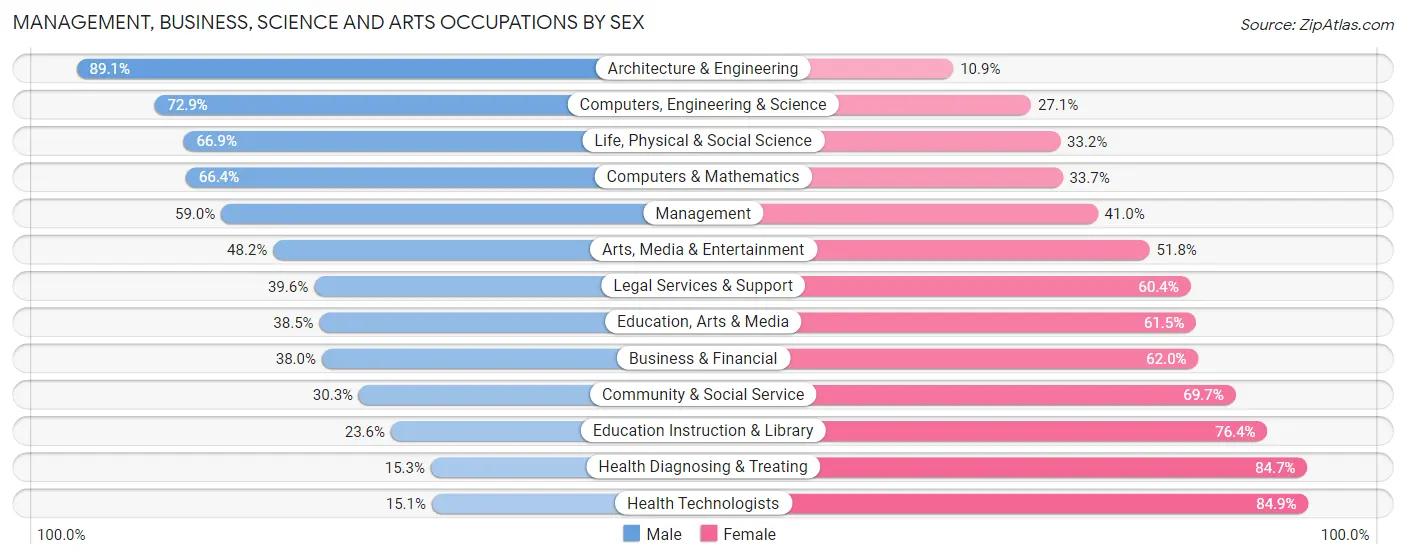
Management, Business, Science and Arts Occupations by Sex
Within the Management, Business, Science and Arts occupations in Area Code 276, the most male-oriented occupations are Architecture & Engineering (89.1%), Computers, Engineering & Science (72.9%), and Life, Physical & Social Science (66.8%), while the most female-oriented occupations are Health Technologists (84.9%), Health Diagnosing & Treating (84.7%), and Education Instruction & Library (76.4%).
| Occupation | Male | Female |
| Management | 8,250 (59.0%) | 5,729 (41.0%) |
| Business & Financial | 1,991 (38.0%) | 3,248 (62.0%) |
| Computers, Engineering & Science | 4,158 (72.9%) | 1,545 (27.1%) |
| Computers & Mathematics | 2,092 (66.3%) | 1,061 (33.7%) |
| Architecture & Engineering | 1,445 (89.1%) | 176 (10.9%) |
| Life, Physical & Social Science | 621 (66.8%) | 308 (33.2%) |
| Community & Social Service | 5,328 (30.3%) | 12,277 (69.7%) |
| Education, Arts & Media | 1,438 (38.5%) | 2,297 (61.5%) |
| Legal Services & Support | 447 (39.6%) | 681 (60.4%) |
| Education Instruction & Library | 2,590 (23.6%) | 8,381 (76.4%) |
| Arts, Media & Entertainment | 853 (48.2%) | 918 (51.8%) |
| Health Diagnosing & Treating | 1,931 (15.3%) | 10,721 (84.7%) |
| Health Technologists | 1,163 (15.1%) | 6,562 (84.9%) |
| Total (Category) | 21,658 (39.3%) | 33,520 (60.8%) |
| Total (Overall) | 91,860 (52.6%) | 82,908 (47.4%) |
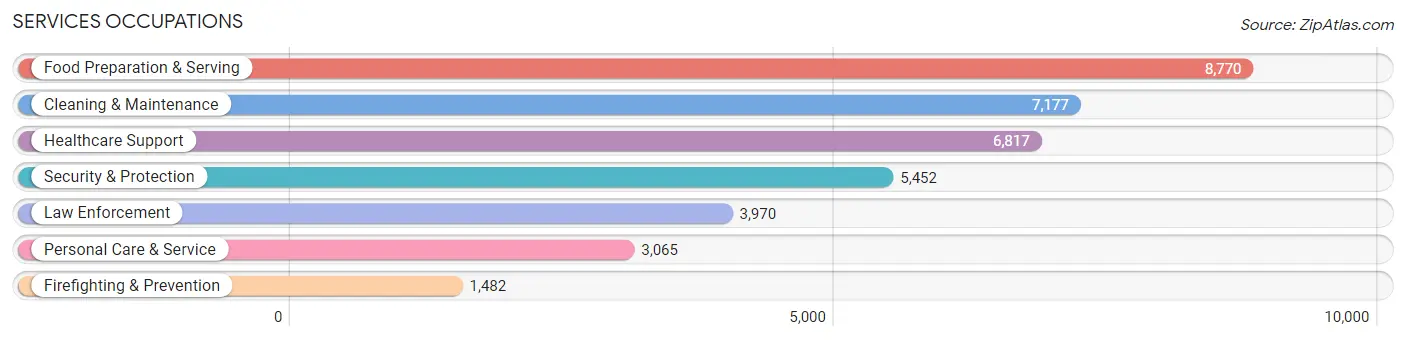
Services Occupations
The most common Services occupations in Area Code 276 are Food Preparation & Serving (8,770 | 5.0%), Cleaning & Maintenance (7,177 | 4.1%), Healthcare Support (6,817 | 3.9%), Security & Protection (5,452 | 3.1%), and Law Enforcement (3,970 | 2.3%).
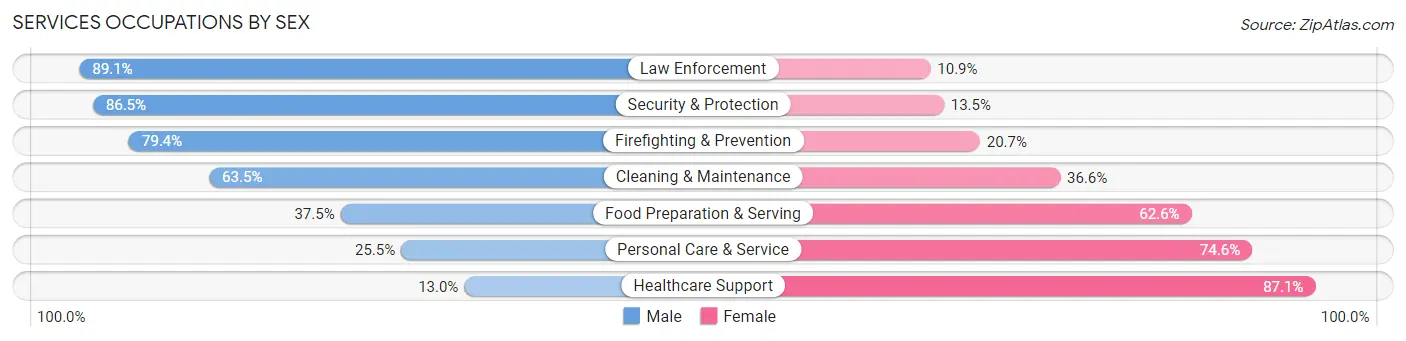
Services Occupations by Sex
Within the Services occupations in Area Code 276, the most male-oriented occupations are Law Enforcement (89.1%), Security & Protection (86.5%), and Firefighting & Prevention (79.3%), while the most female-oriented occupations are Healthcare Support (87.1%), Personal Care & Service (74.6%), and Food Preparation & Serving (62.5%).
| Occupation | Male | Female |
| Healthcare Support | 883 (13.0%) | 5,934 (87.1%) |
| Security & Protection | 4,715 (86.5%) | 737 (13.5%) |
| Firefighting & Prevention | 1,176 (79.3%) | 306 (20.6%) |
| Law Enforcement | 3,539 (89.1%) | 431 (10.9%) |
| Food Preparation & Serving | 3,284 (37.4%) | 5,486 (62.5%) |
| Cleaning & Maintenance | 4,554 (63.4%) | 2,623 (36.5%) |
| Personal Care & Service | 780 (25.5%) | 2,285 (74.6%) |
| Total (Category) | 14,216 (45.5%) | 17,065 (54.5%) |
| Total (Overall) | 91,860 (52.6%) | 82,908 (47.4%) |
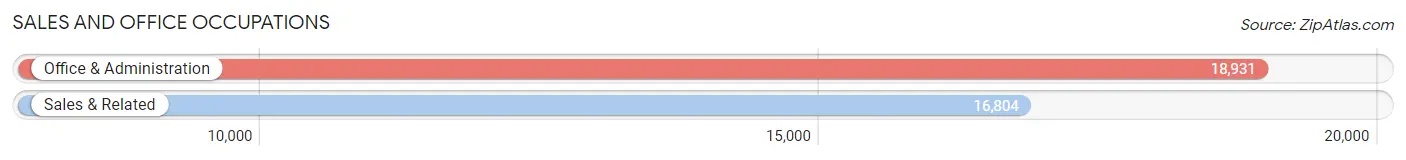
Sales and Office Occupations
The most common Sales and Office occupations in Area Code 276 are Office & Administration (18,931 | 10.8%), and Sales & Related (16,804 | 9.6%).
Sales and Office Occupations by Sex
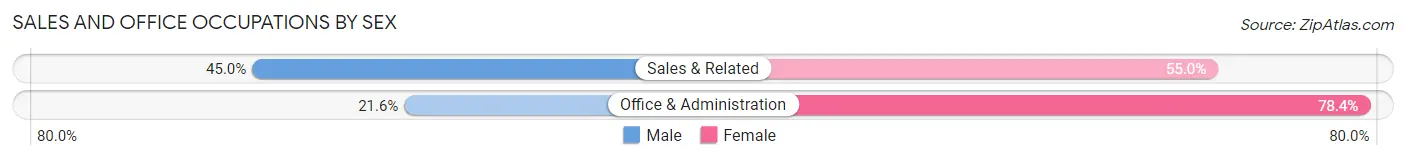
| Occupation | Male | Female |
| Sales & Related | 7,562 (45.0%) | 9,242 (55.0%) |
| Office & Administration | 4,090 (21.6%) | 14,841 (78.4%) |
| Total (Category) | 11,652 (32.6%) | 24,083 (67.4%) |
| Total (Overall) | 91,860 (52.6%) | 82,908 (47.4%) |
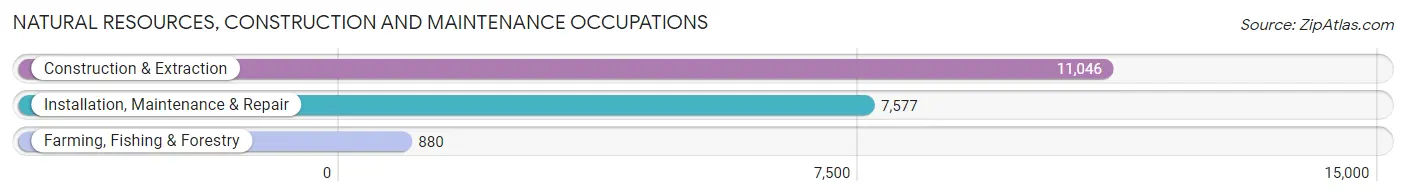
Natural Resources, Construction and Maintenance Occupations
The most common Natural Resources, Construction and Maintenance occupations in Area Code 276 are Construction & Extraction (11,046 | 6.3%), Installation, Maintenance & Repair (7,577 | 4.3%), and Farming, Fishing & Forestry (880 | 0.5%).
Natural Resources, Construction and Maintenance Occupations by Sex
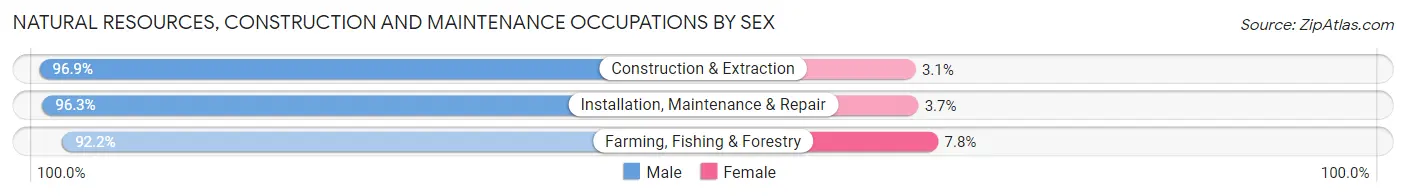
| Occupation | Male | Female |
| Farming, Fishing & Forestry | 811 (92.2%) | 69 (7.8%) |
| Construction & Extraction | 10,700 (96.9%) | 346 (3.1%) |
| Installation, Maintenance & Repair | 7,297 (96.3%) | 280 (3.7%) |
| Total (Category) | 18,808 (96.4%) | 695 (3.6%) |
| Total (Overall) | 91,860 (52.6%) | 82,908 (47.4%) |
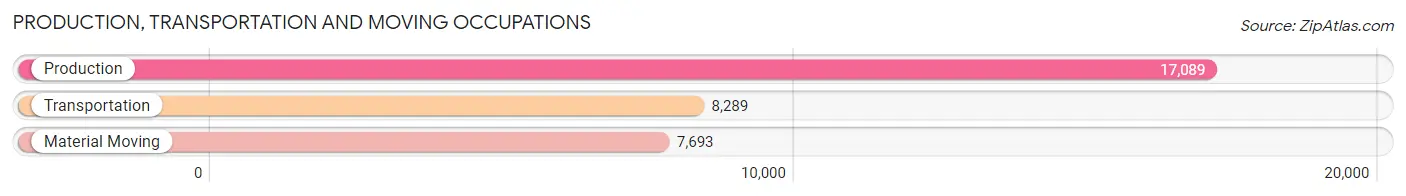
Production, Transportation and Moving Occupations
The most common Production, Transportation and Moving occupations in Area Code 276 are Production (17,089 | 9.8%), Transportation (8,289 | 4.7%), and Material Moving (7,693 | 4.4%).
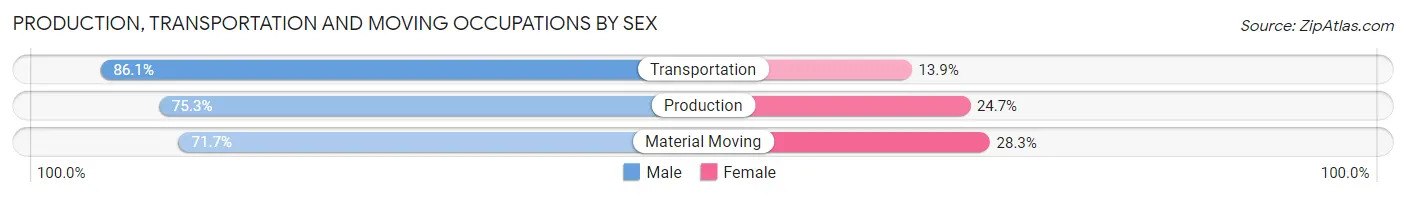
Production, Transportation and Moving Occupations by Sex
| Occupation | Male | Female |
| Production | 12,874 (75.3%) | 4,215 (24.7%) |
| Transportation | 7,134 (86.1%) | 1,155 (13.9%) |
| Material Moving | 5,518 (71.7%) | 2,175 (28.3%) |
| Total (Category) | 25,526 (77.2%) | 7,545 (22.8%) |
| Total (Overall) | 91,860 (52.6%) | 82,908 (47.4%) |
Employment Industries by Sex in Area Code 276
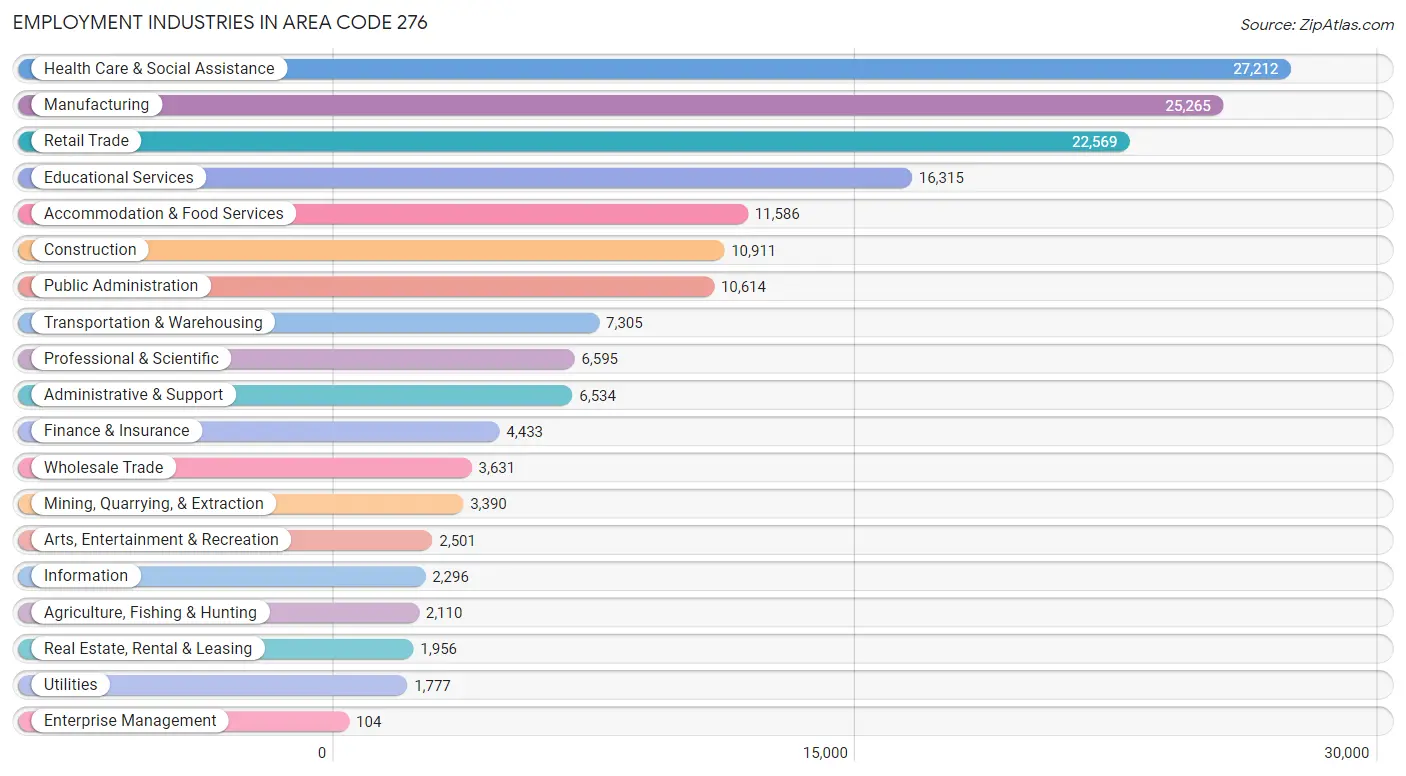
Employment Industries in Area Code 276
The major employment industries in Area Code 276 include Health Care & Social Assistance (27,212 | 15.6%), Manufacturing (25,265 | 14.5%), Retail Trade (22,569 | 12.9%), Educational Services (16,315 | 9.3%), and Accommodation & Food Services (11,586 | 6.6%).
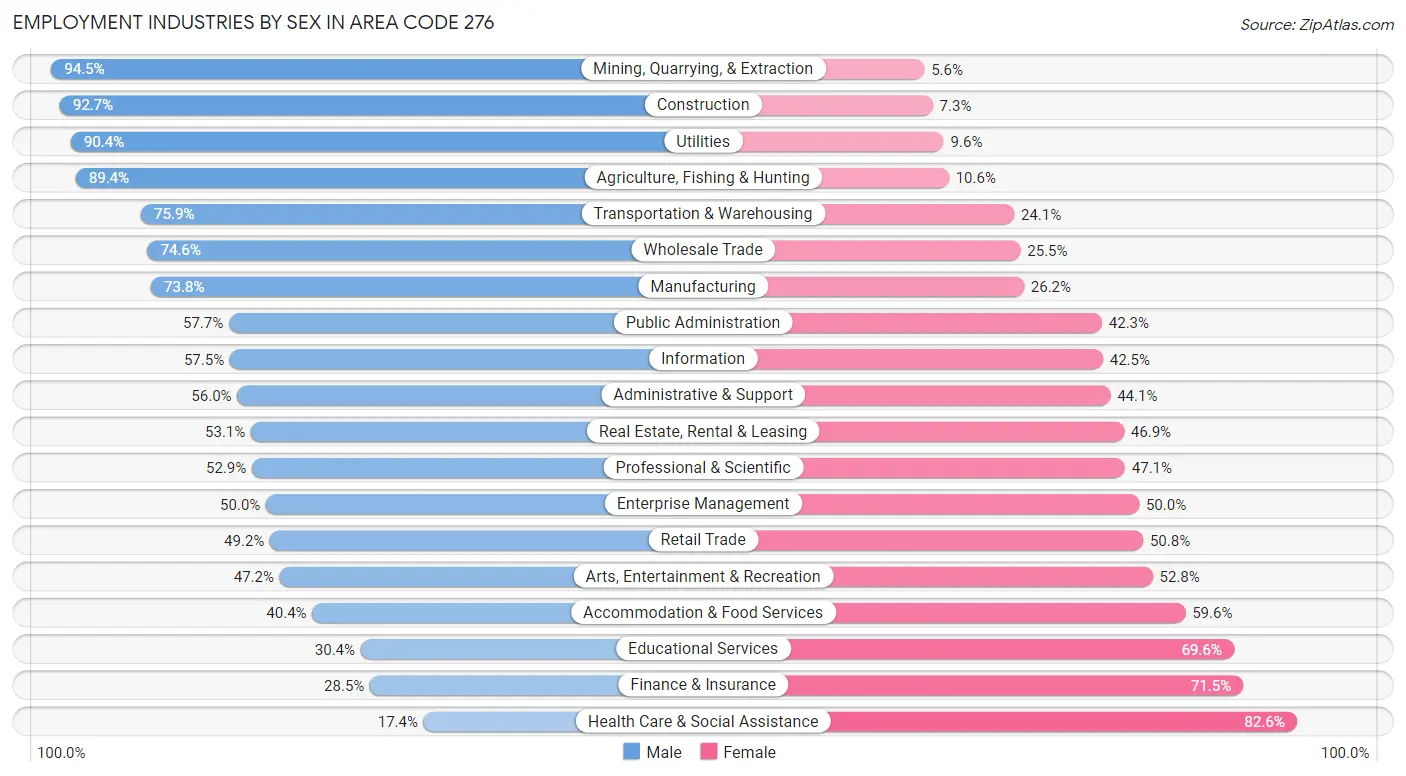
Employment Industries by Sex in Area Code 276
The Area Code 276 industries that see more men than women are Mining, Quarrying, & Extraction (94.5%), Construction (92.7%), and Utilities (90.4%), whereas the industries that tend to have a higher number of women are Health Care & Social Assistance (82.6%), Finance & Insurance (71.5%), and Educational Services (69.6%).
| Industry | Male | Female |
| Agriculture, Fishing & Hunting | 1,886 (89.4%) | 224 (10.6%) |
| Mining, Quarrying, & Extraction | 3,202 (94.5%) | 188 (5.6%) |
| Construction | 10,116 (92.7%) | 795 (7.3%) |
| Manufacturing | 18,652 (73.8%) | 6,613 (26.2%) |
| Wholesale Trade | 2,707 (74.6%) | 924 (25.5%) |
| Retail Trade | 11,098 (49.2%) | 11,471 (50.8%) |
| Transportation & Warehousing | 5,542 (75.9%) | 1,763 (24.1%) |
| Utilities | 1,607 (90.4%) | 170 (9.6%) |
| Information | 1,320 (57.5%) | 976 (42.5%) |
| Finance & Insurance | 1,262 (28.5%) | 3,171 (71.5%) |
| Real Estate, Rental & Leasing | 1,039 (53.1%) | 917 (46.9%) |
| Professional & Scientific | 3,490 (52.9%) | 3,105 (47.1%) |
| Enterprise Management | 52 (50.0%) | 52 (50.0%) |
| Administrative & Support | 3,656 (55.9%) | 2,878 (44.1%) |
| Educational Services | 4,959 (30.4%) | 11,356 (69.6%) |
| Health Care & Social Assistance | 4,727 (17.4%) | 22,485 (82.6%) |
| Arts, Entertainment & Recreation | 1,180 (47.2%) | 1,321 (52.8%) |
| Accommodation & Food Services | 4,684 (40.4%) | 6,902 (59.6%) |
| Public Administration | 6,122 (57.7%) | 4,492 (42.3%) |
| Total | 91,860 (52.6%) | 82,908 (47.4%) |
Education in Area Code 276
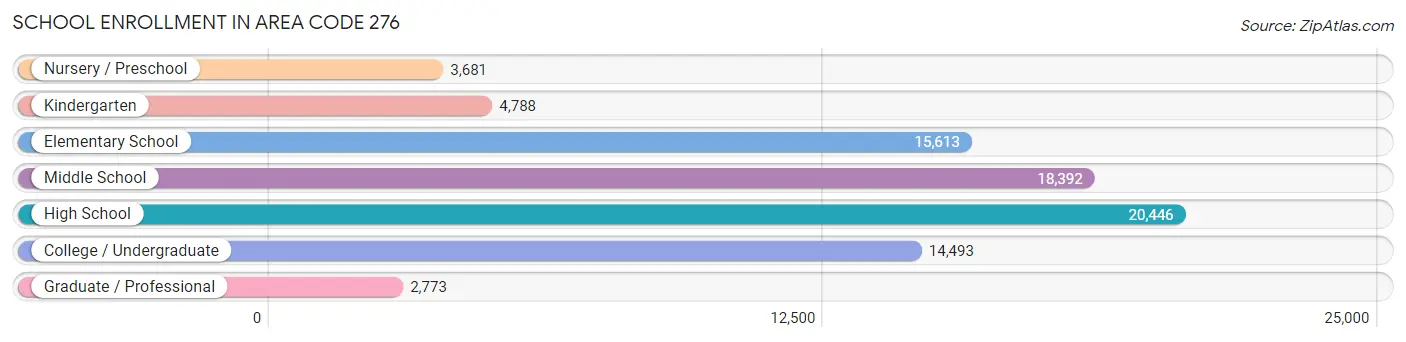
School Enrollment in Area Code 276
The most common levels of schooling among the 80,186 students in Area Code 276 are high school (20,446 | 25.5%), middle school (18,392 | 22.9%), and elementary school (15,613 | 19.5%).
| School Level | # Students | % Students |
| Nursery / Preschool | 3,681 | 4.6% |
| Kindergarten | 4,788 | 6.0% |
| Elementary School | 15,613 | 19.5% |
| Middle School | 18,392 | 22.9% |
| High School | 20,446 | 25.5% |
| College / Undergraduate | 14,493 | 18.1% |
| Graduate / Professional | 2,773 | 3.5% |
| Total | 80,186 | 100.0% |
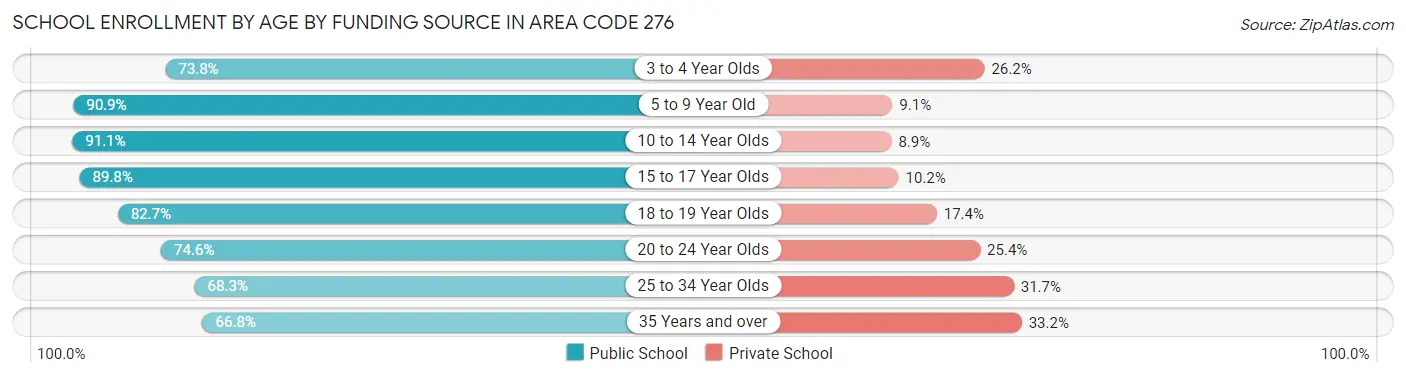
School Enrollment by Age by Funding Source in Area Code 276
Out of a total of 80,186 students who are enrolled in schools in Area Code 276, 11,252 (14.0%) attend a private institution, while the remaining 68,934 (86.0%) are enrolled in public schools. The age group of 35 years and over has the highest likelihood of being enrolled in private schools, with 1,337 (33.2% in the age bracket) enrolled. Conversely, the age group of 10 to 14 year olds has the lowest likelihood of being enrolled in a private school, with 21,275 (91.1% in the age bracket) attending a public institution.
| Age Bracket | Public School | Private School |
| 3 to 4 Year Olds | 2,073 (73.8%) | 737 (26.2%) |
| 5 to 9 Year Old | 17,436 (90.9%) | 1,741 (9.1%) |
| 10 to 14 Year Olds | 21,275 (91.1%) | 2,078 (8.9%) |
| 15 to 17 Year Olds | 13,166 (89.8%) | 1,501 (10.2%) |
| 18 to 19 Year Olds | 5,027 (82.7%) | 1,055 (17.3%) |
| 20 to 24 Year Olds | 4,611 (74.6%) | 1,572 (25.4%) |
| 25 to 34 Year Olds | 2,653 (68.3%) | 1,230 (31.7%) |
| 35 Years and over | 2,694 (66.8%) | 1,337 (33.2%) |
| Total | 68,934 (86.0%) | 11,252 (14.0%) |
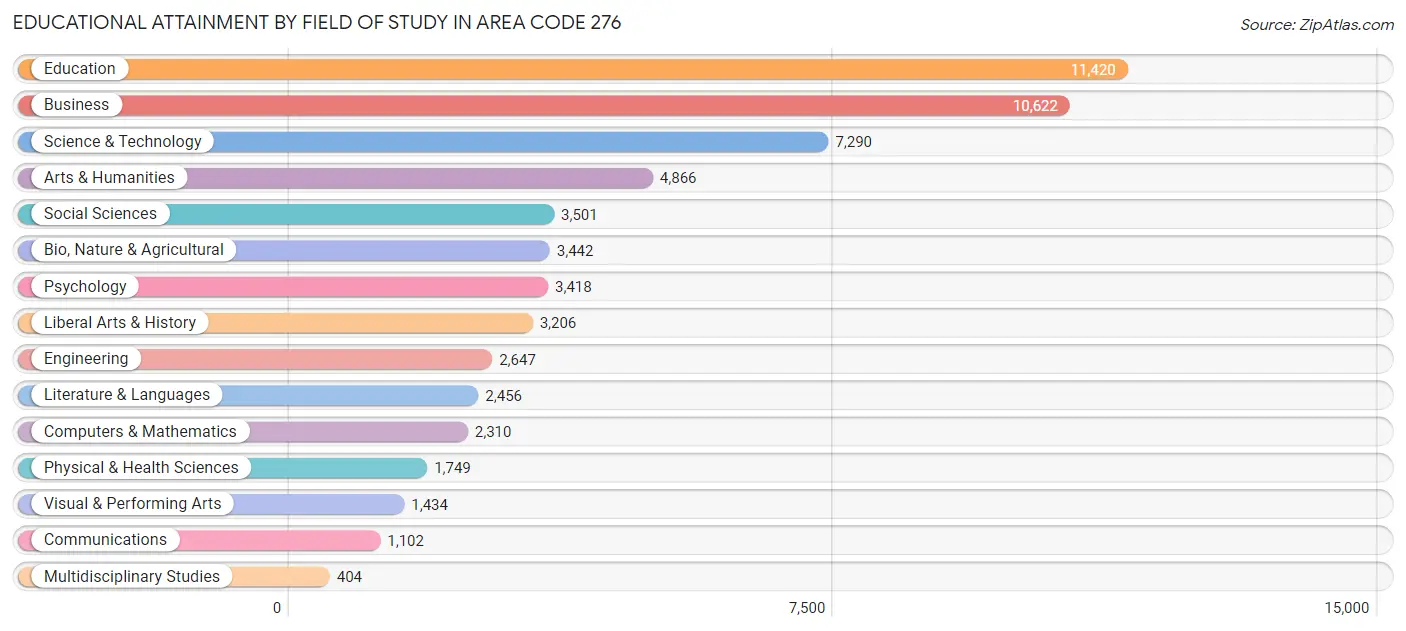
Educational Attainment by Field of Study in Area Code 276
Education (11,420 | 19.1%), business (10,622 | 17.7%), science & technology (7,290 | 12.2%), arts & humanities (4,866 | 8.1%), and social sciences (3,501 | 5.9%) are the most common fields of study among 59,867 individuals in Area Code 276 who have obtained a bachelor's degree or higher.
| Field of Study | # Graduates | % Graduates |
| Computers & Mathematics | 2,310 | 3.9% |
| Bio, Nature & Agricultural | 3,442 | 5.8% |
| Physical & Health Sciences | 1,749 | 2.9% |
| Psychology | 3,418 | 5.7% |
| Social Sciences | 3,501 | 5.9% |
| Engineering | 2,647 | 4.4% |
| Multidisciplinary Studies | 404 | 0.7% |
| Science & Technology | 7,290 | 12.2% |
| Business | 10,622 | 17.7% |
| Education | 11,420 | 19.1% |
| Literature & Languages | 2,456 | 4.1% |
| Liberal Arts & History | 3,206 | 5.4% |
| Visual & Performing Arts | 1,434 | 2.4% |
| Communications | 1,102 | 1.8% |
| Arts & Humanities | 4,866 | 8.1% |
| Total | 59,867 | 100.0% |
Transportation & Commute in Area Code 276
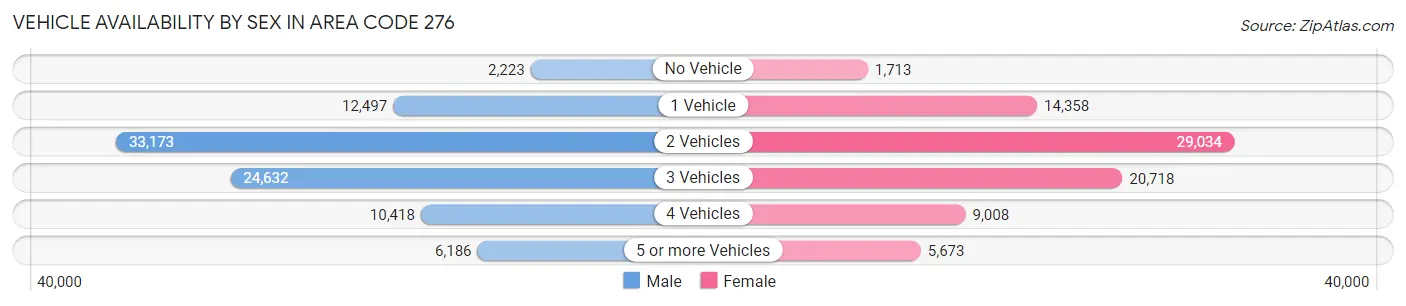
Vehicle Availability by Sex in Area Code 276
The most prevalent vehicle ownership categories in Area Code 276 are males with 2 vehicles (33,173, accounting for 37.2%) and females with 2 vehicles (29,034, making up 41.2%).
| Vehicles Available | Male | Female |
| No Vehicle | 2,223 (2.5%) | 1,713 (2.1%) |
| 1 Vehicle | 12,497 (14.0%) | 14,358 (17.8%) |
| 2 Vehicles | 33,173 (37.2%) | 29,034 (36.1%) |
| 3 Vehicles | 24,632 (27.6%) | 20,718 (25.7%) |
| 4 Vehicles | 10,418 (11.7%) | 9,008 (11.2%) |
| 5 or more Vehicles | 6,186 (6.9%) | 5,673 (7.0%) |
| Total | 89,129 (100.0%) | 80,504 (100.0%) |
Commute Time in Area Code 276
The most frequently occuring commute durations in Area Code 276 are 15 to 19 minutes (25,535 commuters, 15.8%), 20 to 24 minutes (22,761 commuters, 14.1%), and 10 to 14 minutes (21,890 commuters, 13.6%).
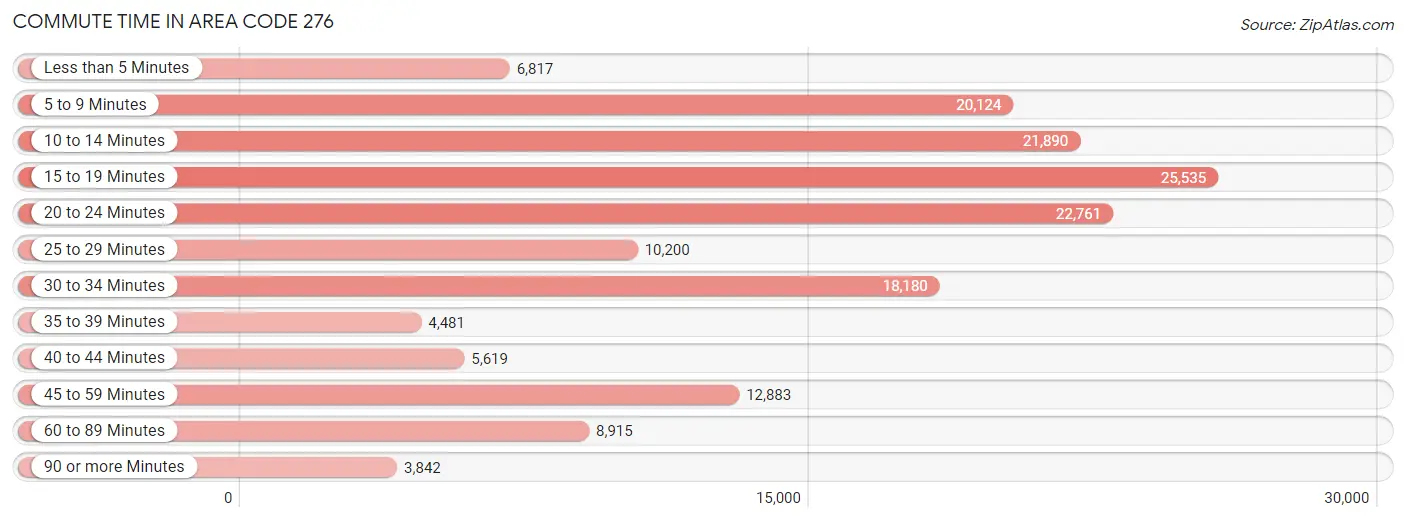
| Commute Time | # Commuters | % Commuters |
| Less than 5 Minutes | 6,817 | 4.2% |
| 5 to 9 Minutes | 20,124 | 12.5% |
| 10 to 14 Minutes | 21,890 | 13.6% |
| 15 to 19 Minutes | 25,535 | 15.8% |
| 20 to 24 Minutes | 22,761 | 14.1% |
| 25 to 29 Minutes | 10,200 | 6.3% |
| 30 to 34 Minutes | 18,180 | 11.3% |
| 35 to 39 Minutes | 4,481 | 2.8% |
| 40 to 44 Minutes | 5,619 | 3.5% |
| 45 to 59 Minutes | 12,883 | 8.0% |
| 60 to 89 Minutes | 8,915 | 5.5% |
| 90 or more Minutes | 3,842 | 2.4% |
Commute Time by Sex in Area Code 276
The most common commute times in Area Code 276 are 15 to 19 minutes (12,422 commuters, 14.5%) for males and 15 to 19 minutes (13,113 commuters, 17.3%) for females.
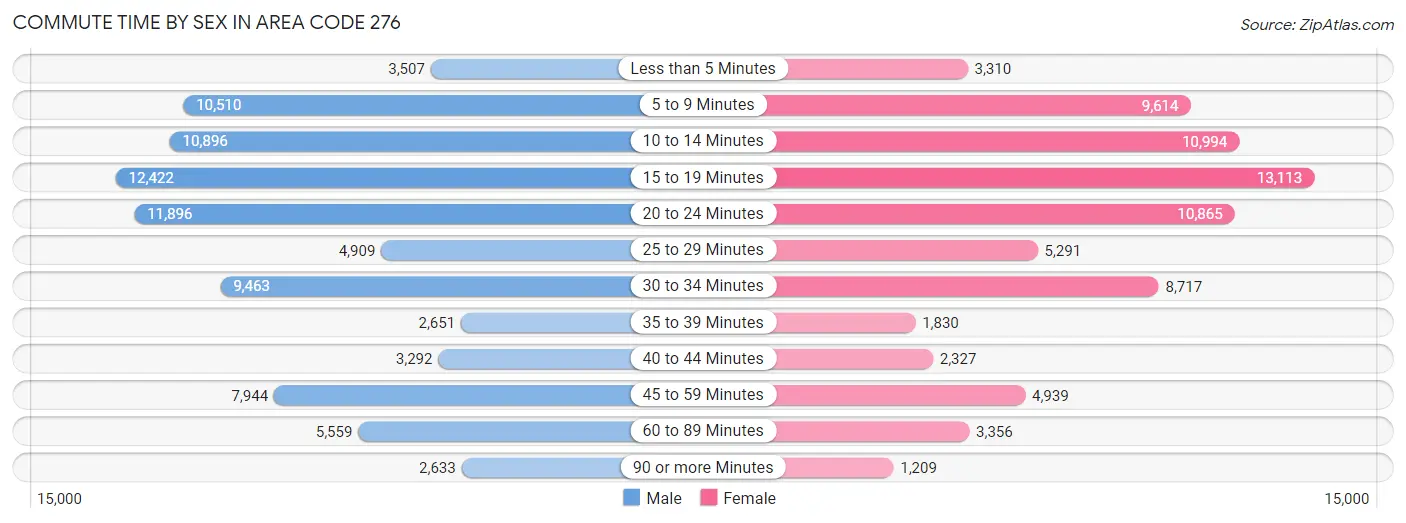
| Commute Time | Male | Female |
| Less than 5 Minutes | 3,507 (4.1%) | 3,310 (4.4%) |
| 5 to 9 Minutes | 10,510 (12.3%) | 9,614 (12.7%) |
| 10 to 14 Minutes | 10,896 (12.7%) | 10,994 (14.5%) |
| 15 to 19 Minutes | 12,422 (14.5%) | 13,113 (17.3%) |
| 20 to 24 Minutes | 11,896 (13.9%) | 10,865 (14.4%) |
| 25 to 29 Minutes | 4,909 (5.7%) | 5,291 (7.0%) |
| 30 to 34 Minutes | 9,463 (11.0%) | 8,717 (11.5%) |
| 35 to 39 Minutes | 2,651 (3.1%) | 1,830 (2.4%) |
| 40 to 44 Minutes | 3,292 (3.8%) | 2,327 (3.1%) |
| 45 to 59 Minutes | 7,944 (9.3%) | 4,939 (6.5%) |
| 60 to 89 Minutes | 5,559 (6.5%) | 3,356 (4.4%) |
| 90 or more Minutes | 2,633 (3.1%) | 1,209 (1.6%) |
Time of Departure to Work by Sex in Area Code 276
The most frequent times of departure to work in Area Code 276 are 7:00 AM to 7:29 AM (10,806, 12.6%) for males and 7:30 AM to 7:59 AM (13,927, 18.4%) for females.
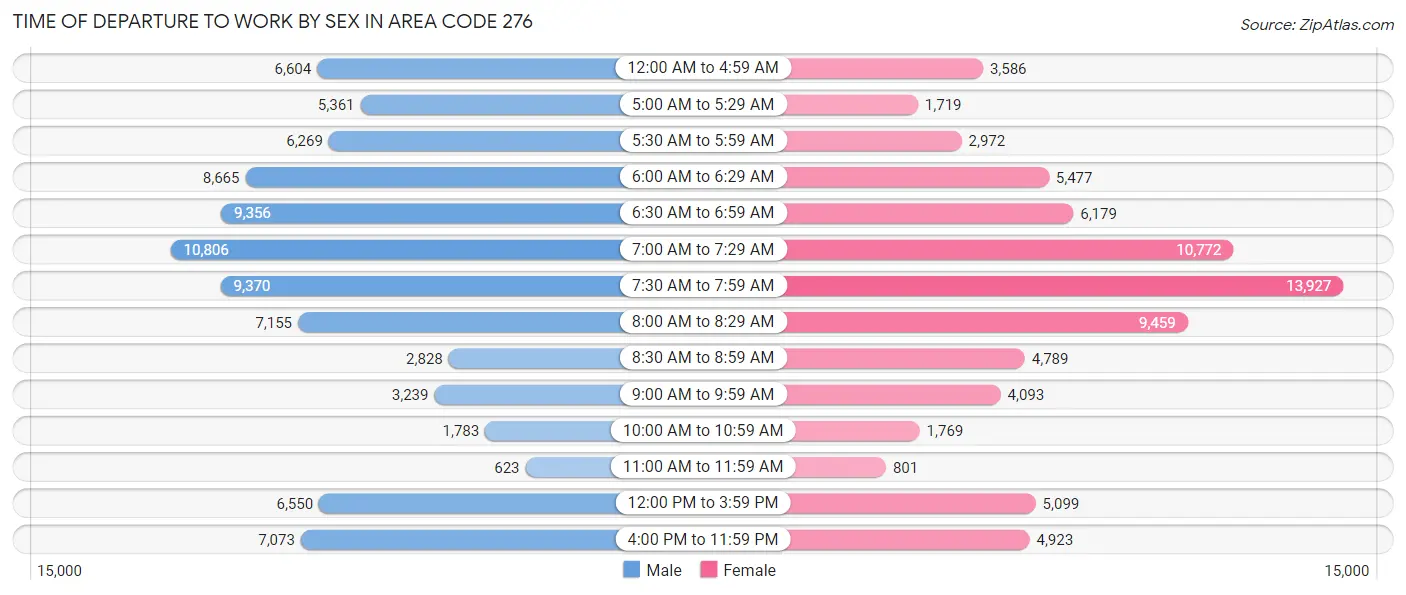
| Time of Departure | Male | Female |
| 12:00 AM to 4:59 AM | 6,604 (7.7%) | 3,586 (4.8%) |
| 5:00 AM to 5:29 AM | 5,361 (6.3%) | 1,719 (2.3%) |
| 5:30 AM to 5:59 AM | 6,269 (7.3%) | 2,972 (3.9%) |
| 6:00 AM to 6:29 AM | 8,665 (10.1%) | 5,477 (7.2%) |
| 6:30 AM to 6:59 AM | 9,356 (10.9%) | 6,179 (8.2%) |
| 7:00 AM to 7:29 AM | 10,806 (12.6%) | 10,772 (14.3%) |
| 7:30 AM to 7:59 AM | 9,370 (10.9%) | 13,927 (18.4%) |
| 8:00 AM to 8:29 AM | 7,155 (8.4%) | 9,459 (12.5%) |
| 8:30 AM to 8:59 AM | 2,828 (3.3%) | 4,789 (6.3%) |
| 9:00 AM to 9:59 AM | 3,239 (3.8%) | 4,093 (5.4%) |
| 10:00 AM to 10:59 AM | 1,783 (2.1%) | 1,769 (2.3%) |
| 11:00 AM to 11:59 AM | 623 (0.7%) | 801 (1.1%) |
| 12:00 PM to 3:59 PM | 6,550 (7.6%) | 5,099 (6.8%) |
| 4:00 PM to 11:59 PM | 7,073 (8.3%) | 4,923 (6.5%) |
| Total | 85,682 (100.0%) | 75,565 (100.0%) |
Housing Occupancy in Area Code 276
Occupancy by Ownership in Area Code 276
Of the total 182,832 dwellings in Area Code 276, owner-occupied units account for 134,316 (73.5%), while renter-occupied units make up 48,516 (26.5%).
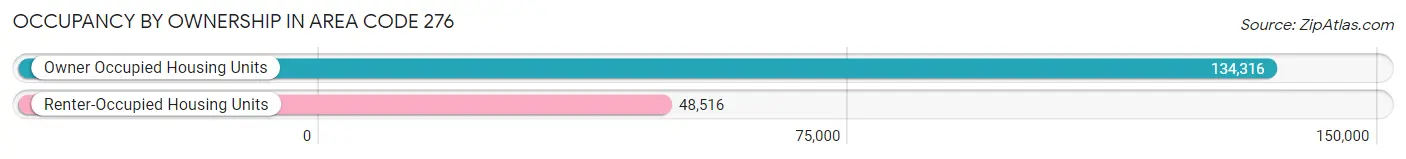
| Occupancy | # Housing Units | % Housing Units |
| Owner Occupied Housing Units | 134,316 | 73.5% |
| Renter-Occupied Housing Units | 48,516 | 26.5% |
| Total Occupied Housing Units | 182,832 | 100.0% |
Occupancy by Household Size in Area Code 276
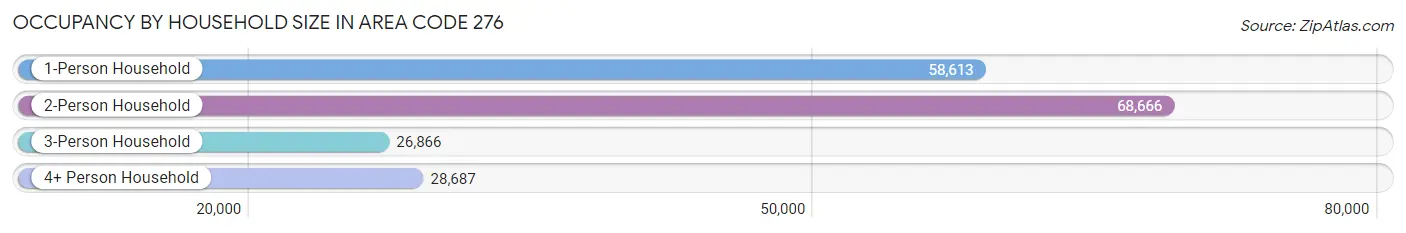
| Household Size | # Housing Units | % Housing Units |
| 1-Person Household | 58,613 | 32.1% |
| 2-Person Household | 68,666 | 37.6% |
| 3-Person Household | 26,866 | 14.7% |
| 4+ Person Household | 28,687 | 15.7% |
| Total Housing Units | 182,832 | 100.0% |
Occupancy by Ownership by Household Size in Area Code 276
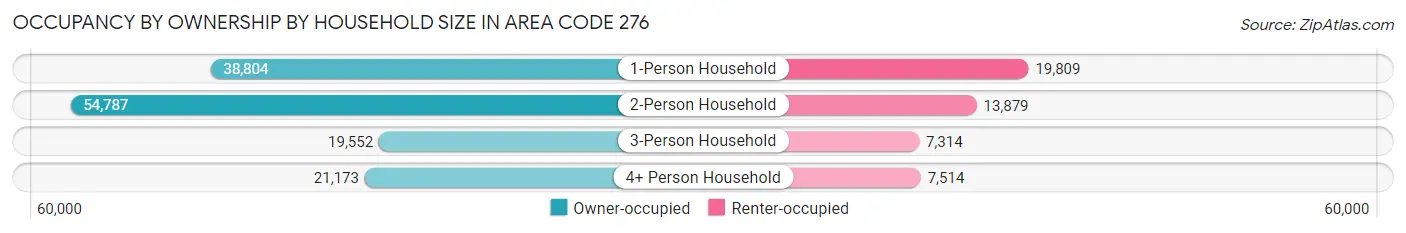
| Household Size | Owner-occupied | Renter-occupied |
| 1-Person Household | 38,804 (66.2%) | 19,809 (33.8%) |
| 2-Person Household | 54,787 (79.8%) | 13,879 (20.2%) |
| 3-Person Household | 19,552 (72.8%) | 7,314 (27.2%) |
| 4+ Person Household | 21,173 (73.8%) | 7,514 (26.2%) |
| Total Housing Units | 134,316 (73.5%) | 48,516 (26.5%) |
Occupancy by Educational Attainment in Area Code 276
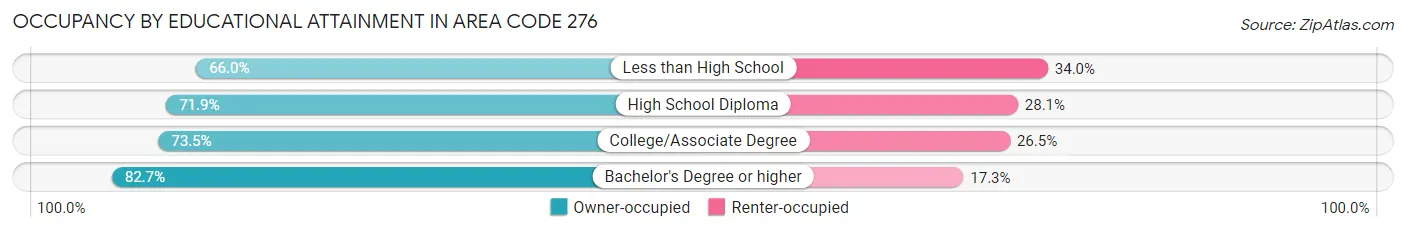
| Household Size | Owner-occupied | Renter-occupied |
| Less than High School | 18,780 (66.0%) | 9,692 (34.0%) |
| High School Diploma | 43,563 (71.9%) | 17,013 (28.1%) |
| College/Associate Degree | 44,483 (73.5%) | 16,066 (26.5%) |
| Bachelor's Degree or higher | 27,490 (82.7%) | 5,745 (17.3%) |
Occupancy by Age of Householder in Area Code 276
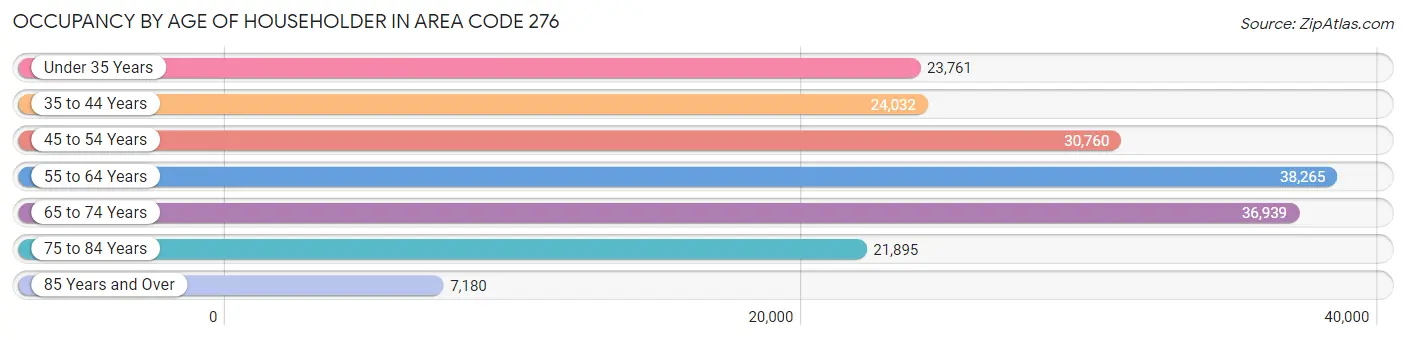
| Age Bracket | # Households | % Households |
| Under 35 Years | 23,761 | 13.0% |
| 35 to 44 Years | 24,032 | 13.1% |
| 45 to 54 Years | 30,760 | 16.8% |
| 55 to 64 Years | 38,265 | 20.9% |
| 65 to 74 Years | 36,939 | 20.2% |
| 75 to 84 Years | 21,895 | 12.0% |
| 85 Years and Over | 7,180 | 3.9% |
| Total | 182,832 | 100.0% |
Housing Finances in Area Code 276
Median Income by Occupancy in Area Code 276
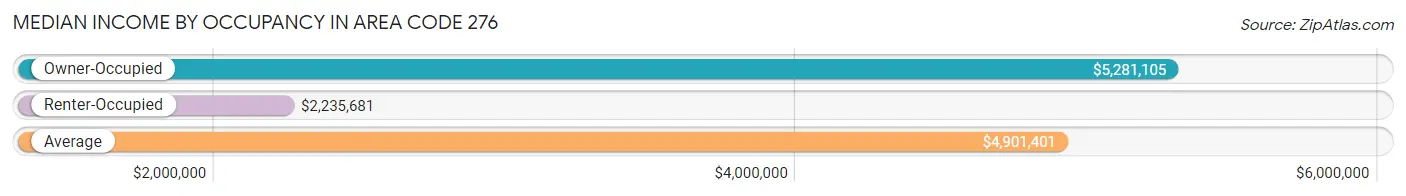
| Occupancy Type | # Households | Median Income |
| Owner-Occupied | 134,316 (73.5%) | $5,281,105 |
| Renter-Occupied | 48,516 (26.5%) | $2,235,681 |
| Average | 182,832 (100.0%) | $4,901,401 |
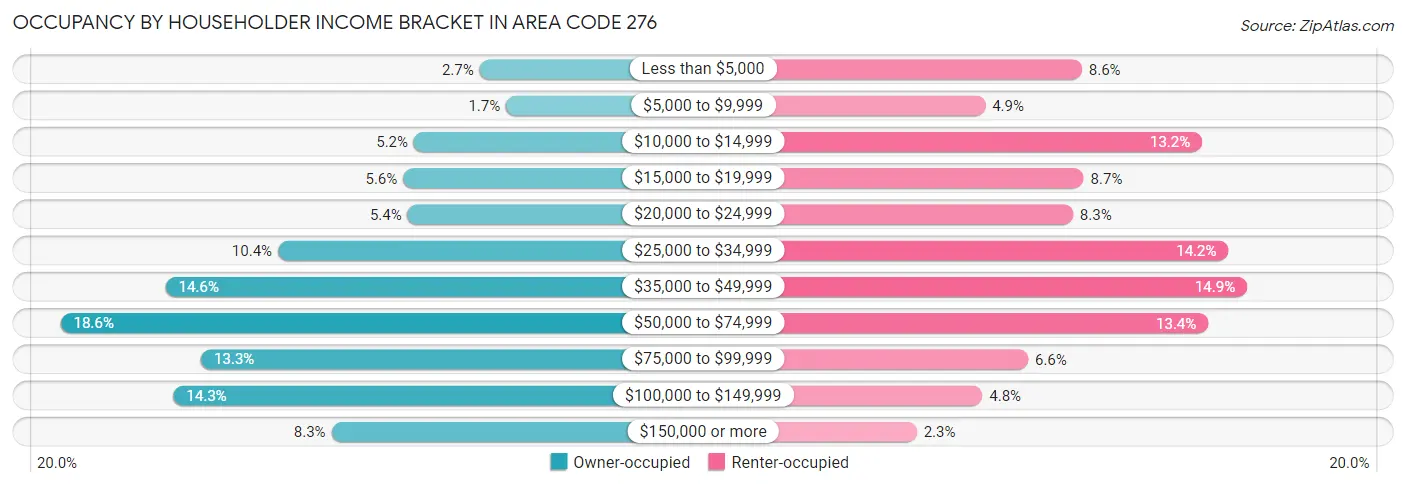
Occupancy by Householder Income Bracket in Area Code 276
| Income Bracket | Owner-occupied | Renter-occupied |
| Less than $5,000 | 3,580 (2.7%) | 4,182 (8.6%) |
| $5,000 to $9,999 | 2,229 (1.7%) | 2,398 (4.9%) |
| $10,000 to $14,999 | 6,941 (5.2%) | 6,403 (13.2%) |
| $15,000 to $19,999 | 7,492 (5.6%) | 4,216 (8.7%) |
| $20,000 to $24,999 | 7,266 (5.4%) | 4,015 (8.3%) |
| $25,000 to $34,999 | 13,896 (10.3%) | 6,888 (14.2%) |
| $35,000 to $49,999 | 19,647 (14.6%) | 7,236 (14.9%) |
| $50,000 to $74,999 | 25,017 (18.6%) | 6,518 (13.4%) |
| $75,000 to $99,999 | 17,832 (13.3%) | 3,189 (6.6%) |
| $100,000 to $149,999 | 19,248 (14.3%) | 2,342 (4.8%) |
| $150,000 or more | 11,168 (8.3%) | 1,129 (2.3%) |
| Total | 134,316 (100.0%) | 48,516 (100.0%) |
Monthly Housing Cost Tiers in Area Code 276
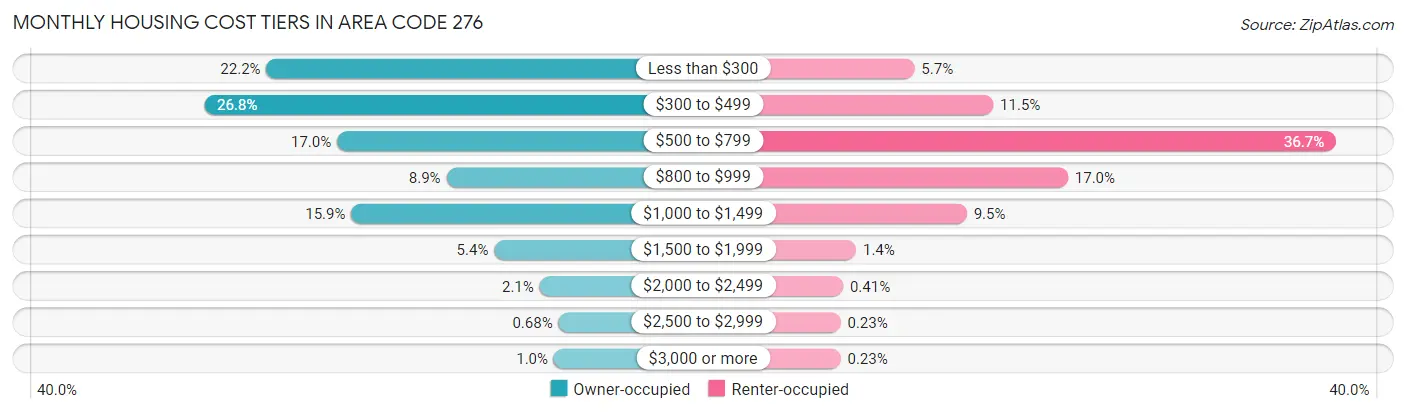
| Monthly Cost | Owner-occupied | Renter-occupied |
| Less than $300 | 29,805 (22.2%) | 2,750 (5.7%) |
| $300 to $499 | 35,968 (26.8%) | 5,566 (11.5%) |
| $500 to $799 | 22,816 (17.0%) | 17,814 (36.7%) |
| $800 to $999 | 11,989 (8.9%) | 8,235 (17.0%) |
| $1,000 to $1,499 | 21,406 (15.9%) | 4,620 (9.5%) |
| $1,500 to $1,999 | 7,261 (5.4%) | 665 (1.4%) |
| $2,000 to $2,499 | 2,780 (2.1%) | 198 (0.4%) |
| $2,500 to $2,999 | 915 (0.7%) | 111 (0.2%) |
| $3,000 or more | 1,376 (1.0%) | 110 (0.2%) |
| Total | 134,316 (100.0%) | 48,516 (100.0%) |
Physical Housing Characteristics in Area Code 276
Housing Structures in Area Code 276
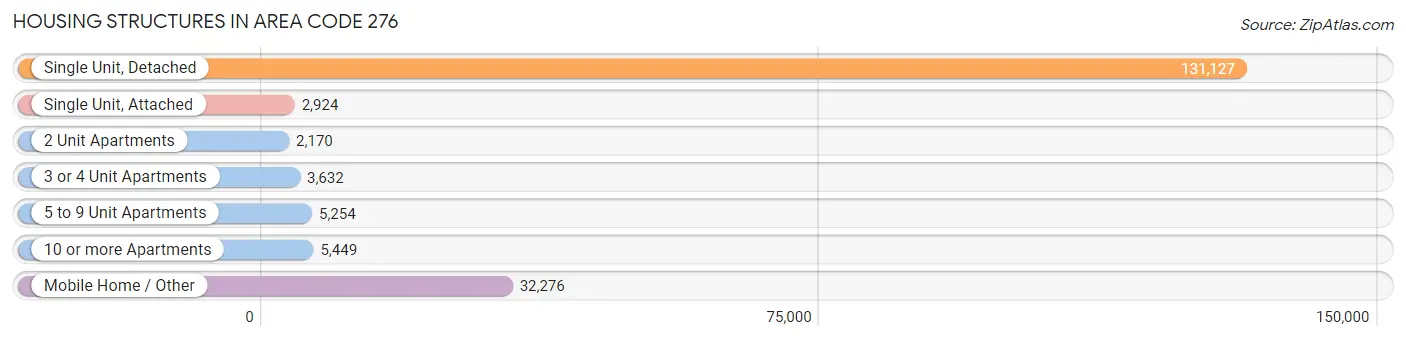
| Structure Type | # Housing Units | % Housing Units |
| Single Unit, Detached | 131,127 | 71.7% |
| Single Unit, Attached | 2,924 | 1.6% |
| 2 Unit Apartments | 2,170 | 1.2% |
| 3 or 4 Unit Apartments | 3,632 | 2.0% |
| 5 to 9 Unit Apartments | 5,254 | 2.9% |
| 10 or more Apartments | 5,449 | 3.0% |
| Mobile Home / Other | 32,276 | 17.6% |
| Total | 182,832 | 100.0% |
Housing Structures by Occupancy in Area Code 276
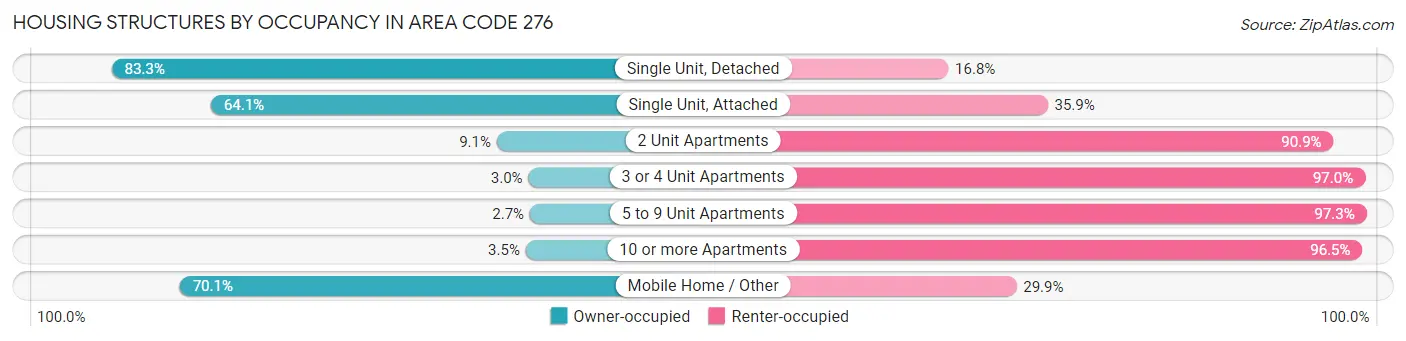
| Structure Type | Owner-occupied | Renter-occupied |
| Single Unit, Detached | 109,166 (83.3%) | 21,961 (16.8%) |
| Single Unit, Attached | 1,875 (64.1%) | 1,049 (35.9%) |
| 2 Unit Apartments | 197 (9.1%) | 1,973 (90.9%) |
| 3 or 4 Unit Apartments | 109 (3.0%) | 3,523 (97.0%) |
| 5 to 9 Unit Apartments | 142 (2.7%) | 5,112 (97.3%) |
| 10 or more Apartments | 191 (3.5%) | 5,258 (96.5%) |
| Mobile Home / Other | 22,636 (70.1%) | 9,640 (29.9%) |
| Total | 134,316 (73.5%) | 48,516 (26.5%) |
Housing Structures by Number of Rooms in Area Code 276
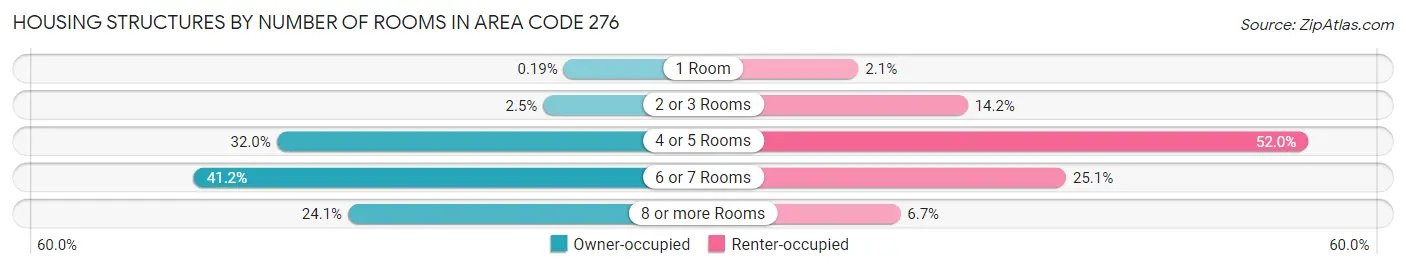
| Number of Rooms | Owner-occupied | Renter-occupied |
| 1 Room | 260 (0.2%) | 994 (2.1%) |
| 2 or 3 Rooms | 3,285 (2.5%) | 6,881 (14.2%) |
| 4 or 5 Rooms | 43,025 (32.0%) | 25,209 (52.0%) |
| 6 or 7 Rooms | 55,348 (41.2%) | 12,179 (25.1%) |
| 8 or more Rooms | 32,398 (24.1%) | 3,253 (6.7%) |
| Total | 134,316 (100.0%) | 48,516 (100.0%) |
Housing Structure by Heating Type in Area Code 276
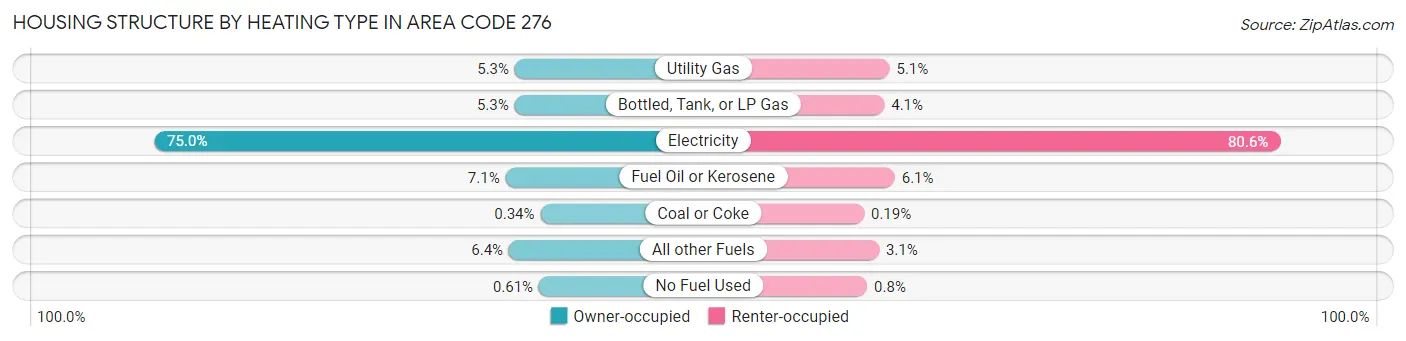
| Heating Type | Owner-occupied | Renter-occupied |
| Utility Gas | 7,066 (5.3%) | 2,482 (5.1%) |
| Bottled, Tank, or LP Gas | 7,139 (5.3%) | 1,994 (4.1%) |
| Electricity | 100,727 (75.0%) | 39,097 (80.6%) |
| Fuel Oil or Kerosene | 9,499 (7.1%) | 2,972 (6.1%) |
| Coal or Coke | 450 (0.3%) | 92 (0.2%) |
| All other Fuels | 8,613 (6.4%) | 1,491 (3.1%) |
| No Fuel Used | 822 (0.6%) | 388 (0.8%) |
| Total | 134,316 (100.0%) | 48,516 (100.0%) |
Household Vehicle Usage in Area Code 276
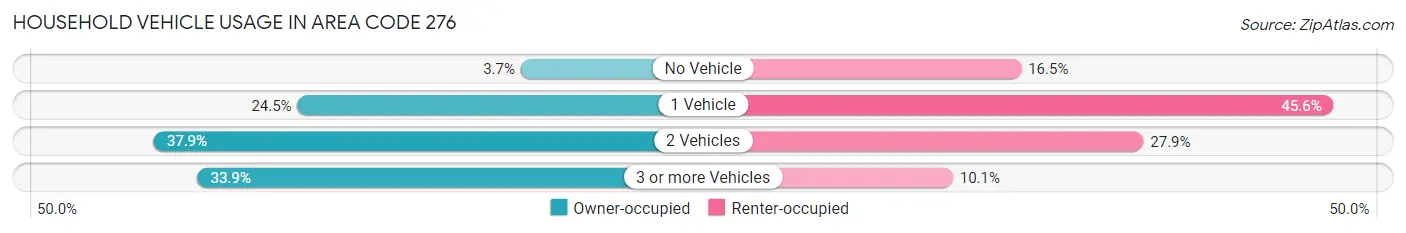
| Vehicles per Household | Owner-occupied | Renter-occupied |
| No Vehicle | 4,949 (3.7%) | 7,985 (16.5%) |
| 1 Vehicle | 32,954 (24.5%) | 22,128 (45.6%) |
| 2 Vehicles | 50,951 (37.9%) | 13,517 (27.9%) |
| 3 or more Vehicles | 45,462 (33.9%) | 4,886 (10.1%) |
| Total | 134,316 (100.0%) | 48,516 (100.0%) |
Real Estate & Mortgages in Area Code 276
Real Estate and Mortgage Overview in Area Code 276
| Characteristic | Without Mortgage | With Mortgage |
| Housing Units | 78,542 | 55,774 |
| Median Property Value | $10,696,700 | $11,986,600 |
| Median Household Income | $4,459,882 | $6,649 |
| Monthly Housing Costs | $35,613 | $1,298 |
| Real Estate Taxes | $66,569 | $1,269 |
Property Value by Mortgage Status in Area Code 276
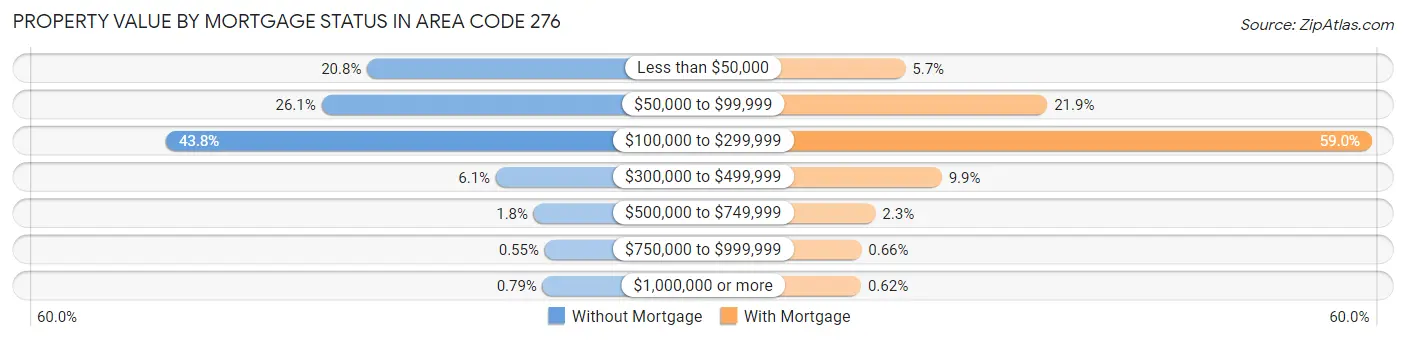
| Property Value | Without Mortgage | With Mortgage |
| Less than $50,000 | 16,365 (20.8%) | 3,171 (5.7%) |
| $50,000 to $99,999 | 20,466 (26.1%) | 12,218 (21.9%) |
| $100,000 to $299,999 | 34,431 (43.8%) | 32,912 (59.0%) |
| $300,000 to $499,999 | 4,817 (6.1%) | 5,491 (9.9%) |
| $500,000 to $749,999 | 1,411 (1.8%) | 1,265 (2.3%) |
| $750,000 to $999,999 | 429 (0.5%) | 369 (0.7%) |
| $1,000,000 or more | 623 (0.8%) | 348 (0.6%) |
| Total | 78,542 (100.0%) | 55,774 (100.0%) |
Household Income by Mortgage Status in Area Code 276
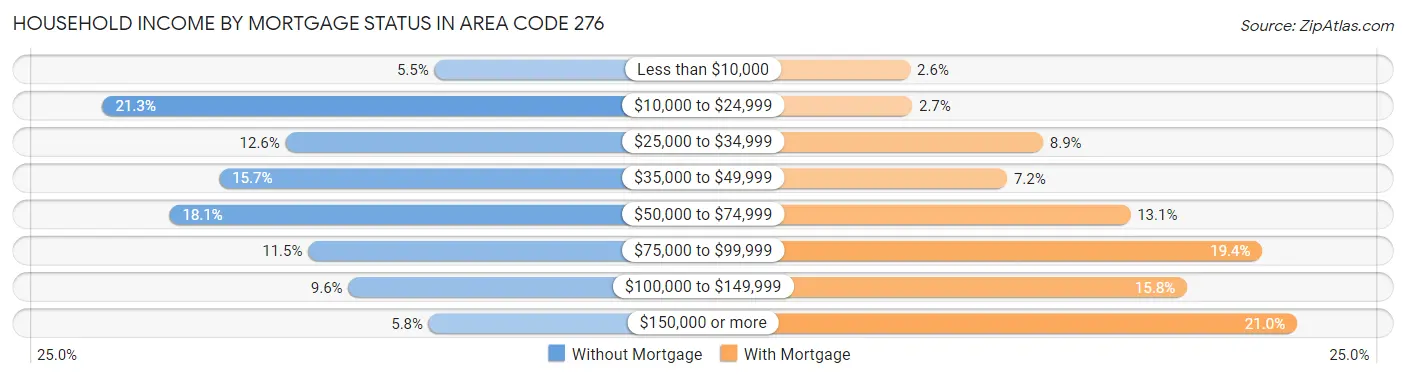
| Household Income | Without Mortgage | With Mortgage |
| Less than $10,000 | 4,306 (5.5%) | 1,448 (2.6%) |
| $10,000 to $24,999 | 16,722 (21.3%) | 1,503 (2.7%) |
| $25,000 to $34,999 | 9,874 (12.6%) | 4,977 (8.9%) |
| $35,000 to $49,999 | 12,353 (15.7%) | 4,022 (7.2%) |
| $50,000 to $74,999 | 14,216 (18.1%) | 7,294 (13.1%) |
| $75,000 to $99,999 | 9,026 (11.5%) | 10,801 (19.4%) |
| $100,000 to $149,999 | 7,526 (9.6%) | 8,806 (15.8%) |
| $150,000 or more | 4,519 (5.8%) | 11,722 (21.0%) |
| Total | 78,542 (100.0%) | 55,774 (100.0%) |
Property Value to Household Income Ratio in Area Code 276
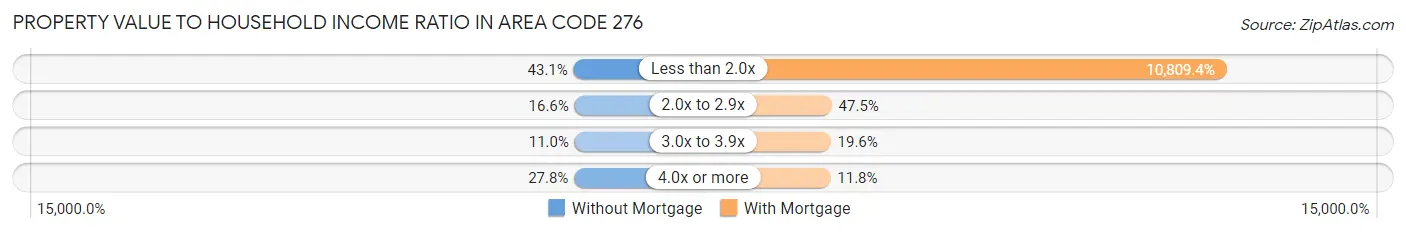
| Value-to-Income Ratio | Without Mortgage | With Mortgage |
| Less than 2.0x | 33,871 (43.1%) | 6,028,831 (10,809.4%) |
| 2.0x to 2.9x | 12,995 (16.6%) | 26,496 (47.5%) |
| 3.0x to 3.9x | 8,656 (11.0%) | 10,930 (19.6%) |
| 4.0x or more | 21,813 (27.8%) | 6,584 (11.8%) |
| Total | 78,542 (100.0%) | 55,774 (100.0%) |
Real Estate Taxes by Mortgage Status in Area Code 276
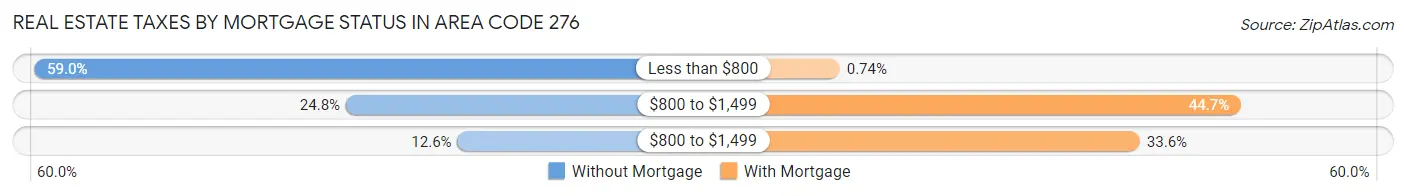
| Property Taxes | Without Mortgage | With Mortgage |
| Less than $800 | 46,303 (59.0%) | 410 (0.7%) |
| $800 to $1,499 | 19,472 (24.8%) | 24,937 (44.7%) |
| $800 to $1,499 | 9,870 (12.6%) | 18,757 (33.6%) |
| Total | 78,542 (100.0%) | 55,774 (100.0%) |
Health & Disability in Area Code 276
Health Insurance Coverage by Age in Area Code 276
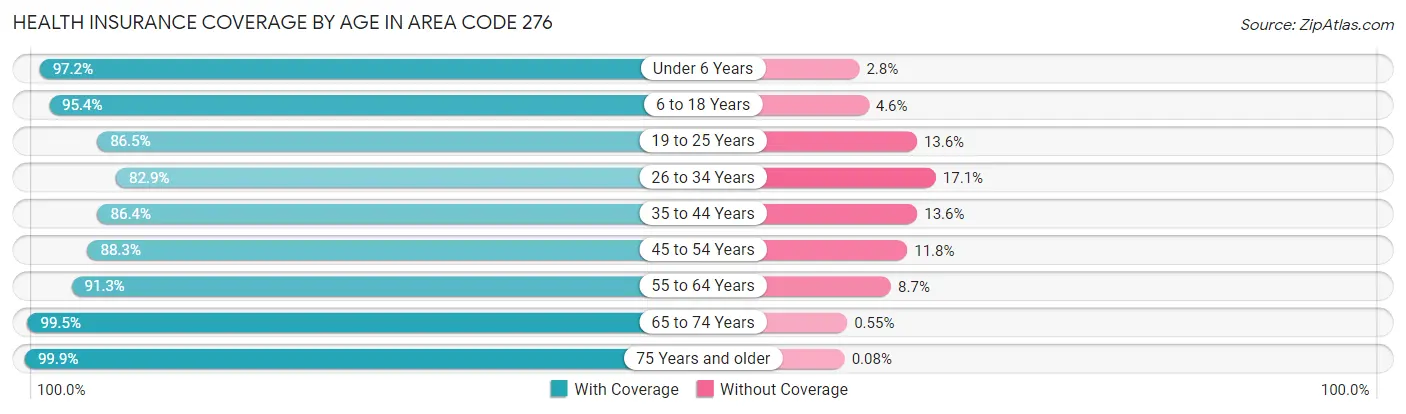
| Age Bracket | With Coverage | Without Coverage |
| Under 6 Years | 24,373 (97.2%) | 709 (2.8%) |
| 6 to 18 Years | 61,467 (95.4%) | 2,942 (4.6%) |
| 19 to 25 Years | 28,368 (86.5%) | 4,446 (13.6%) |
| 26 to 34 Years | 34,587 (82.9%) | 7,126 (17.1%) |
| 35 to 44 Years | 42,214 (86.4%) | 6,655 (13.6%) |
| 45 to 54 Years | 51,258 (88.2%) | 6,827 (11.7%) |
| 55 to 64 Years | 60,644 (91.3%) | 5,806 (8.7%) |
| 65 to 74 Years | 58,207 (99.5%) | 322 (0.5%) |
| 75 Years and older | 42,107 (99.9%) | 35 (0.1%) |
| Total | 403,225 (92.0%) | 34,868 (8.0%) |
Health Insurance Coverage by Citizenship Status in Area Code 276
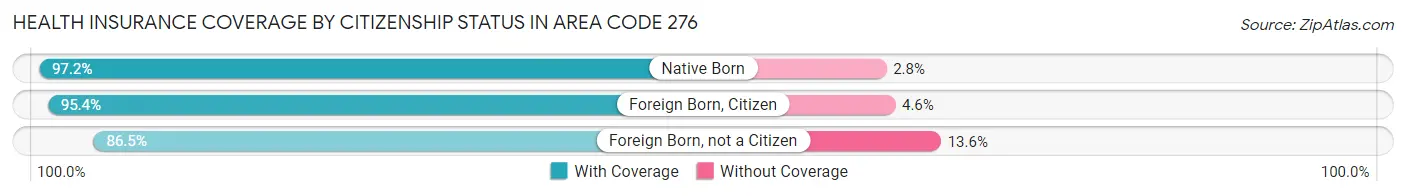
| Citizenship Status | With Coverage | Without Coverage |
| Native Born | 24,373 (97.2%) | 709 (2.8%) |
| Foreign Born, Citizen | 61,467 (95.4%) | 2,942 (4.6%) |
| Foreign Born, not a Citizen | 28,368 (86.5%) | 4,446 (13.6%) |
Health Insurance Coverage by Household Income in Area Code 276
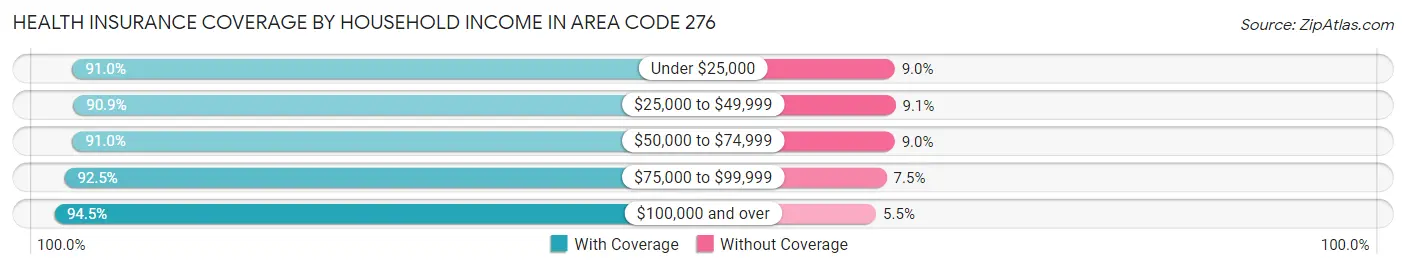
| Household Income | With Coverage | Without Coverage |
| Under $25,000 | 75,107 (91.0%) | 7,411 (9.0%) |
| $25,000 to $49,999 | 94,633 (90.9%) | 9,504 (9.1%) |
| $50,000 to $74,999 | 73,972 (91.0%) | 7,297 (9.0%) |
| $75,000 to $99,999 | 56,281 (92.5%) | 4,542 (7.5%) |
| $100,000 and over | 100,782 (94.5%) | 5,866 (5.5%) |
Public vs Private Health Insurance Coverage by Age in Area Code 276
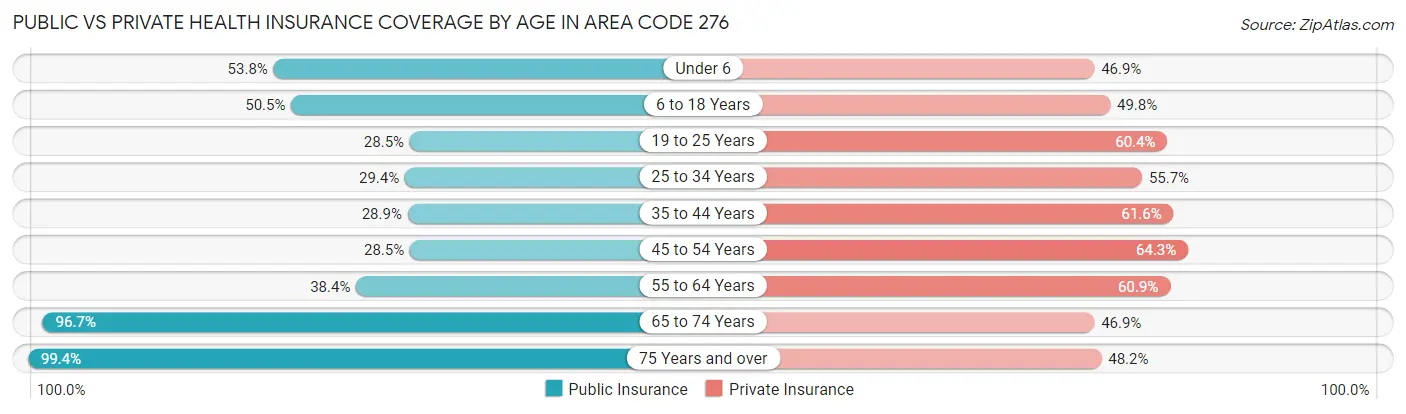
| Age Bracket | Public Insurance | Private Insurance |
| Under 6 | 13,486 (53.8%) | 11,751 (46.9%) |
| 6 to 18 Years | 32,524 (50.5%) | 32,069 (49.8%) |
| 19 to 25 Years | 9,345 (28.5%) | 19,834 (60.4%) |
| 25 to 34 Years | 12,260 (29.4%) | 23,237 (55.7%) |
| 35 to 44 Years | 14,112 (28.9%) | 30,089 (61.6%) |
| 45 to 54 Years | 16,531 (28.5%) | 37,339 (64.3%) |
| 55 to 64 Years | 25,545 (38.4%) | 40,494 (60.9%) |
| 65 to 74 Years | 56,571 (96.7%) | 27,420 (46.9%) |
| 75 Years and over | 41,891 (99.4%) | 20,294 (48.2%) |
| Total | 222,265 (50.7%) | 242,527 (55.4%) |
Disability Status by Sex by Age in Area Code 276
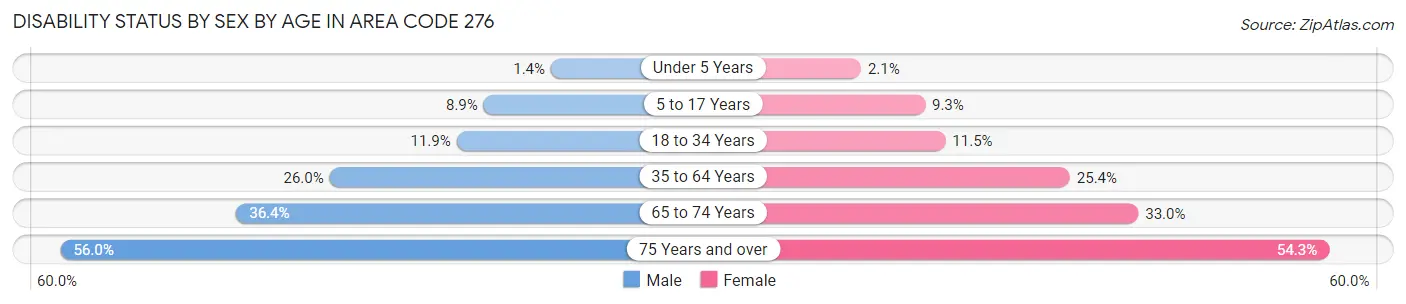
| Age Bracket | Male | Female |
| Under 5 Years | 146 (1.4%) | 212 (2.1%) |
| 5 to 17 Years | 2,944 (8.9%) | 2,899 (9.3%) |
| 18 to 34 Years | 4,823 (11.9%) | 4,456 (11.5%) |
| 35 to 64 Years | 22,424 (26.0%) | 22,170 (25.4%) |
| 65 to 74 Years | 10,192 (36.4%) | 10,086 (33.0%) |
| 75 Years and over | 9,988 (56.0%) | 13,189 (54.3%) |
Disability Class by Sex by Age in Area Code 276
Disability Class: Hearing Difficulty
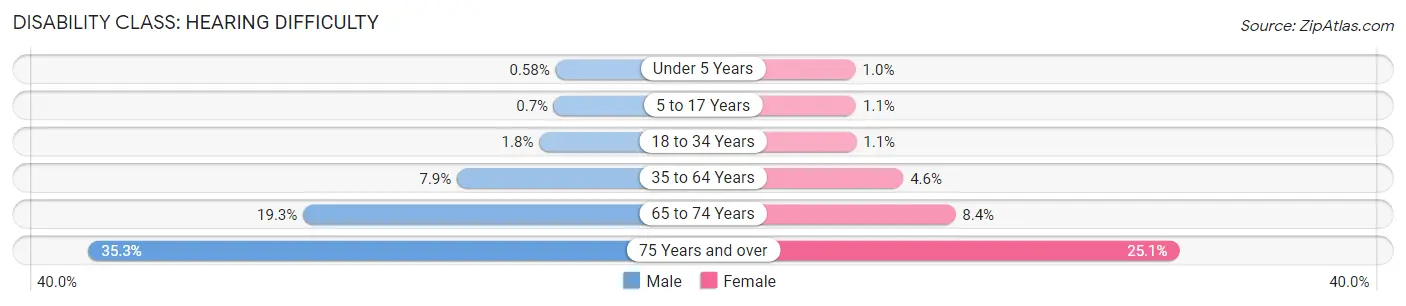
| Age Bracket | Male | Female |
| Under 5 Years | 61 (0.6%) | 102 (1.0%) |
| 5 to 17 Years | 232 (0.7%) | 331 (1.1%) |
| 18 to 34 Years | 725 (1.8%) | 416 (1.1%) |
| 35 to 64 Years | 6,794 (7.9%) | 3,980 (4.6%) |
| 65 to 74 Years | 5,407 (19.3%) | 2,576 (8.4%) |
| 75 Years and over | 6,288 (35.3%) | 6,092 (25.1%) |
Disability Class: Vision Difficulty
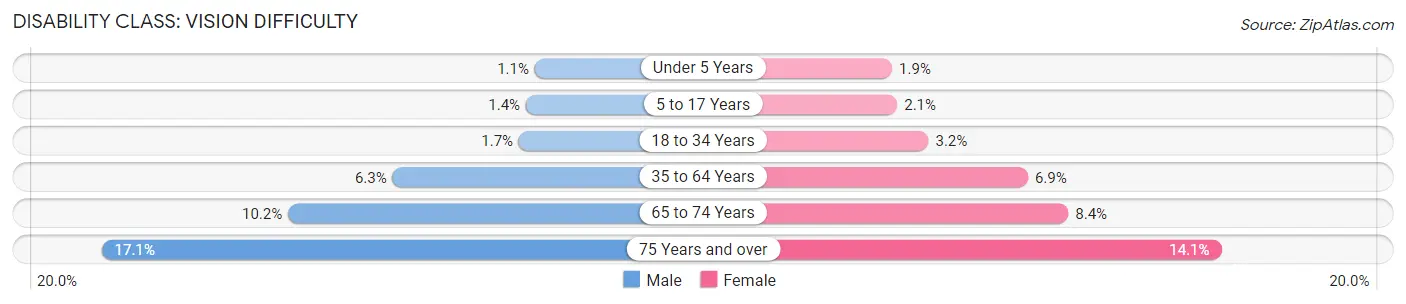
| Age Bracket | Male | Female |
| Under 5 Years | 111 (1.1%) | 185 (1.9%) |
| 5 to 17 Years | 462 (1.4%) | 644 (2.1%) |
| 18 to 34 Years | 670 (1.7%) | 1,242 (3.2%) |
| 35 to 64 Years | 5,461 (6.3%) | 6,029 (6.9%) |
| 65 to 74 Years | 2,861 (10.2%) | 2,567 (8.4%) |
| 75 Years and over | 3,057 (17.1%) | 3,425 (14.1%) |
Disability Class: Cognitive Difficulty
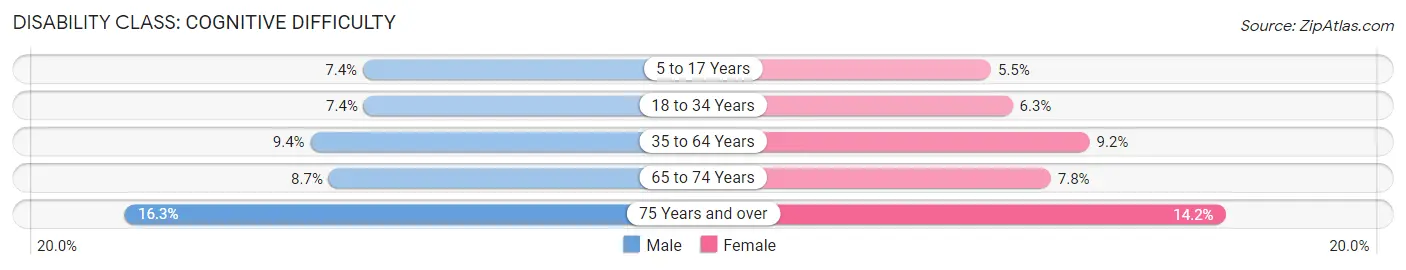
| Age Bracket | Male | Female |
| 5 to 17 Years | 2,466 (7.4%) | 1,731 (5.5%) |
| 18 to 34 Years | 3,006 (7.4%) | 2,448 (6.3%) |
| 35 to 64 Years | 8,085 (9.4%) | 8,029 (9.2%) |
| 65 to 74 Years | 2,437 (8.7%) | 2,370 (7.8%) |
| 75 Years and over | 2,901 (16.3%) | 3,461 (14.2%) |
Disability Class: Ambulatory Difficulty
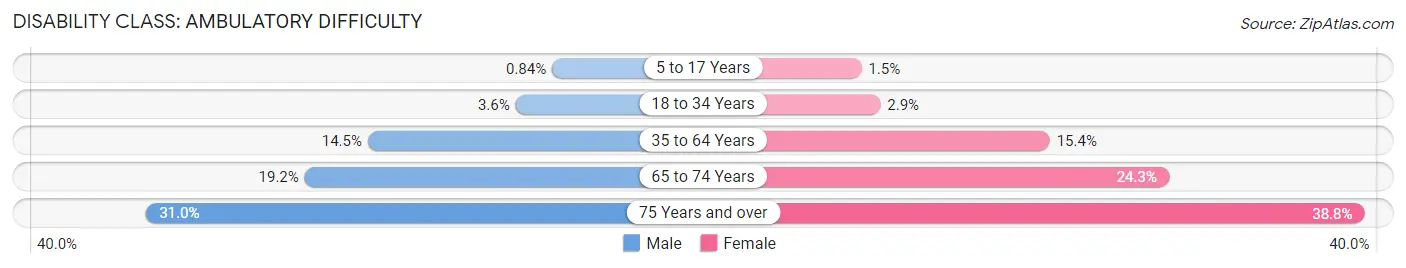
| Age Bracket | Male | Female |
| 5 to 17 Years | 279 (0.8%) | 455 (1.5%) |
| 18 to 34 Years | 1,441 (3.5%) | 1,103 (2.9%) |
| 35 to 64 Years | 12,505 (14.5%) | 13,475 (15.4%) |
| 65 to 74 Years | 5,377 (19.2%) | 7,413 (24.3%) |
| 75 Years and over | 5,523 (31.0%) | 9,428 (38.8%) |
Disability Class: Self-Care Difficulty
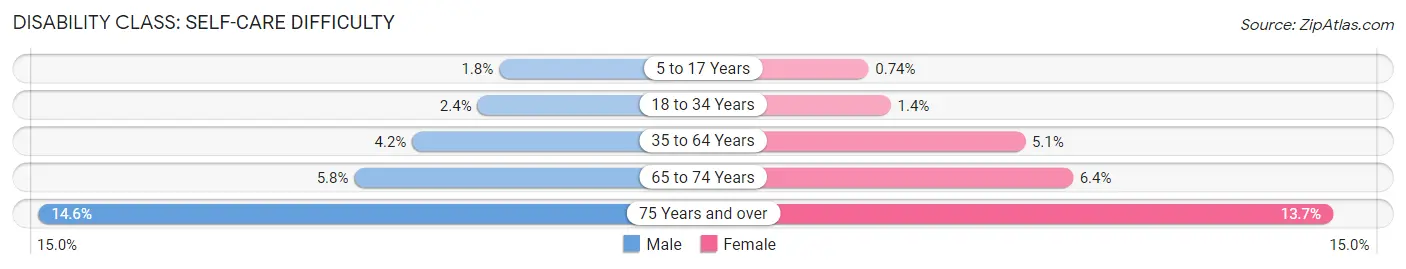
| Age Bracket | Male | Female |
| 5 to 17 Years | 592 (1.8%) | 232 (0.7%) |
| 18 to 34 Years | 968 (2.4%) | 527 (1.4%) |
| 35 to 64 Years | 3,629 (4.2%) | 4,456 (5.1%) |
| 65 to 74 Years | 1,630 (5.8%) | 1,965 (6.4%) |
| 75 Years and over | 2,605 (14.6%) | 3,322 (13.7%) |
Technology Access in Area Code 276
Computing Device Access in Area Code 276
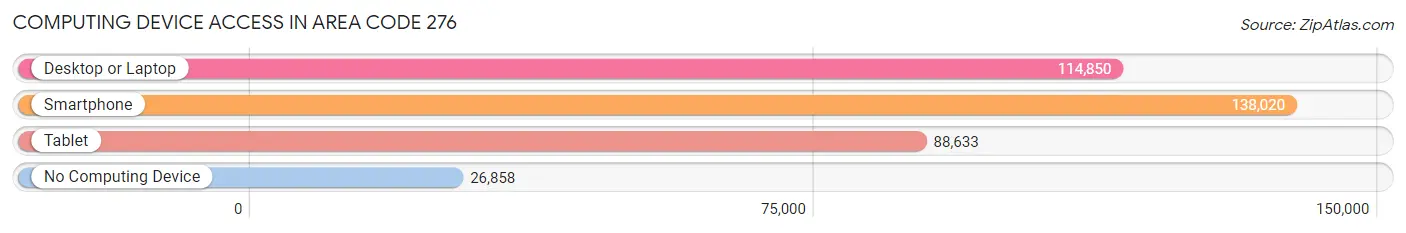
| Device Type | # Households | % Households |
| Desktop or Laptop | 114,850 | 62.8% |
| Smartphone | 138,020 | 75.5% |
| Tablet | 88,633 | 48.5% |
| No Computing Device | 26,858 | 14.7% |
| Total | 182,832 | 100.0% |
Internet Access in Area Code 276
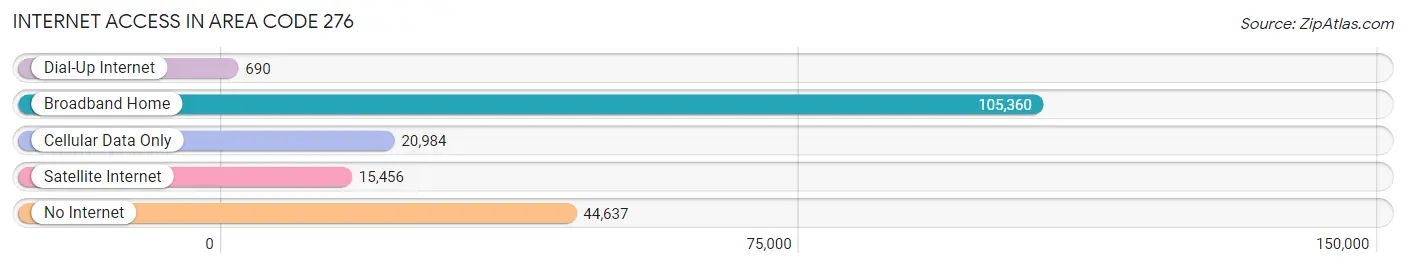
| Internet Type | # Households | % Households |
| Dial-Up Internet | 690 | 0.4% |
| Broadband Home | 105,360 | 57.6% |
| Cellular Data Only | 20,984 | 11.5% |
| Satellite Internet | 15,456 | 8.5% |
| No Internet | 44,637 | 24.4% |
| Total | 182,832 | 100.0% |
Area Code 276 Summary
Geography
Area code 276 is a telephone area code in the North American Numbering Plan (NANP) for the southwestern portion of the U.S. state of Virginia. It serves the cities of Bristol, Galax, Martinsville, Norton, and Radford, as well as the counties of Bland, Carroll, Grayson, Lee, Russell, Scott, Smyth, Tazewell, Washington, and Wythe.
Social
Area code 276 is home to a diverse population of people from all walks of life. The area is known for its strong sense of community and its friendly people. The area is also home to a variety of cultural attractions, including museums, galleries, and theaters.
Economics
Area code 276 is a major economic hub in the region. The area is home to a number of large companies, including Eastman Chemical Company, Volvo Trucks North America, and American Electric Power. The area also has a thriving tourism industry, with many visitors coming to the area to enjoy its natural beauty and outdoor activities.
Demographics
Area code 276 is home to a population of over 1.2 million people. The area is predominantly white, with a large African American population. The median household income is around $45,000, and the median age is around 38 years old. The area is also home to a large number of college students, with several universities and colleges located in the area.
Common Questions
What is Per Capita Income in Area Code 276?
Per Capita income in Area Code 276 is $25,495.
What is the Median Family Income in Area Code 276?
Median Family Income in Area Code 276 is $59,129.
What is the Median Household income in Area Code 276?
Median Household Income in Area Code 276 is $46,240.
What is Income or Wage Gap in Area Code 276?
Income or Wage Gap in Area Code 276 is 27.4%.
Women in Area Code 276 earn 72.6 cents for every dollar earned by a man.
What is Family Income Deficit in Area Code 276?
Family Income Deficit in Area Code 276 is $10,262.
Families that are below poverty line in Area Code 276 earn $10,262 less on average than the poverty threshold level.
What is Inequality or Gini Index in Area Code 276?
Inequality or Gini Index in Area Code 276 is 46.55.
What is the Total Population of Area Code 276?
Total Population of Area Code 276 is 451,261.
What is the Total Male Population of Area Code 276?
Total Male Population of Area Code 276 is 226,183.
What is the Total Female Population of Area Code 276?
Total Female Population of Area Code 276 is 225,078.
What is the Ratio of Males per 100 Females in Area Code 276?
There are 100.49 Males per 100 Females in Area Code 276.
What is the Ratio of Females per 100 Males in Area Code 276?
There are 99.51 Females per 100 Males in Area Code 276.
What is the Median Population Age in Area Code 276?
Median Population Age in Area Code 276 is 47.7 Years.
What is the Average Family Size in Area Code 276
Average Family Size in Area Code 276 is 3.0 People.
What is the Average Household Size in Area Code 276
Average Household Size in Area Code 276 is 2.5 People.
How Large is the Labor Force in Area Code 276?
There are 168,801 People in the Labor Forcein in Area Code 276.
What is the Percentage of People in the Labor Force in Area Code 276?
44.8% of People are in the Labor Force in Area Code 276.
What is the Unemployment Rate in Area Code 276?
Unemployment Rate in Area Code 276 is 7.8%.