Madison County, VA Map & Demographics
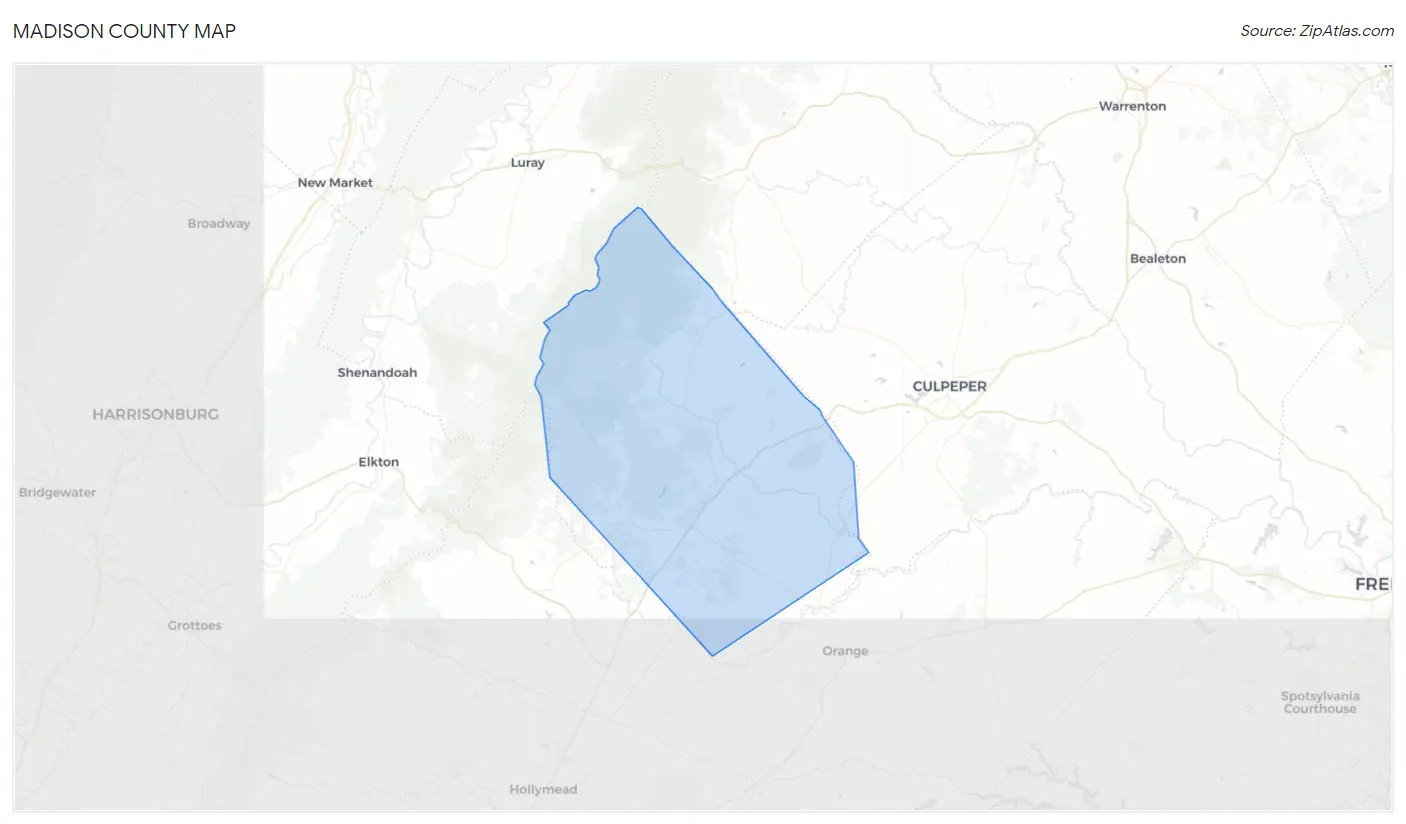
Madison County Map
Madison County Overview
$35,772
PER CAPITA INCOME
$92,274
AVG FAMILY INCOME
$74,586
AVG HOUSEHOLD INCOME
28.1%
WAGE / INCOME GAP [ % ]
71.9¢/ $1
WAGE / INCOME GAP [ $ ]
0.42
INEQUALITY / GINI INDEX
13,828
TOTAL POPULATION
6,764
MALE POPULATION
7,064
FEMALE POPULATION
95.75
MALES / 100 FEMALES
104.44
FEMALES / 100 MALES
46.6
MEDIAN AGE
3.0
AVG FAMILY SIZE
2.5
AVG HOUSEHOLD SIZE
6,908
LABOR FORCE [ PEOPLE ]
60.5%
PERCENT IN LABOR FORCE
3.7%
UNEMPLOYMENT RATE
Income in Madison County
Income Overview in Madison County
Per Capita Income in Madison County is $35,772, while median incomes of families and households are $92,274 and $74,586 respectively.
| Characteristic | Number | Measure |
| Per Capita Income | 13,828 | $35,772 |
| Median Family Income | 3,803 | $92,274 |
| Mean Family Income | 3,803 | $105,812 |
| Median Household Income | 5,324 | $74,586 |
| Mean Household Income | 5,324 | $91,898 |
| Income Deficit | 3,803 | $0 |
| Wage / Income Gap (%) | 13,828 | 28.13% |
| Wage / Income Gap ($) | 13,828 | 71.87¢ per $1 |
| Gini / Inequality Index | 13,828 | 0.42 |
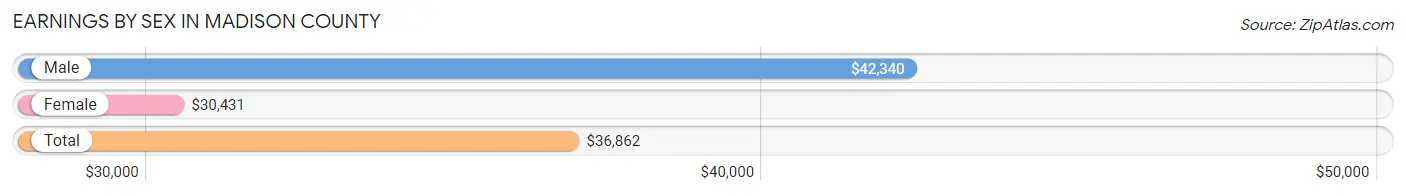
Earnings by Sex in Madison County
Average Earnings in Madison County are $36,862, $42,340 for men and $30,431 for women, a difference of 28.1%.
| Sex | Number | Average Earnings |
| Male | 3,813 (53.0%) | $42,340 |
| Female | 3,379 (47.0%) | $30,431 |
| Total | 7,192 (100.0%) | $36,862 |
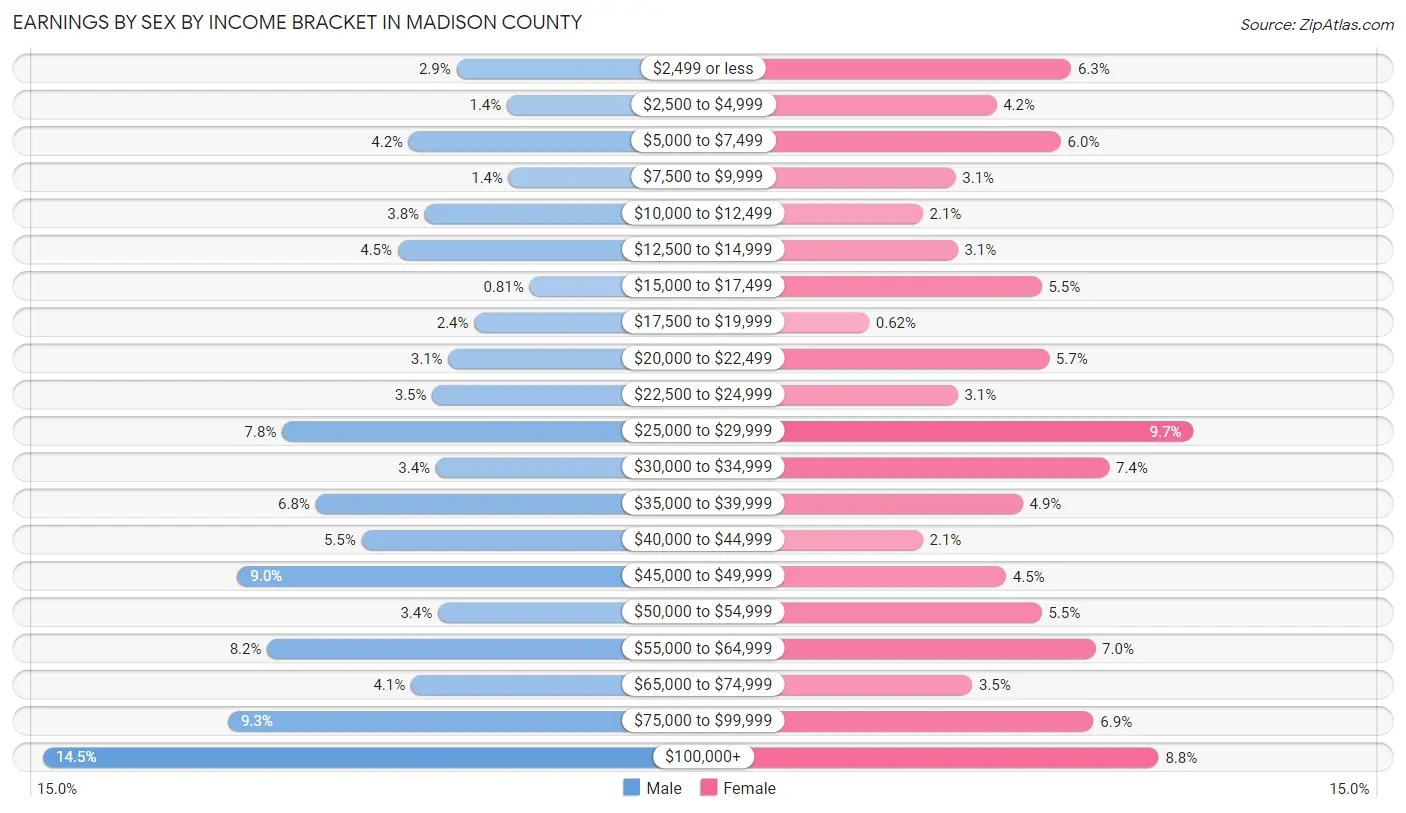
Earnings by Sex by Income Bracket in Madison County
The most common earnings brackets in Madison County are $100,000+ for men (552 | 14.5%) and $25,000 to $29,999 for women (329 | 9.7%).
| Income | Male | Female |
| $2,499 or less | 109 (2.9%) | 213 (6.3%) |
| $2,500 to $4,999 | 55 (1.4%) | 142 (4.2%) |
| $5,000 to $7,499 | 160 (4.2%) | 203 (6.0%) |
| $7,500 to $9,999 | 53 (1.4%) | 103 (3.0%) |
| $10,000 to $12,499 | 143 (3.7%) | 72 (2.1%) |
| $12,500 to $14,999 | 172 (4.5%) | 105 (3.1%) |
| $15,000 to $17,499 | 31 (0.8%) | 185 (5.5%) |
| $17,500 to $19,999 | 90 (2.4%) | 21 (0.6%) |
| $20,000 to $22,499 | 118 (3.1%) | 192 (5.7%) |
| $22,500 to $24,999 | 135 (3.5%) | 105 (3.1%) |
| $25,000 to $29,999 | 296 (7.8%) | 329 (9.7%) |
| $30,000 to $34,999 | 131 (3.4%) | 249 (7.4%) |
| $35,000 to $39,999 | 260 (6.8%) | 167 (4.9%) |
| $40,000 to $44,999 | 211 (5.5%) | 72 (2.1%) |
| $45,000 to $49,999 | 344 (9.0%) | 151 (4.5%) |
| $50,000 to $54,999 | 129 (3.4%) | 185 (5.5%) |
| $55,000 to $64,999 | 312 (8.2%) | 236 (7.0%) |
| $65,000 to $74,999 | 158 (4.1%) | 119 (3.5%) |
| $75,000 to $99,999 | 354 (9.3%) | 234 (6.9%) |
| $100,000+ | 552 (14.5%) | 296 (8.8%) |
| Total | 3,813 (100.0%) | 3,379 (100.0%) |
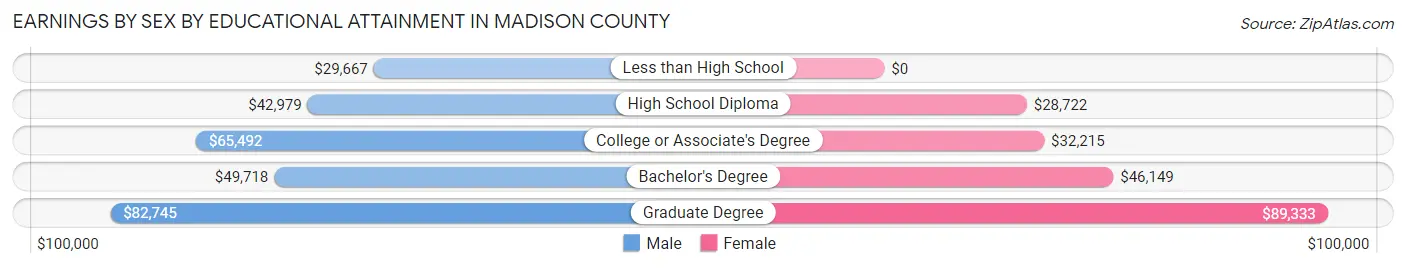
Earnings by Sex by Educational Attainment in Madison County
Average earnings in Madison County are $46,648 for men and $34,145 for women, a difference of 26.8%. Men with an educational attainment of graduate degree enjoy the highest average annual earnings of $82,745, while those with less than high school education earn the least with $29,667. Women with an educational attainment of graduate degree earn the most with the average annual earnings of $89,333, while those with high school diploma education have the smallest earnings of $28,722.
| Educational Attainment | Male Income | Female Income |
| Less than High School | $29,667 | $0 |
| High School Diploma | $42,979 | $28,722 |
| College or Associate's Degree | $65,492 | $32,215 |
| Bachelor's Degree | $49,718 | $46,149 |
| Graduate Degree | $82,745 | $89,333 |
| Total | $46,648 | $34,145 |
Family Income in Madison County
Family Income Brackets in Madison County
According to the Madison County family income data, there are 1,088 families falling into the $100,000 to $149,999 income range, which is the most common income bracket and makes up 28.6% of all families. Conversely, the less than $10,000 income bracket is the least frequent group with only 23 families (0.6%) belonging to this category.
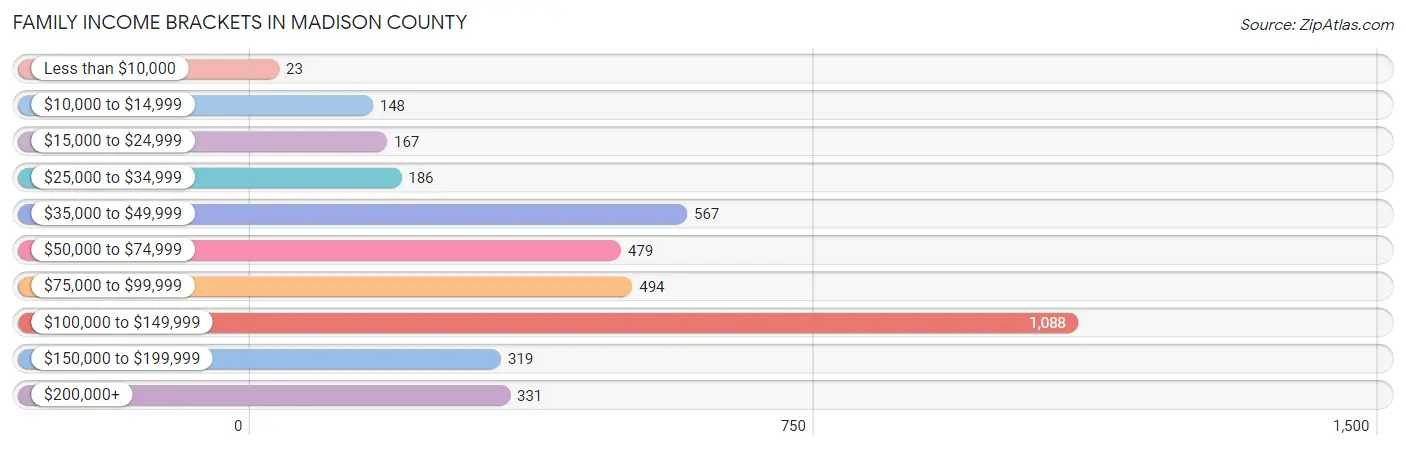
| Income Bracket | # Families | % Families |
| Less than $10,000 | 23 | 0.6% |
| $10,000 to $14,999 | 148 | 3.9% |
| $15,000 to $24,999 | 167 | 4.4% |
| $25,000 to $34,999 | 186 | 4.9% |
| $35,000 to $49,999 | 567 | 14.9% |
| $50,000 to $74,999 | 479 | 12.6% |
| $75,000 to $99,999 | 494 | 13.0% |
| $100,000 to $149,999 | 1,088 | 28.6% |
| $150,000 to $199,999 | 319 | 8.4% |
| $200,000+ | 331 | 8.7% |
Family Income by Famaliy Size in Madison County
4-person families (568 | 14.9%) account for the highest median family income in Madison County with $125,924 per family, while 2-person families (1,814 | 47.7%) have the highest median income of $37,099 per family member.
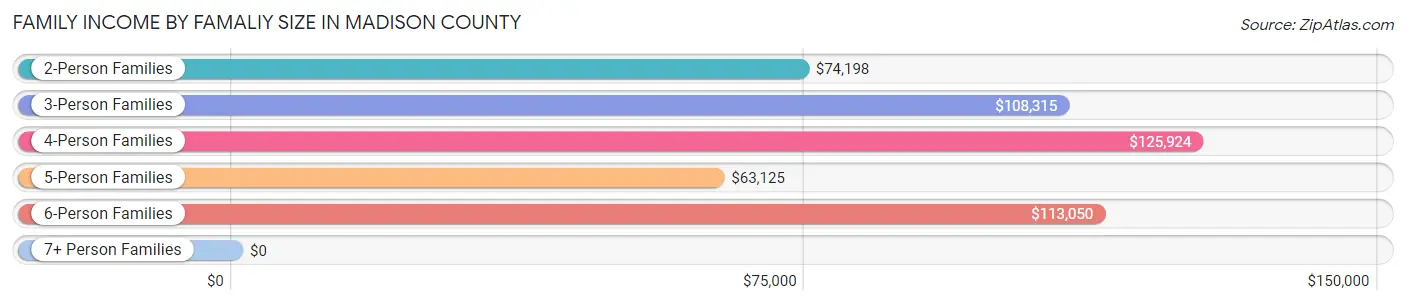
| Income Bracket | # Families | Median Income |
| 2-Person Families | 1,814 (47.7%) | $74,198 |
| 3-Person Families | 826 (21.7%) | $108,315 |
| 4-Person Families | 568 (14.9%) | $125,924 |
| 5-Person Families | 395 (10.4%) | $63,125 |
| 6-Person Families | 137 (3.6%) | $113,050 |
| 7+ Person Families | 63 (1.7%) | $0 |
| Total | 3,803 (100.0%) | $92,274 |
Family Income by Number of Earners in Madison County
The median family income in Madison County is $92,274, with families comprising 3+ earners (582) having the highest median family income of $133,750, while families with no earners (771) have the lowest median family income of $45,225, accounting for 15.3% and 20.3% of families, respectively.
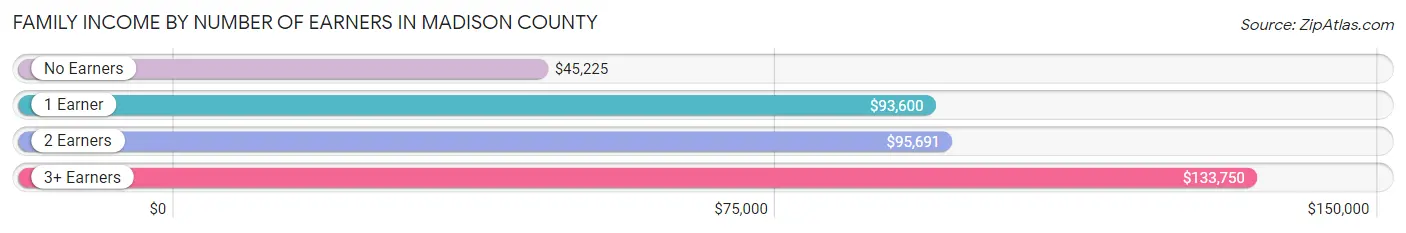
| Number of Earners | # Families | Median Income |
| No Earners | 771 (20.3%) | $45,225 |
| 1 Earner | 1,000 (26.3%) | $93,600 |
| 2 Earners | 1,450 (38.1%) | $95,691 |
| 3+ Earners | 582 (15.3%) | $133,750 |
| Total | 3,803 (100.0%) | $92,274 |
Household Income in Madison County
Household Income Brackets in Madison County
With 1,299 households falling in the category, the $100,000 to $149,999 income range is the most frequent in Madison County, accounting for 24.4% of all households. In contrast, only 154 households (2.9%) fall into the less than $10,000 income bracket, making it the least populous group.
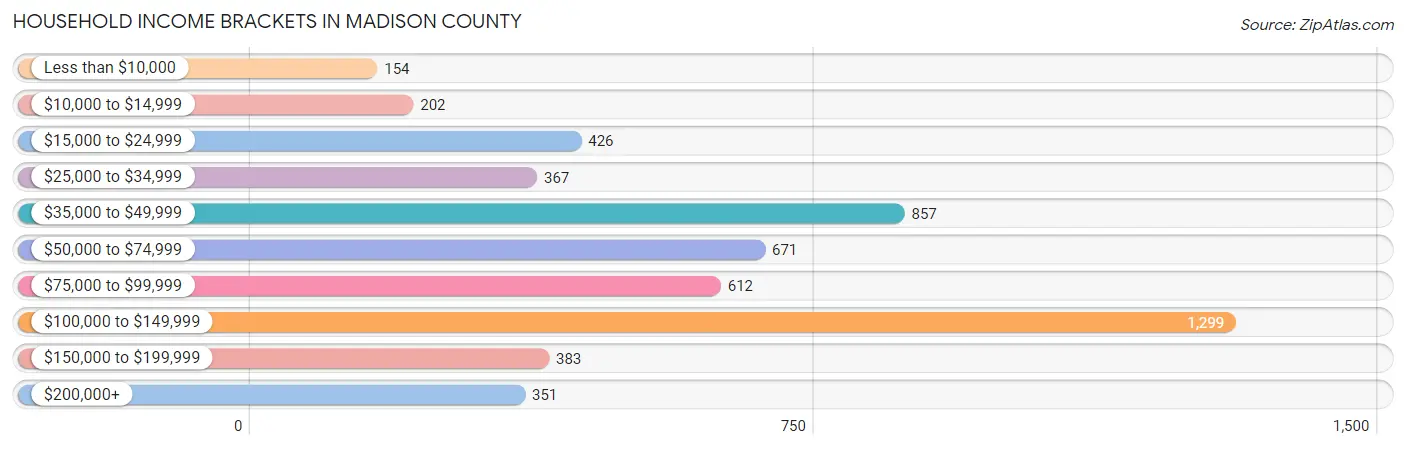
| Income Bracket | # Households | % Households |
| Less than $10,000 | 154 | 2.9% |
| $10,000 to $14,999 | 202 | 3.8% |
| $15,000 to $24,999 | 426 | 8.0% |
| $25,000 to $34,999 | 367 | 6.9% |
| $35,000 to $49,999 | 857 | 16.1% |
| $50,000 to $74,999 | 671 | 12.6% |
| $75,000 to $99,999 | 612 | 11.5% |
| $100,000 to $149,999 | 1,299 | 24.4% |
| $150,000 to $199,999 | 383 | 7.2% |
| $200,000+ | 351 | 6.6% |
Household Income by Householder Age in Madison County
The median household income in Madison County is $74,586, with the highest median household income of $88,750 found in the 45 to 64 years age bracket for the primary householder. A total of 2,222 households (41.7%) fall into this category. Meanwhile, the 65+ years age bracket for the primary householder has the lowest median household income of $50,609, with 1,887 households (35.4%) in this group.
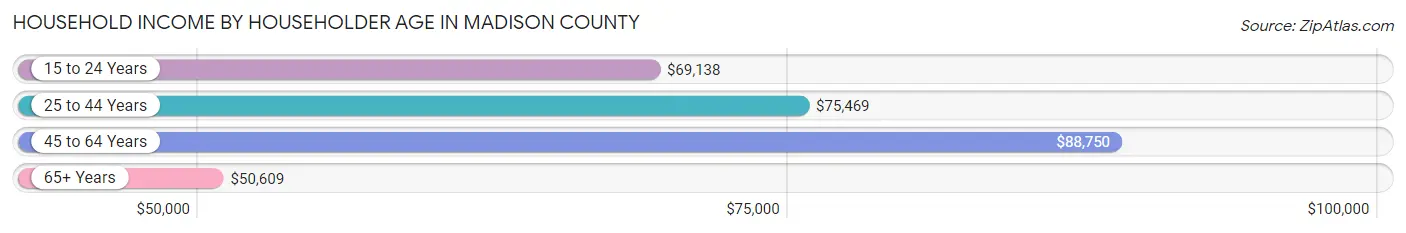
| Income Bracket | # Households | Median Income |
| 15 to 24 Years | 44 (0.8%) | $69,138 |
| 25 to 44 Years | 1,171 (22.0%) | $75,469 |
| 45 to 64 Years | 2,222 (41.7%) | $88,750 |
| 65+ Years | 1,887 (35.4%) | $50,609 |
| Total | 5,324 (100.0%) | $74,586 |
Poverty in Madison County
Income Below Poverty by Sex and Age in Madison County
With 9.7% poverty level for males and 6.3% for females among the residents of Madison County, 16 and 17 year old males and 35 to 44 year old females are the most vulnerable to poverty, with 54 males (22.1%) and 117 females (16.3%) in their respective age groups living below the poverty level.
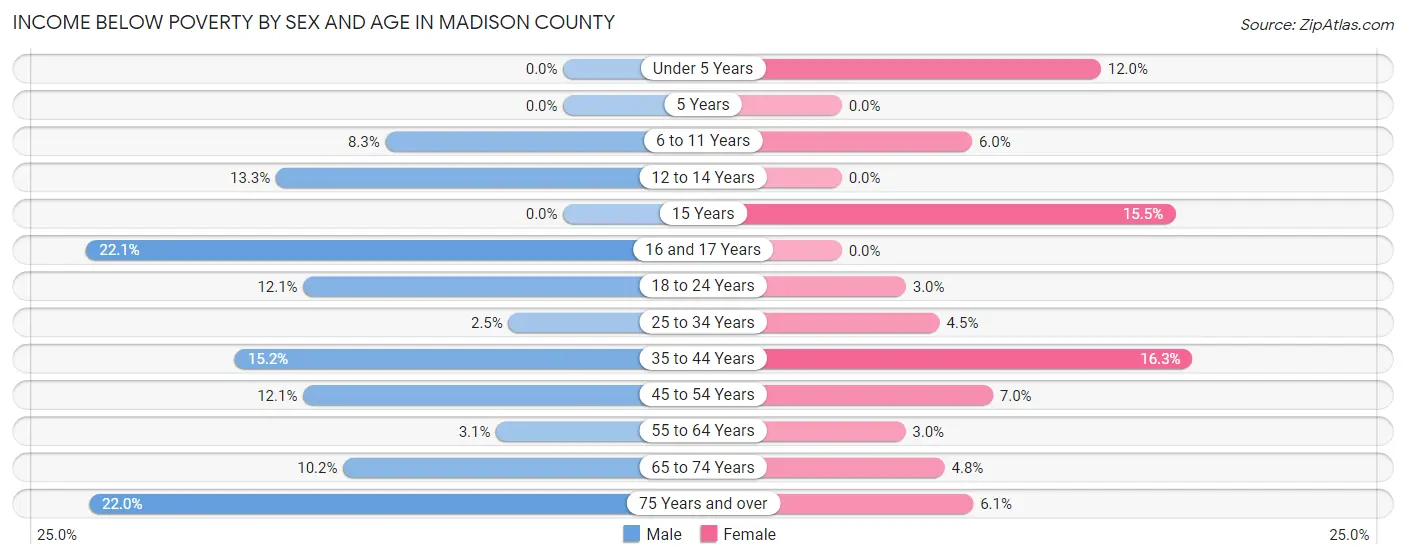
| Age Bracket | Male | Female |
| Under 5 Years | 0 (0.0%) | 50 (12.0%) |
| 5 Years | 0 (0.0%) | 0 (0.0%) |
| 6 to 11 Years | 42 (8.3%) | 30 (6.0%) |
| 12 to 14 Years | 20 (13.3%) | 0 (0.0%) |
| 15 Years | 0 (0.0%) | 15 (15.5%) |
| 16 and 17 Years | 54 (22.1%) | 0 (0.0%) |
| 18 to 24 Years | 52 (12.1%) | 14 (3.0%) |
| 25 to 34 Years | 21 (2.5%) | 31 (4.5%) |
| 35 to 44 Years | 110 (15.2%) | 117 (16.3%) |
| 45 to 54 Years | 95 (12.1%) | 61 (7.0%) |
| 55 to 64 Years | 34 (3.1%) | 35 (2.9%) |
| 65 to 74 Years | 100 (10.2%) | 46 (4.8%) |
| 75 Years and over | 118 (22.0%) | 38 (6.1%) |
| Total | 646 (9.7%) | 437 (6.3%) |
Income Above Poverty by Sex and Age in Madison County
According to the poverty statistics in Madison County, males aged under 5 years and females aged 5 years are the age groups that are most secure financially, with 100.0% of males and 100.0% of females in these age groups living above the poverty line.
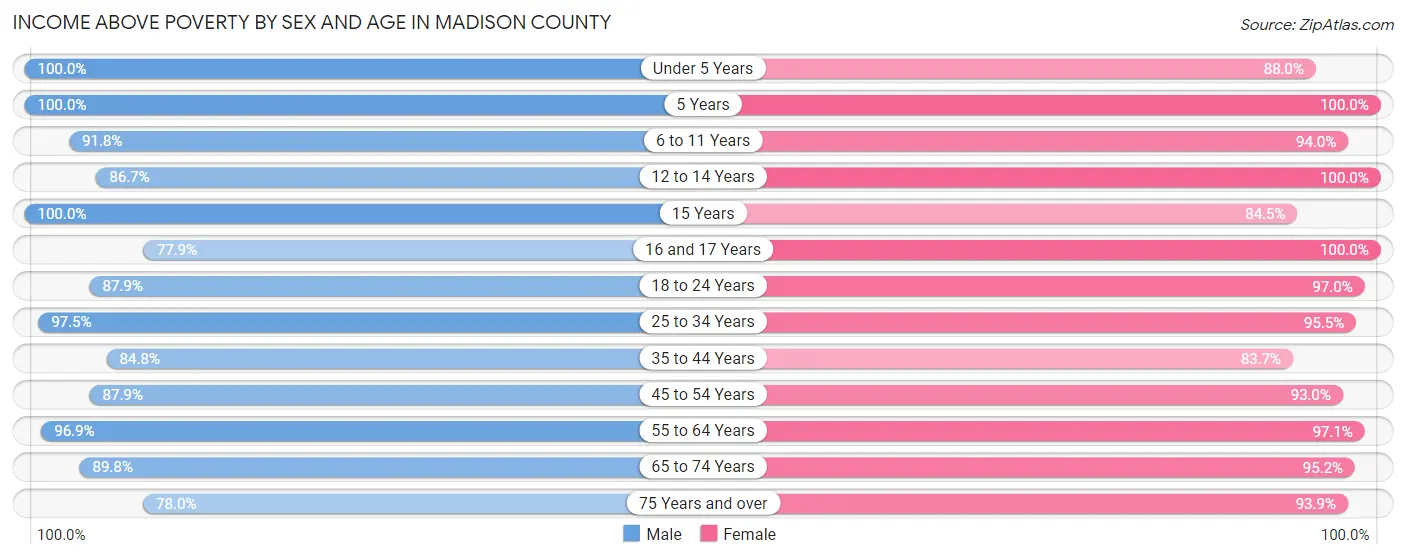
| Age Bracket | Male | Female |
| Under 5 Years | 293 (100.0%) | 366 (88.0%) |
| 5 Years | 99 (100.0%) | 66 (100.0%) |
| 6 to 11 Years | 467 (91.7%) | 467 (94.0%) |
| 12 to 14 Years | 130 (86.7%) | 226 (100.0%) |
| 15 Years | 7 (100.0%) | 82 (84.5%) |
| 16 and 17 Years | 190 (77.9%) | 114 (100.0%) |
| 18 to 24 Years | 379 (87.9%) | 458 (97.0%) |
| 25 to 34 Years | 807 (97.5%) | 652 (95.5%) |
| 35 to 44 Years | 612 (84.8%) | 602 (83.7%) |
| 45 to 54 Years | 692 (87.9%) | 809 (93.0%) |
| 55 to 64 Years | 1,059 (96.9%) | 1,151 (97.1%) |
| 65 to 74 Years | 879 (89.8%) | 919 (95.2%) |
| 75 Years and over | 418 (78.0%) | 585 (93.9%) |
| Total | 6,032 (90.3%) | 6,497 (93.7%) |
Income Below Poverty Among Married-Couple Families in Madison County
The poverty statistics for married-couple families in Madison County show that 3.2% or 95 of the total 2,986 families live below the poverty line. Families with 3 or 4 children have the highest poverty rate of 8.4%, comprising of 42 families. On the other hand, families with no children have the lowest poverty rate of 1.3%, which includes 24 families.
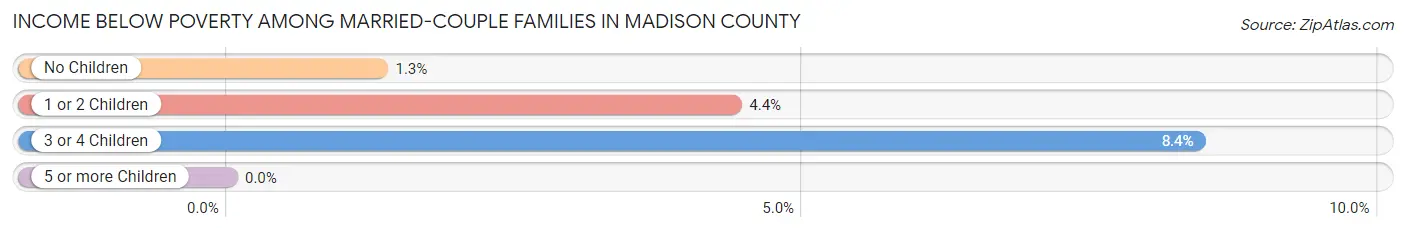
| Children | Above Poverty | Below Poverty |
| No Children | 1,803 (98.7%) | 24 (1.3%) |
| 1 or 2 Children | 631 (95.6%) | 29 (4.4%) |
| 3 or 4 Children | 457 (91.6%) | 42 (8.4%) |
| 5 or more Children | 0 (0.0%) | 0 (0.0%) |
| Total | 2,891 (96.8%) | 95 (3.2%) |
Income Below Poverty Among Single-Parent Households in Madison County
According to the poverty data in Madison County, 29.7% or 94 single-father households and 6.6% or 33 single-mother households are living below the poverty line. Among single-father households, those with no children have the highest poverty rate, with 94 households (49.2%) experiencing poverty. Likewise, among single-mother households, those with no children have the highest poverty rate, with 28 households (10.1%) falling below the poverty line.
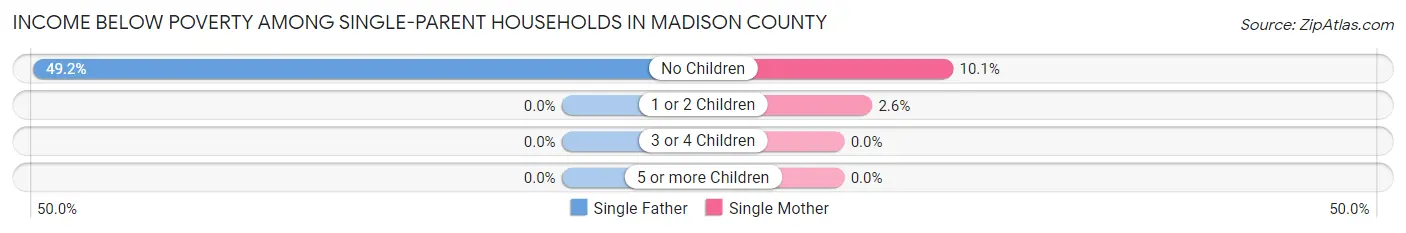
| Children | Single Father | Single Mother |
| No Children | 94 (49.2%) | 28 (10.1%) |
| 1 or 2 Children | 0 (0.0%) | 5 (2.6%) |
| 3 or 4 Children | 0 (0.0%) | 0 (0.0%) |
| 5 or more Children | 0 (0.0%) | 0 (0.0%) |
| Total | 94 (29.7%) | 33 (6.6%) |
Income Below Poverty Among Married-Couple vs Single-Parent Households in Madison County
The poverty data for Madison County shows that 95 of the married-couple family households (3.2%) and 127 of the single-parent households (15.5%) are living below the poverty level. Within the married-couple family households, those with 3 or 4 children have the highest poverty rate, with 42 households (8.4%) falling below the poverty line. Among the single-parent households, those with no children have the highest poverty rate, with 122 household (26.1%) living below poverty.
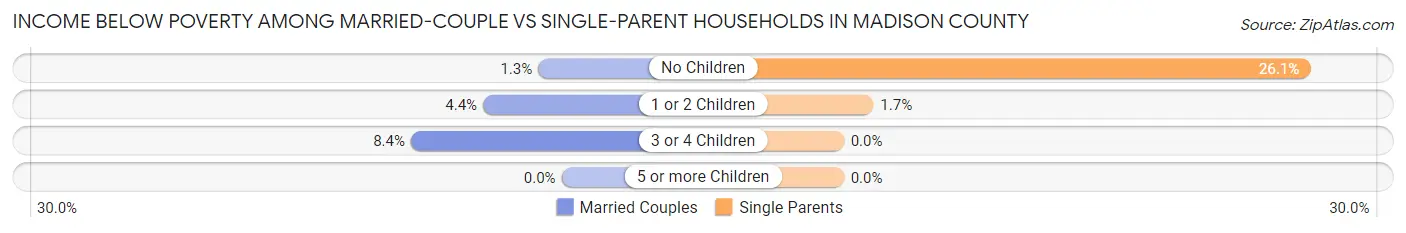
| Children | Married-Couple Families | Single-Parent Households |
| No Children | 24 (1.3%) | 122 (26.1%) |
| 1 or 2 Children | 29 (4.4%) | 5 (1.7%) |
| 3 or 4 Children | 42 (8.4%) | 0 (0.0%) |
| 5 or more Children | 0 (0.0%) | 0 (0.0%) |
| Total | 95 (3.2%) | 127 (15.5%) |
Race in Madison County
The most populous races in Madison County are White / Caucasian (11,849 | 85.7%), Black / African American (1,087 | 7.9%), and Two or more Races (717 | 5.2%).
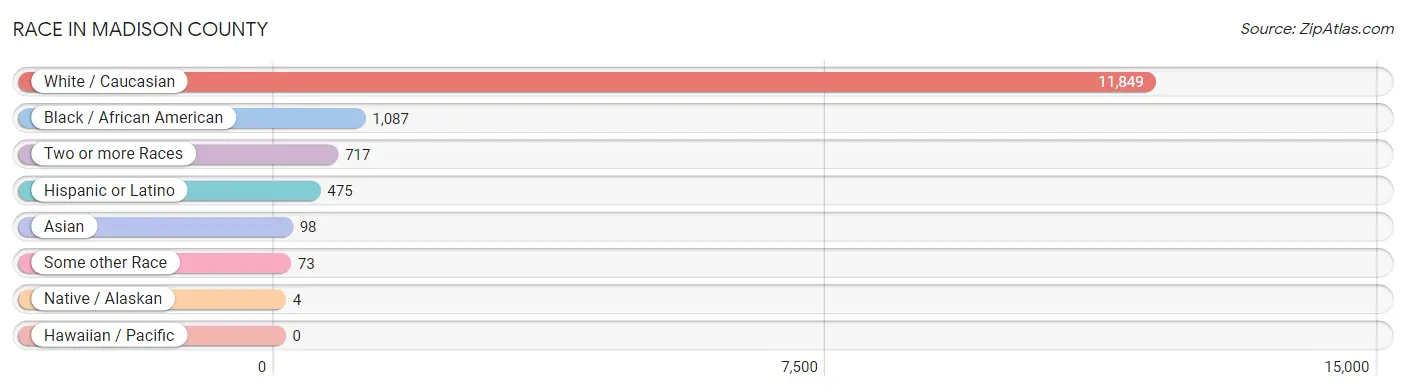
| Race | # Population | % Population |
| Asian | 98 | 0.7% |
| Black / African American | 1,087 | 7.9% |
| Hawaiian / Pacific | 0 | 0.0% |
| Hispanic or Latino | 475 | 3.4% |
| Native / Alaskan | 4 | 0.0% |
| White / Caucasian | 11,849 | 85.7% |
| Two or more Races | 717 | 5.2% |
| Some other Race | 73 | 0.5% |
| Total | 13,828 | 100.0% |
Ancestry in Madison County
The most populous ancestries reported in Madison County are German (2,328 | 16.8%), English (2,202 | 15.9%), Irish (1,651 | 11.9%), American (1,504 | 10.9%), and Scottish (488 | 3.5%), together accounting for 59.1% of all Madison County residents.
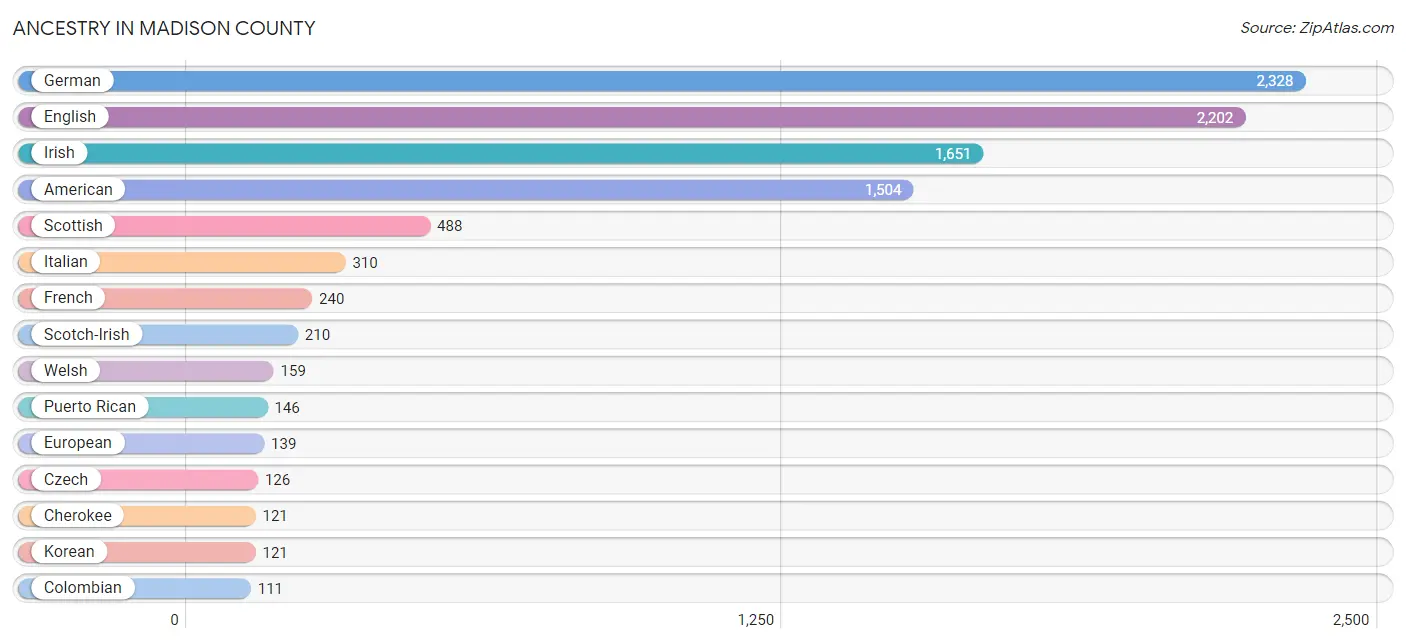
| Ancestry | # Population | % Population |
| African | 52 | 0.4% |
| American | 1,504 | 10.9% |
| Apache | 12 | 0.1% |
| Arab | 83 | 0.6% |
| Austrian | 105 | 0.8% |
| Blackfeet | 100 | 0.7% |
| British | 57 | 0.4% |
| Celtic | 34 | 0.3% |
| Central American | 77 | 0.6% |
| Cherokee | 121 | 0.9% |
| Choctaw | 7 | 0.1% |
| Colombian | 111 | 0.8% |
| Costa Rican | 34 | 0.3% |
| Croatian | 2 | 0.0% |
| Cuban | 1 | 0.0% |
| Czech | 126 | 0.9% |
| Danish | 6 | 0.0% |
| Dutch | 18 | 0.1% |
| Eastern European | 3 | 0.0% |
| English | 2,202 | 15.9% |
| European | 139 | 1.0% |
| French | 240 | 1.7% |
| German | 2,328 | 16.8% |
| Guatemalan | 25 | 0.2% |
| Hungarian | 77 | 0.6% |
| Irish | 1,651 | 11.9% |
| Iroquois | 1 | 0.0% |
| Italian | 310 | 2.2% |
| Korean | 121 | 0.9% |
| Mexican | 107 | 0.8% |
| Northern European | 15 | 0.1% |
| Norwegian | 11 | 0.1% |
| Polish | 38 | 0.3% |
| Portuguese | 12 | 0.1% |
| Puerto Rican | 146 | 1.1% |
| Russian | 25 | 0.2% |
| Salvadoran | 18 | 0.1% |
| Scandinavian | 46 | 0.3% |
| Scotch-Irish | 210 | 1.5% |
| Scottish | 488 | 3.5% |
| Slavic | 18 | 0.1% |
| Slovak | 14 | 0.1% |
| South American | 111 | 0.8% |
| Spanish | 25 | 0.2% |
| Subsaharan African | 52 | 0.4% |
| Swiss | 33 | 0.2% |
| Syrian | 83 | 0.6% |
| Thai | 22 | 0.2% |
| Ukrainian | 8 | 0.1% |
| Welsh | 159 | 1.1% |
| Yugoslavian | 22 | 0.2% |
| Zimbabwean | 23 | 0.2% | View All 52 Rows |
Immigrants in Madison County
The most numerous immigrant groups reported in Madison County came from Europe (213 | 1.5%), Latin America (190 | 1.4%), South America (129 | 0.9%), Colombia (120 | 0.9%), and Eastern Europe (94 | 0.7%), together accounting for 5.4% of all Madison County residents.
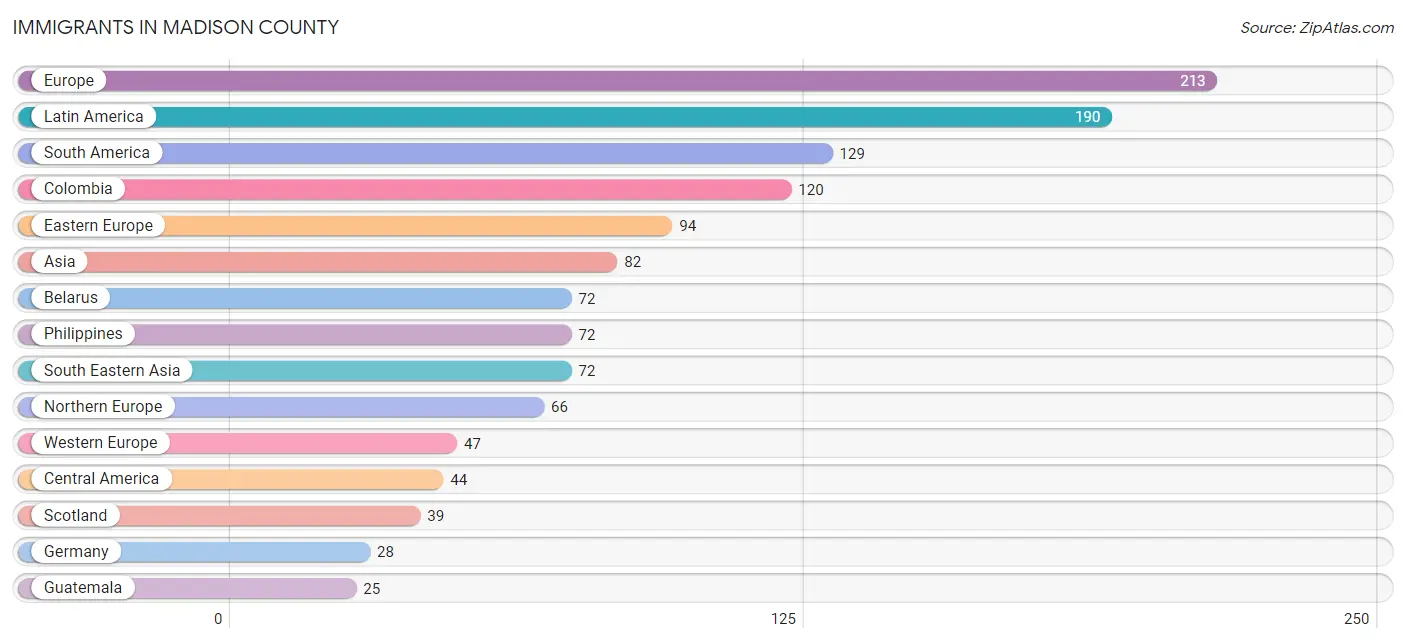
| Immigration Origin | # Population | % Population |
| Africa | 23 | 0.2% |
| Asia | 82 | 0.6% |
| Belarus | 72 | 0.5% |
| Bosnia and Herzegovina | 8 | 0.1% |
| Caribbean | 17 | 0.1% |
| Central America | 44 | 0.3% |
| Chile | 9 | 0.1% |
| Colombia | 120 | 0.9% |
| Eastern Africa | 23 | 0.2% |
| Eastern Europe | 94 | 0.7% |
| Europe | 213 | 1.5% |
| Germany | 28 | 0.2% |
| Guatemala | 25 | 0.2% |
| Honduras | 2 | 0.0% |
| India | 10 | 0.1% |
| Latin America | 190 | 1.4% |
| Mexico | 17 | 0.1% |
| Northern Europe | 66 | 0.5% |
| Philippines | 72 | 0.5% |
| Portugal | 6 | 0.0% |
| Russia | 14 | 0.1% |
| Scotland | 39 | 0.3% |
| South America | 129 | 0.9% |
| South Central Asia | 10 | 0.1% |
| South Eastern Asia | 72 | 0.5% |
| Southern Europe | 6 | 0.0% |
| Switzerland | 19 | 0.1% |
| Trinidad and Tobago | 17 | 0.1% |
| Western Europe | 47 | 0.3% |
| Zimbabwe | 23 | 0.2% | View All 30 Rows |
Sex and Age in Madison County
Sex and Age in Madison County
The most populous age groups in Madison County are 55 to 59 Years (561 | 8.3%) for men and 60 to 64 Years (626 | 8.9%) for women.
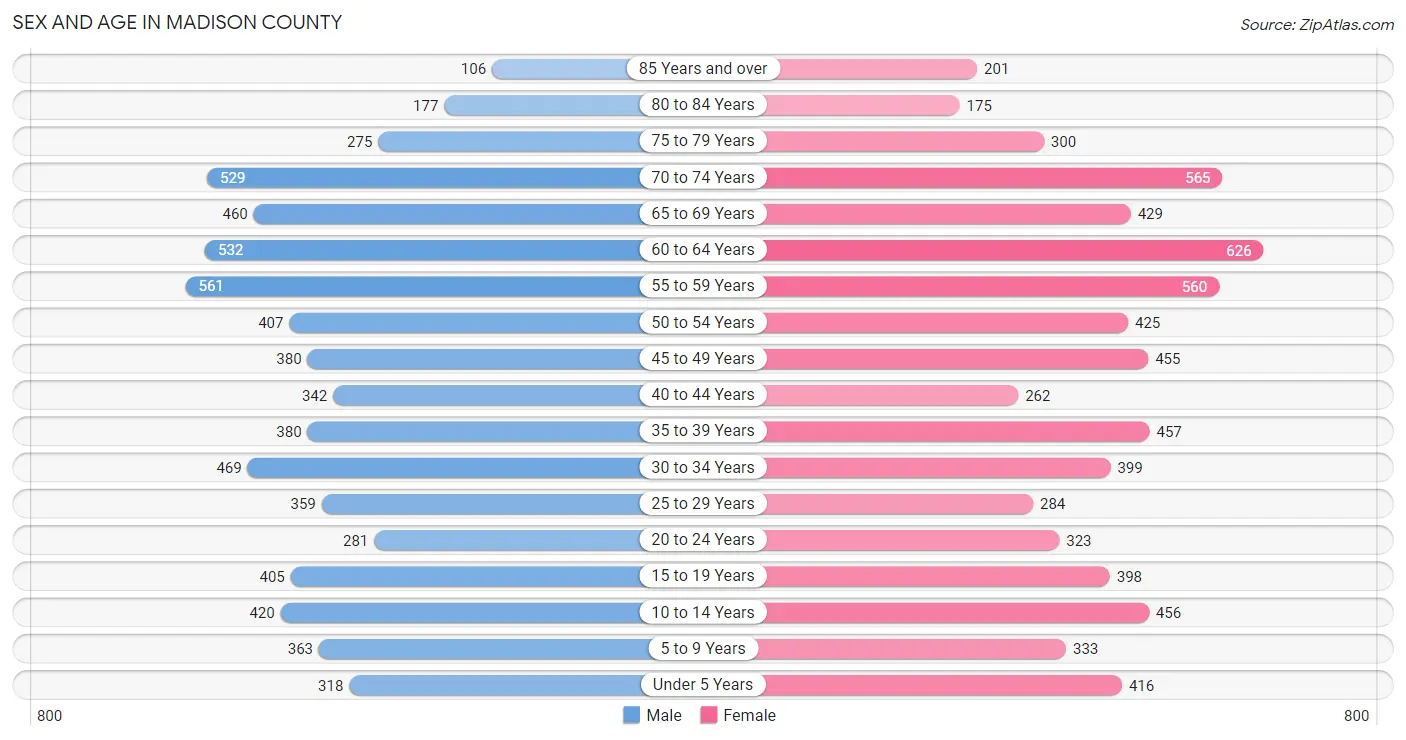
| Age Bracket | Male | Female |
| Under 5 Years | 318 (4.7%) | 416 (5.9%) |
| 5 to 9 Years | 363 (5.4%) | 333 (4.7%) |
| 10 to 14 Years | 420 (6.2%) | 456 (6.5%) |
| 15 to 19 Years | 405 (6.0%) | 398 (5.6%) |
| 20 to 24 Years | 281 (4.2%) | 323 (4.6%) |
| 25 to 29 Years | 359 (5.3%) | 284 (4.0%) |
| 30 to 34 Years | 469 (6.9%) | 399 (5.7%) |
| 35 to 39 Years | 380 (5.6%) | 457 (6.5%) |
| 40 to 44 Years | 342 (5.1%) | 262 (3.7%) |
| 45 to 49 Years | 380 (5.6%) | 455 (6.4%) |
| 50 to 54 Years | 407 (6.0%) | 425 (6.0%) |
| 55 to 59 Years | 561 (8.3%) | 560 (7.9%) |
| 60 to 64 Years | 532 (7.9%) | 626 (8.9%) |
| 65 to 69 Years | 460 (6.8%) | 429 (6.1%) |
| 70 to 74 Years | 529 (7.8%) | 565 (8.0%) |
| 75 to 79 Years | 275 (4.1%) | 300 (4.3%) |
| 80 to 84 Years | 177 (2.6%) | 175 (2.5%) |
| 85 Years and over | 106 (1.6%) | 201 (2.9%) |
| Total | 6,764 (100.0%) | 7,064 (100.0%) |
Families and Households in Madison County
Median Family Size in Madison County
The median family size in Madison County is 3.01 persons per family, with single female/mother families (501 | 13.2%) accounting for the largest median family size of 3.53 persons per family. On the other hand, single male/father families (316 | 8.3%) represent the smallest median family size with 2.00 persons per family.
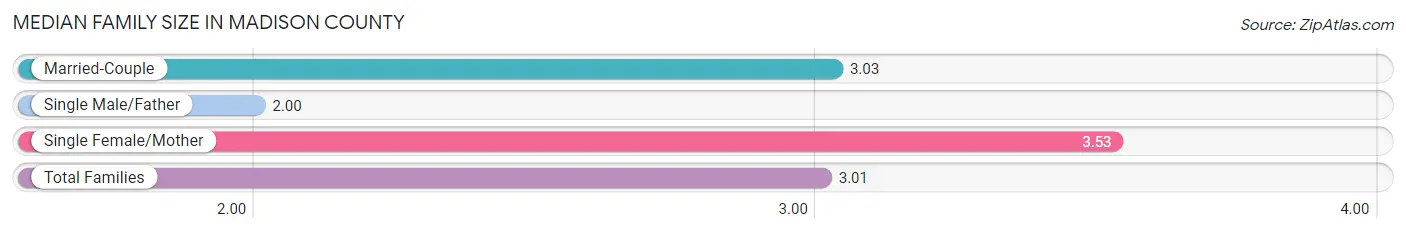
| Family Type | # Families | Family Size |
| Married-Couple | 2,986 (78.5%) | 3.03 |
| Single Male/Father | 316 (8.3%) | 2.00 |
| Single Female/Mother | 501 (13.2%) | 3.53 |
| Total Families | 3,803 (100.0%) | 3.01 |
Median Household Size in Madison County
The median household size in Madison County is 2.55 persons per household, with single female/mother households (501 | 9.4%) accounting for the largest median household size of 3.74 persons per household. non-family households (1,521 | 28.6%) represent the smallest median household size with 1.18 persons per household.
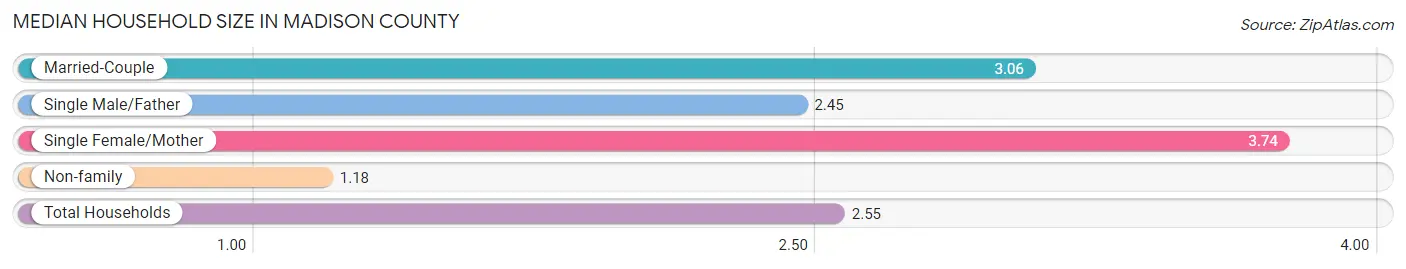
| Household Type | # Households | Household Size |
| Married-Couple | 2,986 (56.1%) | 3.06 |
| Single Male/Father | 316 (5.9%) | 2.45 |
| Single Female/Mother | 501 (9.4%) | 3.74 |
| Non-family | 1,521 (28.6%) | 1.18 |
| Total Households | 5,324 (100.0%) | 2.55 |
Household Size by Marriage Status in Madison County
Out of a total of 5,324 households in Madison County, 3,803 (71.4%) are family households, while 1,521 (28.6%) are nonfamily households. The most numerous type of family households are 2-person households, comprising 1,706, and the most common type of nonfamily households are 1-person households, comprising 1,319.
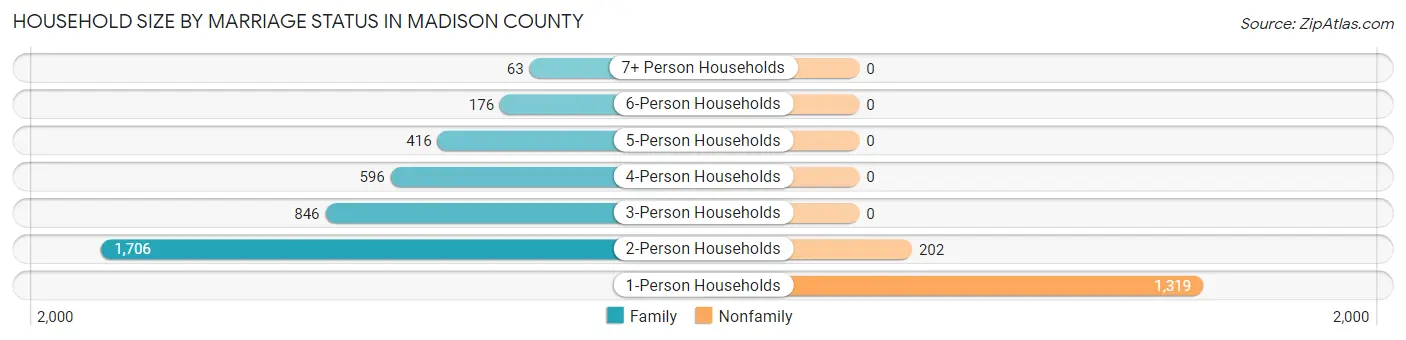
| Household Size | Family Households | Nonfamily Households |
| 1-Person Households | - | 1,319 (24.8%) |
| 2-Person Households | 1,706 (32.0%) | 202 (3.8%) |
| 3-Person Households | 846 (15.9%) | 0 (0.0%) |
| 4-Person Households | 596 (11.2%) | 0 (0.0%) |
| 5-Person Households | 416 (7.8%) | 0 (0.0%) |
| 6-Person Households | 176 (3.3%) | 0 (0.0%) |
| 7+ Person Households | 63 (1.2%) | 0 (0.0%) |
| Total | 3,803 (71.4%) | 1,521 (28.6%) |
Female Fertility in Madison County
Fertility by Age in Madison County
Average fertility rate in Madison County is 94.0 births per 1,000 women. Women in the age bracket of 20 to 34 years have the highest fertility rate with 150.0 births per 1,000 women. Women in the age bracket of 20 to 34 years acount for 60.6% of all women with births.
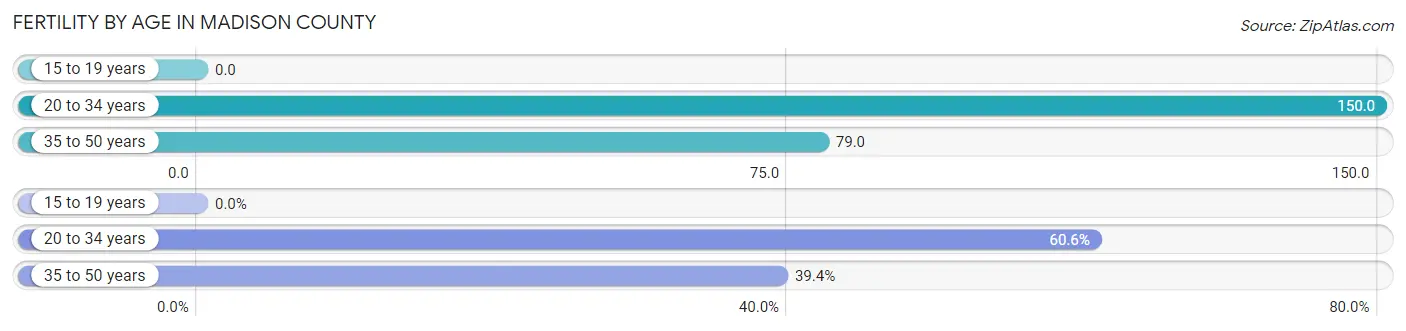
| Age Bracket | Women with Births | Births / 1,000 Women |
| 15 to 19 years | 0 (0.0%) | 0.0 |
| 20 to 34 years | 151 (60.6%) | 150.0 |
| 35 to 50 years | 98 (39.4%) | 79.0 |
| Total | 249 (100.0%) | 94.0 |
Fertility by Age by Marriage Status in Madison County
91.6% of women with births (249) in Madison County are married. The highest percentage of unmarried women with births falls into 20 to 34 years age bracket with 11.9% of them unmarried at the time of birth, while the lowest percentage of unmarried women with births belong to 35 to 50 years age bracket with 3.1% of them unmarried.
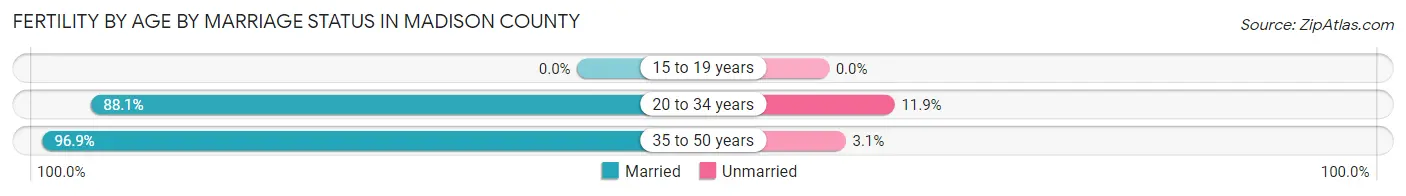
| Age Bracket | Married | Unmarried |
| 15 to 19 years | 0 (0.0%) | 0 (0.0%) |
| 20 to 34 years | 133 (88.1%) | 18 (11.9%) |
| 35 to 50 years | 95 (96.9%) | 3 (3.1%) |
| Total | 228 (91.6%) | 21 (8.4%) |
Fertility by Education in Madison County
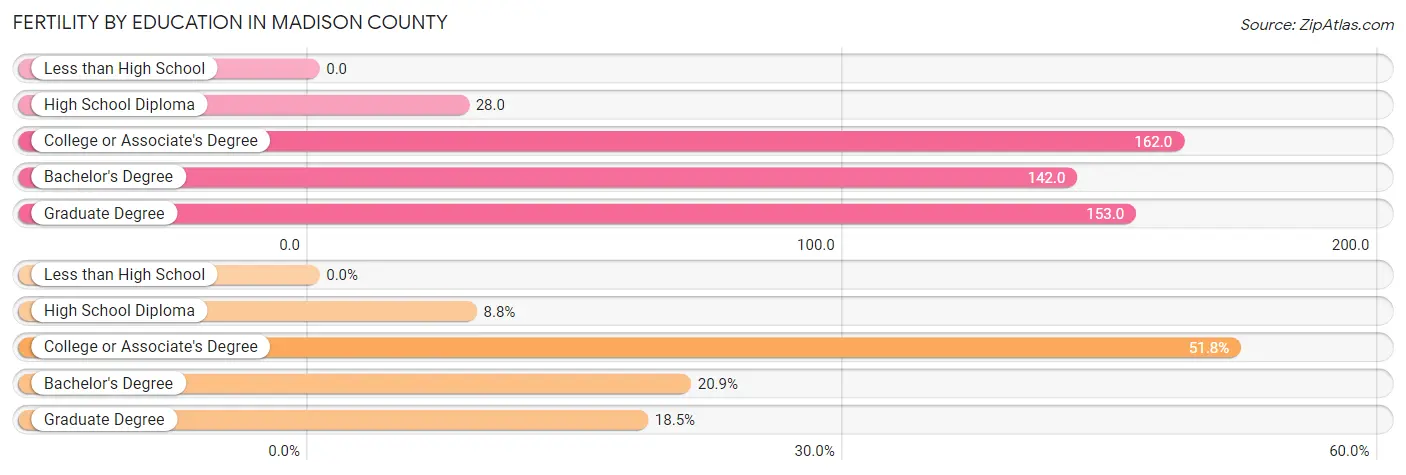
| Educational Attainment | Women with Births | Births / 1,000 Women |
| Less than High School | 0 (0.0%) | 0.0 |
| High School Diploma | 22 (8.8%) | 28.0 |
| College or Associate's Degree | 129 (51.8%) | 162.0 |
| Bachelor's Degree | 52 (20.9%) | 142.0 |
| Graduate Degree | 46 (18.5%) | 153.0 |
| Total | 249 (100.0%) | 94.0 |
Fertility by Education by Marriage Status in Madison County
8.4% of women with births in Madison County are unmarried. Women with the educational attainment of college or associate's degree are most likely to be married with 100.0% of them married at childbirth, while women with the educational attainment of graduate degree are least likely to be married with 39.1% of them unmarried at childbirth.
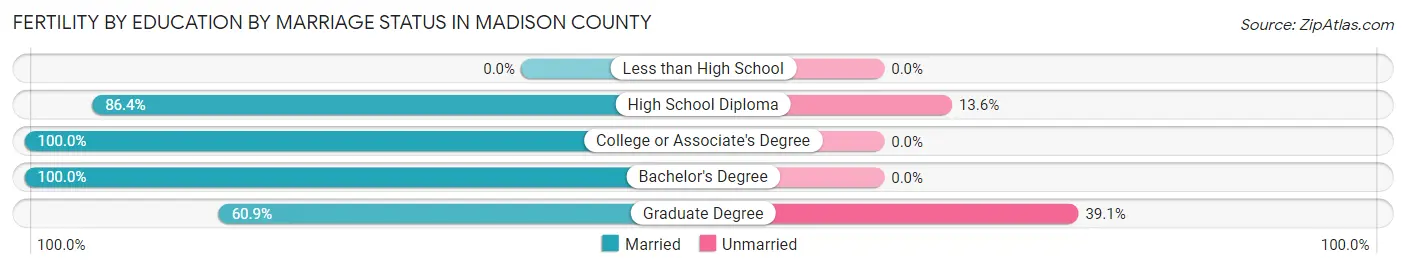
| Educational Attainment | Married | Unmarried |
| Less than High School | 0 (0.0%) | 0 (0.0%) |
| High School Diploma | 19 (86.4%) | 3 (13.6%) |
| College or Associate's Degree | 129 (100.0%) | 0 (0.0%) |
| Bachelor's Degree | 52 (100.0%) | 0 (0.0%) |
| Graduate Degree | 28 (60.9%) | 18 (39.1%) |
| Total | 228 (91.6%) | 21 (8.4%) |
Employment Characteristics in Madison County
Employment by Class of Employer in Madison County
Among the 6,470 employed individuals in Madison County, private company employees (3,778 | 58.4%), self-employed (not incorporated) (742 | 11.5%), and not-for-profit organizations (645 | 10.0%) make up the most common classes of employment.
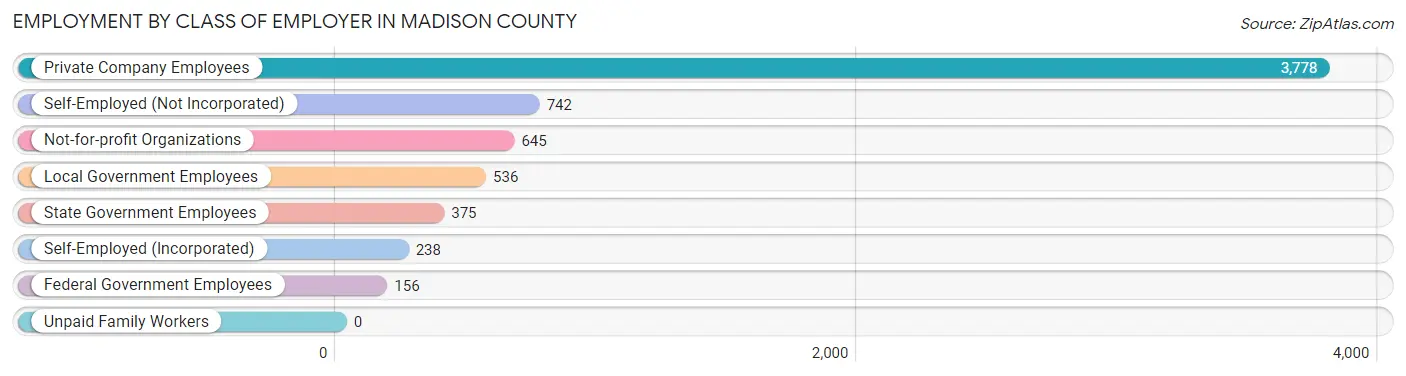
| Employer Class | # Employees | % Employees |
| Private Company Employees | 3,778 | 58.4% |
| Self-Employed (Incorporated) | 238 | 3.7% |
| Self-Employed (Not Incorporated) | 742 | 11.5% |
| Not-for-profit Organizations | 645 | 10.0% |
| Local Government Employees | 536 | 8.3% |
| State Government Employees | 375 | 5.8% |
| Federal Government Employees | 156 | 2.4% |
| Unpaid Family Workers | 0 | 0.0% |
| Total | 6,470 | 100.0% |
Employment Status by Age in Madison County
According to the labor force statistics for Madison County, out of the total population over 16 years of age (11,418), 60.5% or 6,908 individuals are in the labor force, with 3.7% or 256 of them unemployed. The age group with the highest labor force participation rate is 35 to 44 years, with 84.0% or 1,210 individuals in the labor force. Within the labor force, the 16 to 19 years age range has the highest percentage of unemployed individuals, with 17.8% or 59 of them being unemployed.
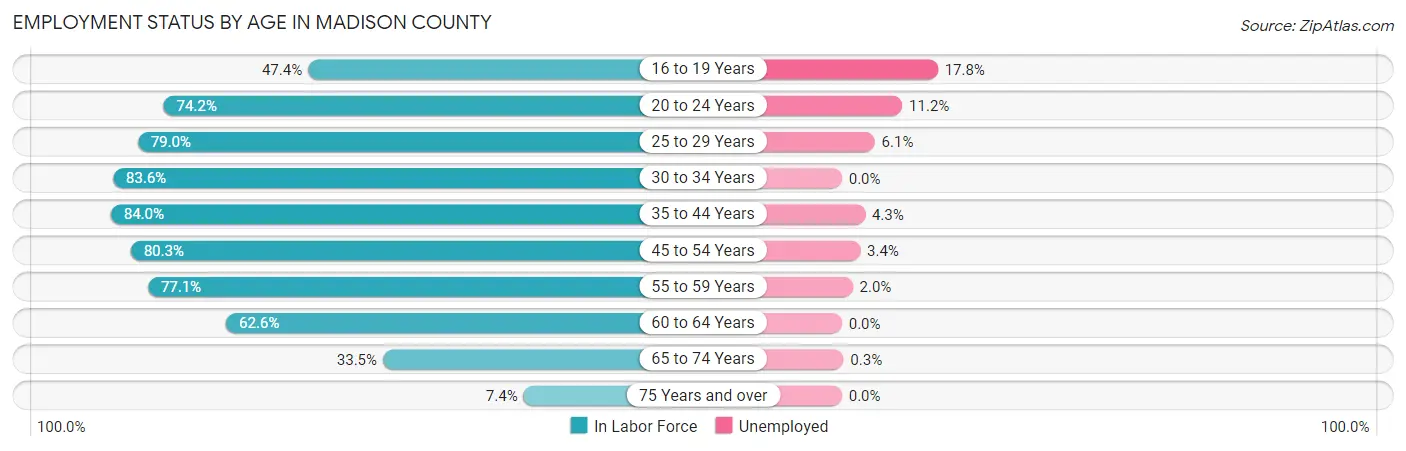
| Age Bracket | In Labor Force | Unemployed |
| 16 to 19 Years | 331 (47.4%) | 59 (17.8%) |
| 20 to 24 Years | 448 (74.2%) | 50 (11.2%) |
| 25 to 29 Years | 508 (79.0%) | 31 (6.1%) |
| 30 to 34 Years | 726 (83.6%) | 0 (0.0%) |
| 35 to 44 Years | 1,210 (84.0%) | 52 (4.3%) |
| 45 to 54 Years | 1,339 (80.3%) | 46 (3.4%) |
| 55 to 59 Years | 864 (77.1%) | 17 (2.0%) |
| 60 to 64 Years | 725 (62.6%) | 0 (0.0%) |
| 65 to 74 Years | 664 (33.5%) | 2 (0.3%) |
| 75 Years and over | 91 (7.4%) | 0 (0.0%) |
| Total | 6,908 (60.5%) | 256 (3.7%) |
Employment Status by Educational Attainment in Madison County
According to labor force statistics for Madison County, 77.9% of individuals (5,374) out of the total population between 25 and 64 years of age (6,898) are in the labor force, with 2.7% or 145 of them being unemployed. The group with the highest labor force participation rate are those with the educational attainment of bachelor's degree or higher, with 84.8% or 1,414 individuals in the labor force. Within the labor force, individuals with high school diploma education have the highest percentage of unemployment, with 5.7% or 113 of them being unemployed.
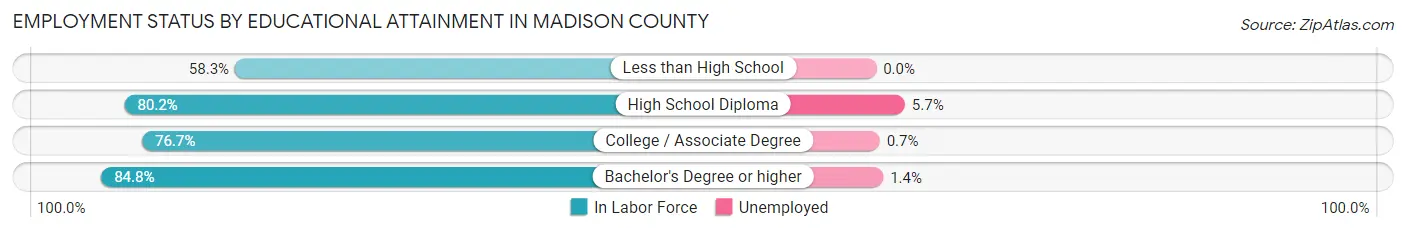
| Educational Attainment | In Labor Force | Unemployed |
| Less than High School | 444 (58.3%) | 0 (0.0%) |
| High School Diploma | 1,979 (80.2%) | 141 (5.7%) |
| College / Associate Degree | 1,535 (76.7%) | 14 (0.7%) |
| Bachelor's Degree or higher | 1,414 (84.8%) | 23 (1.4%) |
| Total | 5,374 (77.9%) | 186 (2.7%) |
Employment Occupations by Sex in Madison County
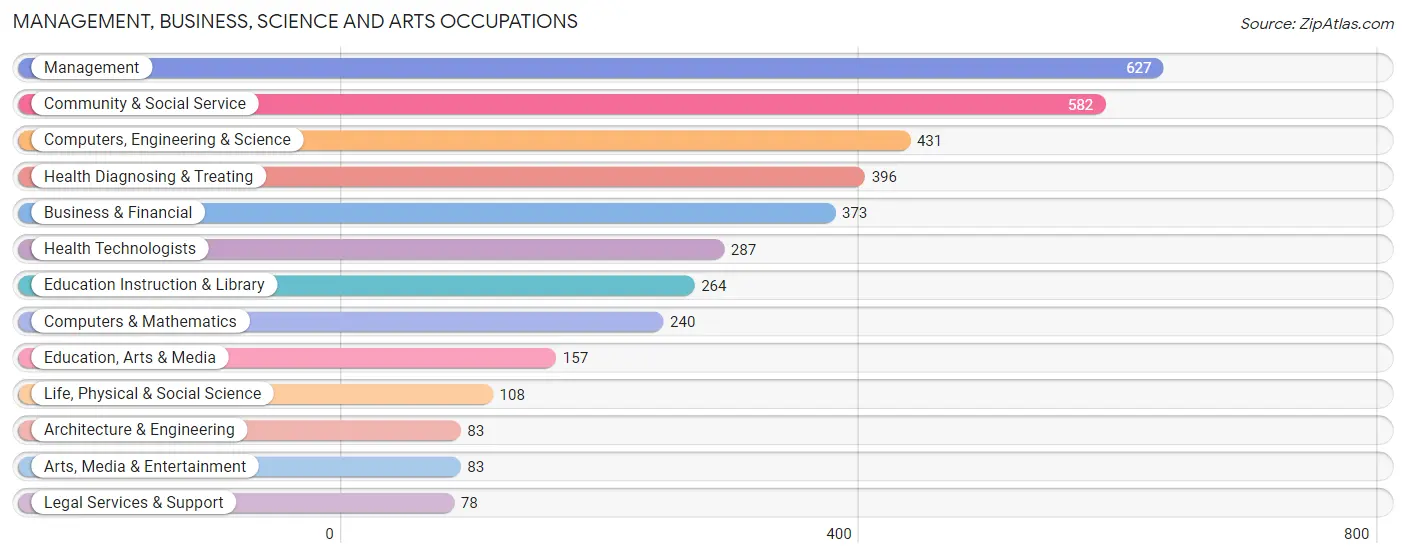
Management, Business, Science and Arts Occupations
The most common Management, Business, Science and Arts occupations in Madison County are Management (627 | 9.5%), Community & Social Service (582 | 8.8%), Computers, Engineering & Science (431 | 6.5%), Health Diagnosing & Treating (396 | 6.0%), and Business & Financial (373 | 5.6%).
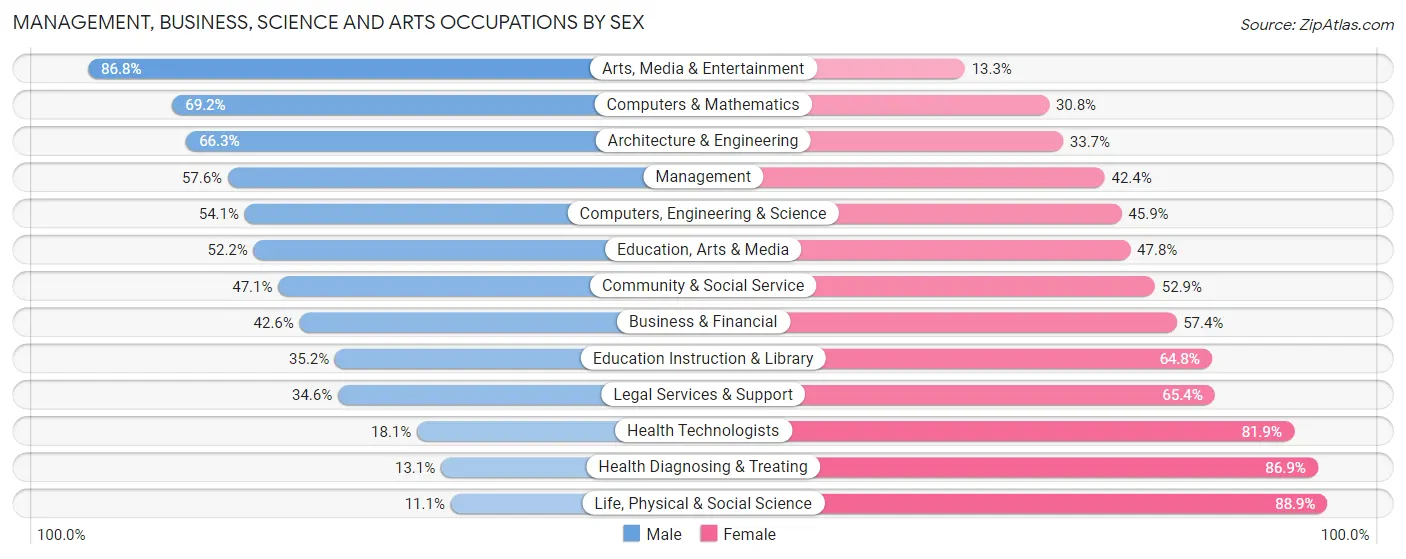
Management, Business, Science and Arts Occupations by Sex
Within the Management, Business, Science and Arts occupations in Madison County, the most male-oriented occupations are Arts, Media & Entertainment (86.8%), Computers & Mathematics (69.2%), and Architecture & Engineering (66.3%), while the most female-oriented occupations are Life, Physical & Social Science (88.9%), Health Diagnosing & Treating (86.9%), and Health Technologists (81.9%).
| Occupation | Male | Female |
| Management | 361 (57.6%) | 266 (42.4%) |
| Business & Financial | 159 (42.6%) | 214 (57.4%) |
| Computers, Engineering & Science | 233 (54.1%) | 198 (45.9%) |
| Computers & Mathematics | 166 (69.2%) | 74 (30.8%) |
| Architecture & Engineering | 55 (66.3%) | 28 (33.7%) |
| Life, Physical & Social Science | 12 (11.1%) | 96 (88.9%) |
| Community & Social Service | 274 (47.1%) | 308 (52.9%) |
| Education, Arts & Media | 82 (52.2%) | 75 (47.8%) |
| Legal Services & Support | 27 (34.6%) | 51 (65.4%) |
| Education Instruction & Library | 93 (35.2%) | 171 (64.8%) |
| Arts, Media & Entertainment | 72 (86.8%) | 11 (13.3%) |
| Health Diagnosing & Treating | 52 (13.1%) | 344 (86.9%) |
| Health Technologists | 52 (18.1%) | 235 (81.9%) |
| Total (Category) | 1,079 (44.8%) | 1,330 (55.2%) |
| Total (Overall) | 3,659 (55.2%) | 2,975 (44.8%) |
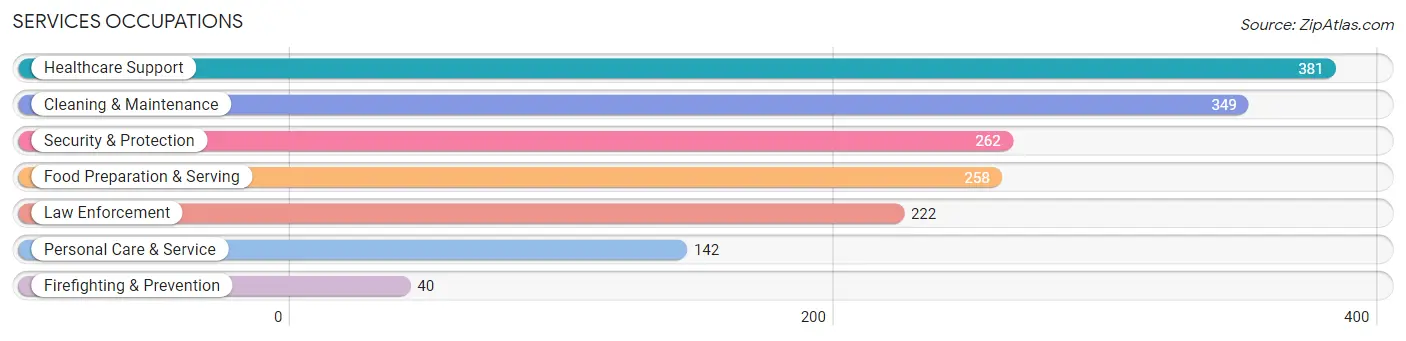
Services Occupations
The most common Services occupations in Madison County are Healthcare Support (381 | 5.7%), Cleaning & Maintenance (349 | 5.3%), Security & Protection (262 | 4.0%), Food Preparation & Serving (258 | 3.9%), and Law Enforcement (222 | 3.4%).
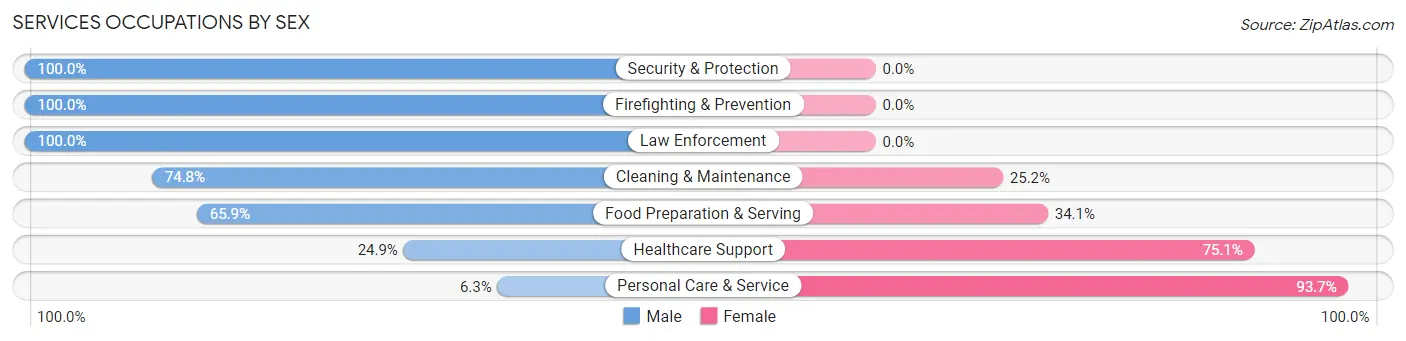
Services Occupations by Sex
Within the Services occupations in Madison County, the most male-oriented occupations are Security & Protection (100.0%), Firefighting & Prevention (100.0%), and Law Enforcement (100.0%), while the most female-oriented occupations are Personal Care & Service (93.7%), Healthcare Support (75.1%), and Food Preparation & Serving (34.1%).
| Occupation | Male | Female |
| Healthcare Support | 95 (24.9%) | 286 (75.1%) |
| Security & Protection | 262 (100.0%) | 0 (0.0%) |
| Firefighting & Prevention | 40 (100.0%) | 0 (0.0%) |
| Law Enforcement | 222 (100.0%) | 0 (0.0%) |
| Food Preparation & Serving | 170 (65.9%) | 88 (34.1%) |
| Cleaning & Maintenance | 261 (74.8%) | 88 (25.2%) |
| Personal Care & Service | 9 (6.3%) | 133 (93.7%) |
| Total (Category) | 797 (57.3%) | 595 (42.7%) |
| Total (Overall) | 3,659 (55.2%) | 2,975 (44.8%) |
Sales and Office Occupations
The most common Sales and Office occupations in Madison County are Sales & Related (709 | 10.7%), and Office & Administration (670 | 10.1%).
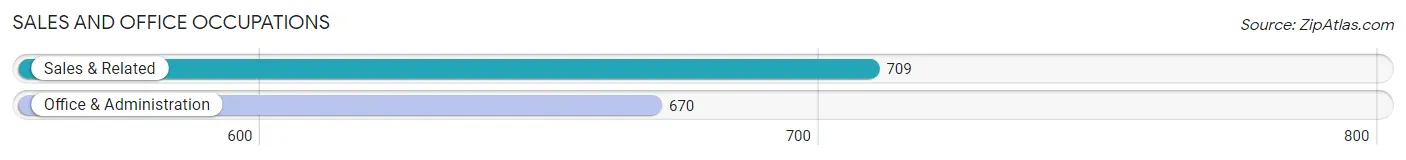
Sales and Office Occupations by Sex
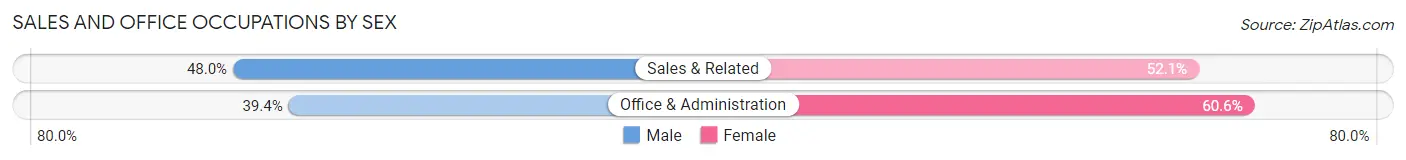
| Occupation | Male | Female |
| Sales & Related | 340 (47.9%) | 369 (52.0%) |
| Office & Administration | 264 (39.4%) | 406 (60.6%) |
| Total (Category) | 604 (43.8%) | 775 (56.2%) |
| Total (Overall) | 3,659 (55.2%) | 2,975 (44.8%) |
Natural Resources, Construction and Maintenance Occupations
The most common Natural Resources, Construction and Maintenance occupations in Madison County are Construction & Extraction (331 | 5.0%), Installation, Maintenance & Repair (158 | 2.4%), and Farming, Fishing & Forestry (94 | 1.4%).
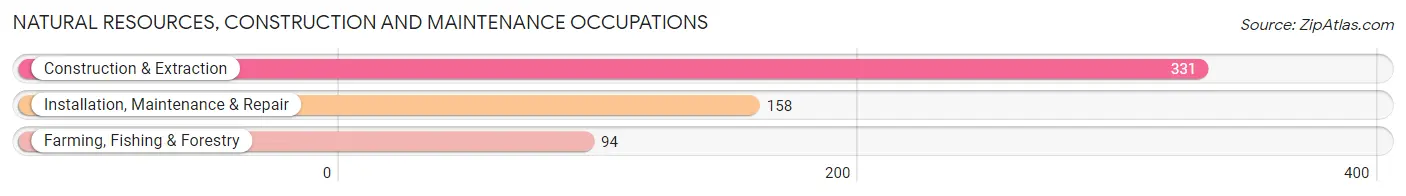
Natural Resources, Construction and Maintenance Occupations by Sex
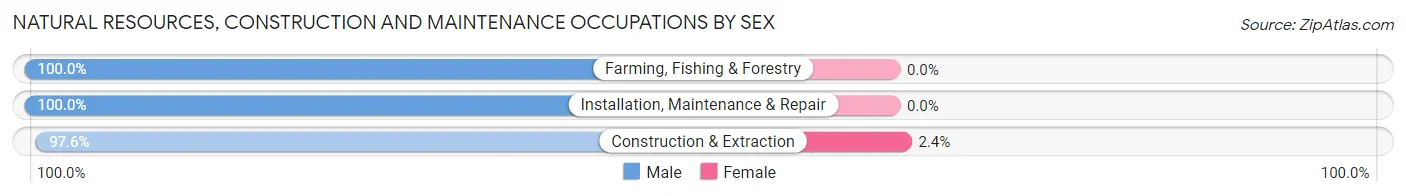
| Occupation | Male | Female |
| Farming, Fishing & Forestry | 94 (100.0%) | 0 (0.0%) |
| Construction & Extraction | 323 (97.6%) | 8 (2.4%) |
| Installation, Maintenance & Repair | 158 (100.0%) | 0 (0.0%) |
| Total (Category) | 575 (98.6%) | 8 (1.4%) |
| Total (Overall) | 3,659 (55.2%) | 2,975 (44.8%) |
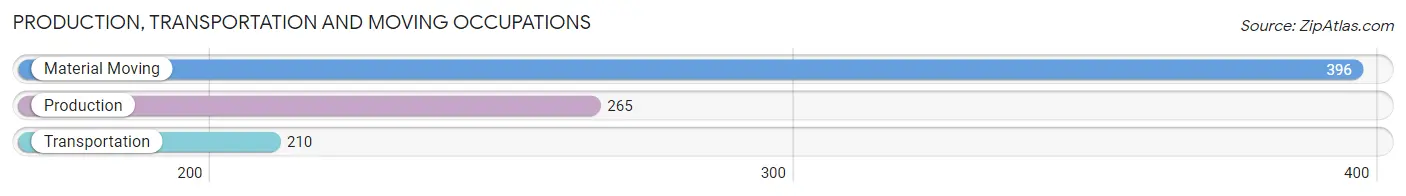
Production, Transportation and Moving Occupations
The most common Production, Transportation and Moving occupations in Madison County are Material Moving (396 | 6.0%), Production (265 | 4.0%), and Transportation (210 | 3.2%).
Production, Transportation and Moving Occupations by Sex
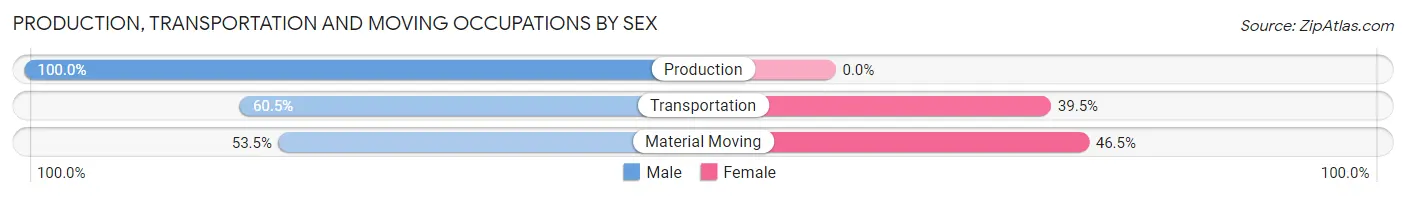
| Occupation | Male | Female |
| Production | 265 (100.0%) | 0 (0.0%) |
| Transportation | 127 (60.5%) | 83 (39.5%) |
| Material Moving | 212 (53.5%) | 184 (46.5%) |
| Total (Category) | 604 (69.4%) | 267 (30.6%) |
| Total (Overall) | 3,659 (55.2%) | 2,975 (44.8%) |
Employment Industries by Sex in Madison County
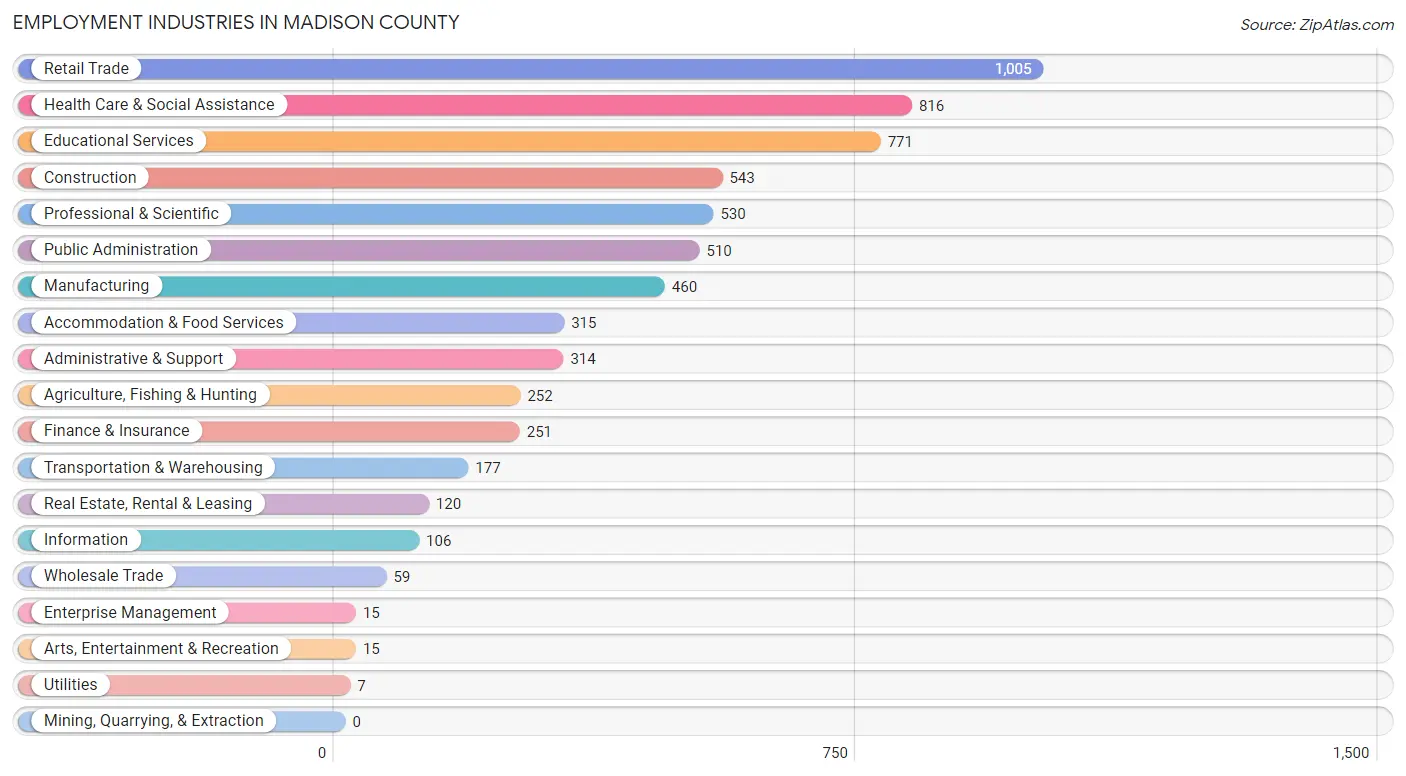
Employment Industries in Madison County
The major employment industries in Madison County include Retail Trade (1,005 | 15.1%), Health Care & Social Assistance (816 | 12.3%), Educational Services (771 | 11.6%), Construction (543 | 8.2%), and Professional & Scientific (530 | 8.0%).
Employment Industries by Sex in Madison County
The Madison County industries that see more men than women are Utilities (100.0%), Arts, Entertainment & Recreation (100.0%), and Agriculture, Fishing & Hunting (98.4%), whereas the industries that tend to have a higher number of women are Enterprise Management (100.0%), Health Care & Social Assistance (89.2%), and Finance & Insurance (72.5%).
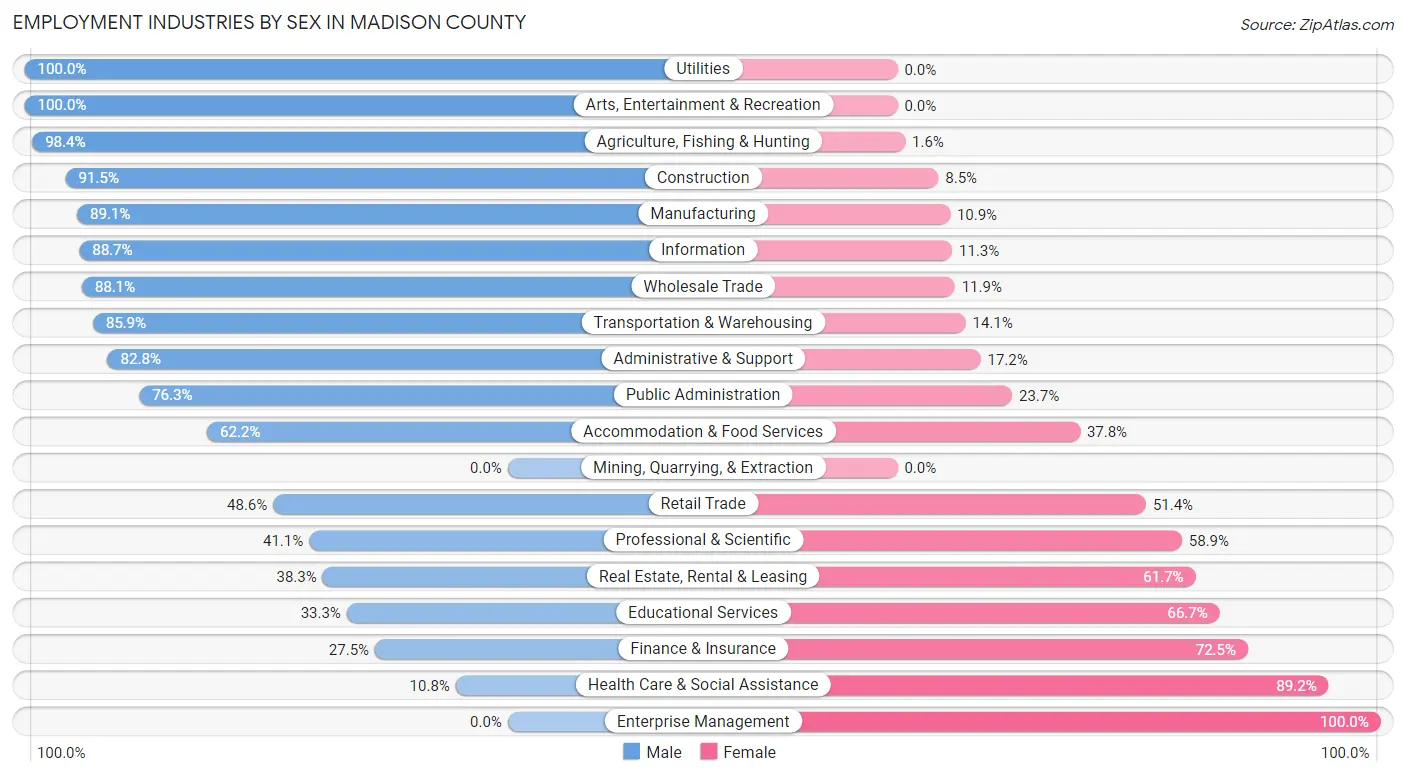
| Industry | Male | Female |
| Agriculture, Fishing & Hunting | 248 (98.4%) | 4 (1.6%) |
| Mining, Quarrying, & Extraction | 0 (0.0%) | 0 (0.0%) |
| Construction | 497 (91.5%) | 46 (8.5%) |
| Manufacturing | 410 (89.1%) | 50 (10.9%) |
| Wholesale Trade | 52 (88.1%) | 7 (11.9%) |
| Retail Trade | 488 (48.6%) | 517 (51.4%) |
| Transportation & Warehousing | 152 (85.9%) | 25 (14.1%) |
| Utilities | 7 (100.0%) | 0 (0.0%) |
| Information | 94 (88.7%) | 12 (11.3%) |
| Finance & Insurance | 69 (27.5%) | 182 (72.5%) |
| Real Estate, Rental & Leasing | 46 (38.3%) | 74 (61.7%) |
| Professional & Scientific | 218 (41.1%) | 312 (58.9%) |
| Enterprise Management | 0 (0.0%) | 15 (100.0%) |
| Administrative & Support | 260 (82.8%) | 54 (17.2%) |
| Educational Services | 257 (33.3%) | 514 (66.7%) |
| Health Care & Social Assistance | 88 (10.8%) | 728 (89.2%) |
| Arts, Entertainment & Recreation | 15 (100.0%) | 0 (0.0%) |
| Accommodation & Food Services | 196 (62.2%) | 119 (37.8%) |
| Public Administration | 389 (76.3%) | 121 (23.7%) |
| Total | 3,659 (55.2%) | 2,975 (44.8%) |
Education in Madison County
School Enrollment in Madison County
The most common levels of schooling among the 2,756 students in Madison County are middle school (763 | 27.7%), high school (740 | 26.9%), and elementary school (484 | 17.6%).
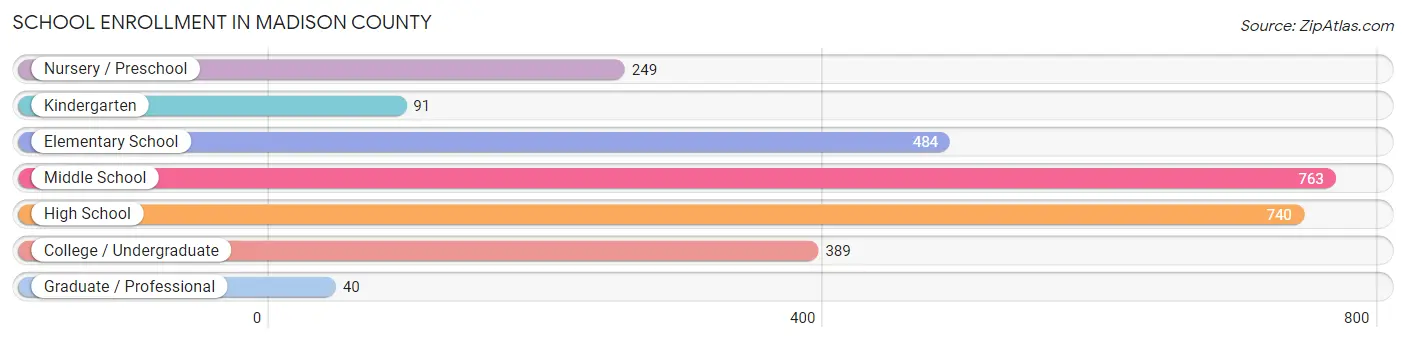
| School Level | # Students | % Students |
| Nursery / Preschool | 249 | 9.0% |
| Kindergarten | 91 | 3.3% |
| Elementary School | 484 | 17.6% |
| Middle School | 763 | 27.7% |
| High School | 740 | 26.9% |
| College / Undergraduate | 389 | 14.1% |
| Graduate / Professional | 40 | 1.5% |
| Total | 2,756 | 100.0% |
School Enrollment by Age by Funding Source in Madison County
Out of a total of 2,756 students who are enrolled in schools in Madison County, 604 (21.9%) attend a private institution, while the remaining 2,152 (78.1%) are enrolled in public schools. The age group of 25 to 34 year olds has the highest likelihood of being enrolled in private schools, with 25 (61.0% in the age bracket) enrolled. Conversely, the age group of 15 to 17 year olds has the lowest likelihood of being enrolled in a private school, with 437 (94.6% in the age bracket) attending a public institution.
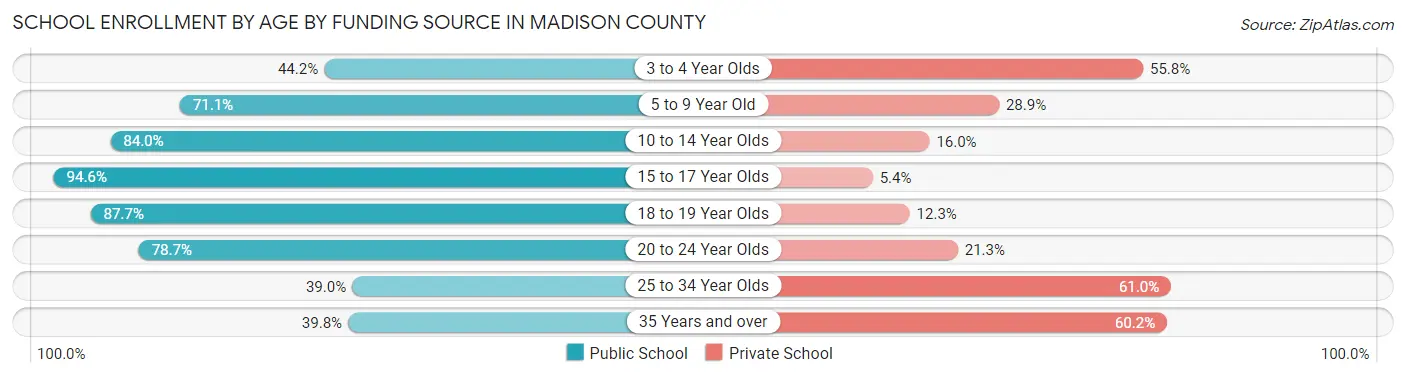
| Age Bracket | Public School | Private School |
| 3 to 4 Year Olds | 73 (44.2%) | 92 (55.8%) |
| 5 to 9 Year Old | 447 (71.1%) | 182 (28.9%) |
| 10 to 14 Year Olds | 736 (84.0%) | 140 (16.0%) |
| 15 to 17 Year Olds | 437 (94.6%) | 25 (5.4%) |
| 18 to 19 Year Olds | 207 (87.7%) | 29 (12.3%) |
| 20 to 24 Year Olds | 200 (78.7%) | 54 (21.3%) |
| 25 to 34 Year Olds | 16 (39.0%) | 25 (61.0%) |
| 35 Years and over | 37 (39.8%) | 56 (60.2%) |
| Total | 2,152 (78.1%) | 604 (21.9%) |
Educational Attainment by Field of Study in Madison County
Business (464 | 17.5%), science & technology (283 | 10.7%), education (264 | 10.0%), psychology (260 | 9.8%), and bio, nature & agricultural (217 | 8.2%) are the most common fields of study among 2,652 individuals in Madison County who have obtained a bachelor's degree or higher.
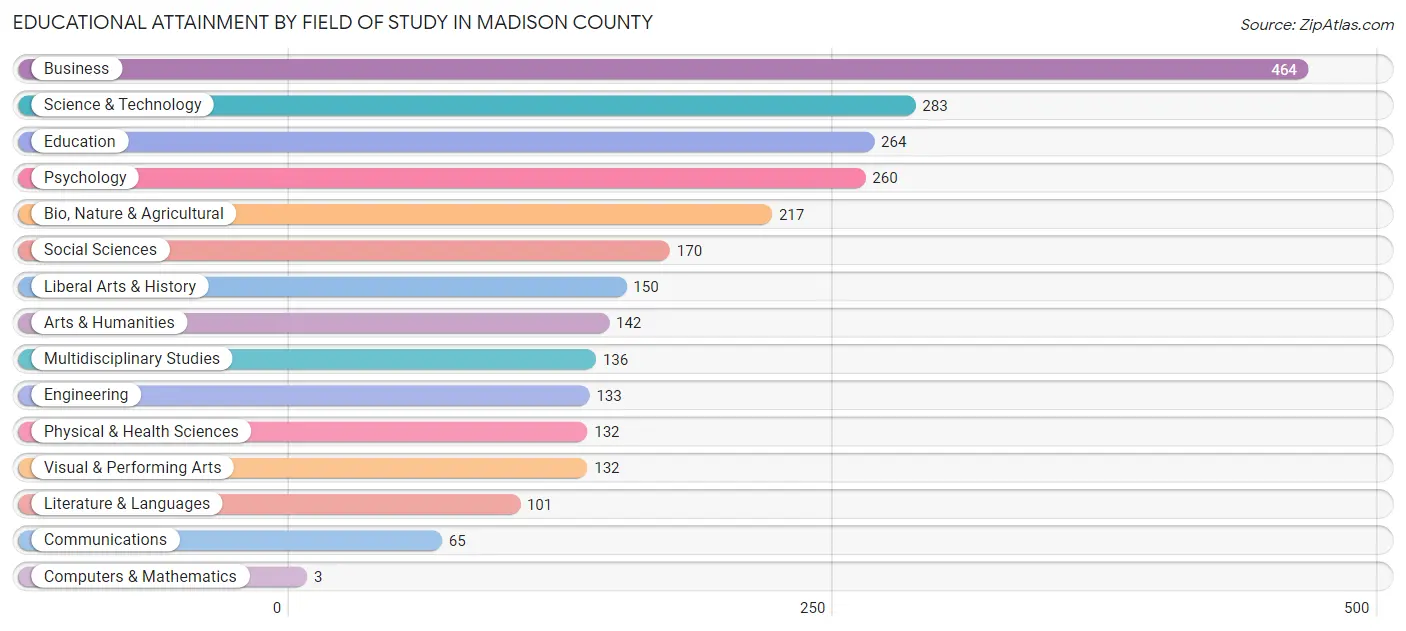
| Field of Study | # Graduates | % Graduates |
| Computers & Mathematics | 3 | 0.1% |
| Bio, Nature & Agricultural | 217 | 8.2% |
| Physical & Health Sciences | 132 | 5.0% |
| Psychology | 260 | 9.8% |
| Social Sciences | 170 | 6.4% |
| Engineering | 133 | 5.0% |
| Multidisciplinary Studies | 136 | 5.1% |
| Science & Technology | 283 | 10.7% |
| Business | 464 | 17.5% |
| Education | 264 | 10.0% |
| Literature & Languages | 101 | 3.8% |
| Liberal Arts & History | 150 | 5.7% |
| Visual & Performing Arts | 132 | 5.0% |
| Communications | 65 | 2.5% |
| Arts & Humanities | 142 | 5.3% |
| Total | 2,652 | 100.0% |
Transportation & Commute in Madison County
Vehicle Availability by Sex in Madison County
The most prevalent vehicle ownership categories in Madison County are males with 3 vehicles (1,164, accounting for 32.5%) and females with 3 vehicles (686, making up 41.1%).
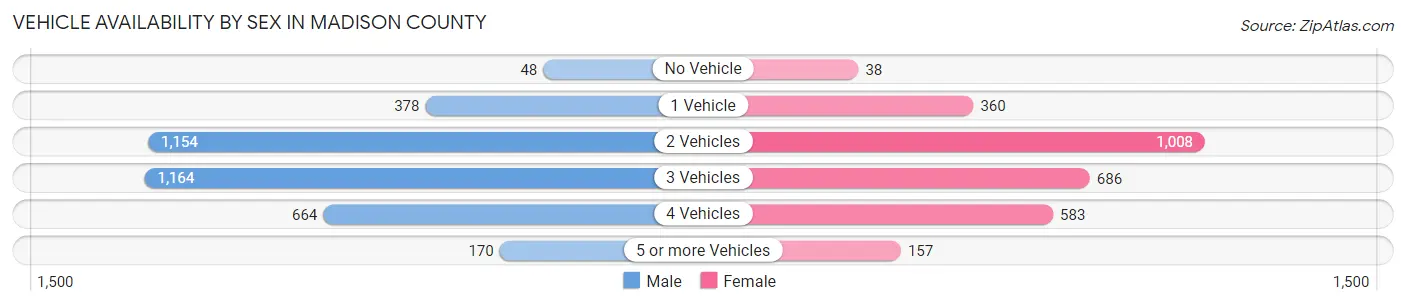
| Vehicles Available | Male | Female |
| No Vehicle | 48 (1.3%) | 38 (1.3%) |
| 1 Vehicle | 378 (10.6%) | 360 (12.7%) |
| 2 Vehicles | 1,154 (32.3%) | 1,008 (35.6%) |
| 3 Vehicles | 1,164 (32.5%) | 686 (24.2%) |
| 4 Vehicles | 664 (18.6%) | 583 (20.6%) |
| 5 or more Vehicles | 170 (4.8%) | 157 (5.5%) |
| Total | 3,578 (100.0%) | 2,832 (100.0%) |
Commute Time in Madison County
The most frequently occuring commute durations in Madison County are 20 to 24 minutes (822 commuters, 14.9%), 30 to 34 minutes (703 commuters, 12.7%), and 15 to 19 minutes (636 commuters, 11.5%).
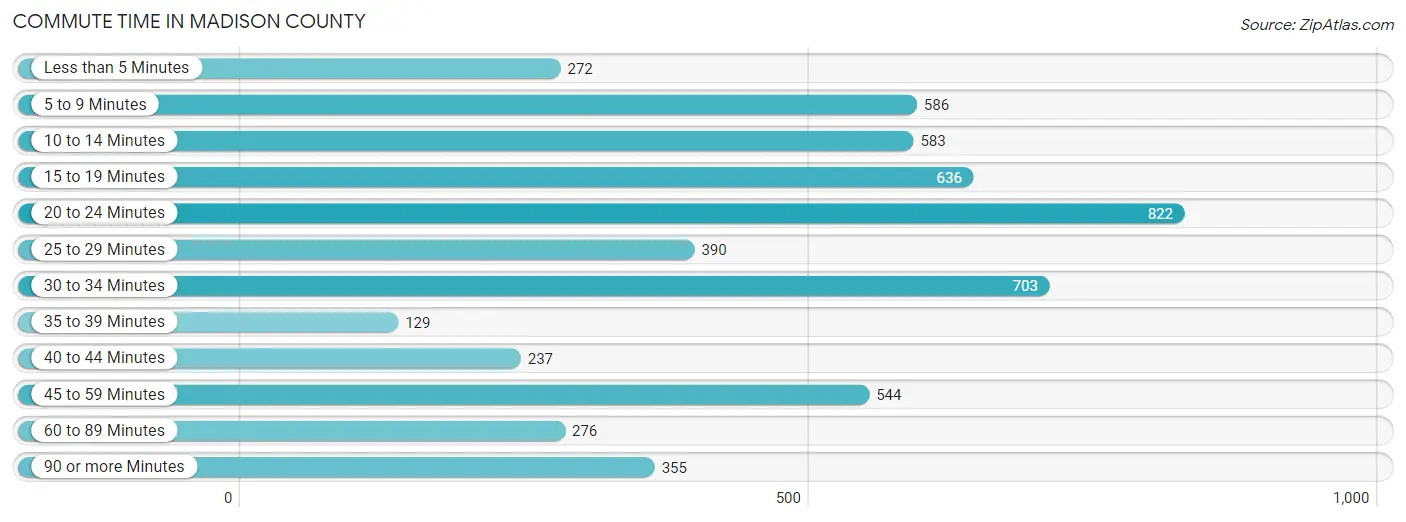
| Commute Time | # Commuters | % Commuters |
| Less than 5 Minutes | 272 | 4.9% |
| 5 to 9 Minutes | 586 | 10.6% |
| 10 to 14 Minutes | 583 | 10.5% |
| 15 to 19 Minutes | 636 | 11.5% |
| 20 to 24 Minutes | 822 | 14.9% |
| 25 to 29 Minutes | 390 | 7.0% |
| 30 to 34 Minutes | 703 | 12.7% |
| 35 to 39 Minutes | 129 | 2.3% |
| 40 to 44 Minutes | 237 | 4.3% |
| 45 to 59 Minutes | 544 | 9.8% |
| 60 to 89 Minutes | 276 | 5.0% |
| 90 or more Minutes | 355 | 6.4% |
Commute Time by Sex in Madison County
The most common commute times in Madison County are 30 to 34 minutes (427 commuters, 13.6%) for males and 20 to 24 minutes (396 commuters, 16.6%) for females.
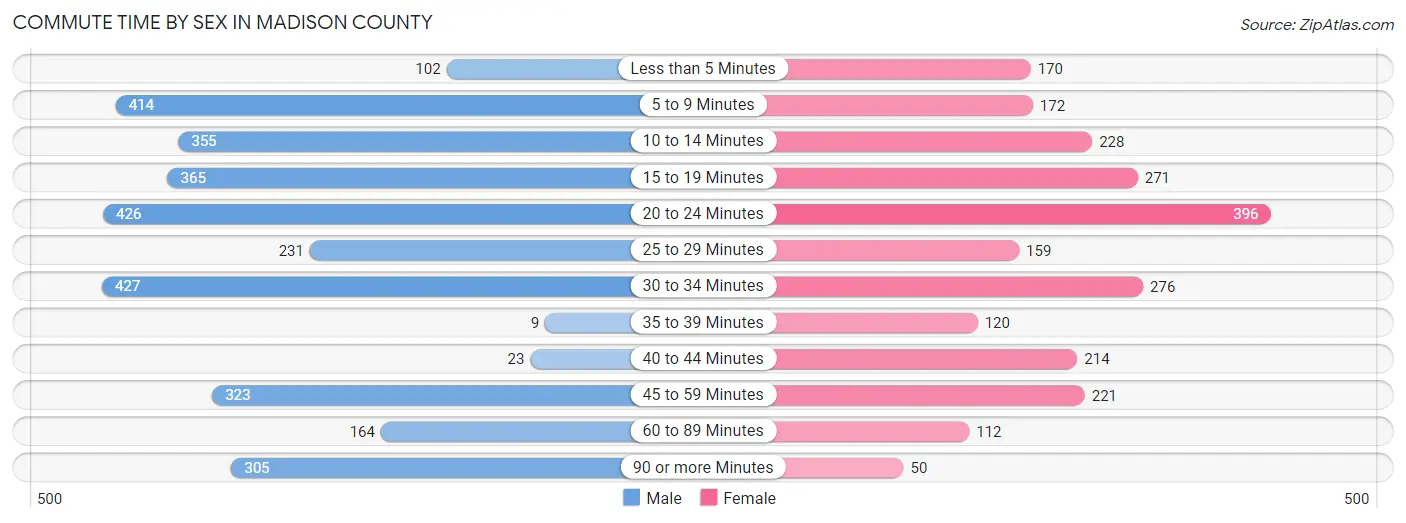
| Commute Time | Male | Female |
| Less than 5 Minutes | 102 (3.2%) | 170 (7.1%) |
| 5 to 9 Minutes | 414 (13.2%) | 172 (7.2%) |
| 10 to 14 Minutes | 355 (11.3%) | 228 (9.5%) |
| 15 to 19 Minutes | 365 (11.6%) | 271 (11.3%) |
| 20 to 24 Minutes | 426 (13.6%) | 396 (16.6%) |
| 25 to 29 Minutes | 231 (7.3%) | 159 (6.7%) |
| 30 to 34 Minutes | 427 (13.6%) | 276 (11.6%) |
| 35 to 39 Minutes | 9 (0.3%) | 120 (5.0%) |
| 40 to 44 Minutes | 23 (0.7%) | 214 (9.0%) |
| 45 to 59 Minutes | 323 (10.3%) | 221 (9.2%) |
| 60 to 89 Minutes | 164 (5.2%) | 112 (4.7%) |
| 90 or more Minutes | 305 (9.7%) | 50 (2.1%) |
Time of Departure to Work by Sex in Madison County
The most frequent times of departure to work in Madison County are 7:00 AM to 7:29 AM (649, 20.6%) for males and 8:00 AM to 8:29 AM (508, 21.3%) for females.
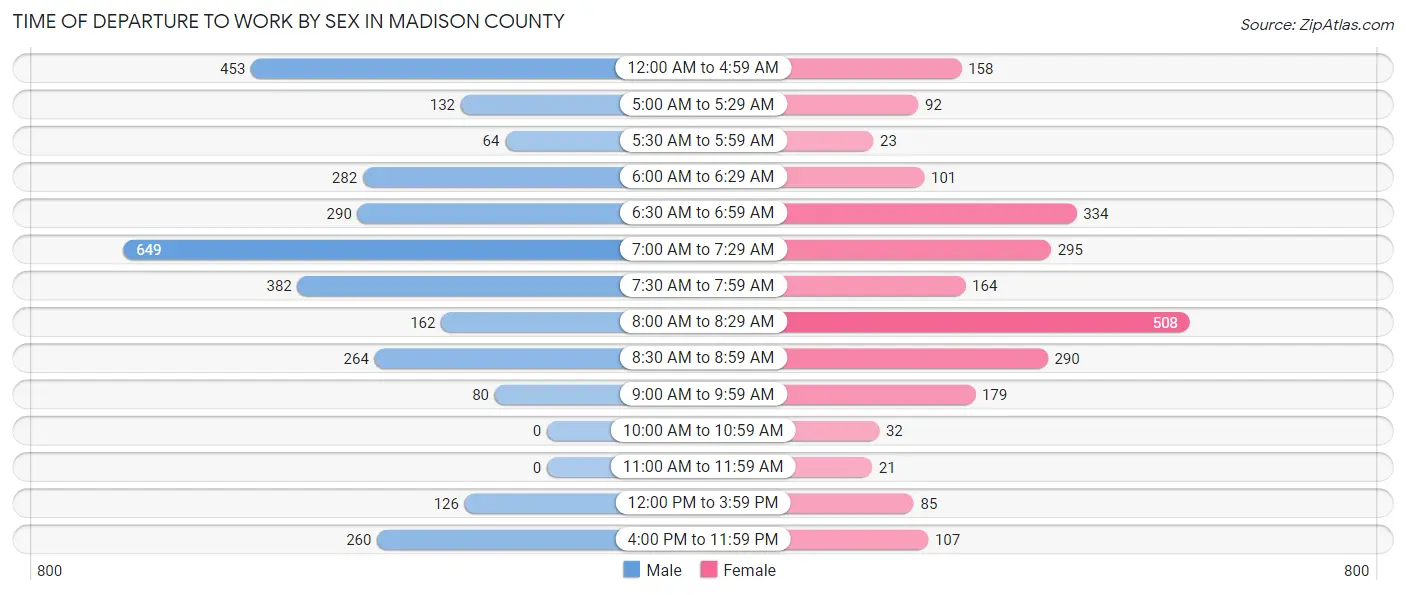
| Time of Departure | Male | Female |
| 12:00 AM to 4:59 AM | 453 (14.4%) | 158 (6.6%) |
| 5:00 AM to 5:29 AM | 132 (4.2%) | 92 (3.8%) |
| 5:30 AM to 5:59 AM | 64 (2.0%) | 23 (1.0%) |
| 6:00 AM to 6:29 AM | 282 (9.0%) | 101 (4.2%) |
| 6:30 AM to 6:59 AM | 290 (9.2%) | 334 (14.0%) |
| 7:00 AM to 7:29 AM | 649 (20.6%) | 295 (12.3%) |
| 7:30 AM to 7:59 AM | 382 (12.1%) | 164 (6.9%) |
| 8:00 AM to 8:29 AM | 162 (5.1%) | 508 (21.3%) |
| 8:30 AM to 8:59 AM | 264 (8.4%) | 290 (12.1%) |
| 9:00 AM to 9:59 AM | 80 (2.5%) | 179 (7.5%) |
| 10:00 AM to 10:59 AM | 0 (0.0%) | 32 (1.3%) |
| 11:00 AM to 11:59 AM | 0 (0.0%) | 21 (0.9%) |
| 12:00 PM to 3:59 PM | 126 (4.0%) | 85 (3.6%) |
| 4:00 PM to 11:59 PM | 260 (8.3%) | 107 (4.5%) |
| Total | 3,144 (100.0%) | 2,389 (100.0%) |
Housing Occupancy in Madison County
Occupancy by Ownership in Madison County
Of the total 5,324 dwellings in Madison County, owner-occupied units account for 4,219 (79.2%), while renter-occupied units make up 1,105 (20.8%).
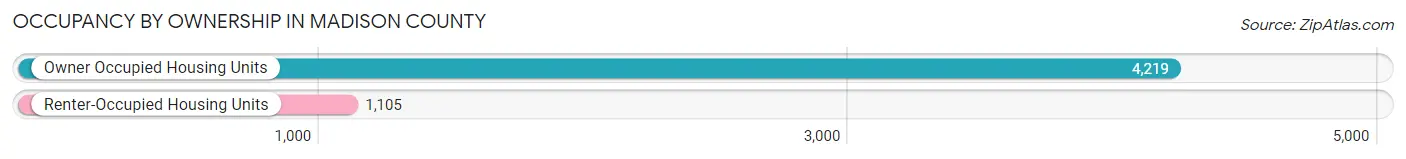
| Occupancy | # Housing Units | % Housing Units |
| Owner Occupied Housing Units | 4,219 | 79.2% |
| Renter-Occupied Housing Units | 1,105 | 20.8% |
| Total Occupied Housing Units | 5,324 | 100.0% |
Occupancy by Household Size in Madison County
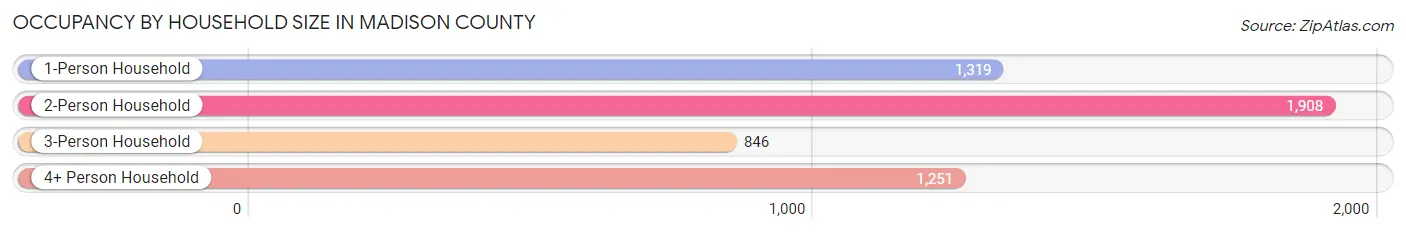
| Household Size | # Housing Units | % Housing Units |
| 1-Person Household | 1,319 | 24.8% |
| 2-Person Household | 1,908 | 35.8% |
| 3-Person Household | 846 | 15.9% |
| 4+ Person Household | 1,251 | 23.5% |
| Total Housing Units | 5,324 | 100.0% |
Occupancy by Ownership by Household Size in Madison County
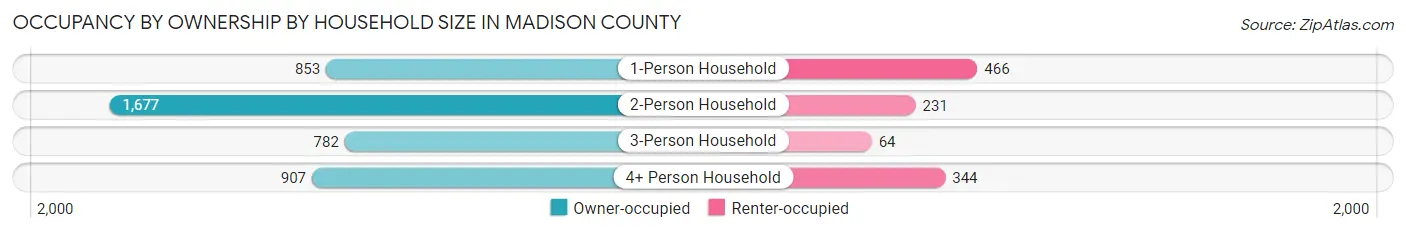
| Household Size | Owner-occupied | Renter-occupied |
| 1-Person Household | 853 (64.7%) | 466 (35.3%) |
| 2-Person Household | 1,677 (87.9%) | 231 (12.1%) |
| 3-Person Household | 782 (92.4%) | 64 (7.6%) |
| 4+ Person Household | 907 (72.5%) | 344 (27.5%) |
| Total Housing Units | 4,219 (79.2%) | 1,105 (20.8%) |
Occupancy by Educational Attainment in Madison County
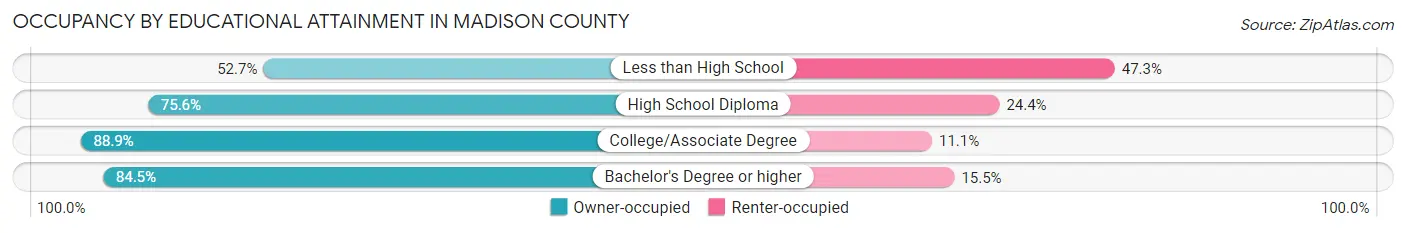
| Household Size | Owner-occupied | Renter-occupied |
| Less than High School | 343 (52.7%) | 308 (47.3%) |
| High School Diploma | 1,184 (75.6%) | 383 (24.4%) |
| College/Associate Degree | 1,364 (88.9%) | 170 (11.1%) |
| Bachelor's Degree or higher | 1,328 (84.5%) | 244 (15.5%) |
Occupancy by Age of Householder in Madison County
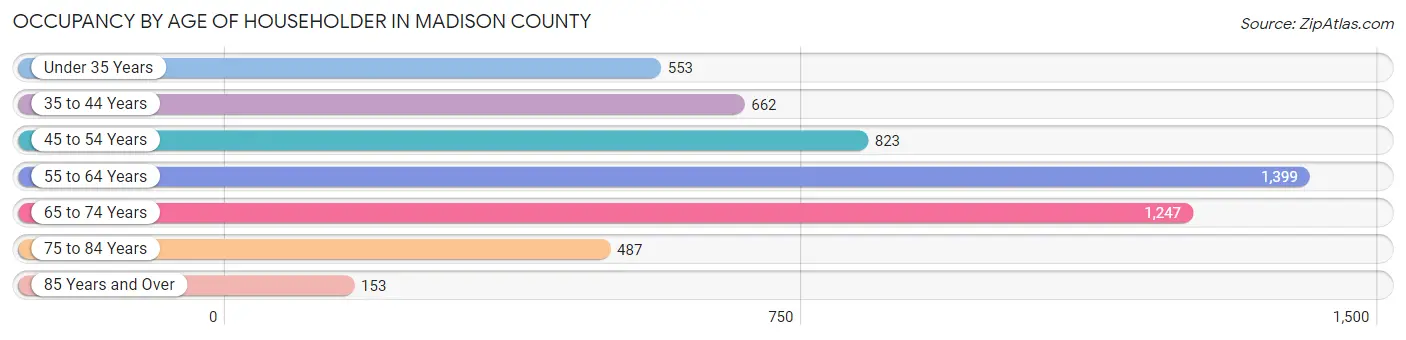
| Age Bracket | # Households | % Households |
| Under 35 Years | 553 | 10.4% |
| 35 to 44 Years | 662 | 12.4% |
| 45 to 54 Years | 823 | 15.5% |
| 55 to 64 Years | 1,399 | 26.3% |
| 65 to 74 Years | 1,247 | 23.4% |
| 75 to 84 Years | 487 | 9.1% |
| 85 Years and Over | 153 | 2.9% |
| Total | 5,324 | 100.0% |
Housing Finances in Madison County
Median Income by Occupancy in Madison County
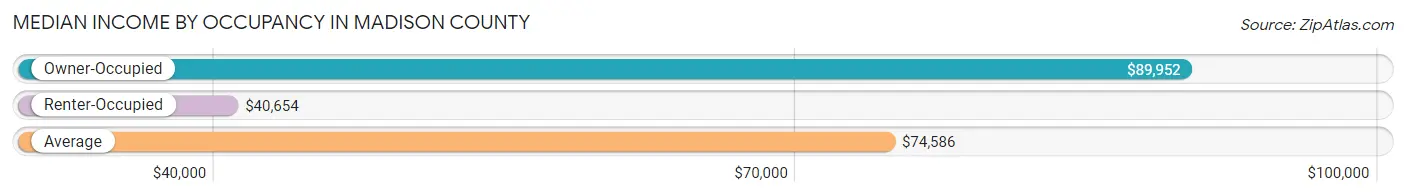
| Occupancy Type | # Households | Median Income |
| Owner-Occupied | 4,219 (79.2%) | $89,952 |
| Renter-Occupied | 1,105 (20.8%) | $40,654 |
| Average | 5,324 (100.0%) | $74,586 |
Occupancy by Householder Income Bracket in Madison County
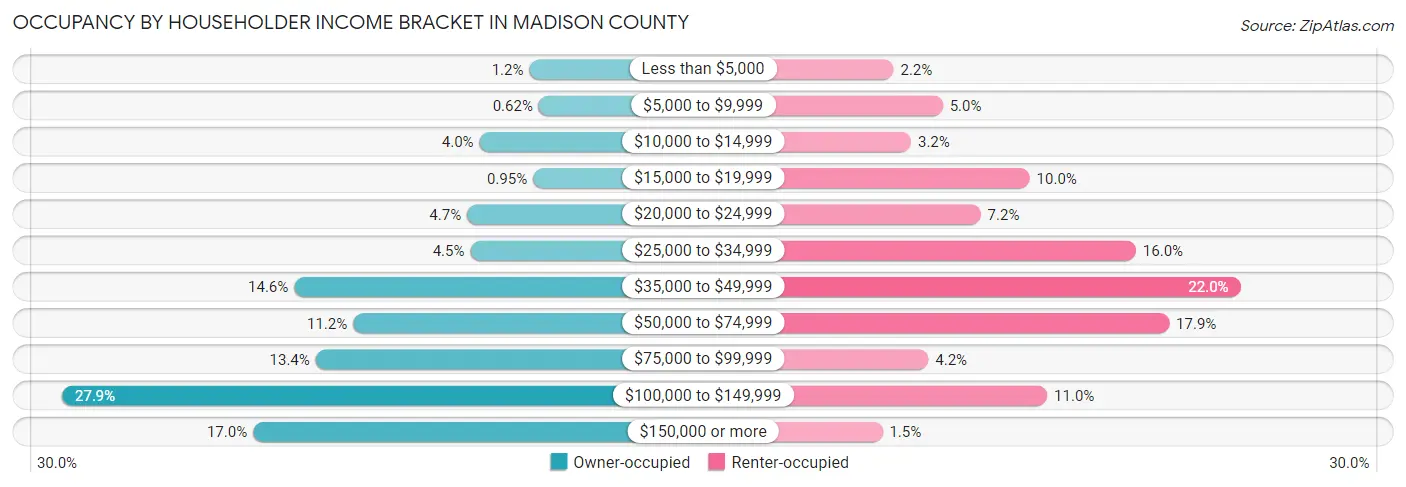
| Income Bracket | Owner-occupied | Renter-occupied |
| Less than $5,000 | 49 (1.2%) | 24 (2.2%) |
| $5,000 to $9,999 | 26 (0.6%) | 55 (5.0%) |
| $10,000 to $14,999 | 169 (4.0%) | 35 (3.2%) |
| $15,000 to $19,999 | 40 (0.9%) | 110 (10.0%) |
| $20,000 to $24,999 | 199 (4.7%) | 79 (7.1%) |
| $25,000 to $34,999 | 191 (4.5%) | 177 (16.0%) |
| $35,000 to $49,999 | 616 (14.6%) | 243 (22.0%) |
| $50,000 to $74,999 | 474 (11.2%) | 198 (17.9%) |
| $75,000 to $99,999 | 564 (13.4%) | 46 (4.2%) |
| $100,000 to $149,999 | 1,176 (27.9%) | 121 (11.0%) |
| $150,000 or more | 715 (17.0%) | 17 (1.5%) |
| Total | 4,219 (100.0%) | 1,105 (100.0%) |
Monthly Housing Cost Tiers in Madison County
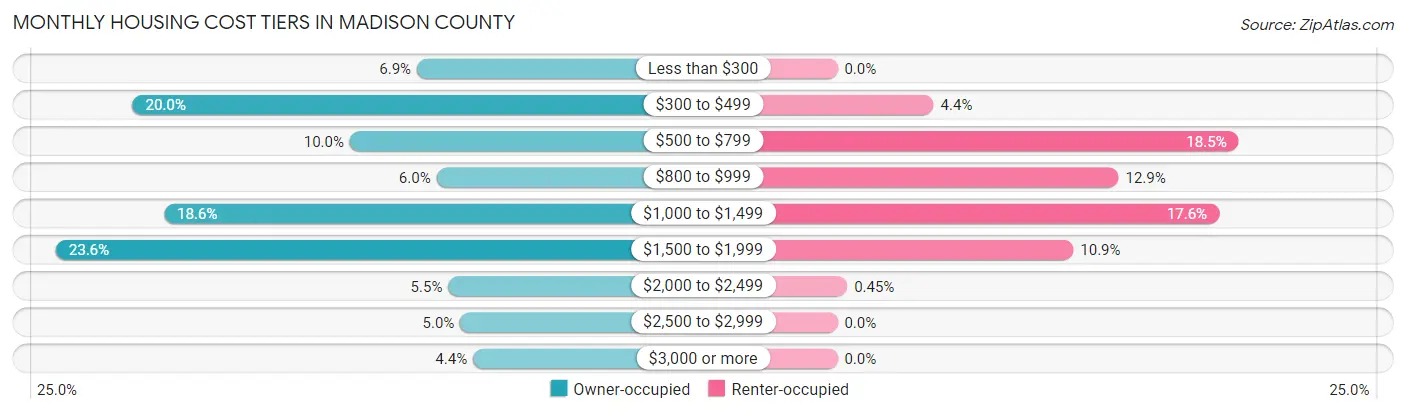
| Monthly Cost | Owner-occupied | Renter-occupied |
| Less than $300 | 293 (6.9%) | 0 (0.0%) |
| $300 to $499 | 845 (20.0%) | 49 (4.4%) |
| $500 to $799 | 423 (10.0%) | 204 (18.5%) |
| $800 to $999 | 255 (6.0%) | 143 (12.9%) |
| $1,000 to $1,499 | 784 (18.6%) | 194 (17.6%) |
| $1,500 to $1,999 | 994 (23.6%) | 120 (10.9%) |
| $2,000 to $2,499 | 232 (5.5%) | 5 (0.4%) |
| $2,500 to $2,999 | 209 (5.0%) | 0 (0.0%) |
| $3,000 or more | 184 (4.4%) | 0 (0.0%) |
| Total | 4,219 (100.0%) | 1,105 (100.0%) |
Physical Housing Characteristics in Madison County
Housing Structures in Madison County
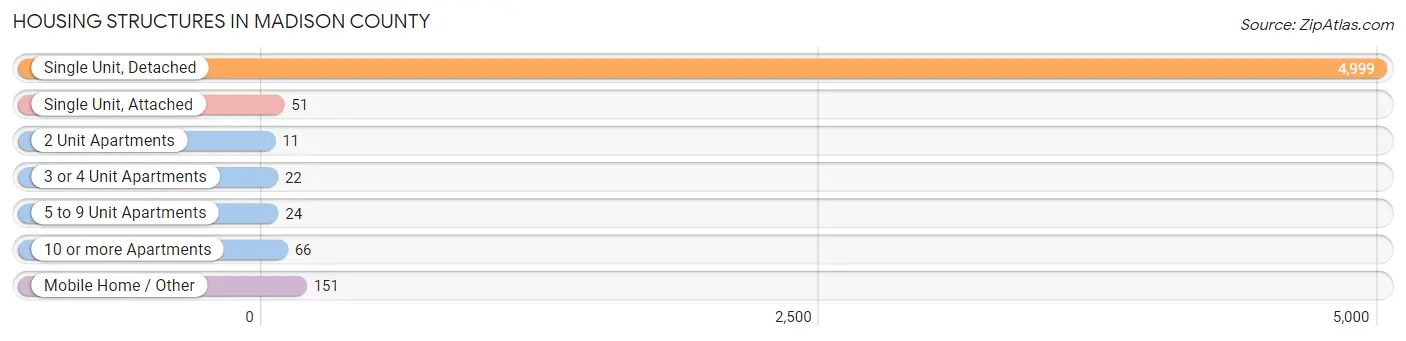
| Structure Type | # Housing Units | % Housing Units |
| Single Unit, Detached | 4,999 | 93.9% |
| Single Unit, Attached | 51 | 1.0% |
| 2 Unit Apartments | 11 | 0.2% |
| 3 or 4 Unit Apartments | 22 | 0.4% |
| 5 to 9 Unit Apartments | 24 | 0.4% |
| 10 or more Apartments | 66 | 1.2% |
| Mobile Home / Other | 151 | 2.8% |
| Total | 5,324 | 100.0% |
Housing Structures by Occupancy in Madison County
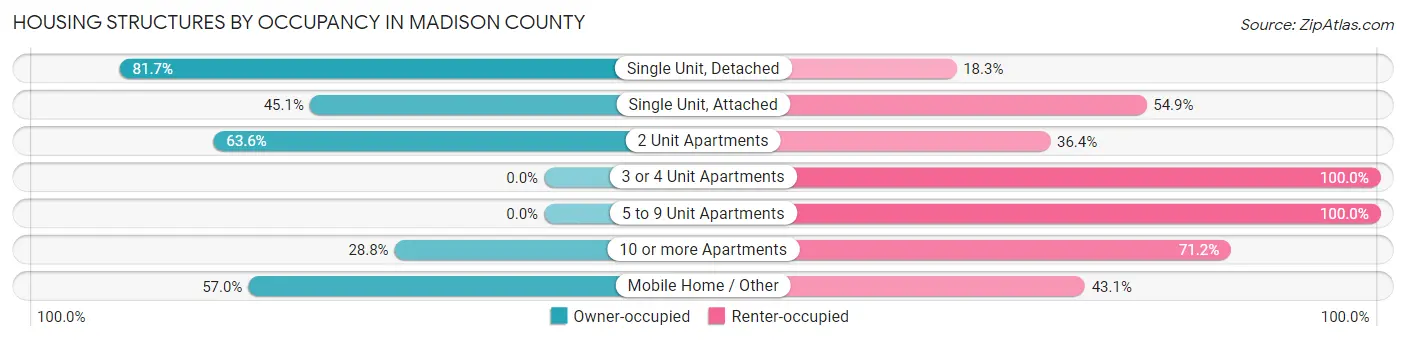
| Structure Type | Owner-occupied | Renter-occupied |
| Single Unit, Detached | 4,084 (81.7%) | 915 (18.3%) |
| Single Unit, Attached | 23 (45.1%) | 28 (54.9%) |
| 2 Unit Apartments | 7 (63.6%) | 4 (36.4%) |
| 3 or 4 Unit Apartments | 0 (0.0%) | 22 (100.0%) |
| 5 to 9 Unit Apartments | 0 (0.0%) | 24 (100.0%) |
| 10 or more Apartments | 19 (28.8%) | 47 (71.2%) |
| Mobile Home / Other | 86 (57.0%) | 65 (43.0%) |
| Total | 4,219 (79.2%) | 1,105 (20.8%) |
Housing Structures by Number of Rooms in Madison County
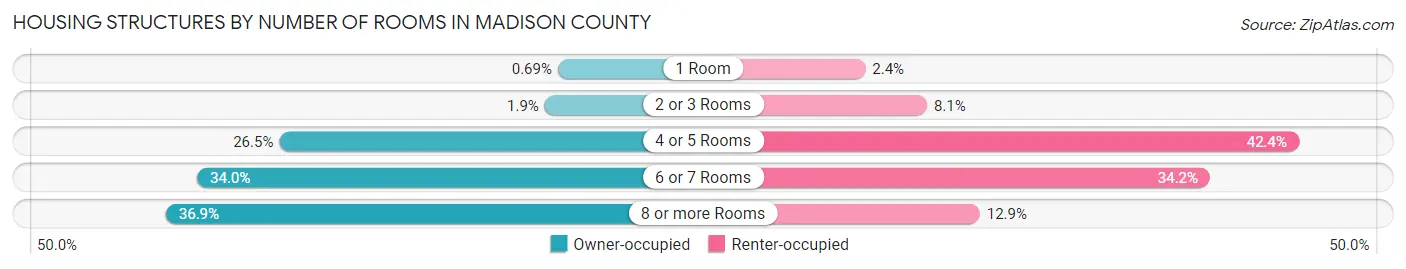
| Number of Rooms | Owner-occupied | Renter-occupied |
| 1 Room | 29 (0.7%) | 26 (2.4%) |
| 2 or 3 Rooms | 80 (1.9%) | 89 (8.1%) |
| 4 or 5 Rooms | 1,116 (26.5%) | 469 (42.4%) |
| 6 or 7 Rooms | 1,436 (34.0%) | 378 (34.2%) |
| 8 or more Rooms | 1,558 (36.9%) | 143 (12.9%) |
| Total | 4,219 (100.0%) | 1,105 (100.0%) |
Housing Structure by Heating Type in Madison County
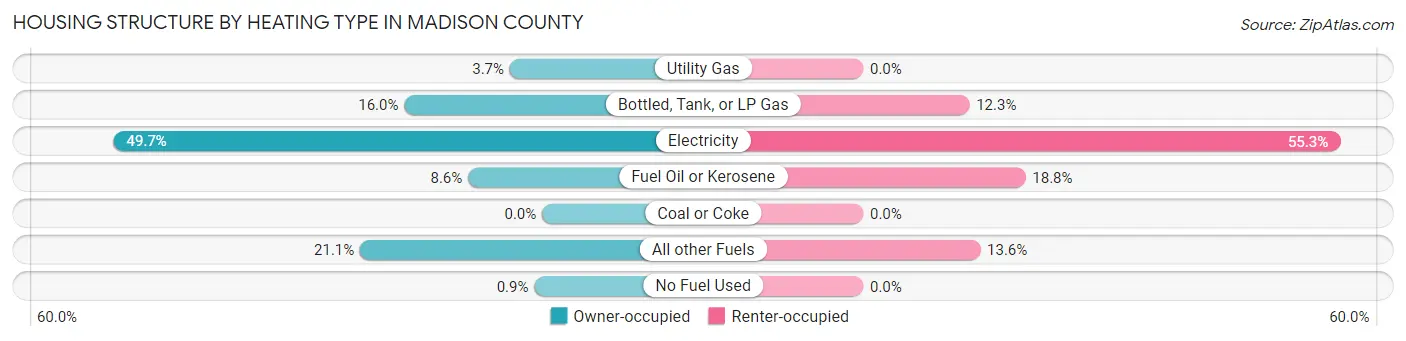
| Heating Type | Owner-occupied | Renter-occupied |
| Utility Gas | 158 (3.7%) | 0 (0.0%) |
| Bottled, Tank, or LP Gas | 674 (16.0%) | 136 (12.3%) |
| Electricity | 2,097 (49.7%) | 611 (55.3%) |
| Fuel Oil or Kerosene | 362 (8.6%) | 208 (18.8%) |
| Coal or Coke | 0 (0.0%) | 0 (0.0%) |
| All other Fuels | 890 (21.1%) | 150 (13.6%) |
| No Fuel Used | 38 (0.9%) | 0 (0.0%) |
| Total | 4,219 (100.0%) | 1,105 (100.0%) |
Household Vehicle Usage in Madison County
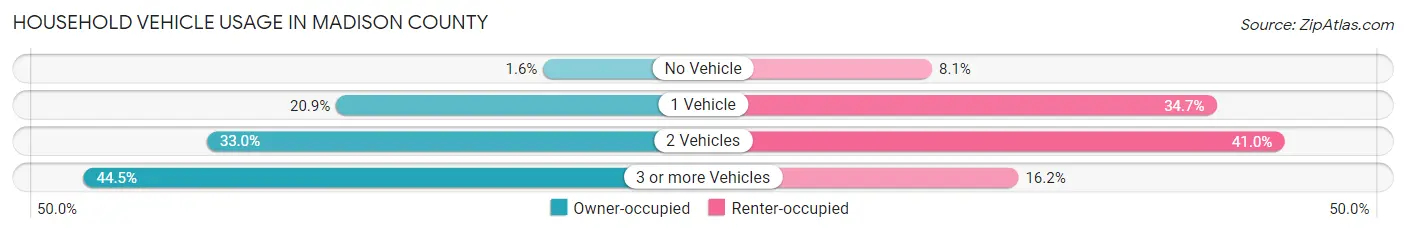
| Vehicles per Household | Owner-occupied | Renter-occupied |
| No Vehicle | 67 (1.6%) | 90 (8.1%) |
| 1 Vehicle | 883 (20.9%) | 383 (34.7%) |
| 2 Vehicles | 1,392 (33.0%) | 453 (41.0%) |
| 3 or more Vehicles | 1,877 (44.5%) | 179 (16.2%) |
| Total | 4,219 (100.0%) | 1,105 (100.0%) |
Real Estate & Mortgages in Madison County
Real Estate and Mortgage Overview in Madison County
| Characteristic | Without Mortgage | With Mortgage |
| Housing Units | 1,529 | 2,690 |
| Median Property Value | $301,000 | $314,400 |
| Median Household Income | $50,282 | $562 |
| Monthly Housing Costs | $451 | $184 |
| Real Estate Taxes | $1,875 | $53 |
Property Value by Mortgage Status in Madison County
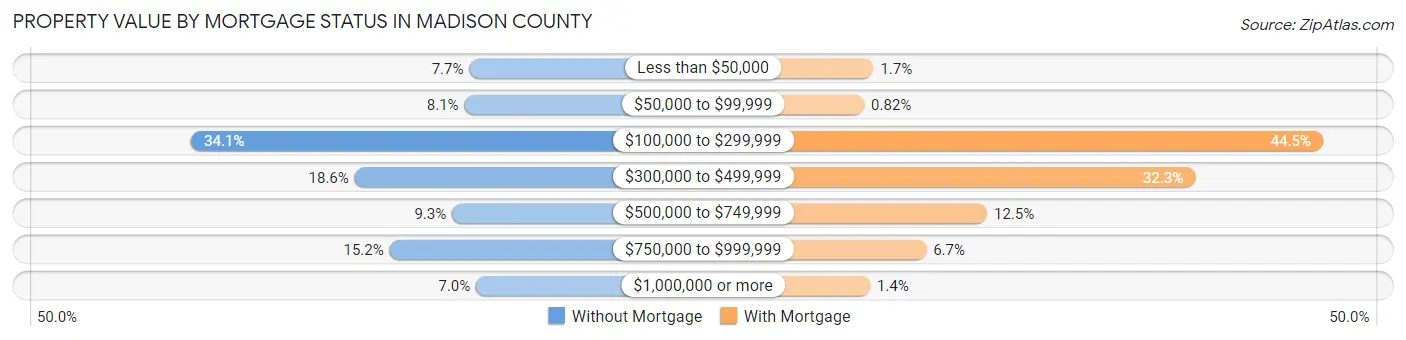
| Property Value | Without Mortgage | With Mortgage |
| Less than $50,000 | 117 (7.6%) | 46 (1.7%) |
| $50,000 to $99,999 | 124 (8.1%) | 22 (0.8%) |
| $100,000 to $299,999 | 522 (34.1%) | 1,197 (44.5%) |
| $300,000 to $499,999 | 284 (18.6%) | 870 (32.3%) |
| $500,000 to $749,999 | 142 (9.3%) | 337 (12.5%) |
| $750,000 to $999,999 | 233 (15.2%) | 181 (6.7%) |
| $1,000,000 or more | 107 (7.0%) | 37 (1.4%) |
| Total | 1,529 (100.0%) | 2,690 (100.0%) |
Household Income by Mortgage Status in Madison County
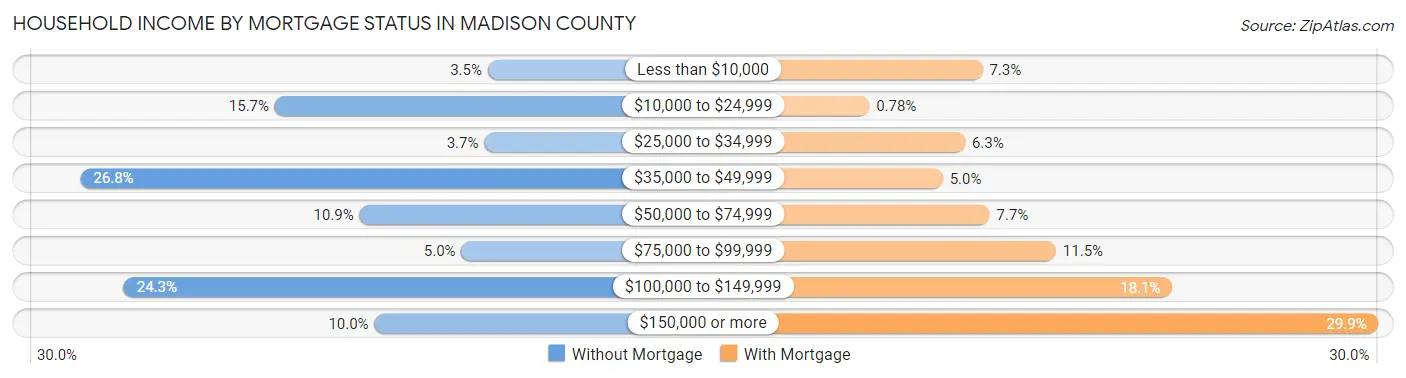
| Household Income | Without Mortgage | With Mortgage |
| Less than $10,000 | 54 (3.5%) | 195 (7.2%) |
| $10,000 to $24,999 | 240 (15.7%) | 21 (0.8%) |
| $25,000 to $34,999 | 57 (3.7%) | 168 (6.2%) |
| $35,000 to $49,999 | 410 (26.8%) | 134 (5.0%) |
| $50,000 to $74,999 | 166 (10.9%) | 206 (7.7%) |
| $75,000 to $99,999 | 77 (5.0%) | 308 (11.5%) |
| $100,000 to $149,999 | 372 (24.3%) | 487 (18.1%) |
| $150,000 or more | 153 (10.0%) | 804 (29.9%) |
| Total | 1,529 (100.0%) | 2,690 (100.0%) |
Property Value to Household Income Ratio in Madison County
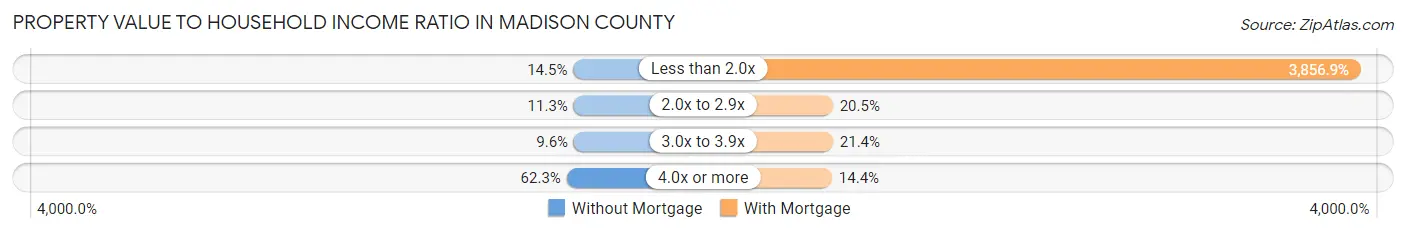
| Value-to-Income Ratio | Without Mortgage | With Mortgage |
| Less than 2.0x | 222 (14.5%) | 103,750 (3,856.9%) |
| 2.0x to 2.9x | 172 (11.3%) | 551 (20.5%) |
| 3.0x to 3.9x | 147 (9.6%) | 575 (21.4%) |
| 4.0x or more | 952 (62.3%) | 387 (14.4%) |
| Total | 1,529 (100.0%) | 2,690 (100.0%) |
Real Estate Taxes by Mortgage Status in Madison County
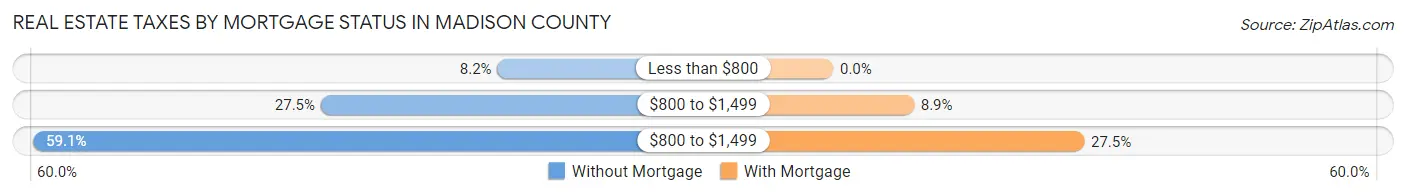
| Property Taxes | Without Mortgage | With Mortgage |
| Less than $800 | 125 (8.2%) | 0 (0.0%) |
| $800 to $1,499 | 421 (27.5%) | 238 (8.8%) |
| $800 to $1,499 | 903 (59.1%) | 740 (27.5%) |
| Total | 1,529 (100.0%) | 2,690 (100.0%) |
Health & Disability in Madison County
Health Insurance Coverage by Age in Madison County
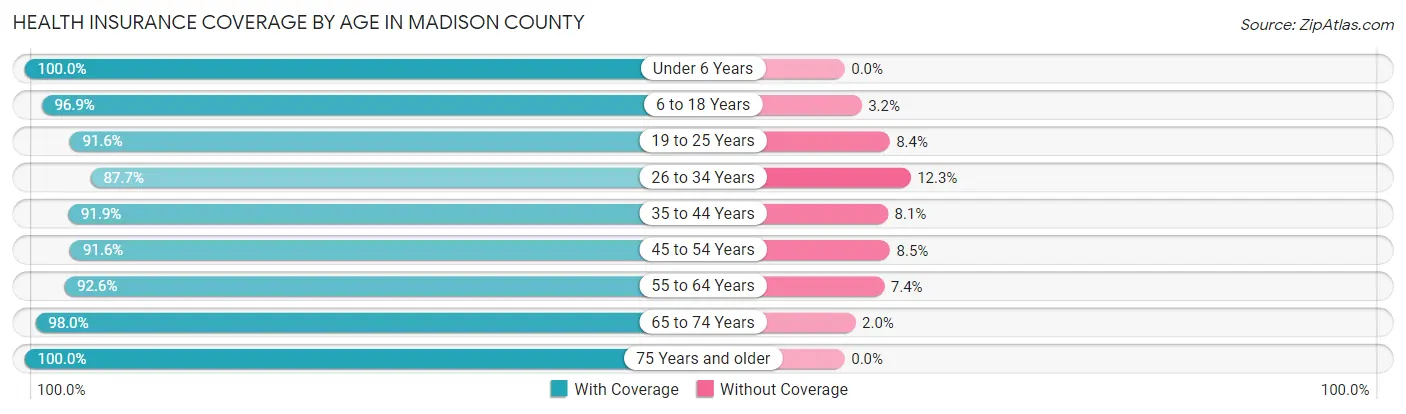
| Age Bracket | With Coverage | Without Coverage |
| Under 6 Years | 899 (100.0%) | 0 (0.0%) |
| 6 to 18 Years | 2,000 (96.9%) | 65 (3.2%) |
| 19 to 25 Years | 744 (91.6%) | 68 (8.4%) |
| 26 to 34 Years | 1,270 (87.7%) | 178 (12.3%) |
| 35 to 44 Years | 1,309 (91.9%) | 115 (8.1%) |
| 45 to 54 Years | 1,517 (91.5%) | 140 (8.5%) |
| 55 to 64 Years | 2,111 (92.6%) | 168 (7.4%) |
| 65 to 74 Years | 1,905 (98.0%) | 39 (2.0%) |
| 75 Years and older | 1,159 (100.0%) | 0 (0.0%) |
| Total | 12,914 (94.4%) | 773 (5.7%) |
Health Insurance Coverage by Citizenship Status in Madison County
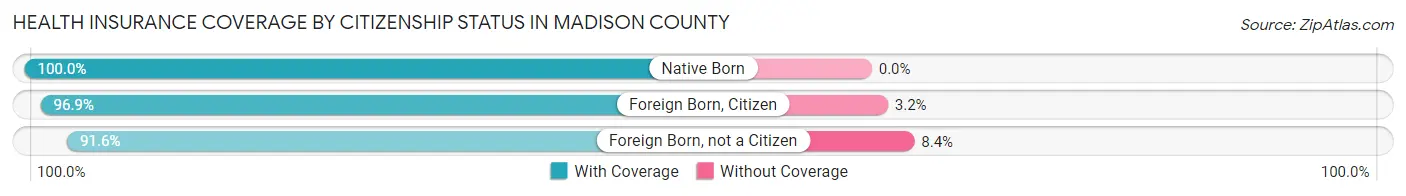
| Citizenship Status | With Coverage | Without Coverage |
| Native Born | 899 (100.0%) | 0 (0.0%) |
| Foreign Born, Citizen | 2,000 (96.9%) | 65 (3.2%) |
| Foreign Born, not a Citizen | 744 (91.6%) | 68 (8.4%) |
Health Insurance Coverage by Household Income in Madison County
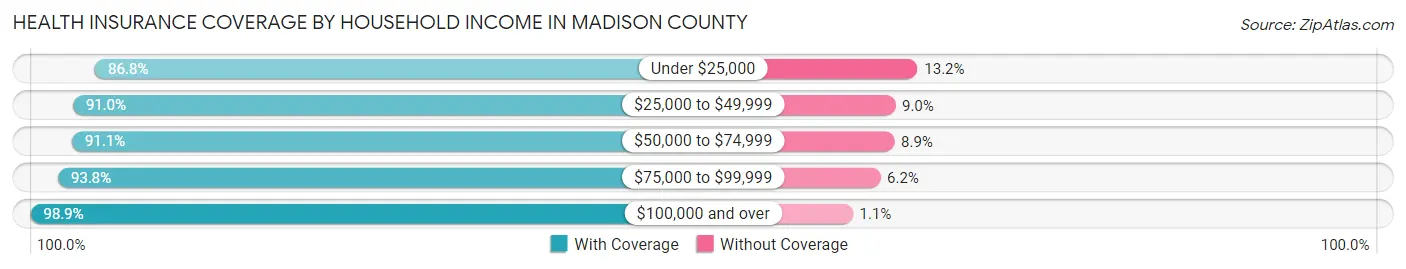
| Household Income | With Coverage | Without Coverage |
| Under $25,000 | 1,103 (86.8%) | 168 (13.2%) |
| $25,000 to $49,999 | 2,436 (91.0%) | 242 (9.0%) |
| $50,000 to $74,999 | 1,685 (91.1%) | 164 (8.9%) |
| $75,000 to $99,999 | 1,727 (93.8%) | 115 (6.2%) |
| $100,000 and over | 5,864 (98.9%) | 64 (1.1%) |
Public vs Private Health Insurance Coverage by Age in Madison County
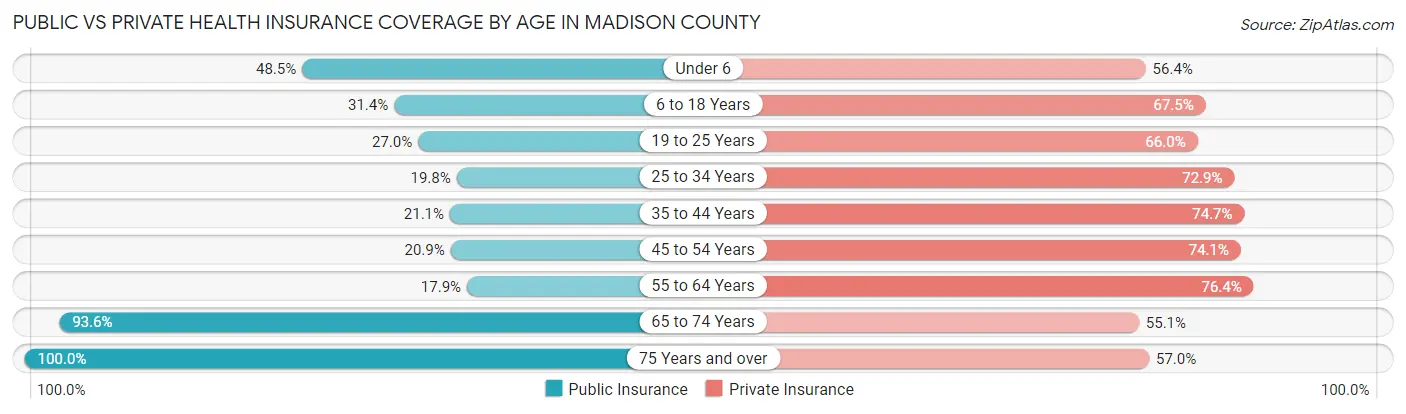
| Age Bracket | Public Insurance | Private Insurance |
| Under 6 | 436 (48.5%) | 507 (56.4%) |
| 6 to 18 Years | 649 (31.4%) | 1,394 (67.5%) |
| 19 to 25 Years | 219 (27.0%) | 536 (66.0%) |
| 25 to 34 Years | 287 (19.8%) | 1,055 (72.9%) |
| 35 to 44 Years | 300 (21.1%) | 1,064 (74.7%) |
| 45 to 54 Years | 347 (20.9%) | 1,227 (74.1%) |
| 55 to 64 Years | 408 (17.9%) | 1,742 (76.4%) |
| 65 to 74 Years | 1,819 (93.6%) | 1,072 (55.1%) |
| 75 Years and over | 1,159 (100.0%) | 661 (57.0%) |
| Total | 5,624 (41.1%) | 9,258 (67.6%) |
Disability Status by Sex by Age in Madison County
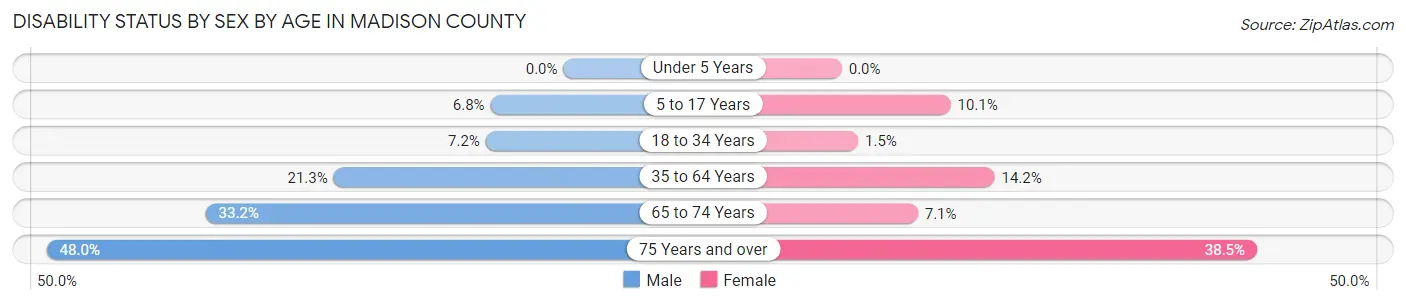
| Age Bracket | Male | Female |
| Under 5 Years | 0 (0.0%) | 0 (0.0%) |
| 5 to 17 Years | 70 (6.8%) | 101 (10.1%) |
| 18 to 34 Years | 91 (7.2%) | 18 (1.5%) |
| 35 to 64 Years | 555 (21.3%) | 391 (14.2%) |
| 65 to 74 Years | 325 (33.2%) | 68 (7.0%) |
| 75 Years and over | 257 (47.9%) | 240 (38.5%) |
Disability Class by Sex by Age in Madison County
Disability Class: Hearing Difficulty
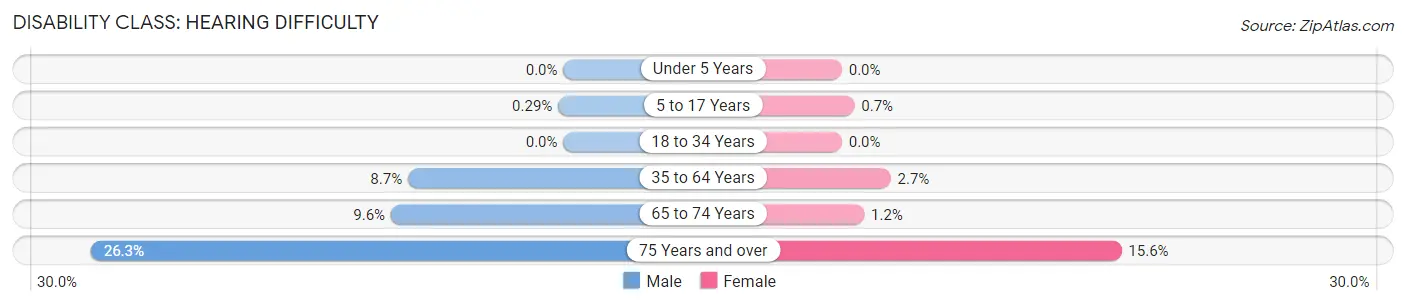
| Age Bracket | Male | Female |
| Under 5 Years | 0 (0.0%) | 0 (0.0%) |
| 5 to 17 Years | 3 (0.3%) | 7 (0.7%) |
| 18 to 34 Years | 0 (0.0%) | 0 (0.0%) |
| 35 to 64 Years | 225 (8.6%) | 75 (2.7%) |
| 65 to 74 Years | 94 (9.6%) | 12 (1.2%) |
| 75 Years and over | 141 (26.3%) | 97 (15.6%) |
Disability Class: Vision Difficulty
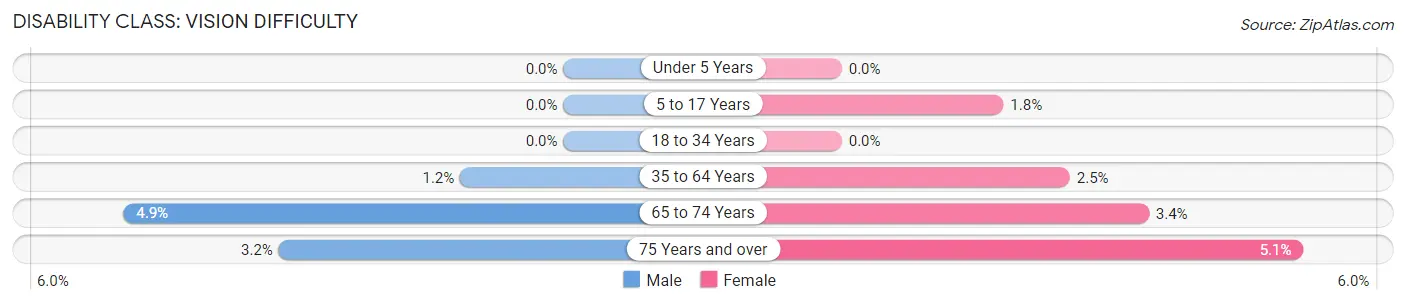
| Age Bracket | Male | Female |
| Under 5 Years | 0 (0.0%) | 0 (0.0%) |
| 5 to 17 Years | 0 (0.0%) | 18 (1.8%) |
| 18 to 34 Years | 0 (0.0%) | 0 (0.0%) |
| 35 to 64 Years | 30 (1.1%) | 70 (2.5%) |
| 65 to 74 Years | 48 (4.9%) | 33 (3.4%) |
| 75 Years and over | 17 (3.2%) | 32 (5.1%) |
Disability Class: Cognitive Difficulty
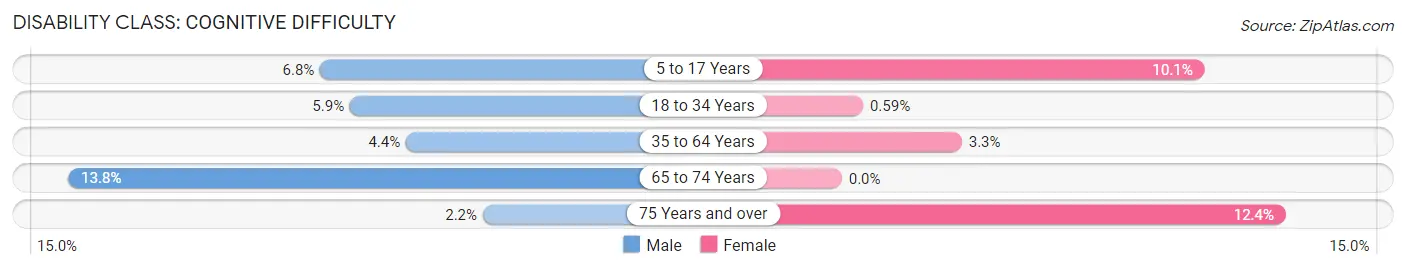
| Age Bracket | Male | Female |
| 5 to 17 Years | 70 (6.8%) | 101 (10.1%) |
| 18 to 34 Years | 75 (5.9%) | 7 (0.6%) |
| 35 to 64 Years | 114 (4.4%) | 92 (3.3%) |
| 65 to 74 Years | 135 (13.8%) | 0 (0.0%) |
| 75 Years and over | 12 (2.2%) | 77 (12.4%) |
Disability Class: Ambulatory Difficulty
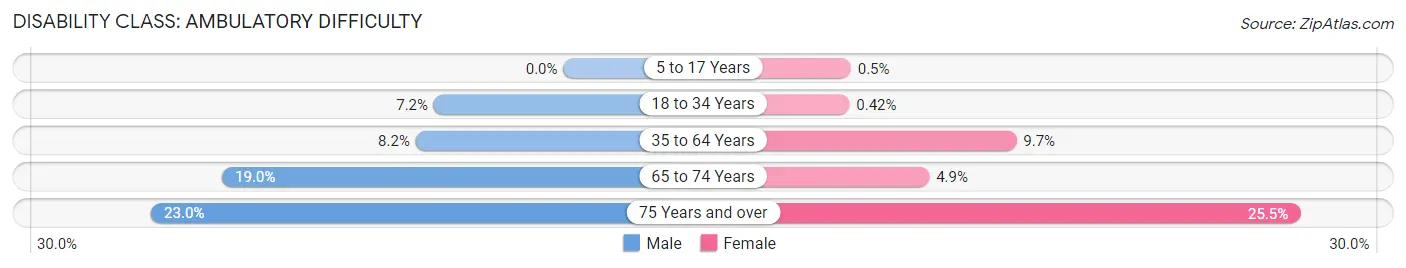
| Age Bracket | Male | Female |
| 5 to 17 Years | 0 (0.0%) | 5 (0.5%) |
| 18 to 34 Years | 91 (7.2%) | 5 (0.4%) |
| 35 to 64 Years | 214 (8.2%) | 268 (9.7%) |
| 65 to 74 Years | 186 (19.0%) | 47 (4.9%) |
| 75 Years and over | 123 (23.0%) | 159 (25.5%) |
Disability Class: Self-Care Difficulty
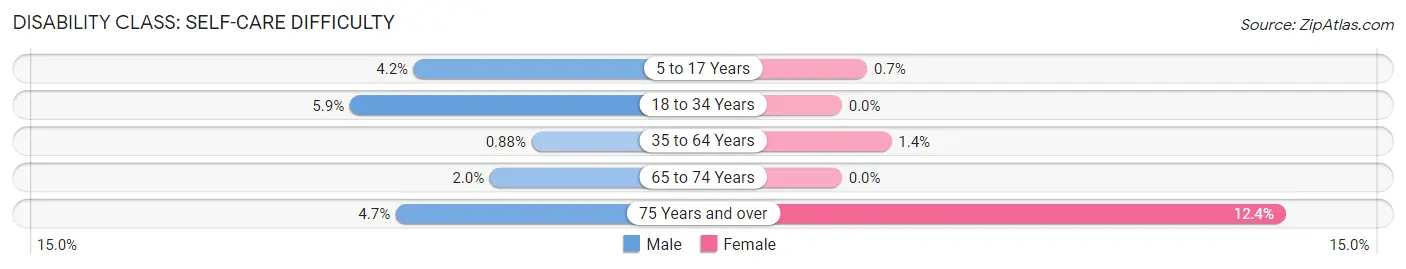
| Age Bracket | Male | Female |
| 5 to 17 Years | 43 (4.2%) | 7 (0.7%) |
| 18 to 34 Years | 75 (5.9%) | 0 (0.0%) |
| 35 to 64 Years | 23 (0.9%) | 38 (1.4%) |
| 65 to 74 Years | 20 (2.0%) | 0 (0.0%) |
| 75 Years and over | 25 (4.7%) | 77 (12.4%) |
Technology Access in Madison County
Computing Device Access in Madison County
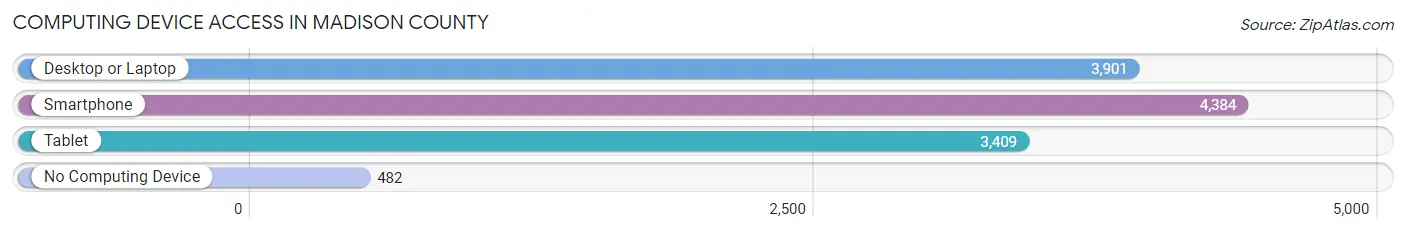
| Device Type | # Households | % Households |
| Desktop or Laptop | 3,901 | 73.3% |
| Smartphone | 4,384 | 82.3% |
| Tablet | 3,409 | 64.0% |
| No Computing Device | 482 | 9.0% |
| Total | 5,324 | 100.0% |
Internet Access in Madison County
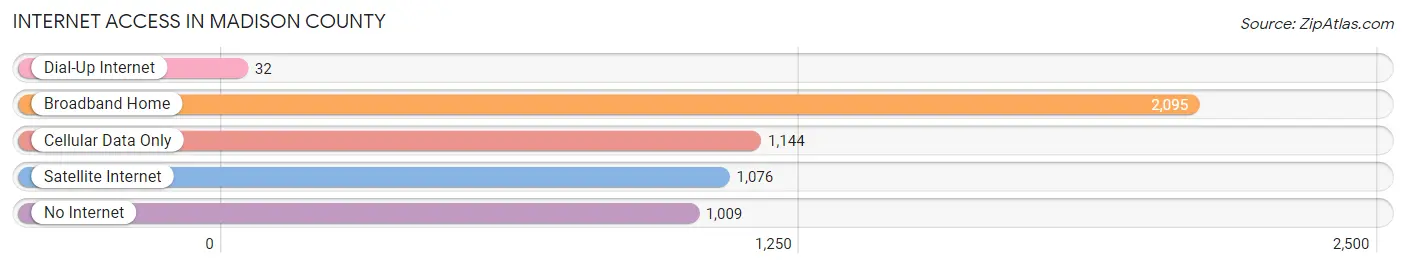
| Internet Type | # Households | % Households |
| Dial-Up Internet | 32 | 0.6% |
| Broadband Home | 2,095 | 39.4% |
| Cellular Data Only | 1,144 | 21.5% |
| Satellite Internet | 1,076 | 20.2% |
| No Internet | 1,009 | 19.0% |
| Total | 5,324 | 100.0% |
Madison County Summary
Madison County is located in the Shenandoah Valley of Virginia, and is part of the Harrisonburg Metropolitan Statistical Area. The county is bordered by the Blue Ridge Mountains to the east, the Allegheny Mountains to the west, and the Rapidan River to the south. The county seat is the town of Madison, and the county is home to a population of approximately 13,308 people.
History
Madison County was formed in 1792 from Culpeper County. It was named for James Madison, the fourth President of the United States. The county was home to several Native American tribes, including the Monacan, the Manahoac, and the Siouan-speaking Tutelo. The first European settlers arrived in the area in the 1730s, and the county was officially established in 1792.
During the Civil War, Madison County was a major site of the Battle of Cross Keys, which took place on June 8, 1862. The battle was a Confederate victory, and resulted in the death of Union General Nathaniel Banks.
Geography
Madison County is located in the Shenandoah Valley of Virginia, and is part of the Harrisonburg Metropolitan Statistical Area. The county is bordered by the Blue Ridge Mountains to the east, the Allegheny Mountains to the west, and the Rapidan River to the south. The county has a total area of 437 square miles, of which 434 square miles is land and 3 square miles is water.
The county is home to several state parks, including Shenandoah River State Park, Sky Meadows State Park, and Rapidan Wildlife Management Area. The county also contains several historic sites, including the Belle Grove Plantation, the Stonewall Jackson House, and the Cross Keys Battlefield.
Economy
The economy of Madison County is largely based on agriculture and tourism. The county is home to several wineries, including the Bluemont Vineyard and the CrossKeys Vineyards. The county is also home to several historic sites, including the Belle Grove Plantation, the Stonewall Jackson House, and the Cross Keys Battlefield.
The county is home to several manufacturing companies, including the Madison Wood Preservers, the Madison Wood Products Company, and the Madison County Lumber Company. The county is also home to several educational institutions, including James Madison University, Eastern Mennonite University, and Bridgewater College.
Demographics
As of the 2010 census, Madison County had a population of 13,308 people. The racial makeup of the county was 90.3% White, 5.3% Black or African American, 0.3% Native American, 1.2% Asian, 0.1% Pacific Islander, 1.2% from other races, and 1.6% from two or more races. The median household income was $45,945, and the median family income was $54,945.
The largest ancestry groups in Madison County are German (25.2%), English (17.2%), Irish (14.2%), and American (13.2%). The county is home to several religious denominations, including Baptist (25.2%), Methodist (17.2%), and Presbyterian (14.2%). The county is also home to several educational institutions, including James Madison University, Eastern Mennonite University, and Bridgewater College.
Common Questions
What is Per Capita Income in Madison County?
Per Capita income in Madison County is $35,772.
What is the Median Family Income in Madison County?
Median Family Income in Madison County is $92,274.
What is the Median Household income in Madison County?
Median Household Income in Madison County is $74,586.
What is Income or Wage Gap in Madison County?
Income or Wage Gap in Madison County is 28.1%.
Women in Madison County earn 71.9 cents for every dollar earned by a man.
What is Inequality or Gini Index in Madison County?
Inequality or Gini Index in Madison County is 0.42.
What is the Total Population of Madison County?
Total Population of Madison County is 13,828.
What is the Total Male Population of Madison County?
Total Male Population of Madison County is 6,764.
What is the Total Female Population of Madison County?
Total Female Population of Madison County is 7,064.
What is the Ratio of Males per 100 Females in Madison County?
There are 95.75 Males per 100 Females in Madison County.
What is the Ratio of Females per 100 Males in Madison County?
There are 104.44 Females per 100 Males in Madison County.
What is the Median Population Age in Madison County?
Median Population Age in Madison County is 46.6 Years.
What is the Average Family Size in Madison County
Average Family Size in Madison County is 3.0 People.
What is the Average Household Size in Madison County
Average Household Size in Madison County is 2.5 People.
How Large is the Labor Force in Madison County?
There are 6,908 People in the Labor Forcein in Madison County.
What is the Percentage of People in the Labor Force in Madison County?
60.5% of People are in the Labor Force in Madison County.
What is the Unemployment Rate in Madison County?
Unemployment Rate in Madison County is 3.7%.