Loudoun County, VA Map & Demographics
Loudoun County Map
Loudoun County Overview
$67,251
PER CAPITA INCOME
$189,841
AVG FAMILY INCOME
$170,463
AVG HOUSEHOLD INCOME
44.9%
WAGE / INCOME GAP [ % ]
55.1¢/ $1
WAGE / INCOME GAP [ $ ]
$10,307
FAMILY INCOME DEFICIT
0.39
INEQUALITY / GINI INDEX
420,773
TOTAL POPULATION
210,848
MALE POPULATION
209,925
FEMALE POPULATION
100.44
MALES / 100 FEMALES
99.56
FEMALES / 100 MALES
37.3
MEDIAN AGE
3.4
AVG FAMILY SIZE
3.0
AVG HOUSEHOLD SIZE
237,821
LABOR FORCE [ PEOPLE ]
74.3%
PERCENT IN LABOR FORCE
3.2%
UNEMPLOYMENT RATE
Income in Loudoun County
Income Overview in Loudoun County
Per Capita Income in Loudoun County is $67,251, while median incomes of families and households are $189,841 and $170,463 respectively.
| Characteristic | Number | Measure |
| Per Capita Income | 420,773 | $67,251 |
| Median Family Income | 108,917 | $189,841 |
| Mean Family Income | 108,917 | $220,790 |
| Median Household Income | 138,549 | $170,463 |
| Mean Household Income | 138,549 | $201,590 |
| Income Deficit | 108,917 | $10,307 |
| Wage / Income Gap (%) | 420,773 | 44.85% |
| Wage / Income Gap ($) | 420,773 | 55.15¢ per $1 |
| Gini / Inequality Index | 420,773 | 0.39 |
Earnings by Sex in Loudoun County
Average Earnings in Loudoun County are $78,340, $103,947 for men and $57,323 for women, a difference of 44.9%.

| Sex | Number | Average Earnings |
| Male | 133,064 (54.2%) | $103,947 |
| Female | 112,376 (45.8%) | $57,323 |
| Total | 245,440 (100.0%) | $78,340 |
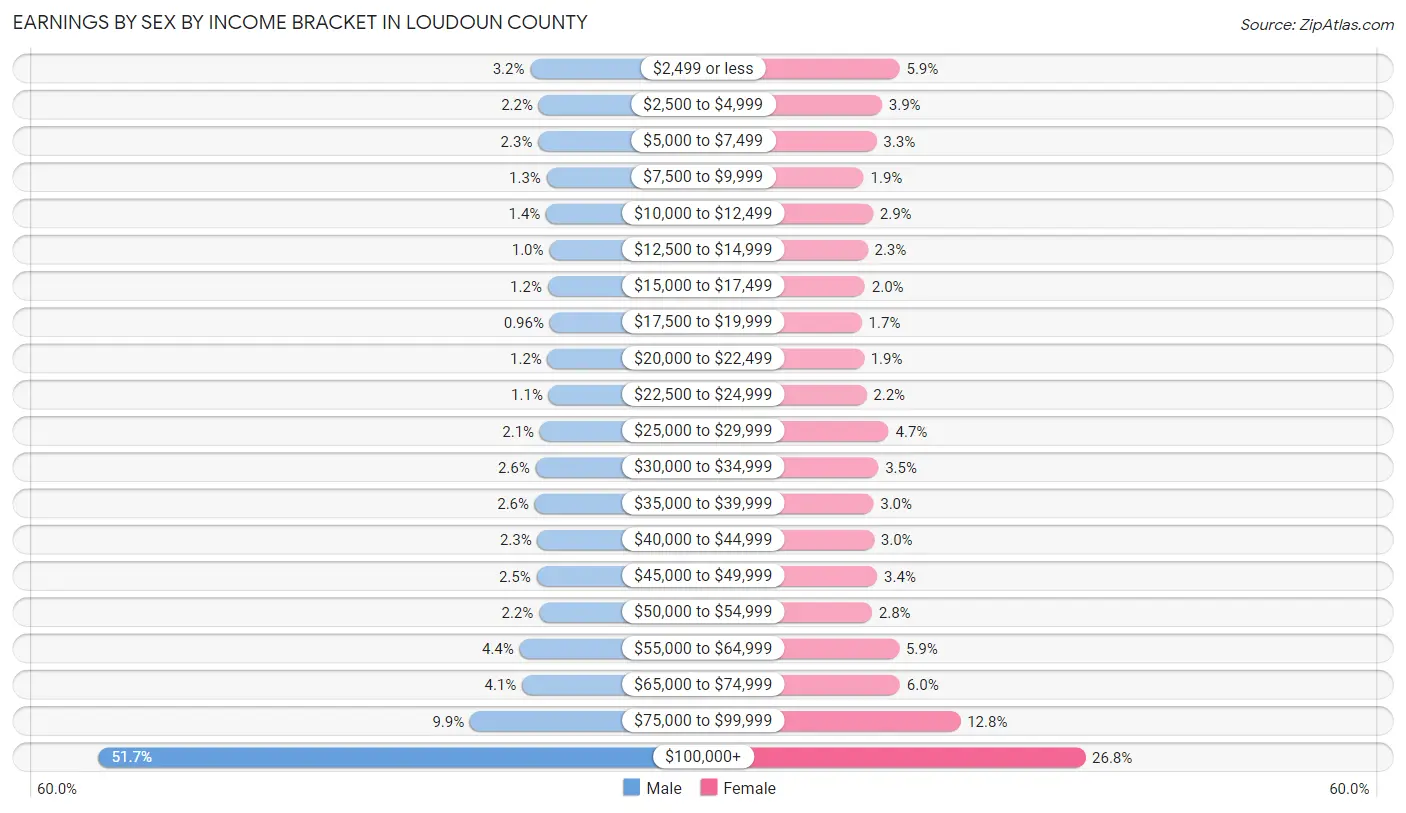
Earnings by Sex by Income Bracket in Loudoun County
The most common earnings brackets in Loudoun County are $100,000+ for men (68,757 | 51.7%) and $100,000+ for women (30,107 | 26.8%).
| Income | Male | Female |
| $2,499 or less | 4,194 (3.2%) | 6,662 (5.9%) |
| $2,500 to $4,999 | 2,921 (2.2%) | 4,427 (3.9%) |
| $5,000 to $7,499 | 3,006 (2.3%) | 3,738 (3.3%) |
| $7,500 to $9,999 | 1,746 (1.3%) | 2,128 (1.9%) |
| $10,000 to $12,499 | 1,822 (1.4%) | 3,293 (2.9%) |
| $12,500 to $14,999 | 1,341 (1.0%) | 2,615 (2.3%) |
| $15,000 to $17,499 | 1,585 (1.2%) | 2,281 (2.0%) |
| $17,500 to $19,999 | 1,279 (1.0%) | 1,874 (1.7%) |
| $20,000 to $22,499 | 1,603 (1.2%) | 2,136 (1.9%) |
| $22,500 to $24,999 | 1,436 (1.1%) | 2,476 (2.2%) |
| $25,000 to $29,999 | 2,761 (2.1%) | 5,281 (4.7%) |
| $30,000 to $34,999 | 3,412 (2.6%) | 3,969 (3.5%) |
| $35,000 to $39,999 | 3,507 (2.6%) | 3,351 (3.0%) |
| $40,000 to $44,999 | 3,118 (2.3%) | 3,420 (3.0%) |
| $45,000 to $49,999 | 3,265 (2.5%) | 3,829 (3.4%) |
| $50,000 to $54,999 | 2,879 (2.2%) | 3,168 (2.8%) |
| $55,000 to $64,999 | 5,808 (4.4%) | 6,587 (5.9%) |
| $65,000 to $74,999 | 5,410 (4.1%) | 6,711 (6.0%) |
| $75,000 to $99,999 | 13,214 (9.9%) | 14,323 (12.8%) |
| $100,000+ | 68,757 (51.7%) | 30,107 (26.8%) |
| Total | 133,064 (100.0%) | 112,376 (100.0%) |
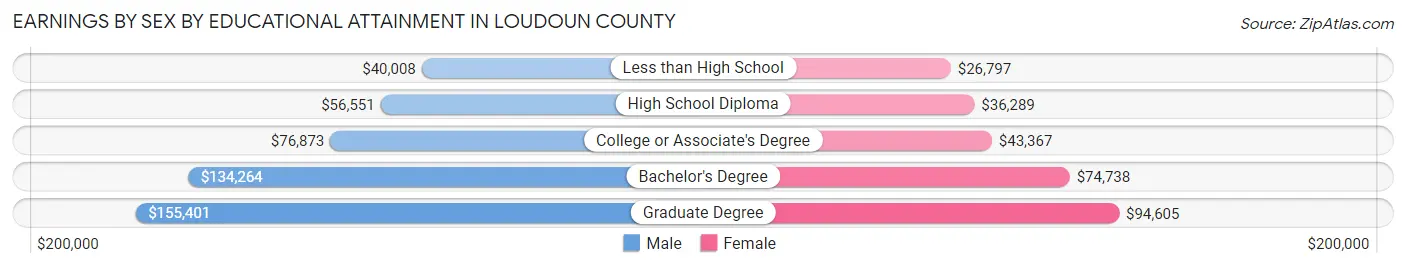
Earnings by Sex by Educational Attainment in Loudoun County
Average earnings in Loudoun County are $115,969 for men and $68,370 for women, a difference of 41.0%. Men with an educational attainment of graduate degree enjoy the highest average annual earnings of $155,401, while those with less than high school education earn the least with $40,008. Women with an educational attainment of graduate degree earn the most with the average annual earnings of $94,605, while those with less than high school education have the smallest earnings of $26,797.
| Educational Attainment | Male Income | Female Income |
| Less than High School | $40,008 | $26,797 |
| High School Diploma | $56,551 | $36,289 |
| College or Associate's Degree | $76,873 | $43,367 |
| Bachelor's Degree | $134,264 | $74,738 |
| Graduate Degree | $155,401 | $94,605 |
| Total | $115,969 | $68,370 |
Family Income in Loudoun County
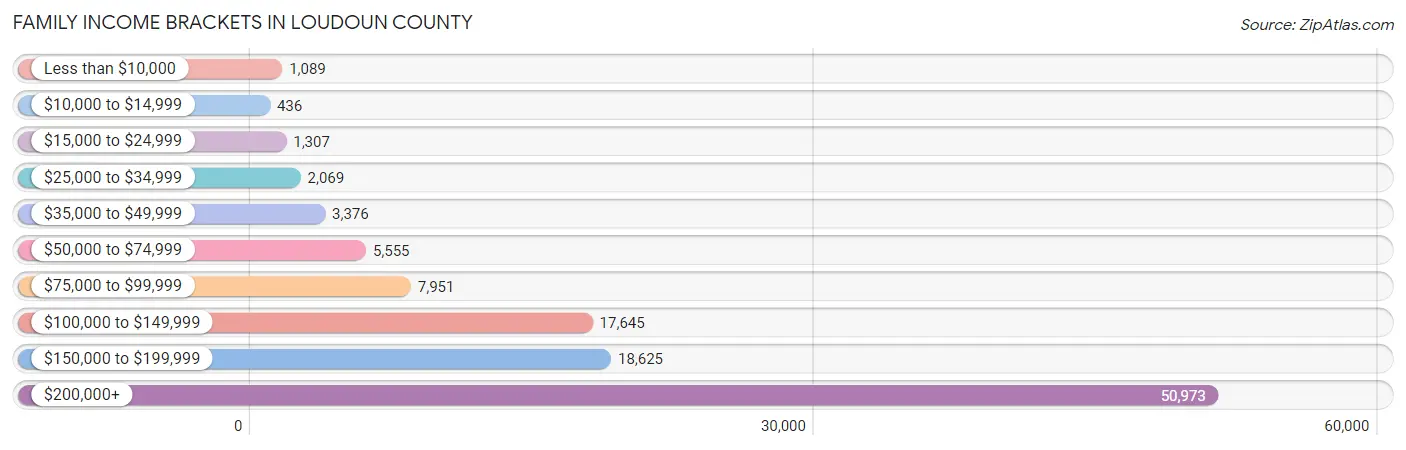
Family Income Brackets in Loudoun County
According to the Loudoun County family income data, there are 50,973 families falling into the $200,000+ income range, which is the most common income bracket and makes up 46.8% of all families. Conversely, the $10,000 to $14,999 income bracket is the least frequent group with only 436 families (0.4%) belonging to this category.
| Income Bracket | # Families | % Families |
| Less than $10,000 | 1,089 | 1.0% |
| $10,000 to $14,999 | 436 | 0.4% |
| $15,000 to $24,999 | 1,307 | 1.2% |
| $25,000 to $34,999 | 2,069 | 1.9% |
| $35,000 to $49,999 | 3,376 | 3.1% |
| $50,000 to $74,999 | 5,555 | 5.1% |
| $75,000 to $99,999 | 7,951 | 7.3% |
| $100,000 to $149,999 | 17,645 | 16.2% |
| $150,000 to $199,999 | 18,625 | 17.1% |
| $200,000+ | 50,973 | 46.8% |
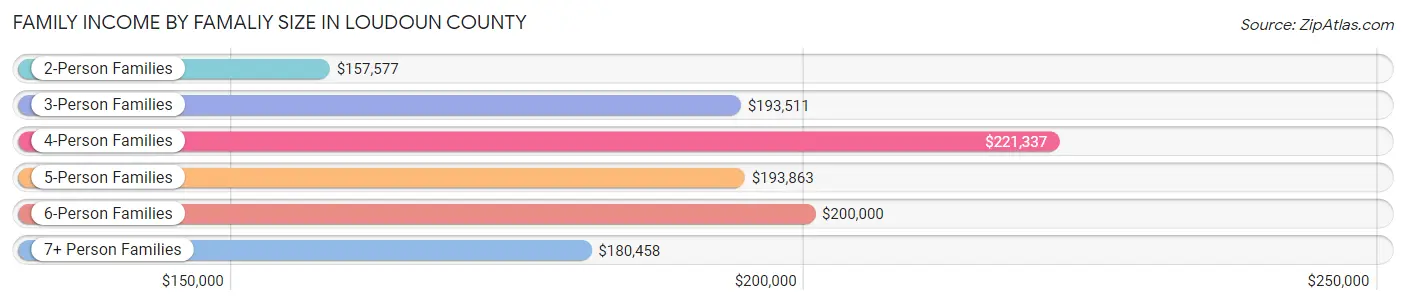
Family Income by Famaliy Size in Loudoun County
4-person families (30,920 | 28.4%) account for the highest median family income in Loudoun County with $221,337 per family, while 2-person families (34,568 | 31.7%) have the highest median income of $78,788 per family member.
| Income Bracket | # Families | Median Income |
| 2-Person Families | 34,568 (31.7%) | $157,577 |
| 3-Person Families | 26,597 (24.4%) | $193,511 |
| 4-Person Families | 30,920 (28.4%) | $221,337 |
| 5-Person Families | 11,311 (10.4%) | $193,863 |
| 6-Person Families | 3,618 (3.3%) | $200,000 |
| 7+ Person Families | 1,903 (1.8%) | $180,458 |
| Total | 108,917 (100.0%) | $189,841 |
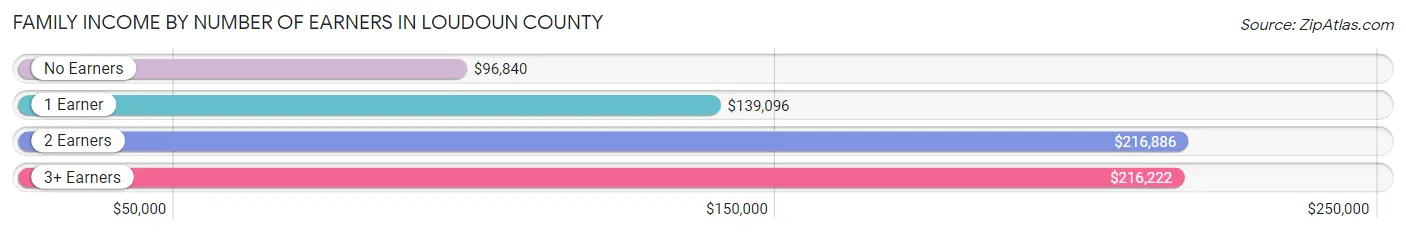
Family Income by Number of Earners in Loudoun County
The median family income in Loudoun County is $189,841, with families comprising 2 earners (57,355) having the highest median family income of $216,886, while families with no earners (6,385) have the lowest median family income of $96,840, accounting for 52.7% and 5.9% of families, respectively.
| Number of Earners | # Families | Median Income |
| No Earners | 6,385 (5.9%) | $96,840 |
| 1 Earner | 26,863 (24.7%) | $139,096 |
| 2 Earners | 57,355 (52.7%) | $216,886 |
| 3+ Earners | 18,314 (16.8%) | $216,222 |
| Total | 108,917 (100.0%) | $189,841 |
Household Income in Loudoun County
Household Income Brackets in Loudoun County
With 55,835 households falling in the category, the $200,000+ income range is the most frequent in Loudoun County, accounting for 40.3% of all households. In contrast, only 831 households (0.6%) fall into the $10,000 to $14,999 income bracket, making it the least populous group.

| Income Bracket | # Households | % Households |
| Less than $10,000 | 2,494 | 1.8% |
| $10,000 to $14,999 | 831 | 0.6% |
| $15,000 to $24,999 | 2,494 | 1.8% |
| $25,000 to $34,999 | 3,187 | 2.3% |
| $35,000 to $49,999 | 5,819 | 4.2% |
| $50,000 to $74,999 | 9,837 | 7.1% |
| $75,000 to $99,999 | 11,500 | 8.3% |
| $100,000 to $149,999 | 23,692 | 17.1% |
| $150,000 to $199,999 | 22,999 | 16.6% |
| $200,000+ | 55,835 | 40.3% |
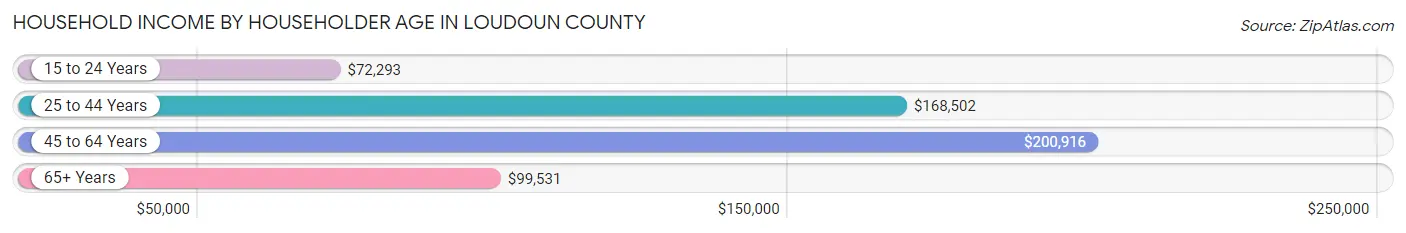
Household Income by Householder Age in Loudoun County
The median household income in Loudoun County is $170,463, with the highest median household income of $200,916 found in the 45 to 64 years age bracket for the primary householder. A total of 60,726 households (43.8%) fall into this category. Meanwhile, the 15 to 24 years age bracket for the primary householder has the lowest median household income of $72,293, with 2,396 households (1.7%) in this group.
| Income Bracket | # Households | Median Income |
| 15 to 24 Years | 2,396 (1.7%) | $72,293 |
| 25 to 44 Years | 53,225 (38.4%) | $168,502 |
| 45 to 64 Years | 60,726 (43.8%) | $200,916 |
| 65+ Years | 22,202 (16.0%) | $99,531 |
| Total | 138,549 (100.0%) | $170,463 |
Poverty in Loudoun County
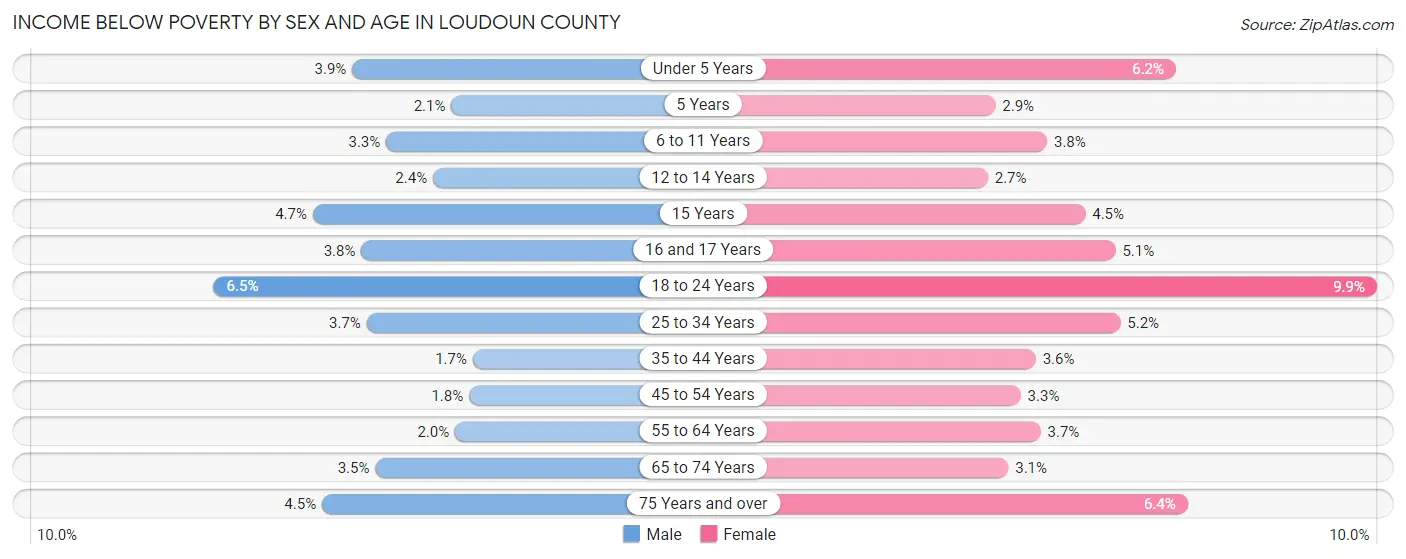
Income Below Poverty by Sex and Age in Loudoun County
With 3.0% poverty level for males and 4.5% for females among the residents of Loudoun County, 18 to 24 year old males and 18 to 24 year old females are the most vulnerable to poverty, with 1,082 males (6.5%) and 1,603 females (9.9%) in their respective age groups living below the poverty level.
| Age Bracket | Male | Female |
| Under 5 Years | 539 (3.9%) | 815 (6.2%) |
| 5 Years | 68 (2.1%) | 92 (2.9%) |
| 6 to 11 Years | 648 (3.3%) | 729 (3.8%) |
| 12 to 14 Years | 266 (2.4%) | 267 (2.7%) |
| 15 Years | 156 (4.6%) | 132 (4.5%) |
| 16 and 17 Years | 265 (3.7%) | 362 (5.1%) |
| 18 to 24 Years | 1,082 (6.5%) | 1,603 (9.9%) |
| 25 to 34 Years | 839 (3.6%) | 1,242 (5.2%) |
| 35 to 44 Years | 594 (1.7%) | 1,299 (3.6%) |
| 45 to 54 Years | 600 (1.8%) | 1,065 (3.3%) |
| 55 to 64 Years | 469 (2.0%) | 820 (3.7%) |
| 65 to 74 Years | 407 (3.5%) | 400 (3.1%) |
| 75 Years and over | 318 (4.5%) | 629 (6.4%) |
| Total | 6,251 (3.0%) | 9,455 (4.5%) |
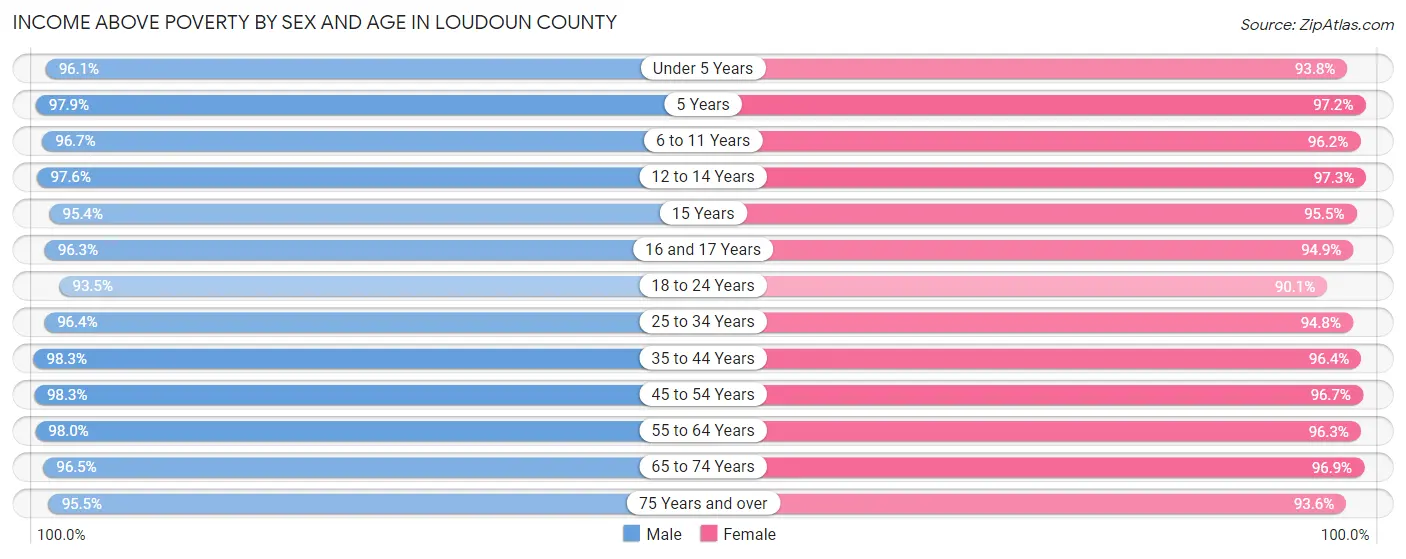
Income Above Poverty by Sex and Age in Loudoun County
According to the poverty statistics in Loudoun County, males aged 35 to 44 years and females aged 12 to 14 years are the age groups that are most secure financially, with 98.3% of males and 97.3% of females in these age groups living above the poverty line.
| Age Bracket | Male | Female |
| Under 5 Years | 13,199 (96.1%) | 12,336 (93.8%) |
| 5 Years | 3,197 (97.9%) | 3,136 (97.2%) |
| 6 to 11 Years | 19,020 (96.7%) | 18,414 (96.2%) |
| 12 to 14 Years | 10,704 (97.6%) | 9,603 (97.3%) |
| 15 Years | 3,196 (95.4%) | 2,790 (95.5%) |
| 16 and 17 Years | 6,811 (96.3%) | 6,769 (94.9%) |
| 18 to 24 Years | 15,585 (93.5%) | 14,533 (90.1%) |
| 25 to 34 Years | 22,123 (96.4%) | 22,794 (94.8%) |
| 35 to 44 Years | 34,835 (98.3%) | 34,779 (96.4%) |
| 45 to 54 Years | 33,721 (98.3%) | 30,976 (96.7%) |
| 55 to 64 Years | 22,917 (98.0%) | 21,426 (96.3%) |
| 65 to 74 Years | 11,245 (96.5%) | 12,539 (96.9%) |
| 75 Years and over | 6,776 (95.5%) | 9,163 (93.6%) |
| Total | 203,329 (97.0%) | 199,258 (95.5%) |
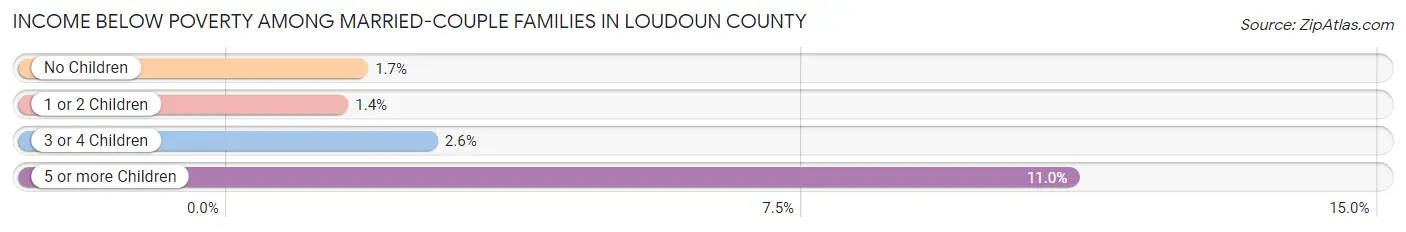
Income Below Poverty Among Married-Couple Families in Loudoun County
The poverty statistics for married-couple families in Loudoun County show that 1.7% or 1,578 of the total 93,320 families live below the poverty line. Families with 5 or more children have the highest poverty rate of 11.0%, comprising of 38 families. On the other hand, families with 1 or 2 children have the lowest poverty rate of 1.4%, which includes 652 families.
| Children | Above Poverty | Below Poverty |
| No Children | 38,295 (98.3%) | 664 (1.7%) |
| 1 or 2 Children | 44,768 (98.6%) | 652 (1.4%) |
| 3 or 4 Children | 8,371 (97.4%) | 224 (2.6%) |
| 5 or more Children | 308 (89.0%) | 38 (11.0%) |
| Total | 91,742 (98.3%) | 1,578 (1.7%) |
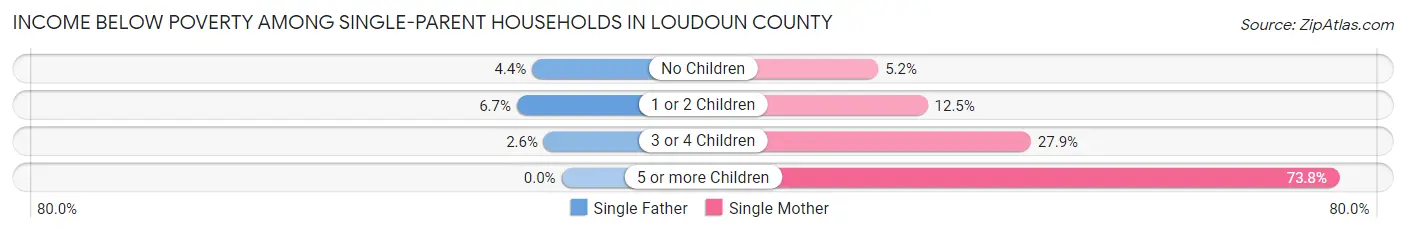
Income Below Poverty Among Single-Parent Households in Loudoun County
According to the poverty data in Loudoun County, 5.5% or 286 single-father households and 11.3% or 1,170 single-mother households are living below the poverty line. Among single-father households, those with 1 or 2 children have the highest poverty rate, with 190 households (6.7%) experiencing poverty. Likewise, among single-mother households, those with 5 or more children have the highest poverty rate, with 45 households (73.8%) falling below the poverty line.
| Children | Single Father | Single Mother |
| No Children | 85 (4.4%) | 204 (5.1%) |
| 1 or 2 Children | 190 (6.7%) | 695 (12.5%) |
| 3 or 4 Children | 11 (2.6%) | 226 (27.9%) |
| 5 or more Children | 0 (0.0%) | 45 (73.8%) |
| Total | 286 (5.5%) | 1,170 (11.3%) |
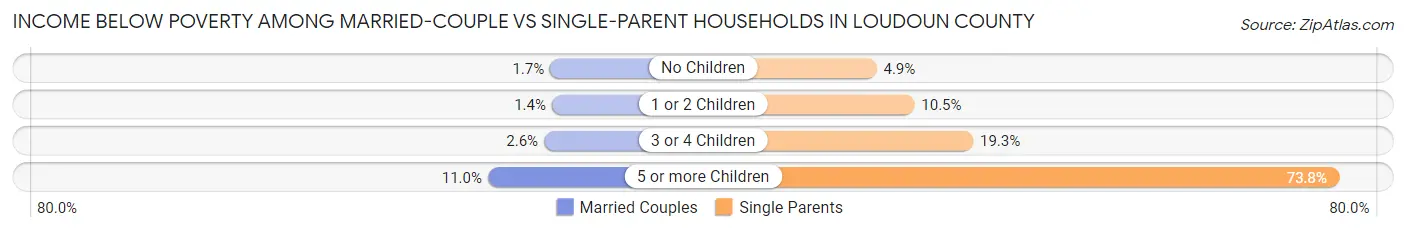
Income Below Poverty Among Married-Couple vs Single-Parent Households in Loudoun County
The poverty data for Loudoun County shows that 1,578 of the married-couple family households (1.7%) and 1,456 of the single-parent households (9.3%) are living below the poverty level. Within the married-couple family households, those with 5 or more children have the highest poverty rate, with 38 households (11.0%) falling below the poverty line. Among the single-parent households, those with 5 or more children have the highest poverty rate, with 45 household (73.8%) living below poverty.
| Children | Married-Couple Families | Single-Parent Households |
| No Children | 664 (1.7%) | 289 (4.9%) |
| 1 or 2 Children | 652 (1.4%) | 885 (10.5%) |
| 3 or 4 Children | 224 (2.6%) | 237 (19.3%) |
| 5 or more Children | 38 (11.0%) | 45 (73.8%) |
| Total | 1,578 (1.7%) | 1,456 (9.3%) |
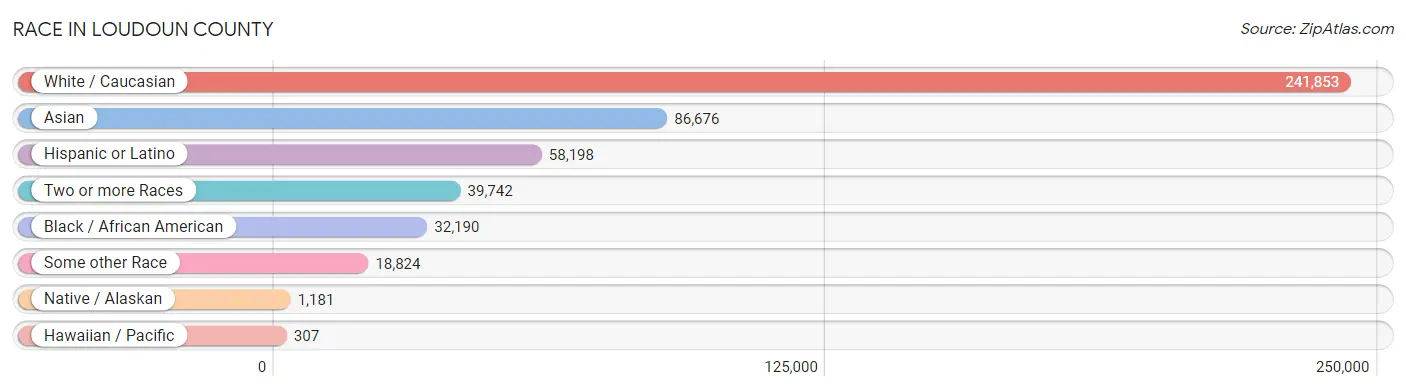
Race in Loudoun County
The most populous races in Loudoun County are White / Caucasian (241,853 | 57.5%), Asian (86,676 | 20.6%), and Hispanic or Latino (58,198 | 13.8%).
| Race | # Population | % Population |
| Asian | 86,676 | 20.6% |
| Black / African American | 32,190 | 7.6% |
| Hawaiian / Pacific | 307 | 0.1% |
| Hispanic or Latino | 58,198 | 13.8% |
| Native / Alaskan | 1,181 | 0.3% |
| White / Caucasian | 241,853 | 57.5% |
| Two or more Races | 39,742 | 9.4% |
| Some other Race | 18,824 | 4.5% |
| Total | 420,773 | 100.0% |
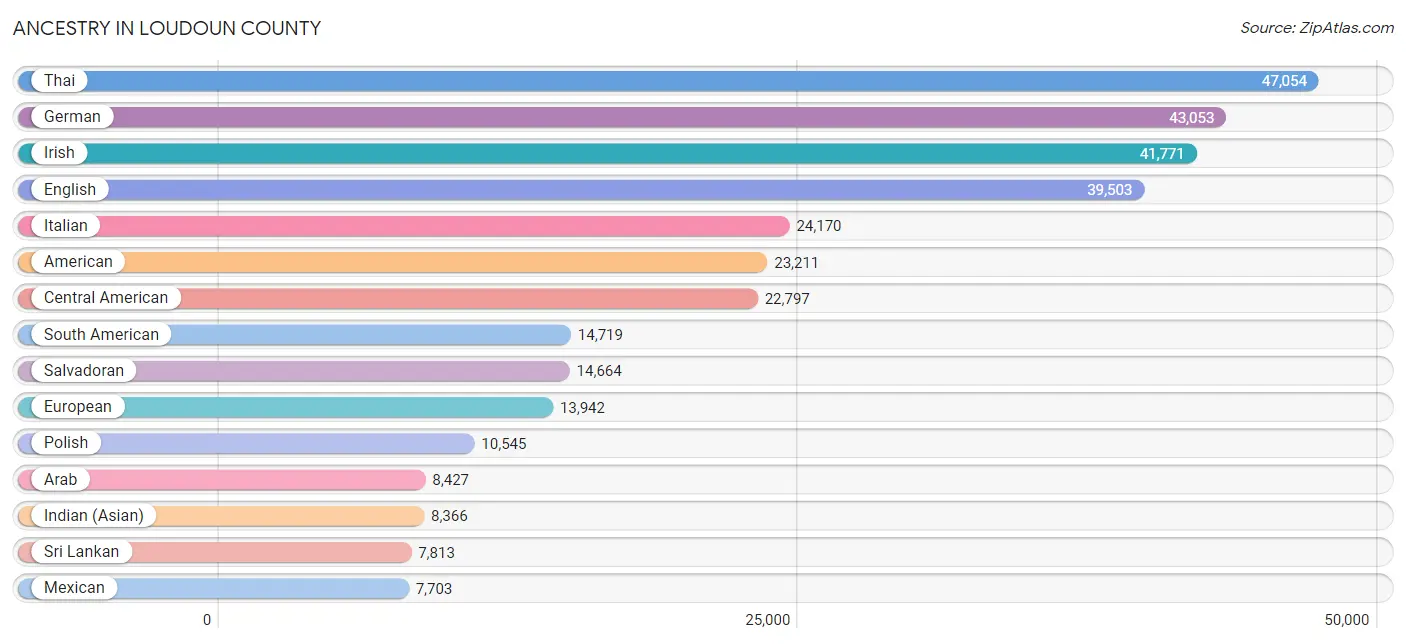
Ancestry in Loudoun County
The most populous ancestries reported in Loudoun County are Thai (47,054 | 11.2%), German (43,053 | 10.2%), Irish (41,771 | 9.9%), English (39,503 | 9.4%), and Italian (24,170 | 5.7%), together accounting for 46.5% of all Loudoun County residents.
| Ancestry | # Population | % Population |
| Afghan | 1,720 | 0.4% |
| African | 2,427 | 0.6% |
| Albanian | 565 | 0.1% |
| American | 23,211 | 5.5% |
| Apache | 15 | 0.0% |
| Arab | 8,427 | 2.0% |
| Argentinean | 284 | 0.1% |
| Armenian | 1,152 | 0.3% |
| Assyrian / Chaldean / Syriac | 88 | 0.0% |
| Australian | 520 | 0.1% |
| Austrian | 1,146 | 0.3% |
| Bahamian | 12 | 0.0% |
| Barbadian | 6 | 0.0% |
| Belgian | 245 | 0.1% |
| Belizean | 1 | 0.0% |
| Bhutanese | 2,646 | 0.6% |
| Blackfeet | 55 | 0.0% |
| Bolivian | 4,398 | 1.1% |
| Brazilian | 574 | 0.1% |
| British | 3,999 | 0.9% |
| British West Indian | 18 | 0.0% |
| Bulgarian | 215 | 0.1% |
| Burmese | 7,390 | 1.8% |
| Cajun | 50 | 0.0% |
| Cambodian | 191 | 0.1% |
| Canadian | 638 | 0.2% |
| Cape Verdean | 66 | 0.0% |
| Carpatho Rusyn | 12 | 0.0% |
| Celtic | 54 | 0.0% |
| Central American | 22,797 | 5.4% |
| Central American Indian | 495 | 0.1% |
| Cherokee | 655 | 0.2% |
| Chickasaw | 26 | 0.0% |
| Chilean | 747 | 0.2% |
| Chinese | 62 | 0.0% |
| Chippewa | 51 | 0.0% |
| Choctaw | 59 | 0.0% |
| Colombian | 1,958 | 0.5% |
| Comanche | 12 | 0.0% |
| Costa Rican | 309 | 0.1% |
| Creek | 50 | 0.0% |
| Croatian | 411 | 0.1% |
| Cuban | 1,429 | 0.3% |
| Cypriot | 8 | 0.0% |
| Czech | 1,673 | 0.4% |
| Czechoslovakian | 138 | 0.0% |
| Danish | 946 | 0.2% |
| Delaware | 7 | 0.0% |
| Dominican | 1,059 | 0.3% |
| Dutch | 2,828 | 0.7% |
| Dutch West Indian | 14 | 0.0% |
| Eastern European | 1,439 | 0.3% |
| Ecuadorian | 981 | 0.2% |
| Egyptian | 1,671 | 0.4% |
| English | 39,503 | 9.4% |
| Estonian | 120 | 0.0% |
| Ethiopian | 1,018 | 0.2% |
| European | 13,942 | 3.3% |
| Fijian | 11 | 0.0% |
| Filipino | 652 | 0.2% |
| Finnish | 260 | 0.1% |
| French | 6,267 | 1.5% |
| French American Indian | 44 | 0.0% |
| French Canadian | 1,446 | 0.3% |
| German | 43,053 | 10.2% |
| Ghanaian | 514 | 0.1% |
| Greek | 2,225 | 0.5% |
| Guamanian / Chamorro | 229 | 0.1% |
| Guatemalan | 2,307 | 0.5% |
| Guyanese | 146 | 0.0% |
| Haitian | 280 | 0.1% |
| Honduran | 3,785 | 0.9% |
| Hungarian | 1,810 | 0.4% |
| Icelander | 92 | 0.0% |
| Indian (Asian) | 8,366 | 2.0% |
| Indonesian | 296 | 0.1% |
| Inupiat | 42 | 0.0% |
| Iranian | 3,938 | 0.9% |
| Iraqi | 1,162 | 0.3% |
| Irish | 41,771 | 9.9% |
| Iroquois | 154 | 0.0% |
| Israeli | 42 | 0.0% |
| Italian | 24,170 | 5.7% |
| Jamaican | 1,113 | 0.3% |
| Japanese | 758 | 0.2% |
| Jordanian | 656 | 0.2% |
| Kenyan | 92 | 0.0% |
| Kiowa | 48 | 0.0% |
| Korean | 7,557 | 1.8% |
| Laotian | 250 | 0.1% |
| Latvian | 319 | 0.1% |
| Lebanese | 1,314 | 0.3% |
| Liberian | 84 | 0.0% |
| Lithuanian | 680 | 0.2% |
| Lumbee | 29 | 0.0% |
| Luxembourger | 9 | 0.0% |
| Macedonian | 53 | 0.0% |
| Malaysian | 706 | 0.2% |
| Maltese | 7 | 0.0% |
| Mexican | 7,703 | 1.8% |
| Mexican American Indian | 346 | 0.1% |
| Mongolian | 230 | 0.1% |
| Moroccan | 915 | 0.2% |
| Native Hawaiian | 344 | 0.1% |
| Navajo | 118 | 0.0% |
| New Zealander | 224 | 0.1% |
| Nicaraguan | 948 | 0.2% |
| Nigerian | 990 | 0.2% |
| Northern European | 656 | 0.2% |
| Norwegian | 3,241 | 0.8% |
| Osage | 1 | 0.0% |
| Ottawa | 15 | 0.0% |
| Pakistani | 1,010 | 0.2% |
| Palestinian | 371 | 0.1% |
| Panamanian | 725 | 0.2% |
| Paraguayan | 17 | 0.0% |
| Pennsylvania German | 145 | 0.0% |
| Peruvian | 5,620 | 1.3% |
| Polish | 10,545 | 2.5% |
| Portuguese | 736 | 0.2% |
| Pueblo | 8 | 0.0% |
| Puerto Rican | 5,868 | 1.4% |
| Puget Sound Salish | 7 | 0.0% |
| Romanian | 522 | 0.1% |
| Russian | 3,129 | 0.7% |
| Salvadoran | 14,664 | 3.5% |
| Samoan | 65 | 0.0% |
| Scandinavian | 1,222 | 0.3% |
| Scotch-Irish | 3,706 | 0.9% |
| Scottish | 7,318 | 1.7% |
| Seminole | 28 | 0.0% |
| Serbian | 171 | 0.0% |
| Sierra Leonean | 86 | 0.0% |
| Sioux | 10 | 0.0% |
| Slavic | 267 | 0.1% |
| Slovak | 1,329 | 0.3% |
| Slovene | 85 | 0.0% |
| Somali | 498 | 0.1% |
| South African | 250 | 0.1% |
| South American | 14,719 | 3.5% |
| South American Indian | 430 | 0.1% |
| Spaniard | 769 | 0.2% |
| Spanish | 1,187 | 0.3% |
| Spanish American | 73 | 0.0% |
| Spanish American Indian | 155 | 0.0% |
| Sri Lankan | 7,813 | 1.9% |
| Subsaharan African | 6,947 | 1.7% |
| Sudanese | 327 | 0.1% |
| Swedish | 3,439 | 0.8% |
| Swiss | 893 | 0.2% |
| Syrian | 719 | 0.2% |
| Thai | 47,054 | 11.2% |
| Tongan | 48 | 0.0% |
| Trinidadian and Tobagonian | 472 | 0.1% |
| Turkish | 1,478 | 0.4% |
| U.S. Virgin Islander | 17 | 0.0% |
| Ukrainian | 1,710 | 0.4% |
| Uruguayan | 93 | 0.0% |
| Venezuelan | 610 | 0.1% |
| Vietnamese | 1,089 | 0.3% |
| Welsh | 2,445 | 0.6% |
| West Indian | 516 | 0.1% |
| Yugoslavian | 178 | 0.0% | View All 163 Rows |
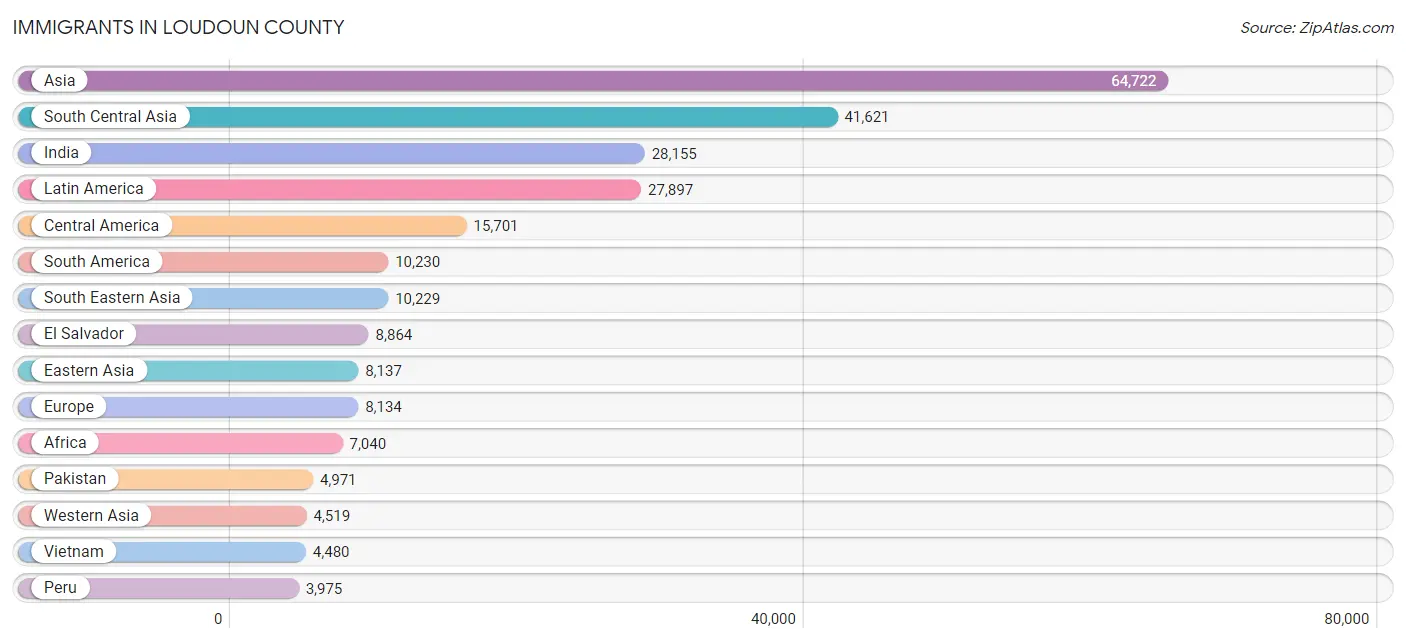
Immigrants in Loudoun County
The most numerous immigrant groups reported in Loudoun County came from Asia (64,722 | 15.4%), South Central Asia (41,621 | 9.9%), India (28,155 | 6.7%), Latin America (27,897 | 6.6%), and Central America (15,701 | 3.7%), together accounting for 42.3% of all Loudoun County residents.
| Immigration Origin | # Population | % Population |
| Afghanistan | 1,661 | 0.4% |
| Africa | 7,040 | 1.7% |
| Albania | 371 | 0.1% |
| Argentina | 199 | 0.1% |
| Armenia | 84 | 0.0% |
| Asia | 64,722 | 15.4% |
| Australia | 194 | 0.1% |
| Austria | 118 | 0.0% |
| Azores | 6 | 0.0% |
| Bangladesh | 1,852 | 0.4% |
| Barbados | 53 | 0.0% |
| Belarus | 67 | 0.0% |
| Belgium | 39 | 0.0% |
| Belize | 1 | 0.0% |
| Bolivia | 2,589 | 0.6% |
| Bosnia and Herzegovina | 151 | 0.0% |
| Brazil | 527 | 0.1% |
| Bulgaria | 90 | 0.0% |
| Cabo Verde | 36 | 0.0% |
| Cambodia | 486 | 0.1% |
| Cameroon | 148 | 0.0% |
| Canada | 1,008 | 0.2% |
| Caribbean | 1,966 | 0.5% |
| Central America | 15,701 | 3.7% |
| Chile | 237 | 0.1% |
| China | 3,881 | 0.9% |
| Colombia | 1,336 | 0.3% |
| Congo | 32 | 0.0% |
| Costa Rica | 92 | 0.0% |
| Croatia | 30 | 0.0% |
| Cuba | 372 | 0.1% |
| Czechoslovakia | 131 | 0.0% |
| Denmark | 43 | 0.0% |
| Dominica | 64 | 0.0% |
| Dominican Republic | 346 | 0.1% |
| Eastern Africa | 1,789 | 0.4% |
| Eastern Asia | 8,137 | 1.9% |
| Eastern Europe | 3,245 | 0.8% |
| Ecuador | 371 | 0.1% |
| Egypt | 1,358 | 0.3% |
| El Salvador | 8,864 | 2.1% |
| England | 801 | 0.2% |
| Eritrea | 119 | 0.0% |
| Ethiopia | 971 | 0.2% |
| Europe | 8,134 | 1.9% |
| Fiji | 72 | 0.0% |
| France | 421 | 0.1% |
| Germany | 1,296 | 0.3% |
| Ghana | 621 | 0.2% |
| Greece | 161 | 0.0% |
| Grenada | 8 | 0.0% |
| Guatemala | 1,128 | 0.3% |
| Guyana | 143 | 0.0% |
| Haiti | 103 | 0.0% |
| Honduras | 2,538 | 0.6% |
| Hong Kong | 383 | 0.1% |
| Hungary | 143 | 0.0% |
| India | 28,155 | 6.7% |
| Indonesia | 296 | 0.1% |
| Iran | 2,893 | 0.7% |
| Iraq | 837 | 0.2% |
| Ireland | 309 | 0.1% |
| Israel | 135 | 0.0% |
| Italy | 468 | 0.1% |
| Jamaica | 428 | 0.1% |
| Japan | 564 | 0.1% |
| Jordan | 270 | 0.1% |
| Kazakhstan | 53 | 0.0% |
| Kenya | 175 | 0.0% |
| Korea | 3,579 | 0.9% |
| Kuwait | 222 | 0.1% |
| Laos | 363 | 0.1% |
| Latin America | 27,897 | 6.6% |
| Latvia | 287 | 0.1% |
| Lebanon | 565 | 0.1% |
| Liberia | 102 | 0.0% |
| Lithuania | 81 | 0.0% |
| Malaysia | 196 | 0.1% |
| Mexico | 2,324 | 0.5% |
| Middle Africa | 467 | 0.1% |
| Moldova | 127 | 0.0% |
| Morocco | 336 | 0.1% |
| Nepal | 1,416 | 0.3% |
| Netherlands | 169 | 0.0% |
| Nicaragua | 545 | 0.1% |
| Nigeria | 755 | 0.2% |
| North Macedonia | 60 | 0.0% |
| Northern Africa | 2,268 | 0.5% |
| Northern Europe | 1,924 | 0.5% |
| Oceania | 358 | 0.1% |
| Pakistan | 4,971 | 1.2% |
| Panama | 204 | 0.1% |
| Peru | 3,975 | 0.9% |
| Philippines | 3,348 | 0.8% |
| Poland | 381 | 0.1% |
| Portugal | 54 | 0.0% |
| Romania | 158 | 0.0% |
| Russia | 633 | 0.2% |
| Saudi Arabia | 213 | 0.1% |
| Scotland | 81 | 0.0% |
| Senegal | 108 | 0.0% |
| Serbia | 45 | 0.0% |
| Sierra Leone | 223 | 0.1% |
| Singapore | 17 | 0.0% |
| Somalia | 324 | 0.1% |
| South Africa | 294 | 0.1% |
| South America | 10,230 | 2.4% |
| South Central Asia | 41,621 | 9.9% |
| South Eastern Asia | 10,229 | 2.4% |
| Southern Europe | 833 | 0.2% |
| Spain | 150 | 0.0% |
| Sri Lanka | 330 | 0.1% |
| Sudan | 272 | 0.1% |
| Sweden | 53 | 0.0% |
| Switzerland | 89 | 0.0% |
| Syria | 632 | 0.2% |
| Taiwan | 617 | 0.2% |
| Thailand | 763 | 0.2% |
| Trinidad and Tobago | 472 | 0.1% |
| Turkey | 929 | 0.2% |
| Uganda | 66 | 0.0% |
| Ukraine | 312 | 0.1% |
| Uruguay | 54 | 0.0% |
| Uzbekistan | 48 | 0.0% |
| Venezuela | 730 | 0.2% |
| Vietnam | 4,480 | 1.1% |
| West Indies | 82 | 0.0% |
| Western Africa | 2,202 | 0.5% |
| Western Asia | 4,519 | 1.1% |
| Western Europe | 2,132 | 0.5% |
| Yemen | 153 | 0.0% |
| Zaire | 176 | 0.0% |
| Zimbabwe | 33 | 0.0% | View All 133 Rows |
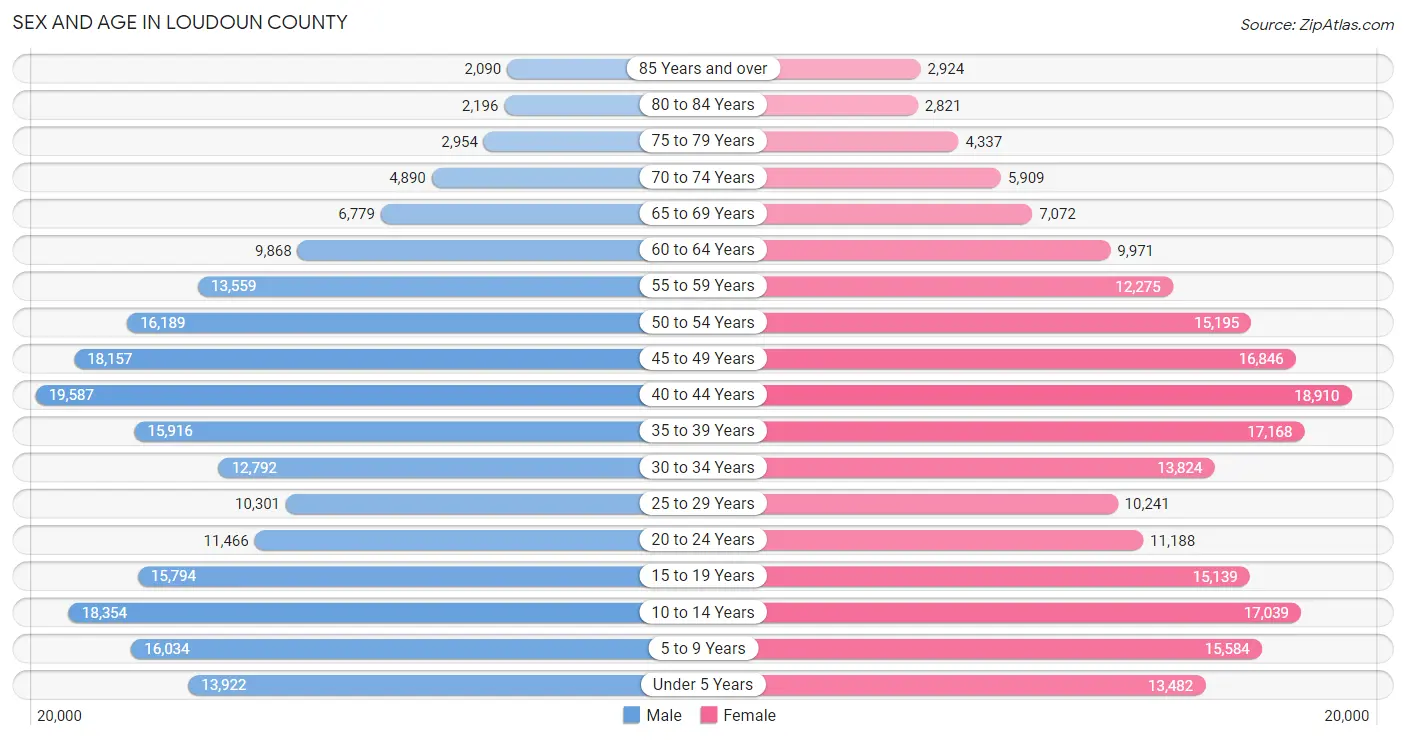
Sex and Age in Loudoun County
Sex and Age in Loudoun County
The most populous age groups in Loudoun County are 40 to 44 Years (19,587 | 9.3%) for men and 40 to 44 Years (18,910 | 9.0%) for women.
| Age Bracket | Male | Female |
| Under 5 Years | 13,922 (6.6%) | 13,482 (6.4%) |
| 5 to 9 Years | 16,034 (7.6%) | 15,584 (7.4%) |
| 10 to 14 Years | 18,354 (8.7%) | 17,039 (8.1%) |
| 15 to 19 Years | 15,794 (7.5%) | 15,139 (7.2%) |
| 20 to 24 Years | 11,466 (5.4%) | 11,188 (5.3%) |
| 25 to 29 Years | 10,301 (4.9%) | 10,241 (4.9%) |
| 30 to 34 Years | 12,792 (6.1%) | 13,824 (6.6%) |
| 35 to 39 Years | 15,916 (7.5%) | 17,168 (8.2%) |
| 40 to 44 Years | 19,587 (9.3%) | 18,910 (9.0%) |
| 45 to 49 Years | 18,157 (8.6%) | 16,846 (8.0%) |
| 50 to 54 Years | 16,189 (7.7%) | 15,195 (7.2%) |
| 55 to 59 Years | 13,559 (6.4%) | 12,275 (5.9%) |
| 60 to 64 Years | 9,868 (4.7%) | 9,971 (4.8%) |
| 65 to 69 Years | 6,779 (3.2%) | 7,072 (3.4%) |
| 70 to 74 Years | 4,890 (2.3%) | 5,909 (2.8%) |
| 75 to 79 Years | 2,954 (1.4%) | 4,337 (2.1%) |
| 80 to 84 Years | 2,196 (1.0%) | 2,821 (1.3%) |
| 85 Years and over | 2,090 (1.0%) | 2,924 (1.4%) |
| Total | 210,848 (100.0%) | 209,925 (100.0%) |
Families and Households in Loudoun County
Median Family Size in Loudoun County
The median family size in Loudoun County is 3.42 persons per family, with married-couple families (93,320 | 85.7%) accounting for the largest median family size of 3.47 persons per family. On the other hand, single male/father families (5,206 | 4.8%) represent the smallest median family size with 2.86 persons per family.
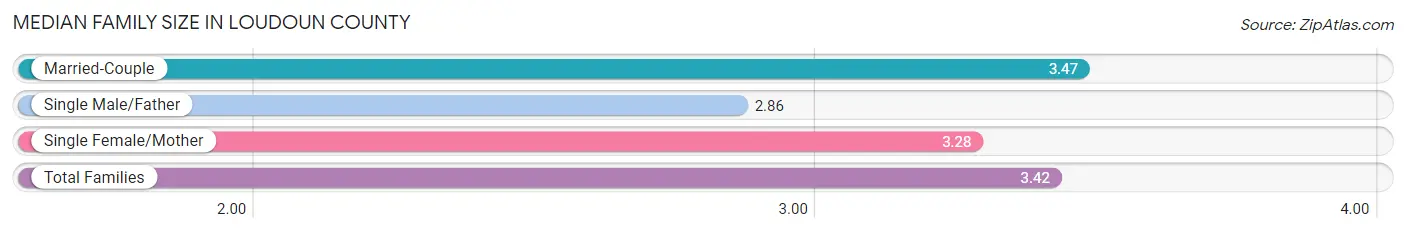
| Family Type | # Families | Family Size |
| Married-Couple | 93,320 (85.7%) | 3.47 |
| Single Male/Father | 5,206 (4.8%) | 2.86 |
| Single Female/Mother | 10,391 (9.5%) | 3.28 |
| Total Families | 108,917 (100.0%) | 3.42 |
Median Household Size in Loudoun County
The median household size in Loudoun County is 3.02 persons per household, with single female/mother households (10,391 | 7.5%) accounting for the largest median household size of 3.52 persons per household. non-family households (29,632 | 21.4%) represent the smallest median household size with 1.32 persons per household.
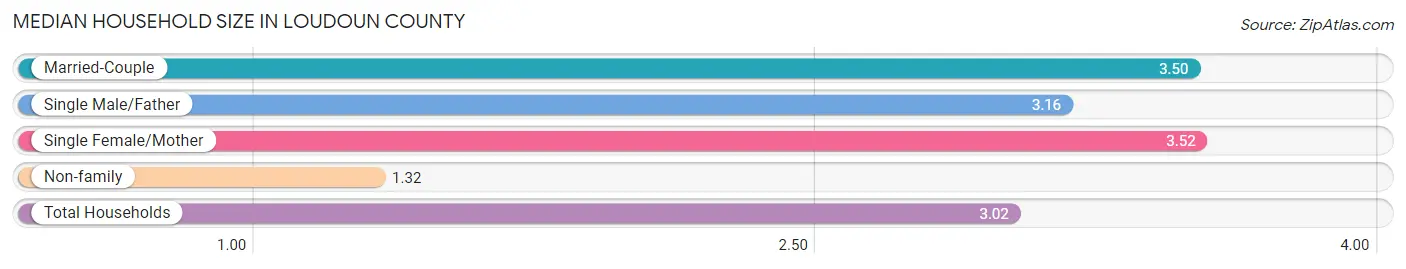
| Household Type | # Households | Household Size |
| Married-Couple | 93,320 (67.4%) | 3.50 |
| Single Male/Father | 5,206 (3.8%) | 3.16 |
| Single Female/Mother | 10,391 (7.5%) | 3.52 |
| Non-family | 29,632 (21.4%) | 1.32 |
| Total Households | 138,549 (100.0%) | 3.02 |
Household Size by Marriage Status in Loudoun County
Out of a total of 138,549 households in Loudoun County, 108,917 (78.6%) are family households, while 29,632 (21.4%) are nonfamily households. The most numerous type of family households are 2-person households, comprising 32,740, and the most common type of nonfamily households are 1-person households, comprising 22,969.
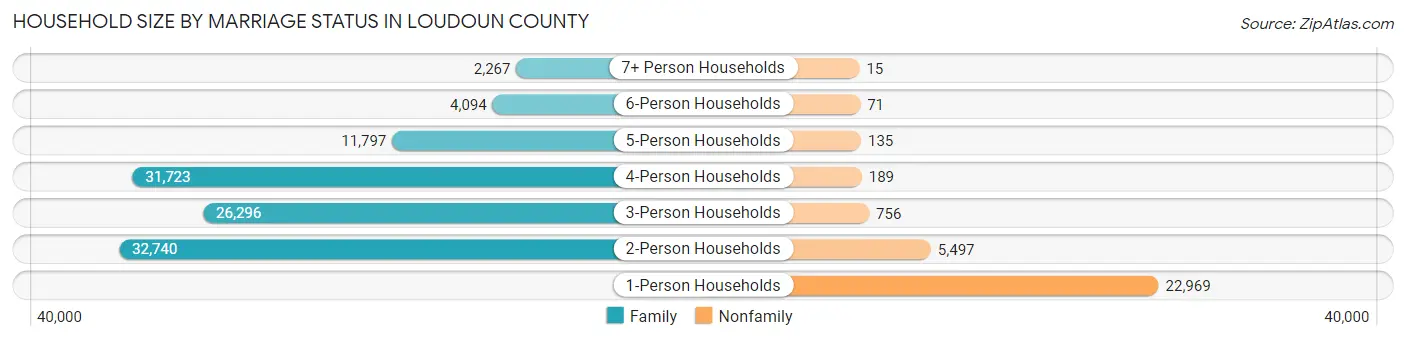
| Household Size | Family Households | Nonfamily Households |
| 1-Person Households | - | 22,969 (16.6%) |
| 2-Person Households | 32,740 (23.6%) | 5,497 (4.0%) |
| 3-Person Households | 26,296 (19.0%) | 756 (0.5%) |
| 4-Person Households | 31,723 (22.9%) | 189 (0.1%) |
| 5-Person Households | 11,797 (8.5%) | 135 (0.1%) |
| 6-Person Households | 4,094 (2.9%) | 71 (0.1%) |
| 7+ Person Households | 2,267 (1.6%) | 15 (0.0%) |
| Total | 108,917 (78.6%) | 29,632 (21.4%) |
Female Fertility in Loudoun County
Fertility by Age in Loudoun County
Average fertility rate in Loudoun County is 47.0 births per 1,000 women. Women in the age bracket of 20 to 34 years have the highest fertility rate with 82.0 births per 1,000 women. Women in the age bracket of 20 to 34 years acount for 57.7% of all women with births.
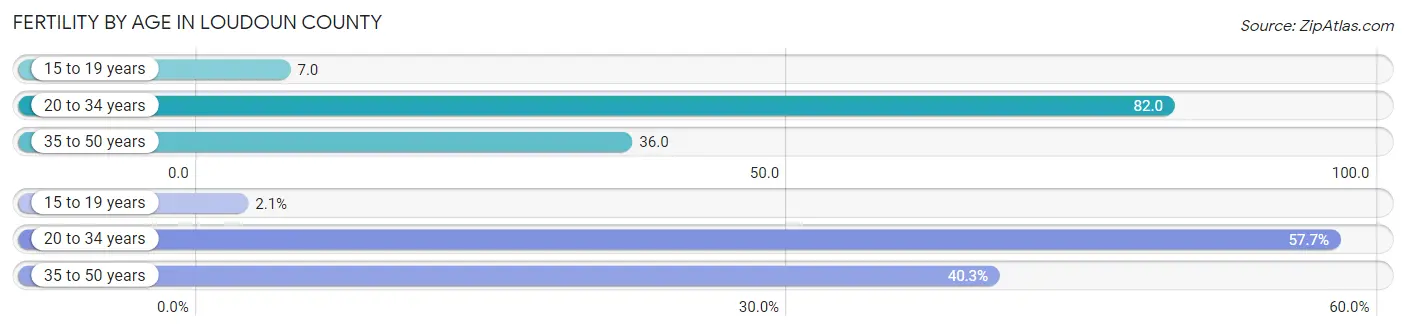
| Age Bracket | Women with Births | Births / 1,000 Women |
| 15 to 19 years | 103 (2.1%) | 7.0 |
| 20 to 34 years | 2,898 (57.7%) | 82.0 |
| 35 to 50 years | 2,026 (40.3%) | 36.0 |
| Total | 5,027 (100.0%) | 47.0 |
Fertility by Age by Marriage Status in Loudoun County
87.0% of women with births (5,027) in Loudoun County are married. The highest percentage of unmarried women with births falls into 15 to 19 years age bracket with 100.0% of them unmarried at the time of birth, while the lowest percentage of unmarried women with births belong to 35 to 50 years age bracket with 5.9% of them unmarried.
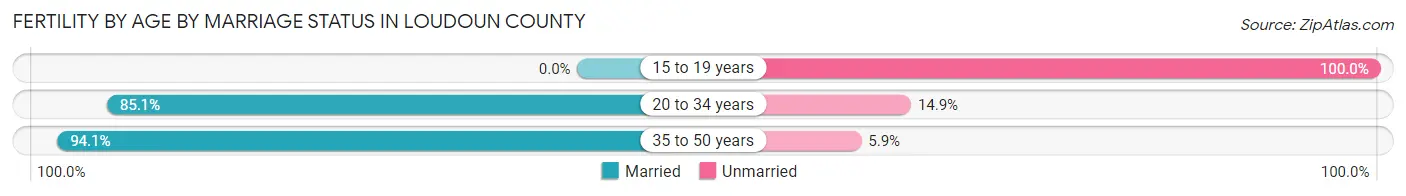
| Age Bracket | Married | Unmarried |
| 15 to 19 years | 0 (0.0%) | 103 (100.0%) |
| 20 to 34 years | 2,466 (85.1%) | 432 (14.9%) |
| 35 to 50 years | 1,906 (94.1%) | 120 (5.9%) |
| Total | 4,373 (87.0%) | 654 (13.0%) |
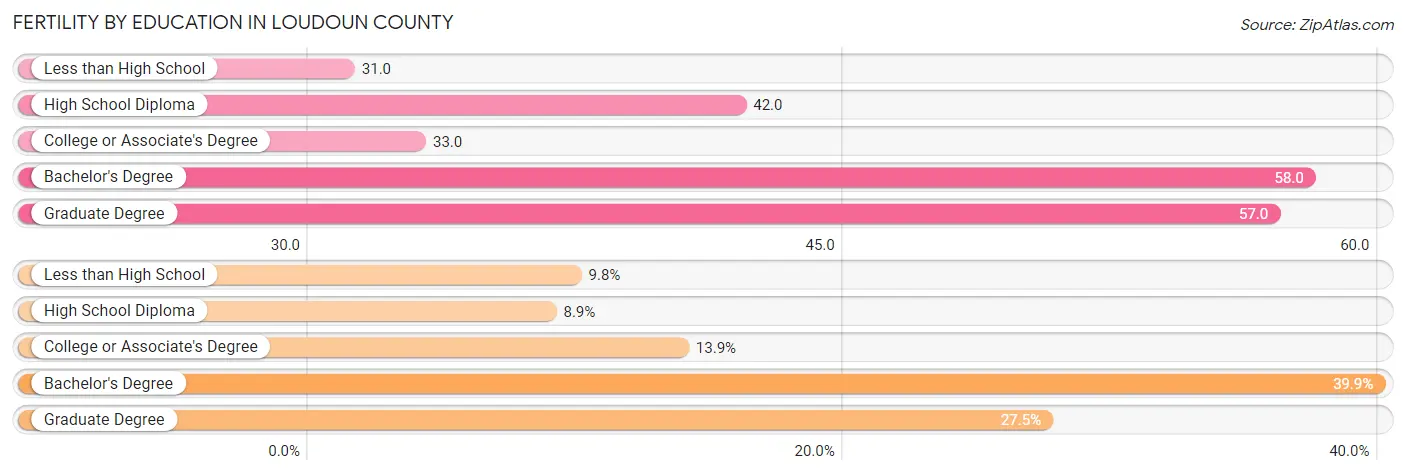
Fertility by Education in Loudoun County
Average fertility rate in Loudoun County is 47.0 births per 1,000 women. Women with the education attainment of bachelor's degree have the highest fertility rate of 58.0 births per 1,000 women, while women with the education attainment of less than high school have the lowest fertility at 31.0 births per 1,000 women. Women with the education attainment of bachelor's degree represent 39.9% of all women with births.
| Educational Attainment | Women with Births | Births / 1,000 Women |
| Less than High School | 494 (9.8%) | 31.0 |
| High School Diploma | 447 (8.9%) | 42.0 |
| College or Associate's Degree | 696 (13.9%) | 33.0 |
| Bachelor's Degree | 2,008 (39.9%) | 58.0 |
| Graduate Degree | 1,382 (27.5%) | 57.0 |
| Total | 5,027 (100.0%) | 47.0 |
Fertility by Education by Marriage Status in Loudoun County
13.0% of women with births in Loudoun County are unmarried. Women with the educational attainment of graduate degree are most likely to be married with 98.3% of them married at childbirth, while women with the educational attainment of less than high school are least likely to be married with 53.2% of them unmarried at childbirth.
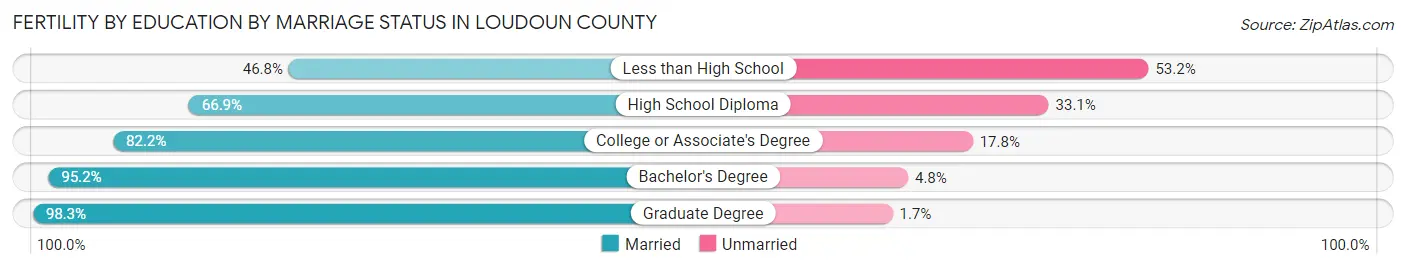
| Educational Attainment | Married | Unmarried |
| Less than High School | 231 (46.8%) | 263 (53.2%) |
| High School Diploma | 299 (66.9%) | 148 (33.1%) |
| College or Associate's Degree | 572 (82.2%) | 124 (17.8%) |
| Bachelor's Degree | 1,912 (95.2%) | 96 (4.8%) |
| Graduate Degree | 1,359 (98.3%) | 23 (1.7%) |
| Total | 4,373 (87.0%) | 654 (13.0%) |
Employment Characteristics in Loudoun County
Employment by Class of Employer in Loudoun County
Among the 226,387 employed individuals in Loudoun County, private company employees (150,195 | 66.3%), federal government employees (20,702 | 9.1%), and not-for-profit organizations (17,022 | 7.5%) make up the most common classes of employment.
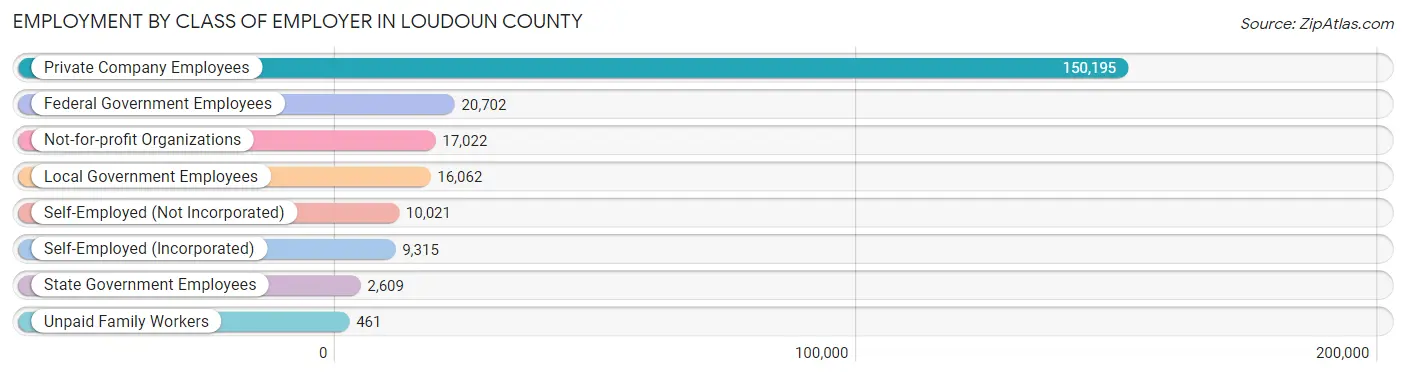
| Employer Class | # Employees | % Employees |
| Private Company Employees | 150,195 | 66.3% |
| Self-Employed (Incorporated) | 9,315 | 4.1% |
| Self-Employed (Not Incorporated) | 10,021 | 4.4% |
| Not-for-profit Organizations | 17,022 | 7.5% |
| Local Government Employees | 16,062 | 7.1% |
| State Government Employees | 2,609 | 1.1% |
| Federal Government Employees | 20,702 | 9.1% |
| Unpaid Family Workers | 461 | 0.2% |
| Total | 226,387 | 100.0% |
Employment Status by Age in Loudoun County
According to the labor force statistics for Loudoun County, out of the total population over 16 years of age (320,082), 74.3% or 237,821 individuals are in the labor force, with 3.2% or 7,610 of them unemployed. The age group with the highest labor force participation rate is 45 to 54 years, with 89.2% or 59,217 individuals in the labor force. Within the labor force, the 20 to 24 years age range has the highest percentage of unemployed individuals, with 8.3% or 1,425 of them being unemployed.

| Age Bracket | In Labor Force | Unemployed |
| 16 to 19 Years | 9,715 (39.4%) | 738 (7.6%) |
| 20 to 24 Years | 17,172 (75.8%) | 1,425 (8.3%) |
| 25 to 29 Years | 18,262 (88.9%) | 621 (3.4%) |
| 30 to 34 Years | 23,236 (87.3%) | 674 (2.9%) |
| 35 to 44 Years | 62,920 (87.9%) | 1,195 (1.9%) |
| 45 to 54 Years | 59,217 (89.2%) | 1,717 (2.9%) |
| 55 to 59 Years | 21,985 (85.1%) | 506 (2.3%) |
| 60 to 64 Years | 14,602 (73.6%) | 467 (3.2%) |
| 65 to 74 Years | 9,219 (37.4%) | 258 (2.8%) |
| 75 Years and over | 1,438 (8.3%) | 45 (3.1%) |
| Total | 237,821 (74.3%) | 7,610 (3.2%) |
Employment Status by Educational Attainment in Loudoun County
According to labor force statistics for Loudoun County, 86.8% of individuals (200,334) out of the total population between 25 and 64 years of age (230,799) are in the labor force, with 2.6% or 5,209 of them being unemployed. The group with the highest labor force participation rate are those with the educational attainment of bachelor's degree or higher, with 89.8% or 136,414 individuals in the labor force. Within the labor force, individuals with less than high school education have the highest percentage of unemployment, with 6.4% or 545 of them being unemployed.
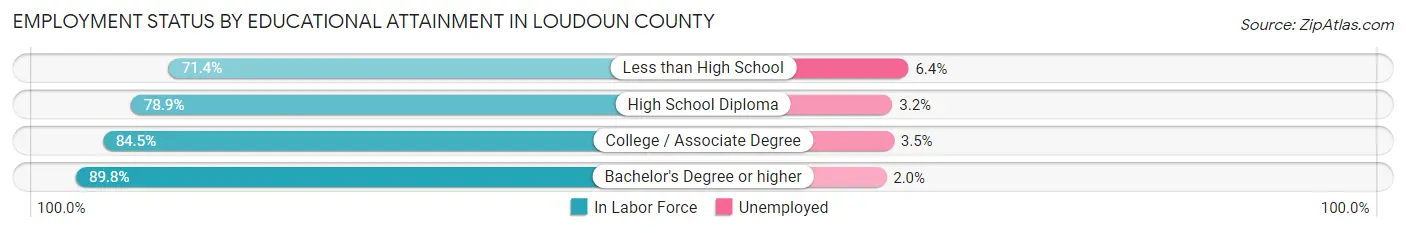
| Educational Attainment | In Labor Force | Unemployed |
| Less than High School | 8,514 (71.4%) | 763 (6.4%) |
| High School Diploma | 17,625 (78.9%) | 715 (3.2%) |
| College / Associate Degree | 37,710 (84.5%) | 1,562 (3.5%) |
| Bachelor's Degree or higher | 136,414 (89.8%) | 3,038 (2.0%) |
| Total | 200,334 (86.8%) | 6,001 (2.6%) |
Employment Occupations by Sex in Loudoun County
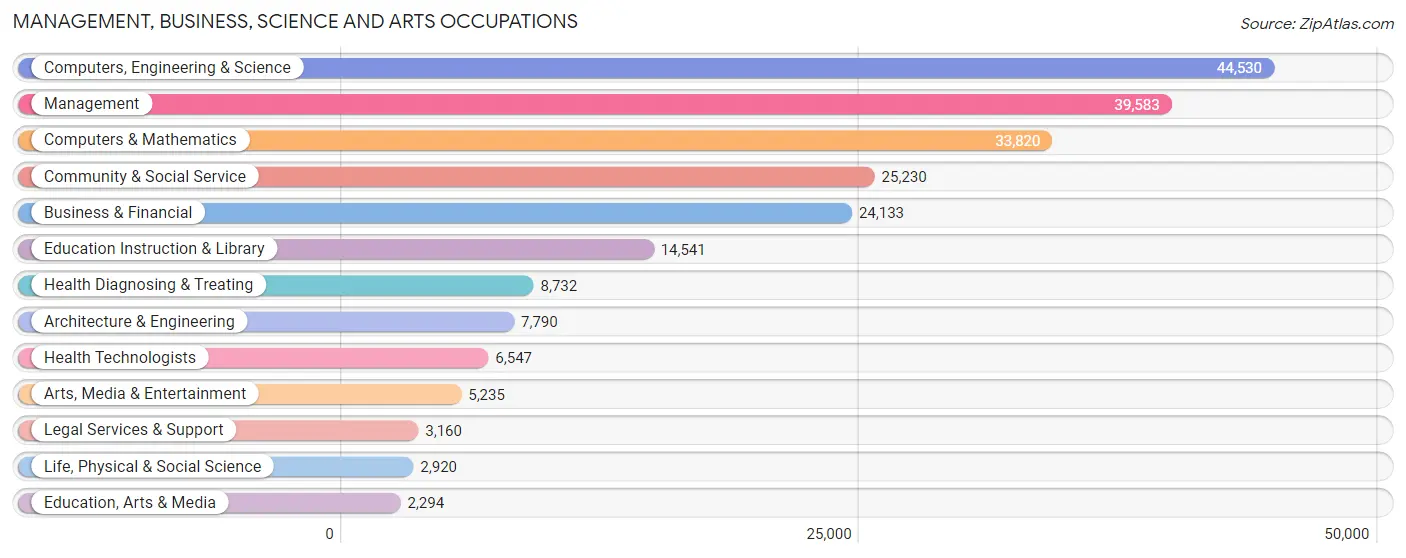
Management, Business, Science and Arts Occupations
The most common Management, Business, Science and Arts occupations in Loudoun County are Computers, Engineering & Science (44,530 | 19.5%), Management (39,583 | 17.3%), Computers & Mathematics (33,820 | 14.8%), Community & Social Service (25,230 | 11.0%), and Business & Financial (24,133 | 10.5%).
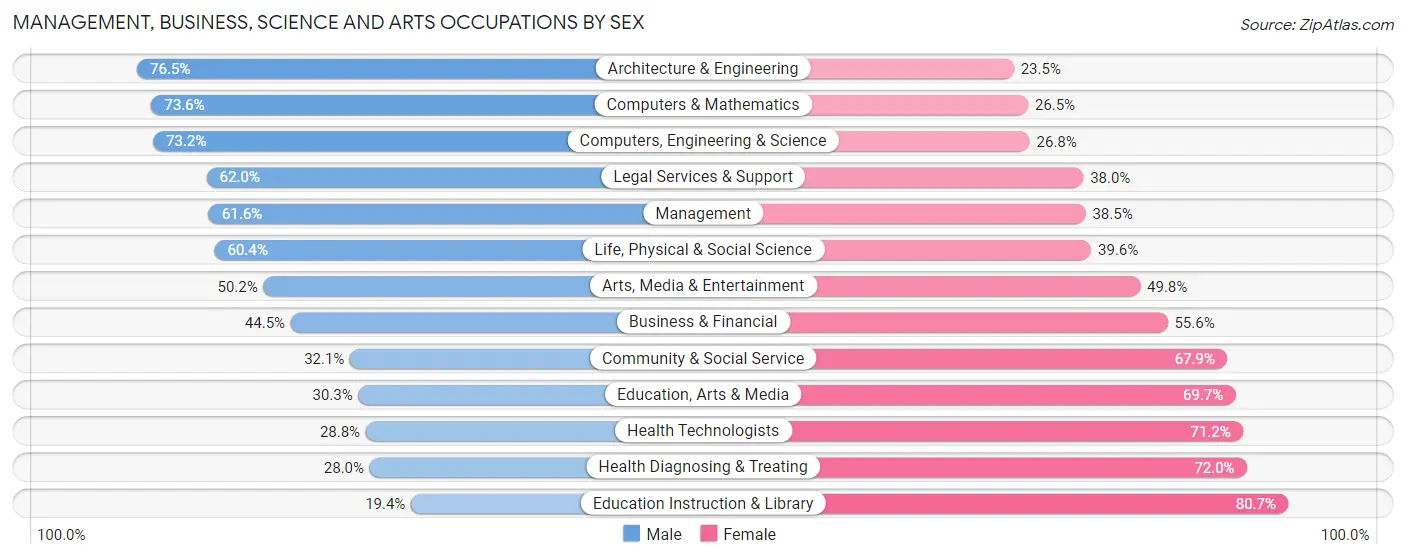
Management, Business, Science and Arts Occupations by Sex
Within the Management, Business, Science and Arts occupations in Loudoun County, the most male-oriented occupations are Architecture & Engineering (76.5%), Computers & Mathematics (73.6%), and Computers, Engineering & Science (73.2%), while the most female-oriented occupations are Education Instruction & Library (80.6%), Health Diagnosing & Treating (72.0%), and Health Technologists (71.2%).
| Occupation | Male | Female |
| Management | 24,365 (61.6%) | 15,218 (38.5%) |
| Business & Financial | 10,727 (44.5%) | 13,406 (55.5%) |
| Computers, Engineering & Science | 32,599 (73.2%) | 11,931 (26.8%) |
| Computers & Mathematics | 24,874 (73.6%) | 8,946 (26.5%) |
| Architecture & Engineering | 5,962 (76.5%) | 1,828 (23.5%) |
| Life, Physical & Social Science | 1,763 (60.4%) | 1,157 (39.6%) |
| Community & Social Service | 8,095 (32.1%) | 17,135 (67.9%) |
| Education, Arts & Media | 696 (30.3%) | 1,598 (69.7%) |
| Legal Services & Support | 1,960 (62.0%) | 1,200 (38.0%) |
| Education Instruction & Library | 2,813 (19.4%) | 11,728 (80.6%) |
| Arts, Media & Entertainment | 2,626 (50.2%) | 2,609 (49.8%) |
| Health Diagnosing & Treating | 2,443 (28.0%) | 6,289 (72.0%) |
| Health Technologists | 1,885 (28.8%) | 4,662 (71.2%) |
| Total (Category) | 78,229 (55.0%) | 63,979 (45.0%) |
| Total (Overall) | 125,383 (54.8%) | 103,452 (45.2%) |
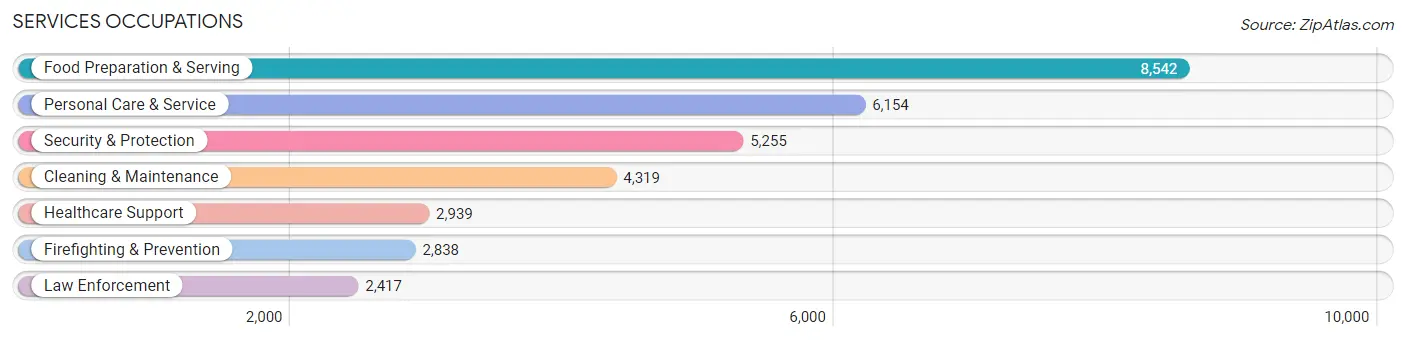
Services Occupations
The most common Services occupations in Loudoun County are Food Preparation & Serving (8,542 | 3.7%), Personal Care & Service (6,154 | 2.7%), Security & Protection (5,255 | 2.3%), Cleaning & Maintenance (4,319 | 1.9%), and Healthcare Support (2,939 | 1.3%).
Services Occupations by Sex
Within the Services occupations in Loudoun County, the most male-oriented occupations are Law Enforcement (88.5%), Security & Protection (78.3%), and Firefighting & Prevention (69.6%), while the most female-oriented occupations are Personal Care & Service (82.6%), Healthcare Support (78.1%), and Food Preparation & Serving (51.0%).
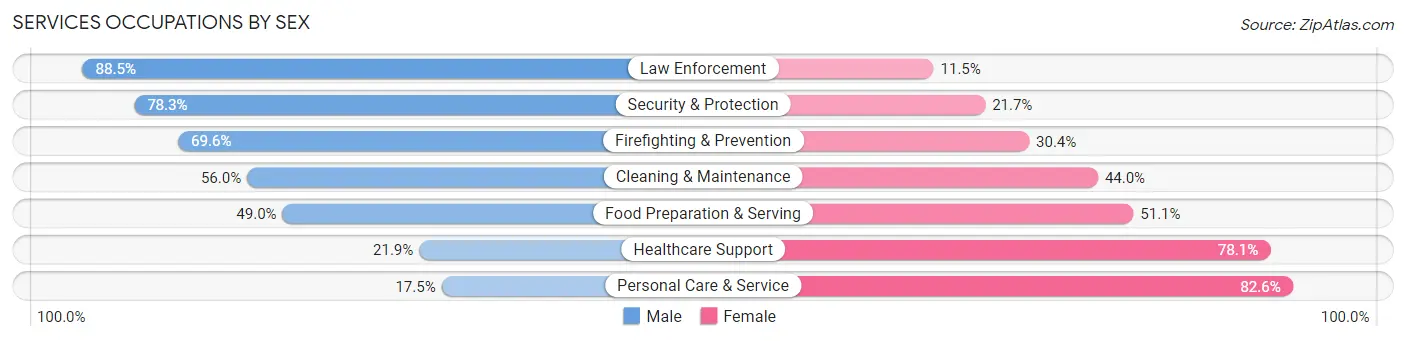
| Occupation | Male | Female |
| Healthcare Support | 643 (21.9%) | 2,296 (78.1%) |
| Security & Protection | 4,114 (78.3%) | 1,141 (21.7%) |
| Firefighting & Prevention | 1,975 (69.6%) | 863 (30.4%) |
| Law Enforcement | 2,139 (88.5%) | 278 (11.5%) |
| Food Preparation & Serving | 4,181 (48.9%) | 4,361 (51.0%) |
| Cleaning & Maintenance | 2,417 (56.0%) | 1,902 (44.0%) |
| Personal Care & Service | 1,074 (17.4%) | 5,080 (82.6%) |
| Total (Category) | 12,429 (45.7%) | 14,780 (54.3%) |
| Total (Overall) | 125,383 (54.8%) | 103,452 (45.2%) |
Sales and Office Occupations
The most common Sales and Office occupations in Loudoun County are Sales & Related (18,986 | 8.3%), and Office & Administration (18,851 | 8.2%).

Sales and Office Occupations by Sex

| Occupation | Male | Female |
| Sales & Related | 10,688 (56.3%) | 8,298 (43.7%) |
| Office & Administration | 5,997 (31.8%) | 12,854 (68.2%) |
| Total (Category) | 16,685 (44.1%) | 21,152 (55.9%) |
| Total (Overall) | 125,383 (54.8%) | 103,452 (45.2%) |
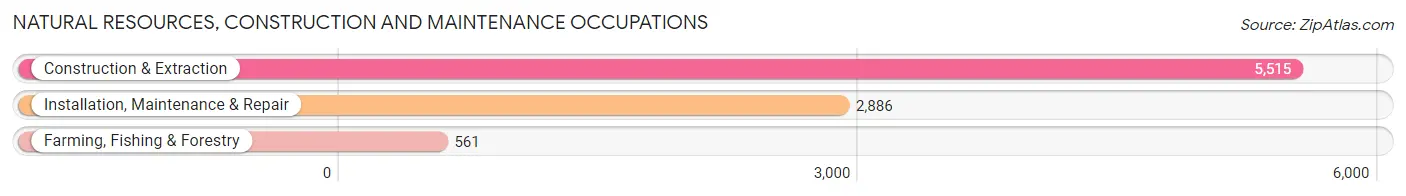
Natural Resources, Construction and Maintenance Occupations
The most common Natural Resources, Construction and Maintenance occupations in Loudoun County are Construction & Extraction (5,515 | 2.4%), Installation, Maintenance & Repair (2,886 | 1.3%), and Farming, Fishing & Forestry (561 | 0.3%).
Natural Resources, Construction and Maintenance Occupations by Sex
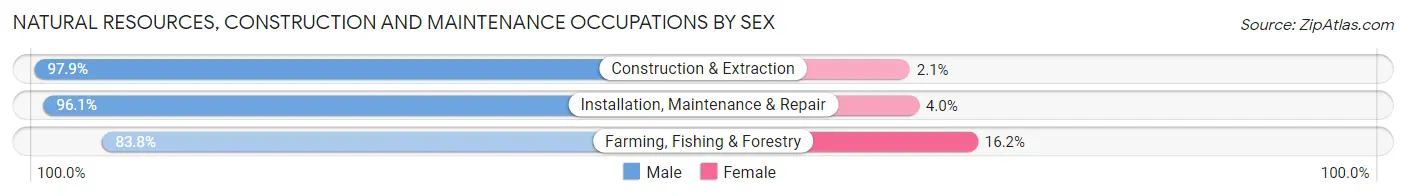
| Occupation | Male | Female |
| Farming, Fishing & Forestry | 470 (83.8%) | 91 (16.2%) |
| Construction & Extraction | 5,401 (97.9%) | 114 (2.1%) |
| Installation, Maintenance & Repair | 2,772 (96.1%) | 114 (4.0%) |
| Total (Category) | 8,643 (96.4%) | 319 (3.6%) |
| Total (Overall) | 125,383 (54.8%) | 103,452 (45.2%) |
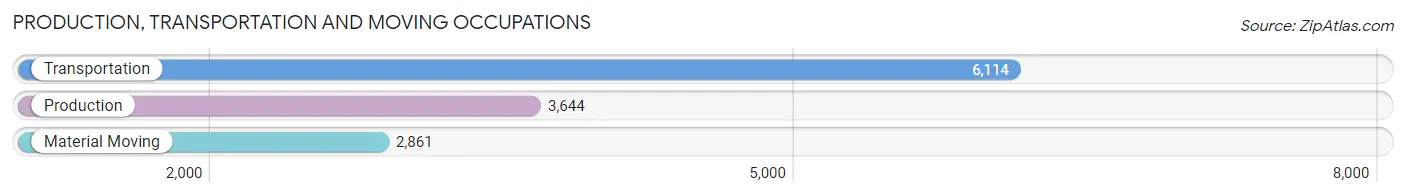
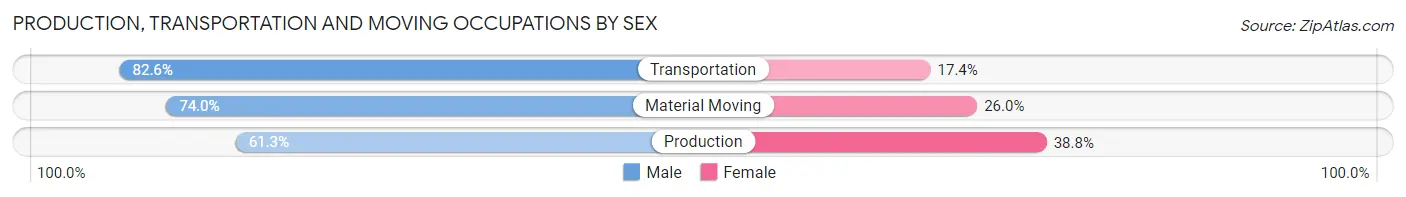
Production, Transportation and Moving Occupations
The most common Production, Transportation and Moving occupations in Loudoun County are Transportation (6,114 | 2.7%), Production (3,644 | 1.6%), and Material Moving (2,861 | 1.3%).
Production, Transportation and Moving Occupations by Sex
| Occupation | Male | Female |
| Production | 2,232 (61.3%) | 1,412 (38.8%) |
| Transportation | 5,048 (82.6%) | 1,066 (17.4%) |
| Material Moving | 2,117 (74.0%) | 744 (26.0%) |
| Total (Category) | 9,397 (74.5%) | 3,222 (25.5%) |
| Total (Overall) | 125,383 (54.8%) | 103,452 (45.2%) |
Employment Industries by Sex in Loudoun County
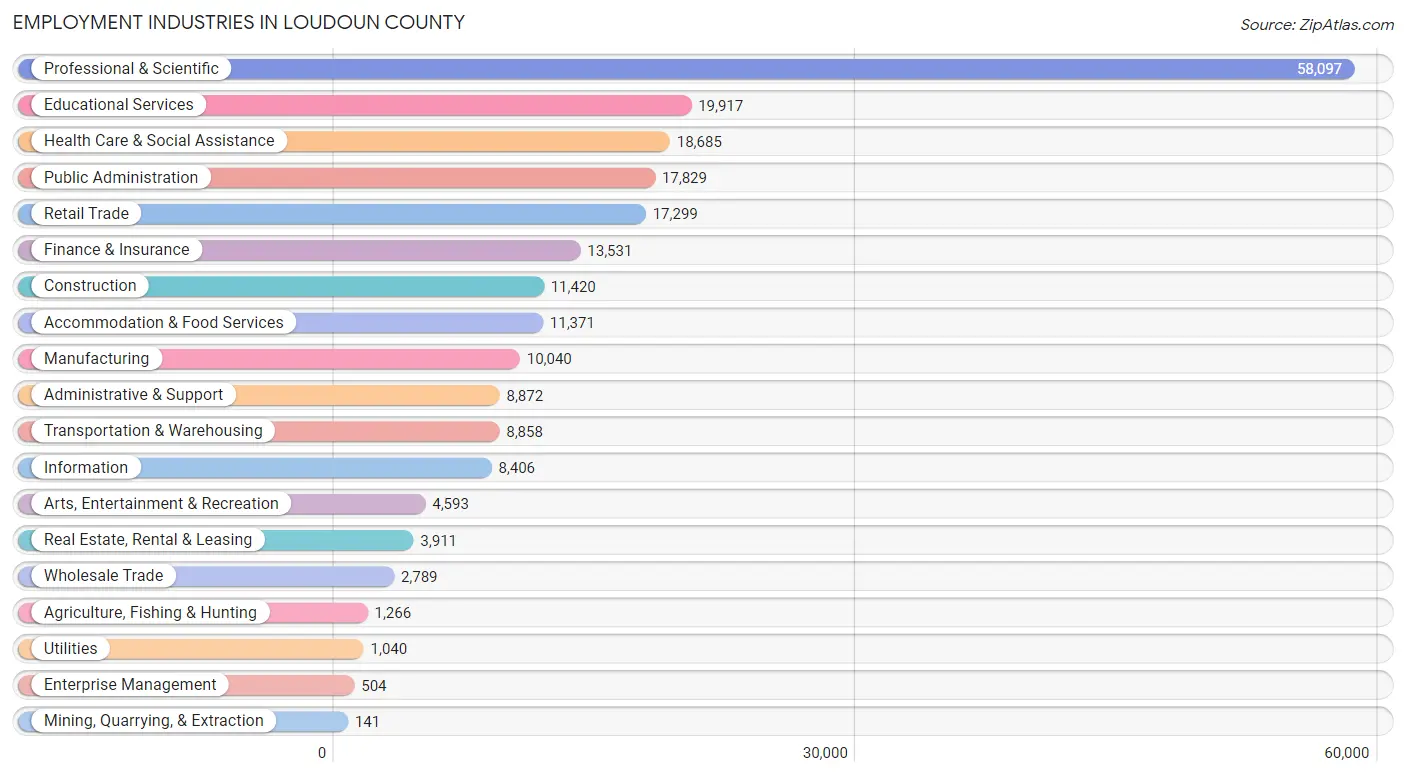
Employment Industries in Loudoun County
The major employment industries in Loudoun County include Professional & Scientific (58,097 | 25.4%), Educational Services (19,917 | 8.7%), Health Care & Social Assistance (18,685 | 8.2%), Public Administration (17,829 | 7.8%), and Retail Trade (17,299 | 7.6%).
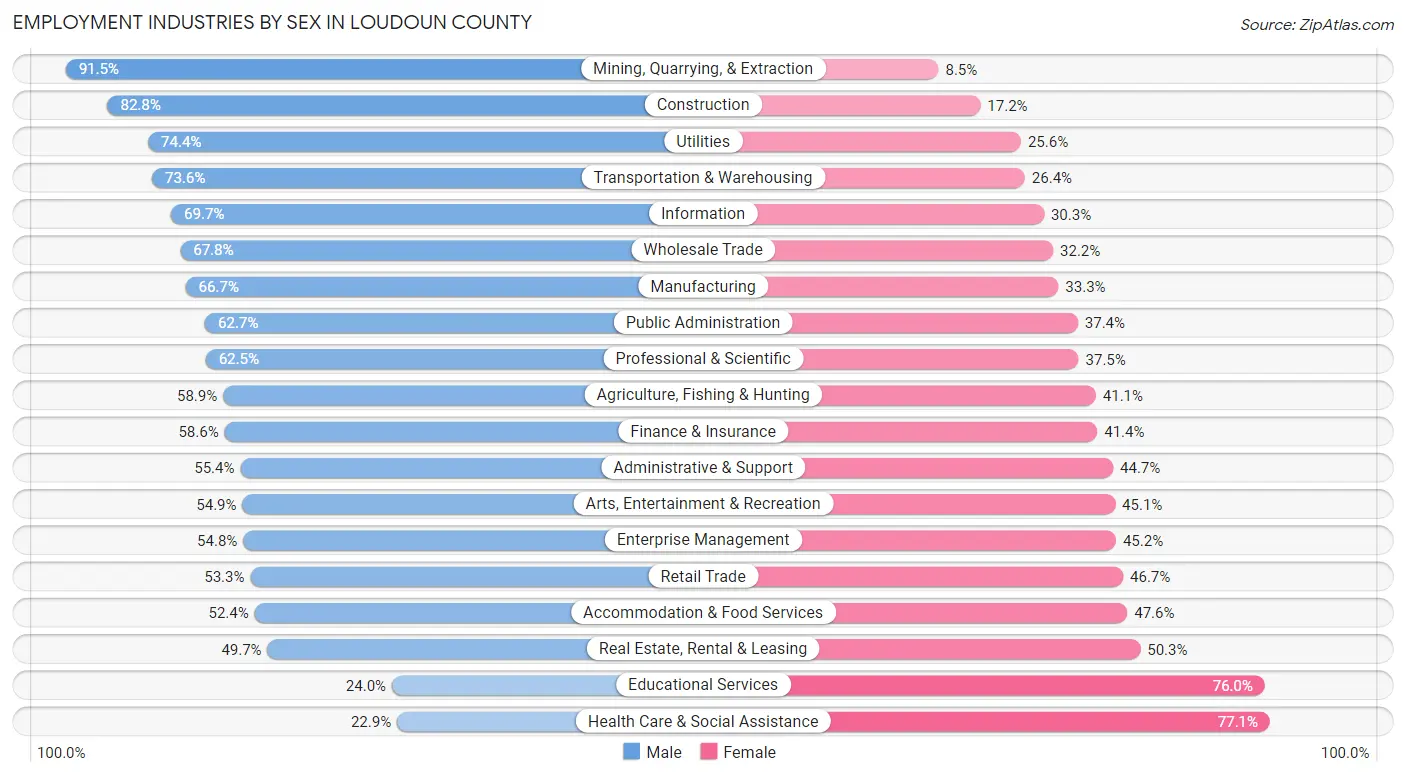
Employment Industries by Sex in Loudoun County
The Loudoun County industries that see more men than women are Mining, Quarrying, & Extraction (91.5%), Construction (82.8%), and Utilities (74.4%), whereas the industries that tend to have a higher number of women are Health Care & Social Assistance (77.1%), Educational Services (76.0%), and Real Estate, Rental & Leasing (50.3%).
| Industry | Male | Female |
| Agriculture, Fishing & Hunting | 746 (58.9%) | 520 (41.1%) |
| Mining, Quarrying, & Extraction | 129 (91.5%) | 12 (8.5%) |
| Construction | 9,458 (82.8%) | 1,962 (17.2%) |
| Manufacturing | 6,695 (66.7%) | 3,345 (33.3%) |
| Wholesale Trade | 1,890 (67.8%) | 899 (32.2%) |
| Retail Trade | 9,218 (53.3%) | 8,081 (46.7%) |
| Transportation & Warehousing | 6,520 (73.6%) | 2,338 (26.4%) |
| Utilities | 774 (74.4%) | 266 (25.6%) |
| Information | 5,856 (69.7%) | 2,550 (30.3%) |
| Finance & Insurance | 7,933 (58.6%) | 5,598 (41.4%) |
| Real Estate, Rental & Leasing | 1,945 (49.7%) | 1,966 (50.3%) |
| Professional & Scientific | 36,313 (62.5%) | 21,784 (37.5%) |
| Enterprise Management | 276 (54.8%) | 228 (45.2%) |
| Administrative & Support | 4,911 (55.3%) | 3,961 (44.7%) |
| Educational Services | 4,774 (24.0%) | 15,143 (76.0%) |
| Health Care & Social Assistance | 4,282 (22.9%) | 14,403 (77.1%) |
| Arts, Entertainment & Recreation | 2,523 (54.9%) | 2,070 (45.1%) |
| Accommodation & Food Services | 5,960 (52.4%) | 5,411 (47.6%) |
| Public Administration | 11,170 (62.6%) | 6,659 (37.3%) |
| Total | 125,383 (54.8%) | 103,452 (45.2%) |
Education in Loudoun County
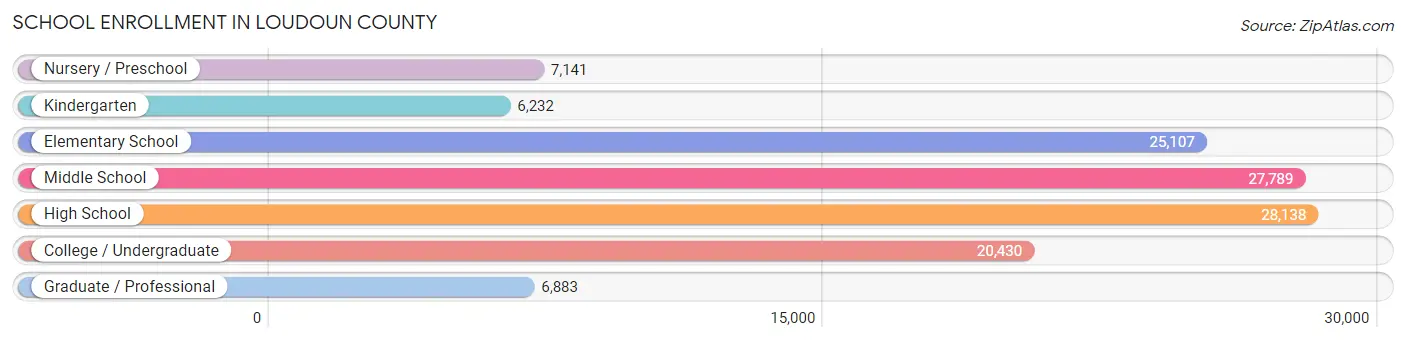
School Enrollment in Loudoun County
The most common levels of schooling among the 121,720 students in Loudoun County are high school (28,138 | 23.1%), middle school (27,789 | 22.8%), and elementary school (25,107 | 20.6%).
| School Level | # Students | % Students |
| Nursery / Preschool | 7,141 | 5.9% |
| Kindergarten | 6,232 | 5.1% |
| Elementary School | 25,107 | 20.6% |
| Middle School | 27,789 | 22.8% |
| High School | 28,138 | 23.1% |
| College / Undergraduate | 20,430 | 16.8% |
| Graduate / Professional | 6,883 | 5.7% |
| Total | 121,720 | 100.0% |
School Enrollment by Age by Funding Source in Loudoun County
Out of a total of 121,720 students who are enrolled in schools in Loudoun County, 20,206 (16.6%) attend a private institution, while the remaining 101,514 (83.4%) are enrolled in public schools. The age group of 3 to 4 year olds has the highest likelihood of being enrolled in private schools, with 3,535 (67.3% in the age bracket) enrolled. Conversely, the age group of 15 to 17 year olds has the lowest likelihood of being enrolled in a private school, with 18,758 (93.6% in the age bracket) attending a public institution.
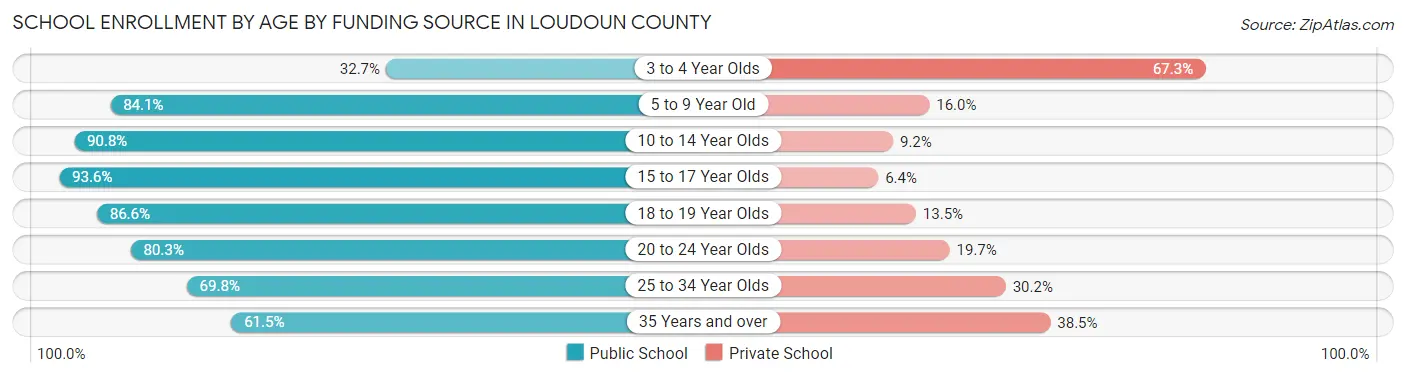
| Age Bracket | Public School | Private School |
| 3 to 4 Year Olds | 1,718 (32.7%) | 3,535 (67.3%) |
| 5 to 9 Year Old | 25,193 (84.1%) | 4,780 (16.0%) |
| 10 to 14 Year Olds | 31,757 (90.8%) | 3,219 (9.2%) |
| 15 to 17 Year Olds | 18,758 (93.6%) | 1,290 (6.4%) |
| 18 to 19 Year Olds | 7,932 (86.6%) | 1,233 (13.5%) |
| 20 to 24 Year Olds | 8,578 (80.3%) | 2,108 (19.7%) |
| 25 to 34 Year Olds | 3,584 (69.8%) | 1,550 (30.2%) |
| 35 Years and over | 3,988 (61.5%) | 2,497 (38.5%) |
| Total | 101,514 (83.4%) | 20,206 (16.6%) |
Educational Attainment by Field of Study in Loudoun County
Business (37,879 | 20.4%), engineering (23,365 | 12.6%), computers & mathematics (19,858 | 10.7%), social sciences (19,370 | 10.4%), and science & technology (12,690 | 6.8%) are the most common fields of study among 185,397 individuals in Loudoun County who have obtained a bachelor's degree or higher.
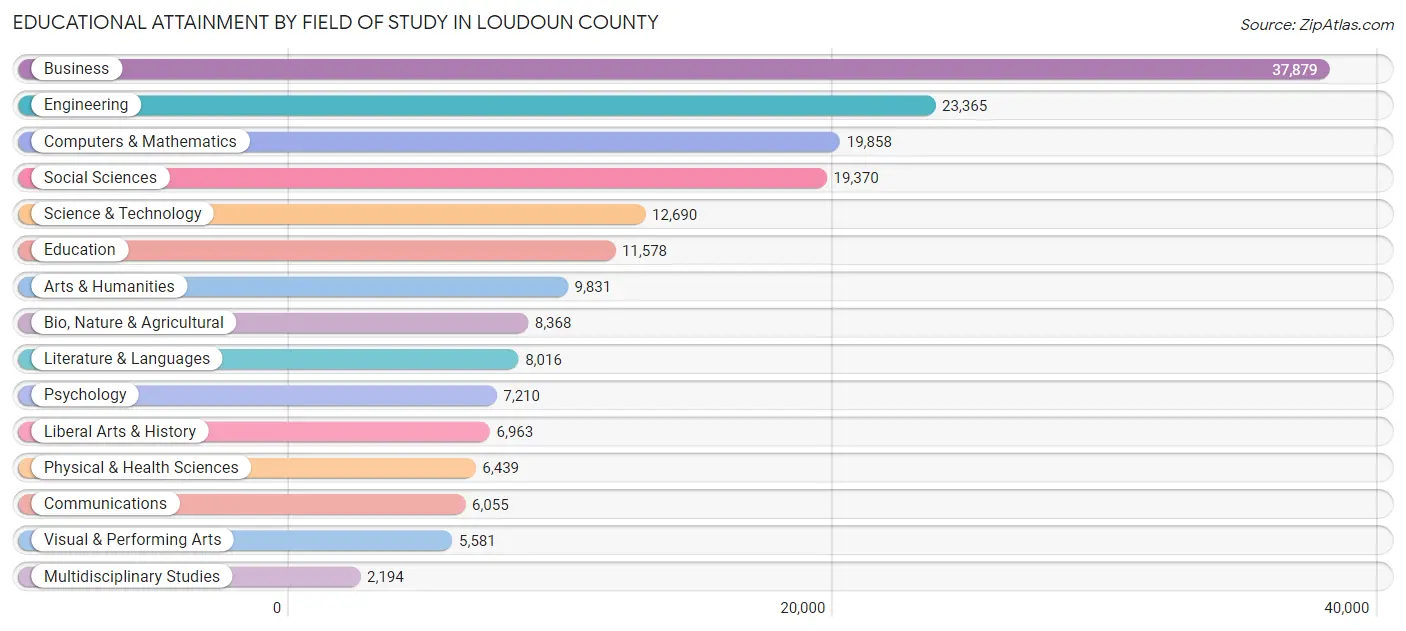
| Field of Study | # Graduates | % Graduates |
| Computers & Mathematics | 19,858 | 10.7% |
| Bio, Nature & Agricultural | 8,368 | 4.5% |
| Physical & Health Sciences | 6,439 | 3.5% |
| Psychology | 7,210 | 3.9% |
| Social Sciences | 19,370 | 10.4% |
| Engineering | 23,365 | 12.6% |
| Multidisciplinary Studies | 2,194 | 1.2% |
| Science & Technology | 12,690 | 6.8% |
| Business | 37,879 | 20.4% |
| Education | 11,578 | 6.2% |
| Literature & Languages | 8,016 | 4.3% |
| Liberal Arts & History | 6,963 | 3.8% |
| Visual & Performing Arts | 5,581 | 3.0% |
| Communications | 6,055 | 3.3% |
| Arts & Humanities | 9,831 | 5.3% |
| Total | 185,397 | 100.0% |
Transportation & Commute in Loudoun County
Vehicle Availability by Sex in Loudoun County
The most prevalent vehicle ownership categories in Loudoun County are males with 2 vehicles (59,285, accounting for 47.6%) and females with 2 vehicles (46,196, making up 58.4%).
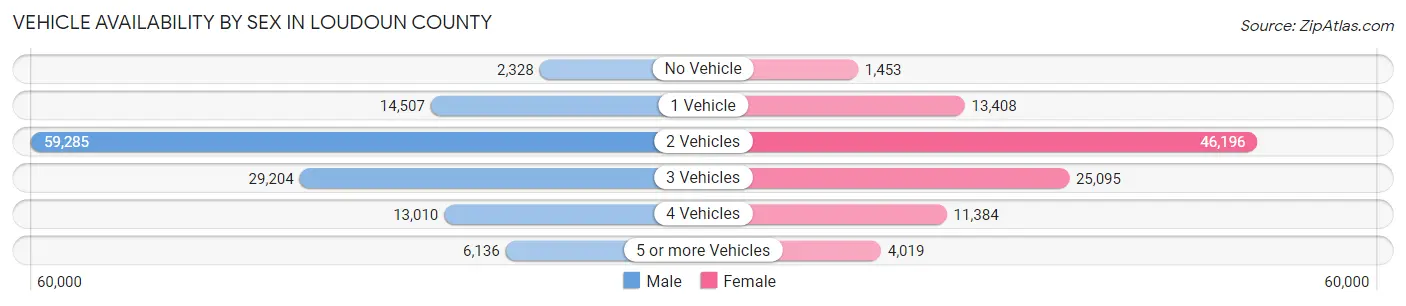
| Vehicles Available | Male | Female |
| No Vehicle | 2,328 (1.9%) | 1,453 (1.4%) |
| 1 Vehicle | 14,507 (11.7%) | 13,408 (13.2%) |
| 2 Vehicles | 59,285 (47.6%) | 46,196 (45.5%) |
| 3 Vehicles | 29,204 (23.5%) | 25,095 (24.7%) |
| 4 Vehicles | 13,010 (10.4%) | 11,384 (11.2%) |
| 5 or more Vehicles | 6,136 (4.9%) | 4,019 (4.0%) |
| Total | 124,470 (100.0%) | 101,555 (100.0%) |
Commute Time in Loudoun County
The most frequently occuring commute durations in Loudoun County are 45 to 59 minutes (21,752 commuters, 12.6%), 15 to 19 minutes (21,607 commuters, 12.5%), and 30 to 34 minutes (21,400 commuters, 12.4%).
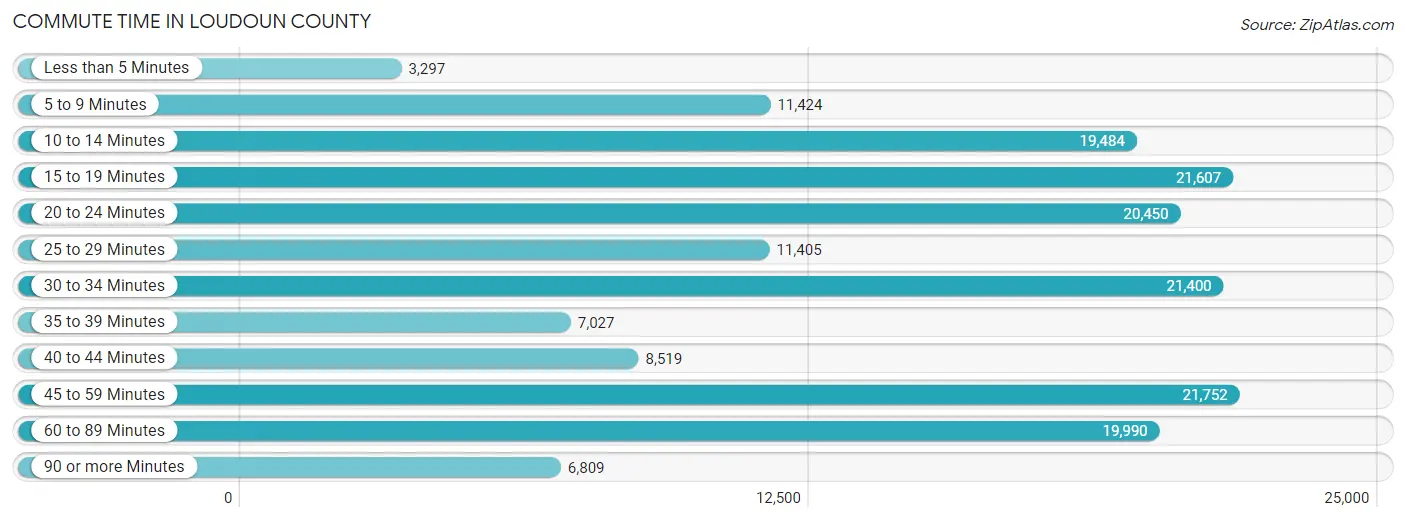
| Commute Time | # Commuters | % Commuters |
| Less than 5 Minutes | 3,297 | 1.9% |
| 5 to 9 Minutes | 11,424 | 6.6% |
| 10 to 14 Minutes | 19,484 | 11.3% |
| 15 to 19 Minutes | 21,607 | 12.5% |
| 20 to 24 Minutes | 20,450 | 11.8% |
| 25 to 29 Minutes | 11,405 | 6.6% |
| 30 to 34 Minutes | 21,400 | 12.4% |
| 35 to 39 Minutes | 7,027 | 4.1% |
| 40 to 44 Minutes | 8,519 | 4.9% |
| 45 to 59 Minutes | 21,752 | 12.6% |
| 60 to 89 Minutes | 19,990 | 11.5% |
| 90 or more Minutes | 6,809 | 3.9% |
Commute Time by Sex in Loudoun County
The most common commute times in Loudoun County are 45 to 59 minutes (13,286 commuters, 13.9%) for males and 15 to 19 minutes (10,440 commuters, 13.4%) for females.
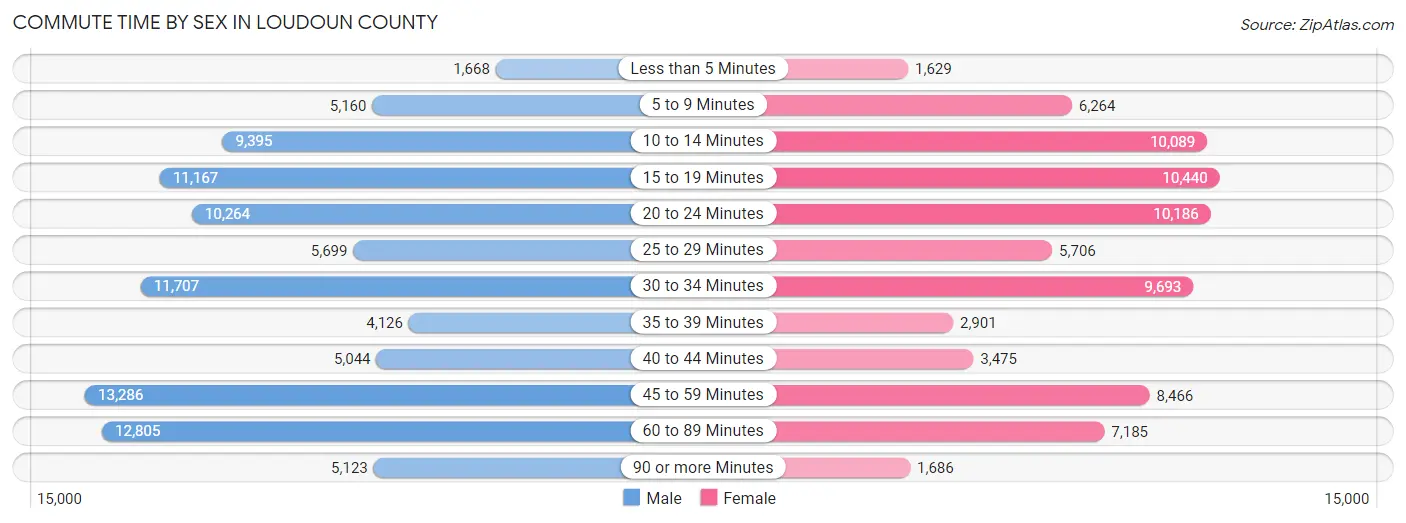
| Commute Time | Male | Female |
| Less than 5 Minutes | 1,668 (1.8%) | 1,629 (2.1%) |
| 5 to 9 Minutes | 5,160 (5.4%) | 6,264 (8.1%) |
| 10 to 14 Minutes | 9,395 (9.8%) | 10,089 (13.0%) |
| 15 to 19 Minutes | 11,167 (11.7%) | 10,440 (13.4%) |
| 20 to 24 Minutes | 10,264 (10.7%) | 10,186 (13.1%) |
| 25 to 29 Minutes | 5,699 (6.0%) | 5,706 (7.3%) |
| 30 to 34 Minutes | 11,707 (12.3%) | 9,693 (12.5%) |
| 35 to 39 Minutes | 4,126 (4.3%) | 2,901 (3.7%) |
| 40 to 44 Minutes | 5,044 (5.3%) | 3,475 (4.5%) |
| 45 to 59 Minutes | 13,286 (13.9%) | 8,466 (10.9%) |
| 60 to 89 Minutes | 12,805 (13.4%) | 7,185 (9.2%) |
| 90 or more Minutes | 5,123 (5.4%) | 1,686 (2.2%) |
Time of Departure to Work by Sex in Loudoun County
The most frequent times of departure to work in Loudoun County are 7:00 AM to 7:29 AM (13,872, 14.5%) for males and 8:00 AM to 8:29 AM (11,862, 15.3%) for females.
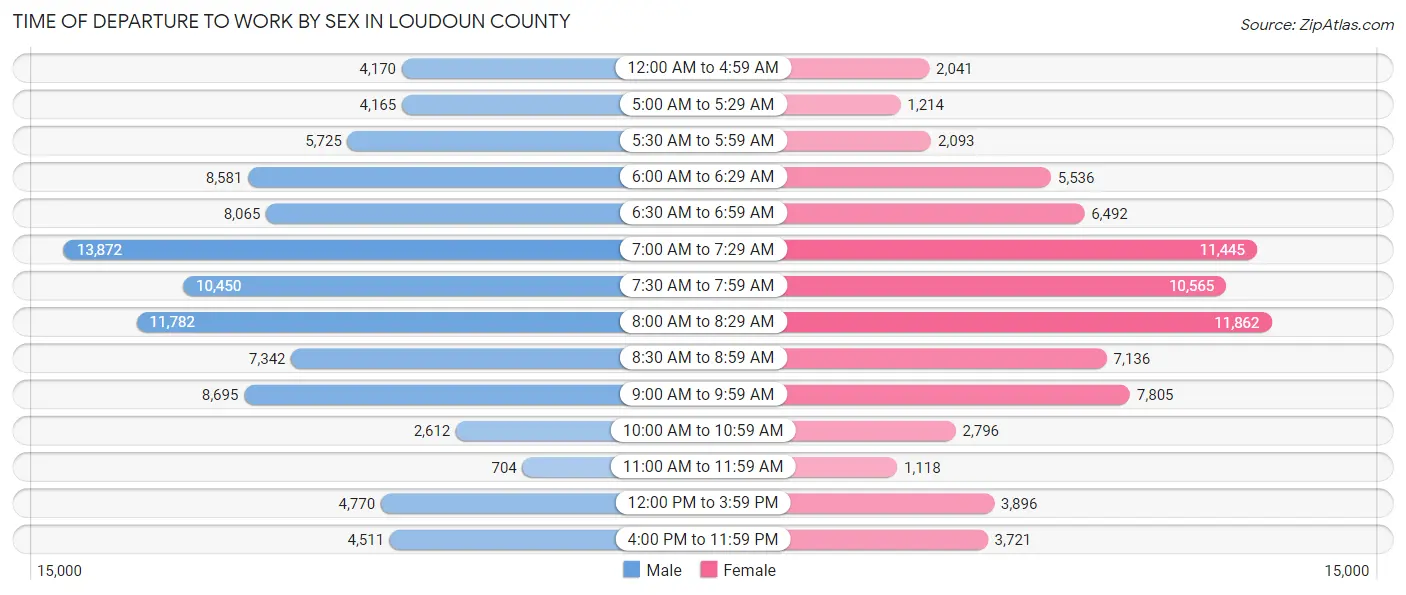
| Time of Departure | Male | Female |
| 12:00 AM to 4:59 AM | 4,170 (4.4%) | 2,041 (2.6%) |
| 5:00 AM to 5:29 AM | 4,165 (4.4%) | 1,214 (1.6%) |
| 5:30 AM to 5:59 AM | 5,725 (6.0%) | 2,093 (2.7%) |
| 6:00 AM to 6:29 AM | 8,581 (9.0%) | 5,536 (7.1%) |
| 6:30 AM to 6:59 AM | 8,065 (8.5%) | 6,492 (8.4%) |
| 7:00 AM to 7:29 AM | 13,872 (14.5%) | 11,445 (14.7%) |
| 7:30 AM to 7:59 AM | 10,450 (11.0%) | 10,565 (13.6%) |
| 8:00 AM to 8:29 AM | 11,782 (12.3%) | 11,862 (15.3%) |
| 8:30 AM to 8:59 AM | 7,342 (7.7%) | 7,136 (9.2%) |
| 9:00 AM to 9:59 AM | 8,695 (9.1%) | 7,805 (10.0%) |
| 10:00 AM to 10:59 AM | 2,612 (2.7%) | 2,796 (3.6%) |
| 11:00 AM to 11:59 AM | 704 (0.7%) | 1,118 (1.4%) |
| 12:00 PM to 3:59 PM | 4,770 (5.0%) | 3,896 (5.0%) |
| 4:00 PM to 11:59 PM | 4,511 (4.7%) | 3,721 (4.8%) |
| Total | 95,444 (100.0%) | 77,720 (100.0%) |
Housing Occupancy in Loudoun County
Occupancy by Ownership in Loudoun County
Of the total 138,549 dwellings in Loudoun County, owner-occupied units account for 107,275 (77.4%), while renter-occupied units make up 31,274 (22.6%).
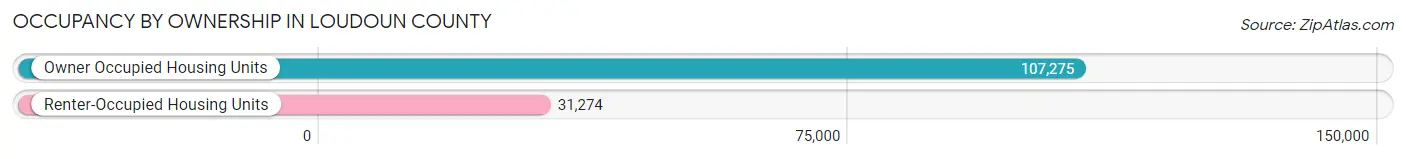
| Occupancy | # Housing Units | % Housing Units |
| Owner Occupied Housing Units | 107,275 | 77.4% |
| Renter-Occupied Housing Units | 31,274 | 22.6% |
| Total Occupied Housing Units | 138,549 | 100.0% |
Occupancy by Household Size in Loudoun County
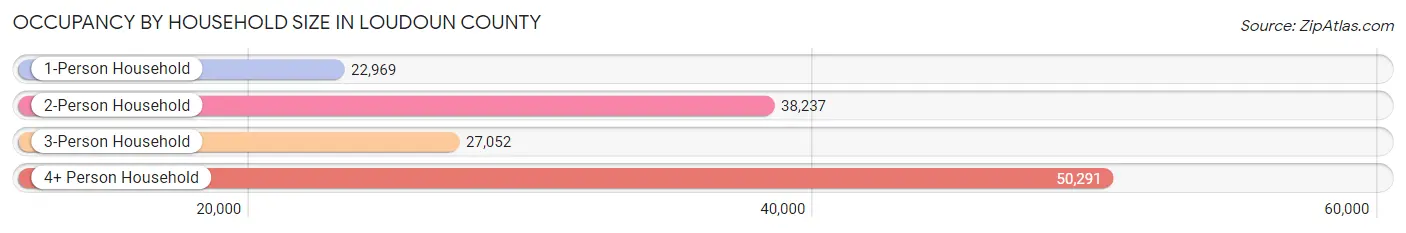
| Household Size | # Housing Units | % Housing Units |
| 1-Person Household | 22,969 | 16.6% |
| 2-Person Household | 38,237 | 27.6% |
| 3-Person Household | 27,052 | 19.5% |
| 4+ Person Household | 50,291 | 36.3% |
| Total Housing Units | 138,549 | 100.0% |
Occupancy by Ownership by Household Size in Loudoun County
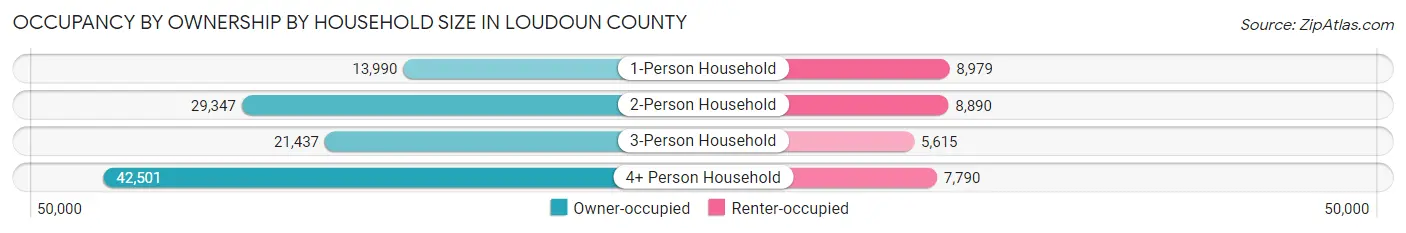
| Household Size | Owner-occupied | Renter-occupied |
| 1-Person Household | 13,990 (60.9%) | 8,979 (39.1%) |
| 2-Person Household | 29,347 (76.7%) | 8,890 (23.3%) |
| 3-Person Household | 21,437 (79.2%) | 5,615 (20.8%) |
| 4+ Person Household | 42,501 (84.5%) | 7,790 (15.5%) |
| Total Housing Units | 107,275 (77.4%) | 31,274 (22.6%) |
Occupancy by Educational Attainment in Loudoun County
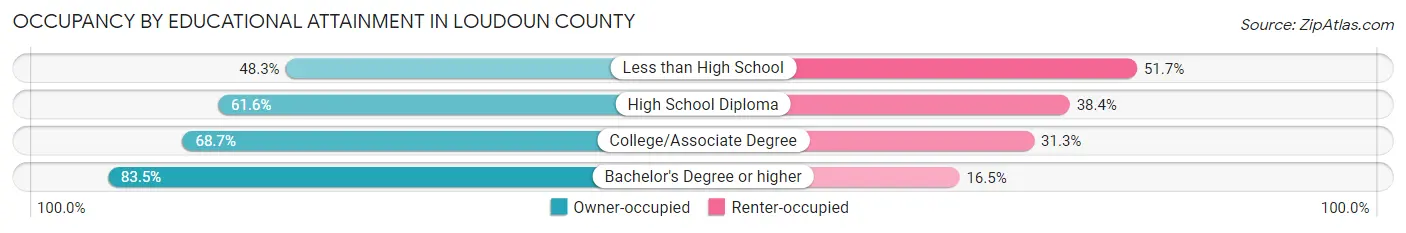
| Household Size | Owner-occupied | Renter-occupied |
| Less than High School | 2,592 (48.3%) | 2,776 (51.7%) |
| High School Diploma | 7,577 (61.6%) | 4,717 (38.4%) |
| College/Associate Degree | 17,705 (68.7%) | 8,073 (31.3%) |
| Bachelor's Degree or higher | 79,401 (83.5%) | 15,708 (16.5%) |
Occupancy by Age of Householder in Loudoun County
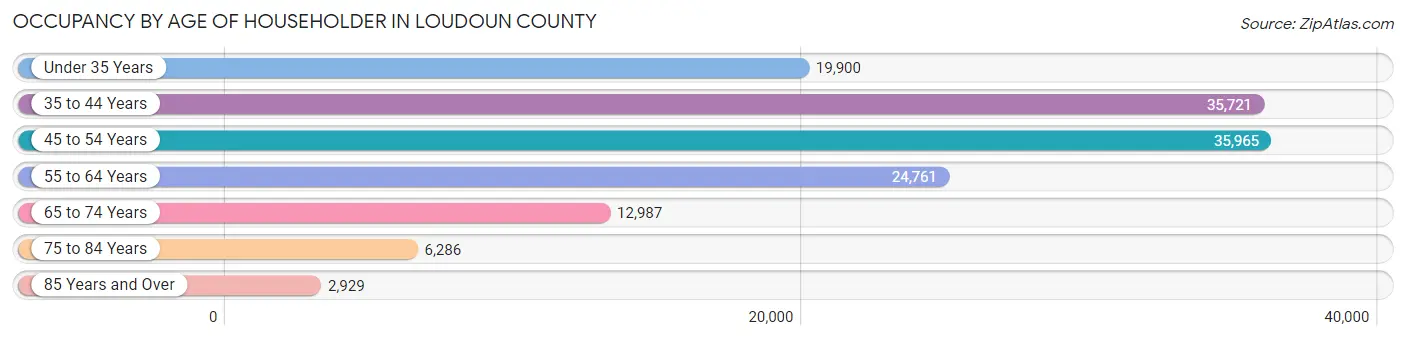
| Age Bracket | # Households | % Households |
| Under 35 Years | 19,900 | 14.4% |
| 35 to 44 Years | 35,721 | 25.8% |
| 45 to 54 Years | 35,965 | 26.0% |
| 55 to 64 Years | 24,761 | 17.9% |
| 65 to 74 Years | 12,987 | 9.4% |
| 75 to 84 Years | 6,286 | 4.5% |
| 85 Years and Over | 2,929 | 2.1% |
| Total | 138,549 | 100.0% |
Housing Finances in Loudoun County
Median Income by Occupancy in Loudoun County
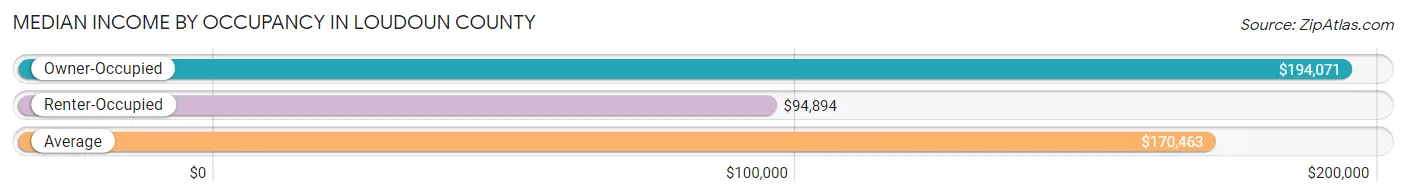
| Occupancy Type | # Households | Median Income |
| Owner-Occupied | 107,275 (77.4%) | $194,071 |
| Renter-Occupied | 31,274 (22.6%) | $94,894 |
| Average | 138,549 (100.0%) | $170,463 |
Occupancy by Householder Income Bracket in Loudoun County
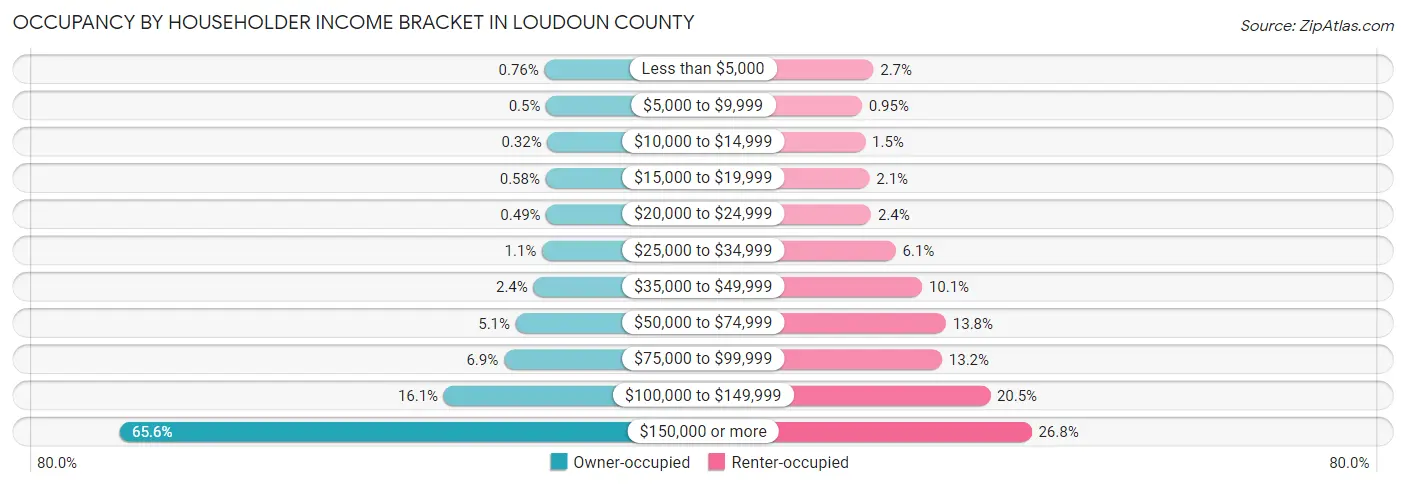
| Income Bracket | Owner-occupied | Renter-occupied |
| Less than $5,000 | 813 (0.8%) | 844 (2.7%) |
| $5,000 to $9,999 | 536 (0.5%) | 298 (0.9%) |
| $10,000 to $14,999 | 340 (0.3%) | 455 (1.5%) |
| $15,000 to $19,999 | 621 (0.6%) | 661 (2.1%) |
| $20,000 to $24,999 | 530 (0.5%) | 735 (2.4%) |
| $25,000 to $34,999 | 1,214 (1.1%) | 1,909 (6.1%) |
| $35,000 to $49,999 | 2,621 (2.4%) | 3,166 (10.1%) |
| $50,000 to $74,999 | 5,513 (5.1%) | 4,303 (13.8%) |
| $75,000 to $99,999 | 7,446 (6.9%) | 4,114 (13.2%) |
| $100,000 to $149,999 | 17,272 (16.1%) | 6,405 (20.5%) |
| $150,000 or more | 70,369 (65.6%) | 8,384 (26.8%) |
| Total | 107,275 (100.0%) | 31,274 (100.0%) |
Monthly Housing Cost Tiers in Loudoun County
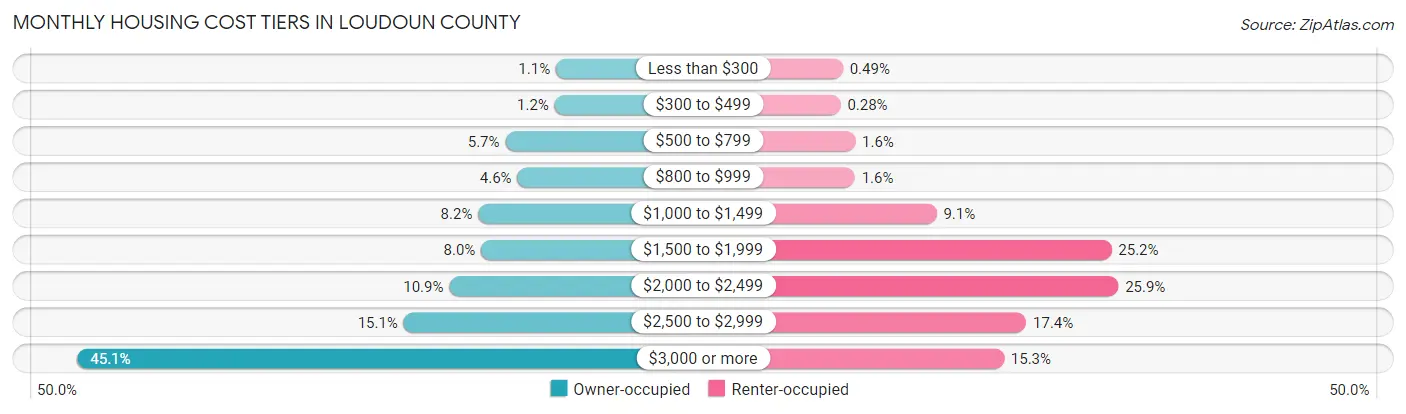
| Monthly Cost | Owner-occupied | Renter-occupied |
| Less than $300 | 1,160 (1.1%) | 154 (0.5%) |
| $300 to $499 | 1,285 (1.2%) | 88 (0.3%) |
| $500 to $799 | 6,162 (5.7%) | 511 (1.6%) |
| $800 to $999 | 4,963 (4.6%) | 498 (1.6%) |
| $1,000 to $1,499 | 8,839 (8.2%) | 2,852 (9.1%) |
| $1,500 to $1,999 | 8,550 (8.0%) | 7,888 (25.2%) |
| $2,000 to $2,499 | 11,694 (10.9%) | 8,085 (25.9%) |
| $2,500 to $2,999 | 16,199 (15.1%) | 5,432 (17.4%) |
| $3,000 or more | 48,423 (45.1%) | 4,791 (15.3%) |
| Total | 107,275 (100.0%) | 31,274 (100.0%) |
Physical Housing Characteristics in Loudoun County
Housing Structures in Loudoun County
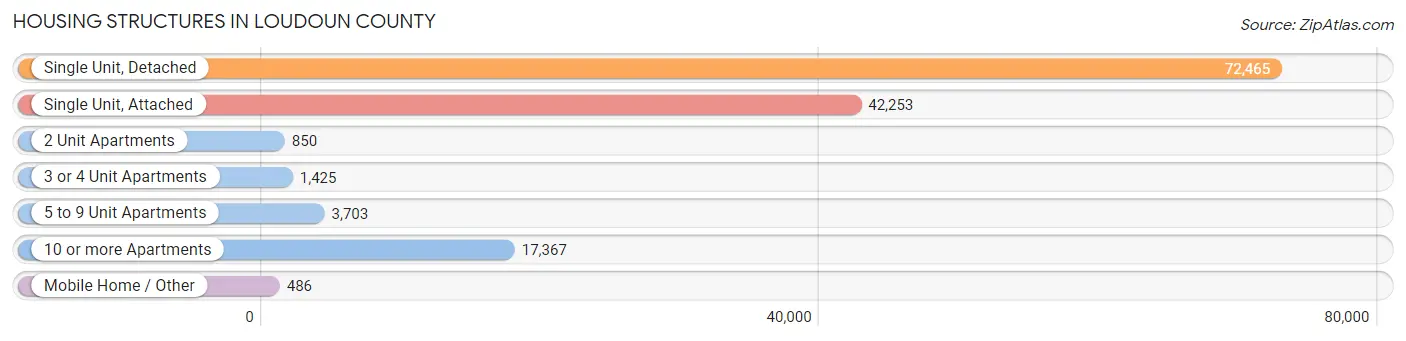
| Structure Type | # Housing Units | % Housing Units |
| Single Unit, Detached | 72,465 | 52.3% |
| Single Unit, Attached | 42,253 | 30.5% |
| 2 Unit Apartments | 850 | 0.6% |
| 3 or 4 Unit Apartments | 1,425 | 1.0% |
| 5 to 9 Unit Apartments | 3,703 | 2.7% |
| 10 or more Apartments | 17,367 | 12.5% |
| Mobile Home / Other | 486 | 0.4% |
| Total | 138,549 | 100.0% |
Housing Structures by Occupancy in Loudoun County
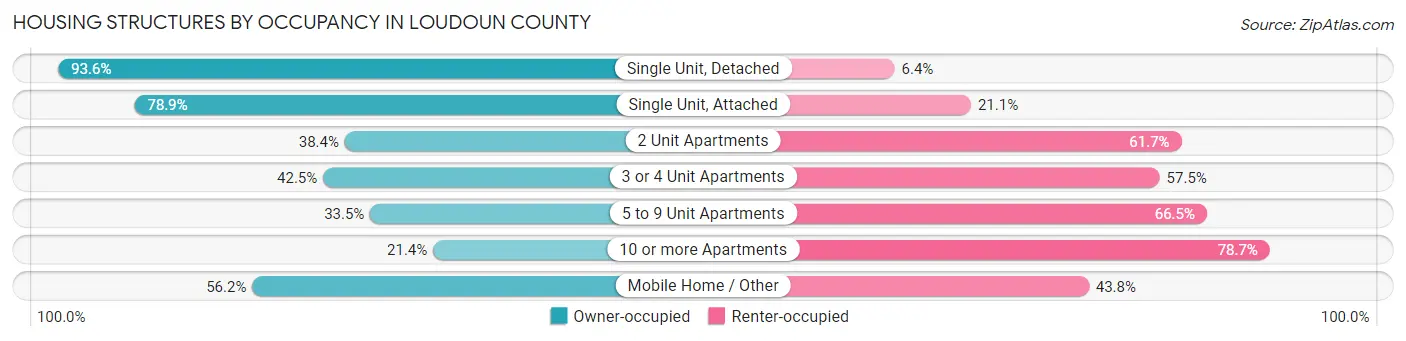
| Structure Type | Owner-occupied | Renter-occupied |
| Single Unit, Detached | 67,801 (93.6%) | 4,664 (6.4%) |
| Single Unit, Attached | 33,322 (78.9%) | 8,931 (21.1%) |
| 2 Unit Apartments | 326 (38.4%) | 524 (61.7%) |
| 3 or 4 Unit Apartments | 606 (42.5%) | 819 (57.5%) |
| 5 to 9 Unit Apartments | 1,239 (33.5%) | 2,464 (66.5%) |
| 10 or more Apartments | 3,708 (21.3%) | 13,659 (78.6%) |
| Mobile Home / Other | 273 (56.2%) | 213 (43.8%) |
| Total | 107,275 (77.4%) | 31,274 (22.6%) |
Housing Structures by Number of Rooms in Loudoun County

| Number of Rooms | Owner-occupied | Renter-occupied |
| 1 Room | 91 (0.1%) | 933 (3.0%) |
| 2 or 3 Rooms | 1,461 (1.4%) | 6,451 (20.6%) |
| 4 or 5 Rooms | 14,029 (13.1%) | 12,587 (40.3%) |
| 6 or 7 Rooms | 28,618 (26.7%) | 7,250 (23.2%) |
| 8 or more Rooms | 63,076 (58.8%) | 4,053 (13.0%) |
| Total | 107,275 (100.0%) | 31,274 (100.0%) |
Housing Structure by Heating Type in Loudoun County
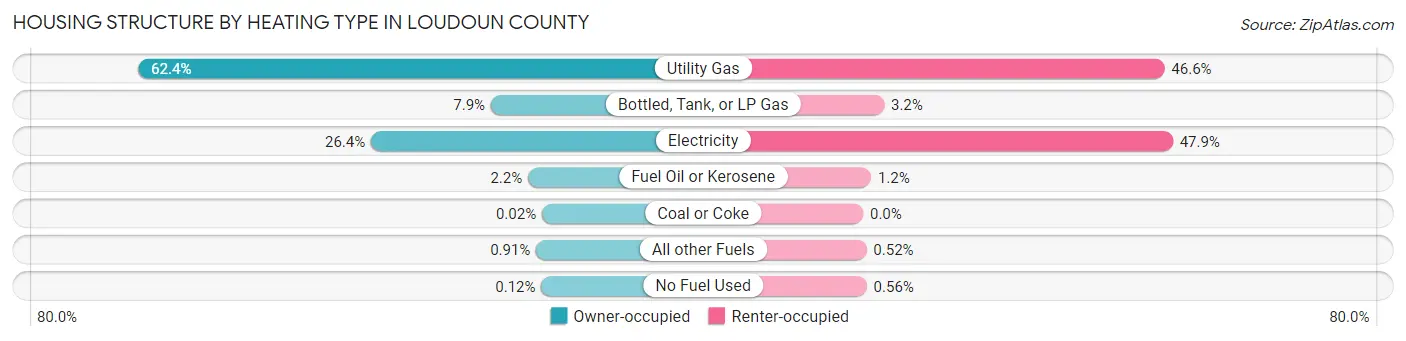
| Heating Type | Owner-occupied | Renter-occupied |
| Utility Gas | 66,980 (62.4%) | 14,572 (46.6%) |
| Bottled, Tank, or LP Gas | 8,485 (7.9%) | 1,012 (3.2%) |
| Electricity | 28,362 (26.4%) | 14,972 (47.9%) |
| Fuel Oil or Kerosene | 2,329 (2.2%) | 382 (1.2%) |
| Coal or Coke | 17 (0.0%) | 0 (0.0%) |
| All other Fuels | 972 (0.9%) | 162 (0.5%) |
| No Fuel Used | 130 (0.1%) | 174 (0.6%) |
| Total | 107,275 (100.0%) | 31,274 (100.0%) |
Household Vehicle Usage in Loudoun County

| Vehicles per Household | Owner-occupied | Renter-occupied |
| No Vehicle | 1,726 (1.6%) | 2,557 (8.2%) |
| 1 Vehicle | 18,344 (17.1%) | 12,761 (40.8%) |
| 2 Vehicles | 53,309 (49.7%) | 11,696 (37.4%) |
| 3 or more Vehicles | 33,896 (31.6%) | 4,260 (13.6%) |
| Total | 107,275 (100.0%) | 31,274 (100.0%) |
Real Estate & Mortgages in Loudoun County
Real Estate and Mortgage Overview in Loudoun County
| Characteristic | Without Mortgage | With Mortgage |
| Housing Units | 19,177 | 88,098 |
| Median Property Value | $589,500 | $670,200 |
| Median Household Income | $137,253 | $61,393 |
| Monthly Housing Costs | $878 | $48,243 |
| Real Estate Taxes | $5,463 | $1,324 |
Property Value by Mortgage Status in Loudoun County
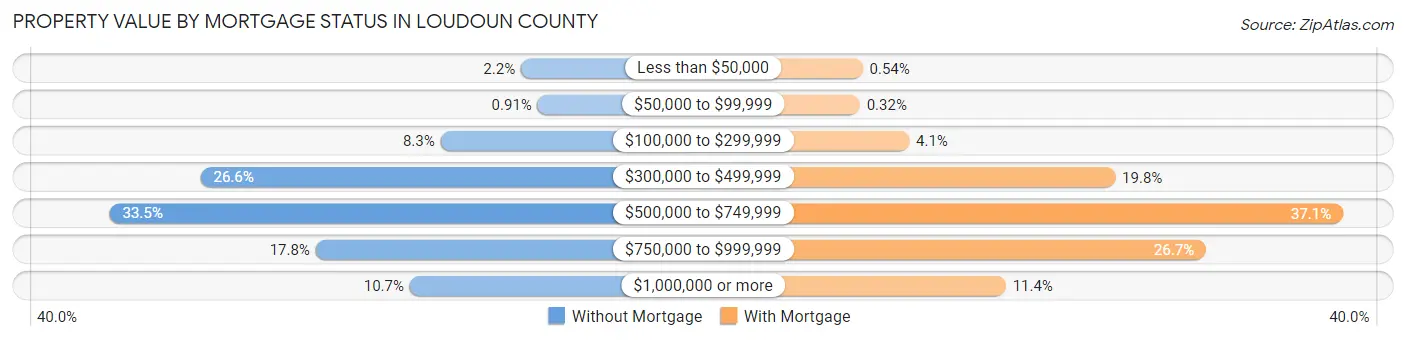
| Property Value | Without Mortgage | With Mortgage |
| Less than $50,000 | 418 (2.2%) | 475 (0.5%) |
| $50,000 to $99,999 | 175 (0.9%) | 281 (0.3%) |
| $100,000 to $299,999 | 1,594 (8.3%) | 3,590 (4.1%) |
| $300,000 to $499,999 | 5,099 (26.6%) | 17,424 (19.8%) |
| $500,000 to $749,999 | 6,431 (33.5%) | 32,716 (37.1%) |
| $750,000 to $999,999 | 3,417 (17.8%) | 23,535 (26.7%) |
| $1,000,000 or more | 2,043 (10.6%) | 10,077 (11.4%) |
| Total | 19,177 (100.0%) | 88,098 (100.0%) |
Household Income by Mortgage Status in Loudoun County
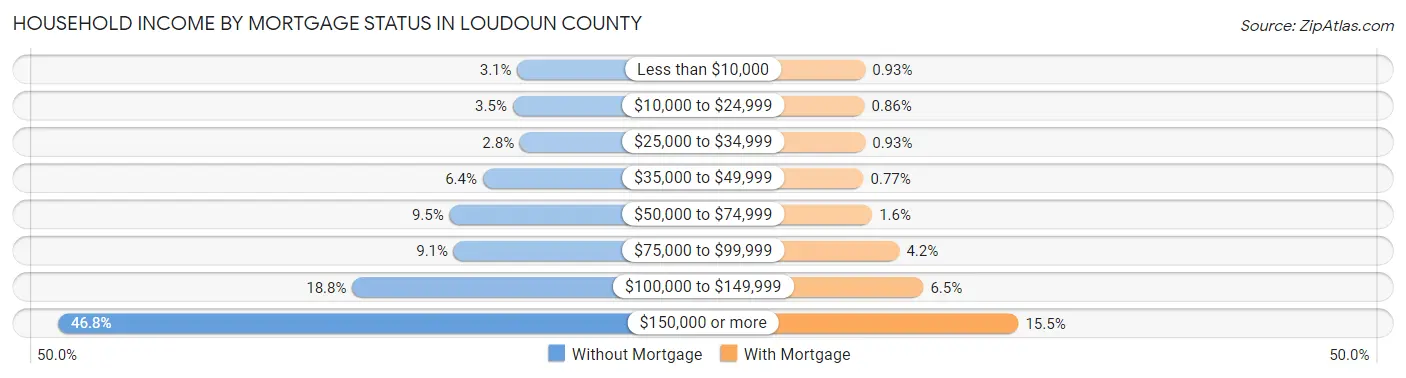
| Household Income | Without Mortgage | With Mortgage |
| Less than $10,000 | 589 (3.1%) | 817 (0.9%) |
| $10,000 to $24,999 | 674 (3.5%) | 760 (0.9%) |
| $25,000 to $34,999 | 540 (2.8%) | 817 (0.9%) |
| $35,000 to $49,999 | 1,219 (6.4%) | 674 (0.8%) |
| $50,000 to $74,999 | 1,828 (9.5%) | 1,402 (1.6%) |
| $75,000 to $99,999 | 1,748 (9.1%) | 3,685 (4.2%) |
| $100,000 to $149,999 | 3,603 (18.8%) | 5,698 (6.5%) |
| $150,000 or more | 8,976 (46.8%) | 13,669 (15.5%) |
| Total | 19,177 (100.0%) | 88,098 (100.0%) |
Property Value to Household Income Ratio in Loudoun County
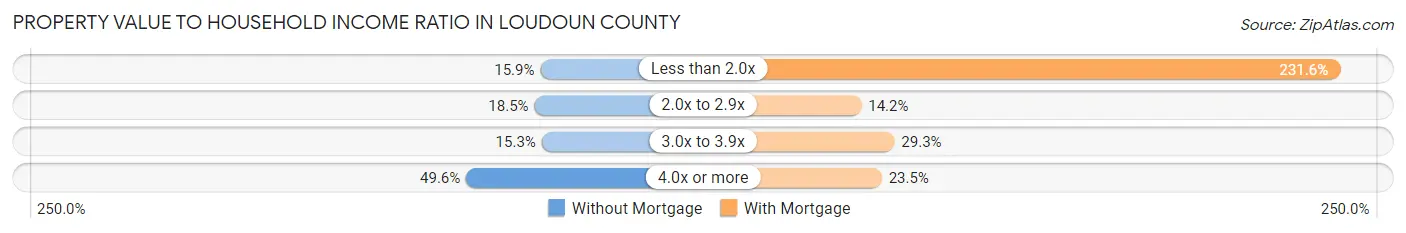
| Value-to-Income Ratio | Without Mortgage | With Mortgage |
| Less than 2.0x | 3,041 (15.9%) | 204,009 (231.6%) |
| 2.0x to 2.9x | 3,555 (18.5%) | 12,535 (14.2%) |
| 3.0x to 3.9x | 2,924 (15.2%) | 25,801 (29.3%) |
| 4.0x or more | 9,502 (49.5%) | 20,715 (23.5%) |
| Total | 19,177 (100.0%) | 88,098 (100.0%) |
Real Estate Taxes by Mortgage Status in Loudoun County

| Property Taxes | Without Mortgage | With Mortgage |
| Less than $800 | 562 (2.9%) | 185 (0.2%) |
| $800 to $1,499 | 501 (2.6%) | 1,508 (1.7%) |
| $800 to $1,499 | 16,745 (87.3%) | 1,589 (1.8%) |
| Total | 19,177 (100.0%) | 88,098 (100.0%) |
Health & Disability in Loudoun County
Health Insurance Coverage by Age in Loudoun County

| Age Bracket | With Coverage | Without Coverage |
| Under 6 Years | 32,794 (96.6%) | 1,168 (3.4%) |
| 6 to 18 Years | 84,192 (96.7%) | 2,846 (3.3%) |
| 19 to 25 Years | 27,120 (89.7%) | 3,110 (10.3%) |
| 26 to 34 Years | 39,055 (90.5%) | 4,078 (9.5%) |
| 35 to 44 Years | 65,966 (92.9%) | 5,007 (7.0%) |
| 45 to 54 Years | 63,327 (95.8%) | 2,779 (4.2%) |
| 55 to 64 Years | 43,314 (95.0%) | 2,281 (5.0%) |
| 65 to 74 Years | 24,071 (97.9%) | 520 (2.1%) |
| 75 Years and older | 16,576 (98.2%) | 310 (1.8%) |
| Total | 396,415 (94.7%) | 22,099 (5.3%) |
Health Insurance Coverage by Citizenship Status in Loudoun County

| Citizenship Status | With Coverage | Without Coverage |
| Native Born | 32,794 (96.6%) | 1,168 (3.4%) |
| Foreign Born, Citizen | 84,192 (96.7%) | 2,846 (3.3%) |
| Foreign Born, not a Citizen | 27,120 (89.7%) | 3,110 (10.3%) |
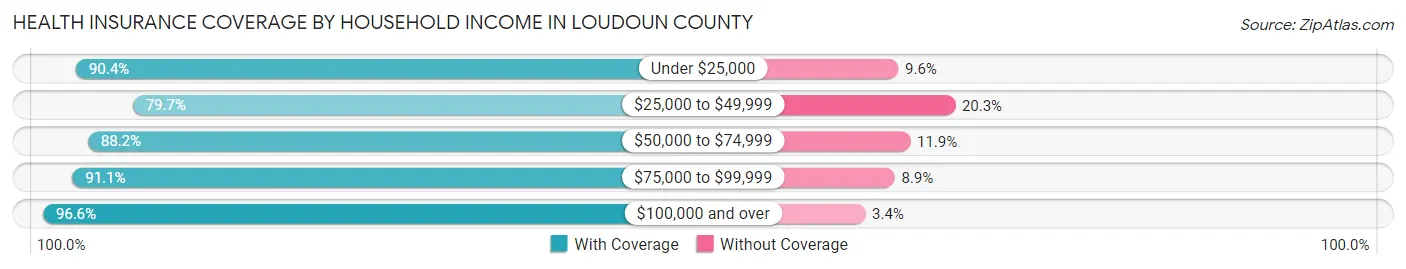
Health Insurance Coverage by Household Income in Loudoun County
| Household Income | With Coverage | Without Coverage |
| Under $25,000 | 9,741 (90.4%) | 1,037 (9.6%) |
| $25,000 to $49,999 | 15,889 (79.7%) | 4,037 (20.3%) |
| $50,000 to $74,999 | 20,007 (88.1%) | 2,689 (11.8%) |
| $75,000 to $99,999 | 26,850 (91.1%) | 2,636 (8.9%) |
| $100,000 and over | 323,234 (96.6%) | 11,488 (3.4%) |
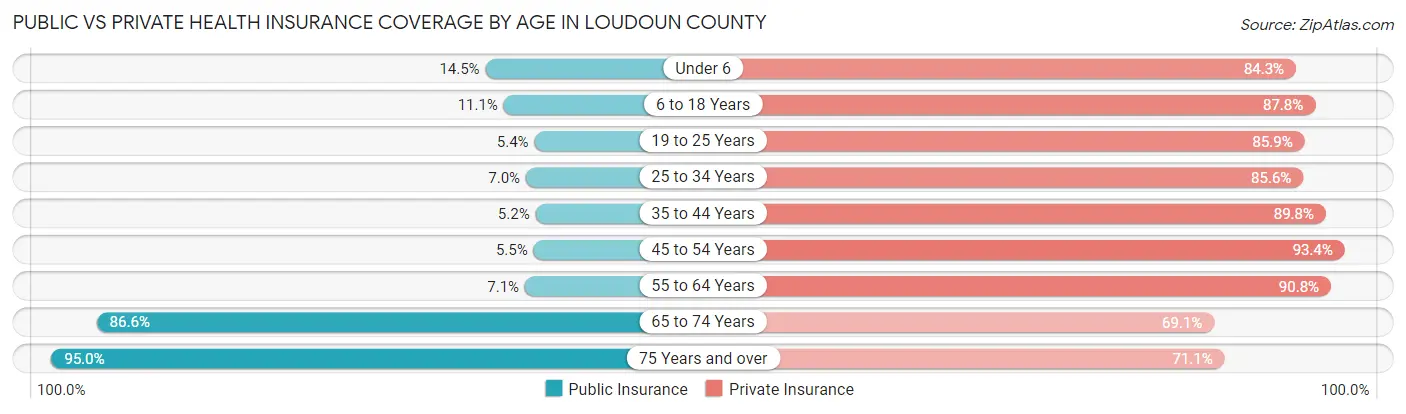
Public vs Private Health Insurance Coverage by Age in Loudoun County
| Age Bracket | Public Insurance | Private Insurance |
| Under 6 | 4,911 (14.5%) | 28,626 (84.3%) |
| 6 to 18 Years | 9,639 (11.1%) | 76,443 (87.8%) |
| 19 to 25 Years | 1,624 (5.4%) | 25,966 (85.9%) |
| 25 to 34 Years | 2,997 (7.0%) | 36,934 (85.6%) |
| 35 to 44 Years | 3,668 (5.2%) | 63,756 (89.8%) |
| 45 to 54 Years | 3,653 (5.5%) | 61,709 (93.3%) |
| 55 to 64 Years | 3,253 (7.1%) | 41,393 (90.8%) |
| 65 to 74 Years | 21,300 (86.6%) | 16,995 (69.1%) |
| 75 Years and over | 16,049 (95.0%) | 11,999 (71.1%) |
| Total | 67,094 (16.0%) | 363,821 (86.9%) |
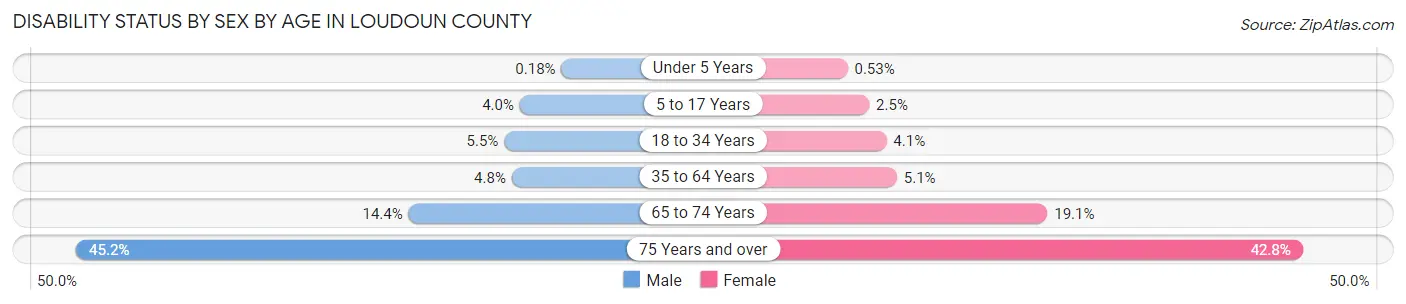
Disability Status by Sex by Age in Loudoun County
| Age Bracket | Male | Female |
| Under 5 Years | 25 (0.2%) | 72 (0.5%) |
| 5 to 17 Years | 1,811 (4.0%) | 1,086 (2.5%) |
| 18 to 34 Years | 2,161 (5.5%) | 1,660 (4.1%) |
| 35 to 64 Years | 4,426 (4.8%) | 4,616 (5.1%) |
| 65 to 74 Years | 1,674 (14.4%) | 2,468 (19.1%) |
| 75 Years and over | 3,207 (45.2%) | 4,188 (42.8%) |
Disability Class by Sex by Age in Loudoun County
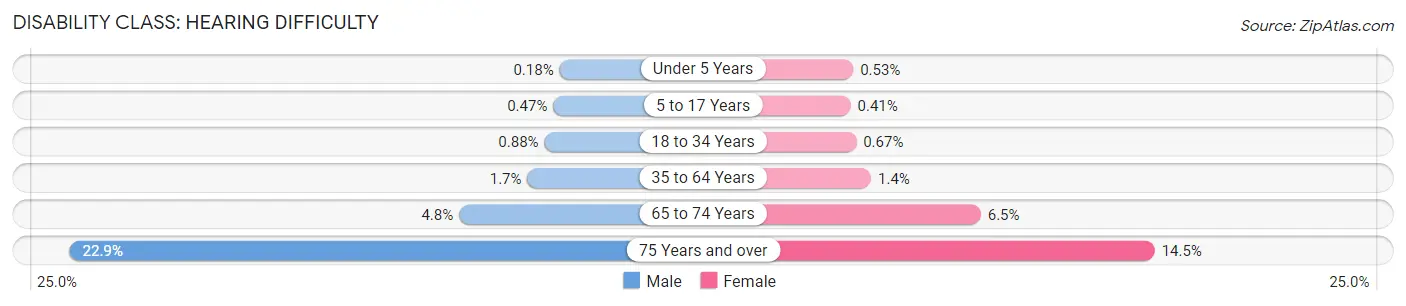
Disability Class: Hearing Difficulty
| Age Bracket | Male | Female |
| Under 5 Years | 25 (0.2%) | 72 (0.5%) |
| 5 to 17 Years | 210 (0.5%) | 176 (0.4%) |
| 18 to 34 Years | 345 (0.9%) | 270 (0.7%) |
| 35 to 64 Years | 1,545 (1.7%) | 1,231 (1.4%) |
| 65 to 74 Years | 564 (4.8%) | 835 (6.5%) |
| 75 Years and over | 1,625 (22.9%) | 1,422 (14.5%) |
Disability Class: Vision Difficulty
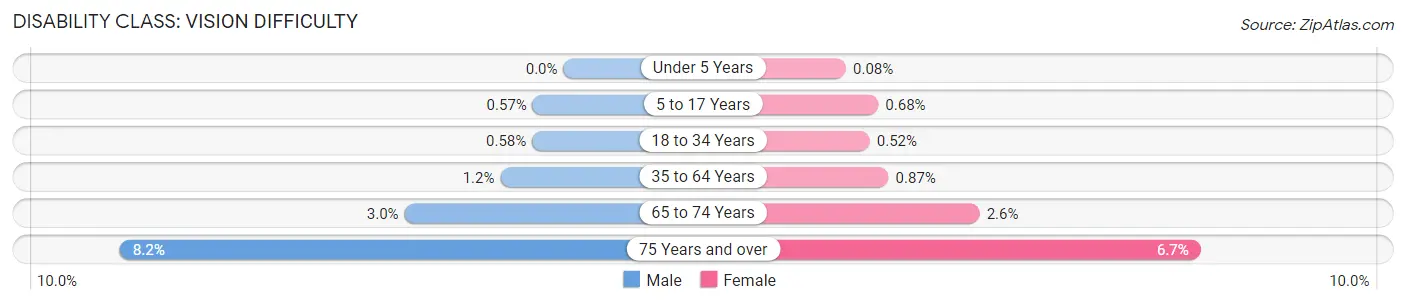
| Age Bracket | Male | Female |
| Under 5 Years | 0 (0.0%) | 11 (0.1%) |
| 5 to 17 Years | 255 (0.6%) | 289 (0.7%) |
| 18 to 34 Years | 229 (0.6%) | 208 (0.5%) |
| 35 to 64 Years | 1,081 (1.2%) | 788 (0.9%) |
| 65 to 74 Years | 344 (2.9%) | 331 (2.6%) |
| 75 Years and over | 584 (8.2%) | 652 (6.7%) |
Disability Class: Cognitive Difficulty
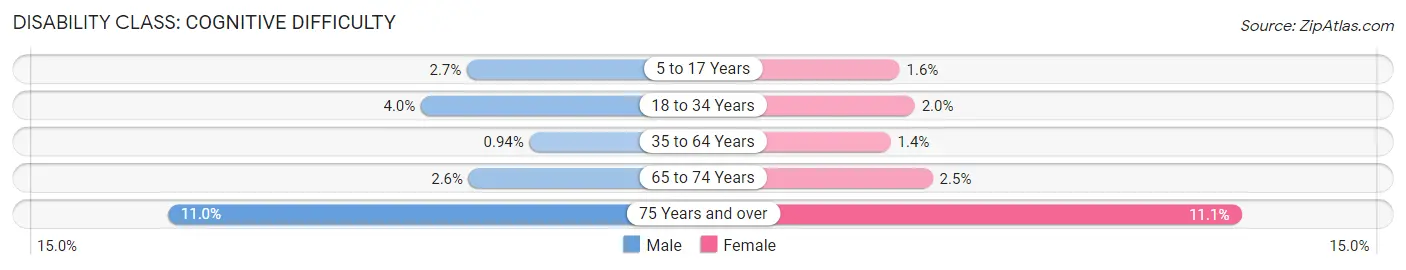
| Age Bracket | Male | Female |
| 5 to 17 Years | 1,199 (2.7%) | 686 (1.6%) |
| 18 to 34 Years | 1,557 (4.0%) | 816 (2.0%) |
| 35 to 64 Years | 864 (0.9%) | 1,230 (1.4%) |
| 65 to 74 Years | 306 (2.6%) | 327 (2.5%) |
| 75 Years and over | 781 (11.0%) | 1,089 (11.1%) |
Disability Class: Ambulatory Difficulty
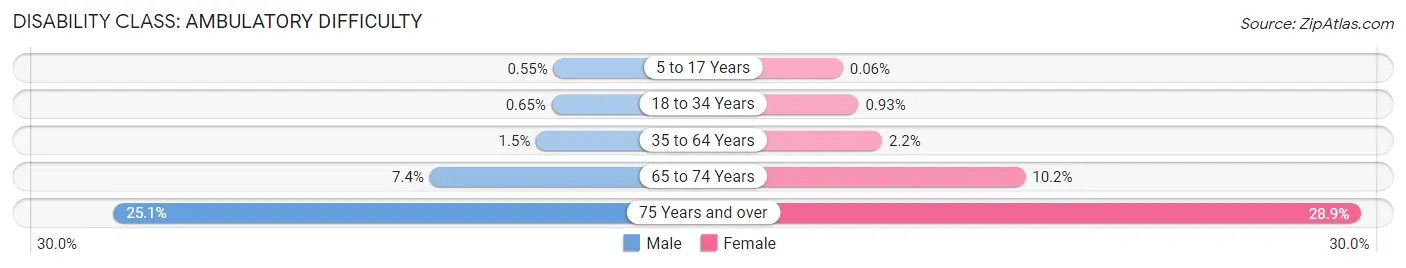
| Age Bracket | Male | Female |
| 5 to 17 Years | 246 (0.5%) | 27 (0.1%) |
| 18 to 34 Years | 255 (0.6%) | 372 (0.9%) |
| 35 to 64 Years | 1,396 (1.5%) | 2,022 (2.2%) |
| 65 to 74 Years | 867 (7.4%) | 1,322 (10.2%) |
| 75 Years and over | 1,778 (25.1%) | 2,831 (28.9%) |
Disability Class: Self-Care Difficulty
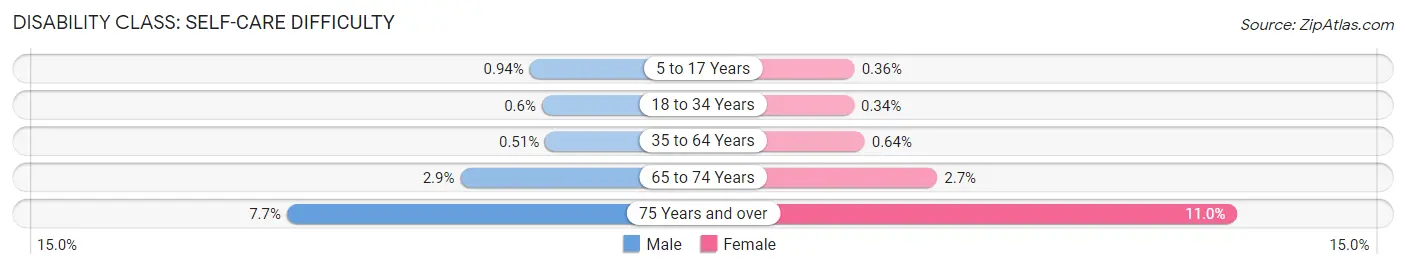
| Age Bracket | Male | Female |
| 5 to 17 Years | 419 (0.9%) | 155 (0.4%) |
| 18 to 34 Years | 238 (0.6%) | 135 (0.3%) |
| 35 to 64 Years | 467 (0.5%) | 582 (0.6%) |
| 65 to 74 Years | 334 (2.9%) | 344 (2.7%) |
| 75 Years and over | 546 (7.7%) | 1,078 (11.0%) |
Technology Access in Loudoun County
Computing Device Access in Loudoun County
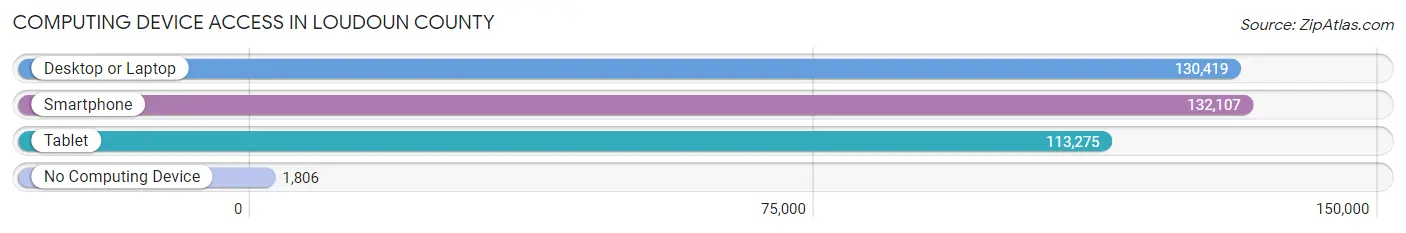
| Device Type | # Households | % Households |
| Desktop or Laptop | 130,419 | 94.1% |
| Smartphone | 132,107 | 95.4% |
| Tablet | 113,275 | 81.8% |
| No Computing Device | 1,806 | 1.3% |
| Total | 138,549 | 100.0% |
Internet Access in Loudoun County
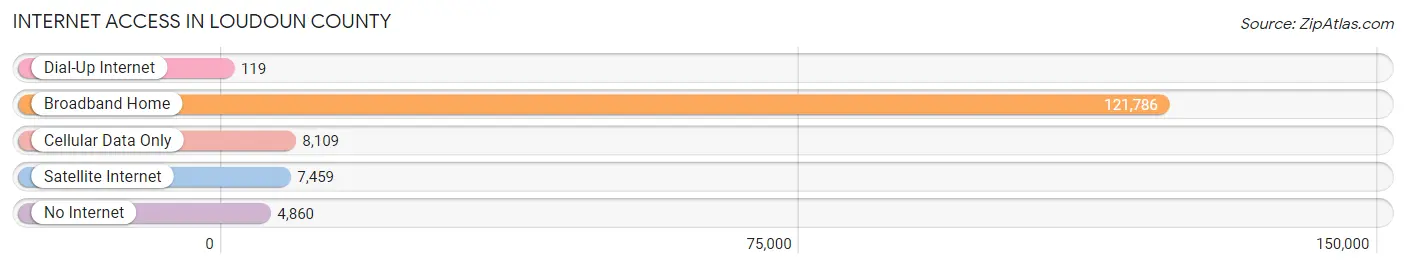
| Internet Type | # Households | % Households |
| Dial-Up Internet | 119 | 0.1% |
| Broadband Home | 121,786 | 87.9% |
| Cellular Data Only | 8,109 | 5.9% |
| Satellite Internet | 7,459 | 5.4% |
| No Internet | 4,860 | 3.5% |
| Total | 138,549 | 100.0% |
Loudoun County Summary
Loudoun County, Virginia is located in the northern part of the state, just west of Washington, D.C. It is the third-most populous county in Virginia, with a population of over 400,000 people. The county is home to a diverse population, with a mix of rural and suburban communities.
Geography
Loudoun County is located in the Piedmont region of Virginia, and is bordered by the Potomac River to the north, Fairfax County to the east, Fauquier County to the south, and Clarke County to the west. The county is divided into two distinct regions: the eastern portion is part of the Washington, D.C. metropolitan area, while the western portion is more rural and agricultural. The county is home to the Blue Ridge Mountains, which form the eastern border of the county. The highest point in the county is Catoctin Mountain, which rises to an elevation of 1,890 feet.
The county is home to several major rivers, including the Potomac, Occoquan, and Shenandoah. The county is also home to several major lakes, including Lake Manassas, Lake Anna, and Lake Frederick.
Economy
Loudoun County is home to a diverse economy, with a mix of agriculture, technology, and government. The county is home to several major employers, including the U.S. Department of Defense, the National Geospatial-Intelligence Agency, and the U.S. Department of Homeland Security. The county is also home to several major technology companies, including AOL, Verizon, and Amazon.
Agriculture is an important part of the county’s economy, with the county being home to several major wineries, as well as a thriving equine industry. The county is also home to several major data centers, which are used by major technology companies.
Demographics
As of the 2010 census, the population of Loudoun County was 312,311. The population is diverse, with a mix of races and ethnicities. The largest racial group is White (68.3%), followed by Asian (14.2%), Hispanic or Latino (10.2%), and African American (7.3%).
The median household income in the county is $125,844, and the median home value is $521,000. The county is home to several major universities, including George Mason University, George Washington University, and the University of Virginia.
History
Loudoun County was established in 1757, and was named after John Campbell, 4th Earl of Loudoun. The county was originally part of Fairfax County, and was created to provide a more convenient court location for the western part of the county.
The county was home to several major battles during the Civil War, including the Battle of Ball’s Bluff and the Battle of Aldie. The county was also home to several major battles during the Revolutionary War, including the Battle of Great Falls and the Battle of Chantilly.
The county has seen significant growth in recent years, with the population increasing by over 50% since 2000. The county is home to several major employers, and is a popular destination for tourists and commuters alike.
Common Questions
What is Per Capita Income in Loudoun County?
Per Capita income in Loudoun County is $67,251.
What is the Median Family Income in Loudoun County?
Median Family Income in Loudoun County is $189,841.
What is the Median Household income in Loudoun County?
Median Household Income in Loudoun County is $170,463.
What is Income or Wage Gap in Loudoun County?
Income or Wage Gap in Loudoun County is 44.9%.
Women in Loudoun County earn 55.1 cents for every dollar earned by a man.
What is Family Income Deficit in Loudoun County?
Family Income Deficit in Loudoun County is $10,307.
Families that are below poverty line in Loudoun County earn $10,307 less on average than the poverty threshold level.
What is Inequality or Gini Index in Loudoun County?
Inequality or Gini Index in Loudoun County is 0.39.
What is the Total Population of Loudoun County?
Total Population of Loudoun County is 420,773.
What is the Total Male Population of Loudoun County?
Total Male Population of Loudoun County is 210,848.
What is the Total Female Population of Loudoun County?
Total Female Population of Loudoun County is 209,925.
What is the Ratio of Males per 100 Females in Loudoun County?
There are 100.44 Males per 100 Females in Loudoun County.
What is the Ratio of Females per 100 Males in Loudoun County?
There are 99.56 Females per 100 Males in Loudoun County.
What is the Median Population Age in Loudoun County?
Median Population Age in Loudoun County is 37.3 Years.
What is the Average Family Size in Loudoun County
Average Family Size in Loudoun County is 3.4 People.
What is the Average Household Size in Loudoun County
Average Household Size in Loudoun County is 3.0 People.
How Large is the Labor Force in Loudoun County?
There are 237,821 People in the Labor Forcein in Loudoun County.
What is the Percentage of People in the Labor Force in Loudoun County?
74.3% of People are in the Labor Force in Loudoun County.
What is the Unemployment Rate in Loudoun County?
Unemployment Rate in Loudoun County is 3.2%.