Fluvanna County, VA Map & Demographics
Fluvanna County Map
Fluvanna County Overview
$48,426
PER CAPITA INCOME
$102,060
AVG FAMILY INCOME
$90,766
AVG HOUSEHOLD INCOME
17.7%
WAGE / INCOME GAP [ % ]
82.3¢/ $1
WAGE / INCOME GAP [ $ ]
$7,565
FAMILY INCOME DEFICIT
0.48
INEQUALITY / GINI INDEX
27,442
TOTAL POPULATION
12,811
MALE POPULATION
14,631
FEMALE POPULATION
87.56
MALES / 100 FEMALES
114.21
FEMALES / 100 MALES
43.1
MEDIAN AGE
3.0
AVG FAMILY SIZE
2.6
AVG HOUSEHOLD SIZE
13,833
LABOR FORCE [ PEOPLE ]
61.0%
PERCENT IN LABOR FORCE
3.0%
UNEMPLOYMENT RATE
Income in Fluvanna County
Income Overview in Fluvanna County
Per Capita Income in Fluvanna County is $48,426, while median incomes of families and households are $102,060 and $90,766 respectively.
| Characteristic | Number | Measure |
| Per Capita Income | 27,442 | $48,426 |
| Median Family Income | 7,432 | $102,060 |
| Mean Family Income | 7,432 | $145,041 |
| Median Household Income | 10,195 | $90,766 |
| Mean Household Income | 10,195 | $125,295 |
| Income Deficit | 7,432 | $7,565 |
| Wage / Income Gap (%) | 27,442 | 17.68% |
| Wage / Income Gap ($) | 27,442 | 82.32¢ per $1 |
| Gini / Inequality Index | 27,442 | 0.48 |
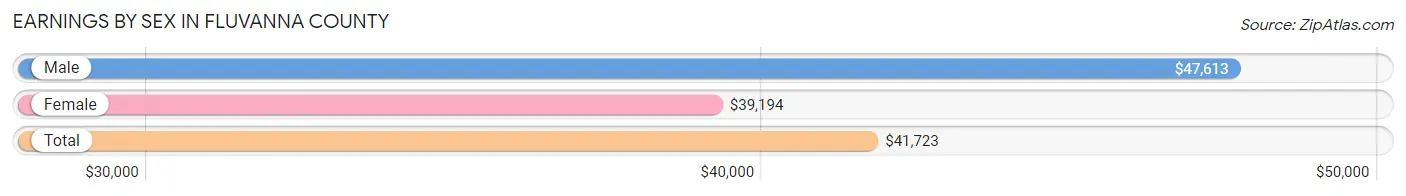
Earnings by Sex in Fluvanna County
Average Earnings in Fluvanna County are $41,723, $47,613 for men and $39,194 for women, a difference of 17.7%.
| Sex | Number | Average Earnings |
| Male | 7,478 (50.5%) | $47,613 |
| Female | 7,328 (49.5%) | $39,194 |
| Total | 14,806 (100.0%) | $41,723 |
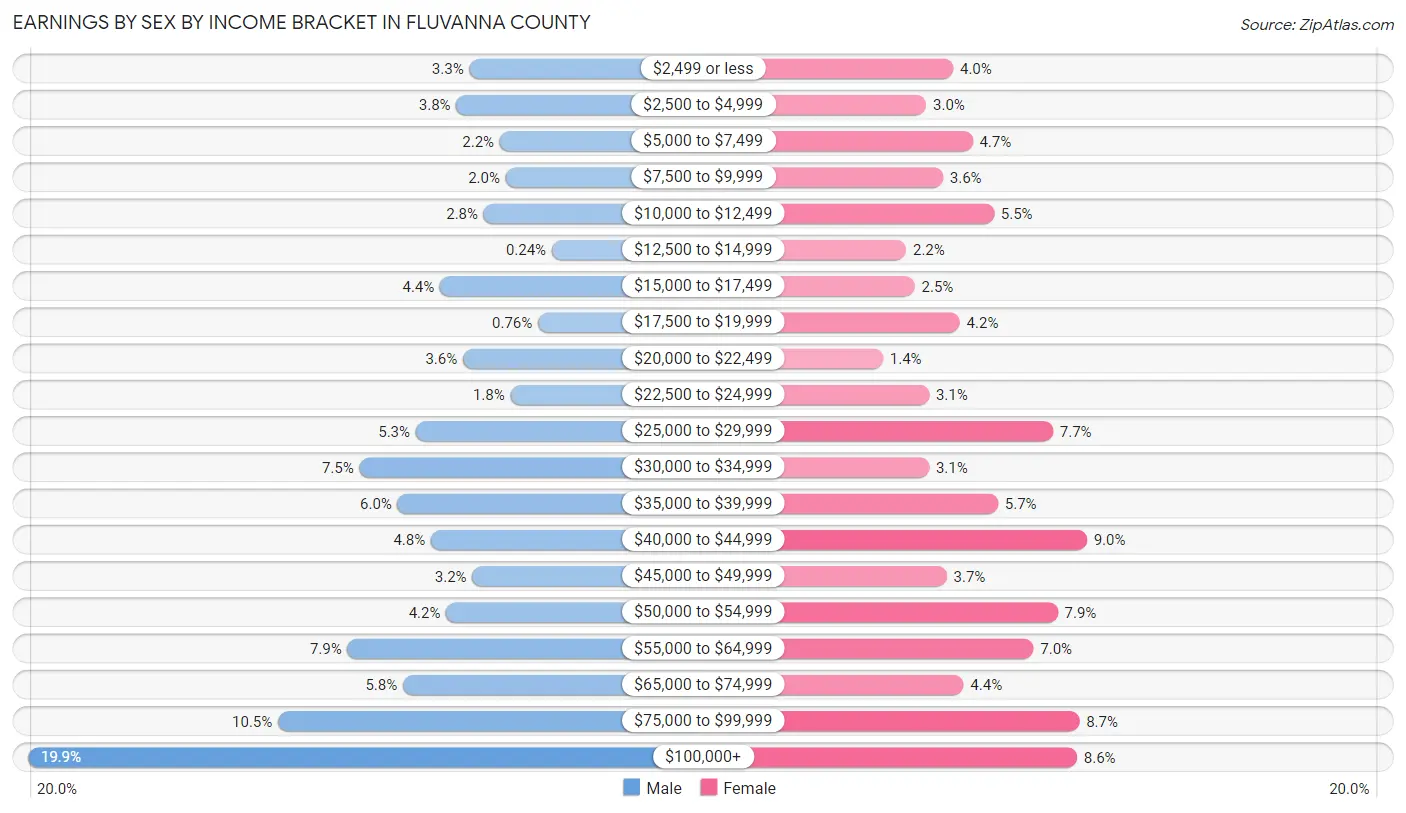
Earnings by Sex by Income Bracket in Fluvanna County
The most common earnings brackets in Fluvanna County are $100,000+ for men (1,487 | 19.9%) and $40,000 to $44,999 for women (659 | 9.0%).
| Income | Male | Female |
| $2,499 or less | 249 (3.3%) | 292 (4.0%) |
| $2,500 to $4,999 | 286 (3.8%) | 218 (3.0%) |
| $5,000 to $7,499 | 164 (2.2%) | 345 (4.7%) |
| $7,500 to $9,999 | 147 (2.0%) | 264 (3.6%) |
| $10,000 to $12,499 | 209 (2.8%) | 404 (5.5%) |
| $12,500 to $14,999 | 18 (0.2%) | 163 (2.2%) |
| $15,000 to $17,499 | 331 (4.4%) | 186 (2.5%) |
| $17,500 to $19,999 | 57 (0.8%) | 310 (4.2%) |
| $20,000 to $22,499 | 267 (3.6%) | 99 (1.3%) |
| $22,500 to $24,999 | 134 (1.8%) | 226 (3.1%) |
| $25,000 to $29,999 | 399 (5.3%) | 566 (7.7%) |
| $30,000 to $34,999 | 557 (7.4%) | 226 (3.1%) |
| $35,000 to $39,999 | 450 (6.0%) | 415 (5.7%) |
| $40,000 to $44,999 | 357 (4.8%) | 659 (9.0%) |
| $45,000 to $49,999 | 241 (3.2%) | 274 (3.7%) |
| $50,000 to $54,999 | 314 (4.2%) | 579 (7.9%) |
| $55,000 to $64,999 | 591 (7.9%) | 512 (7.0%) |
| $65,000 to $74,999 | 435 (5.8%) | 320 (4.4%) |
| $75,000 to $99,999 | 785 (10.5%) | 638 (8.7%) |
| $100,000+ | 1,487 (19.9%) | 632 (8.6%) |
| Total | 7,478 (100.0%) | 7,328 (100.0%) |
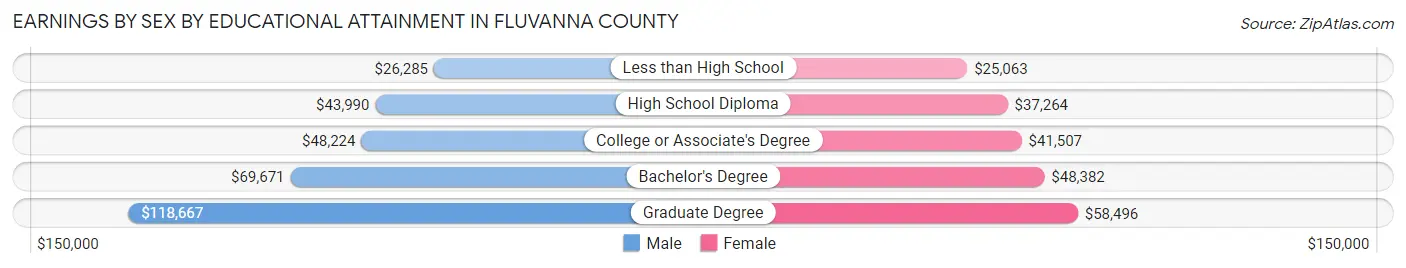
Earnings by Sex by Educational Attainment in Fluvanna County
Average earnings in Fluvanna County are $55,106 for men and $42,185 for women, a difference of 23.4%. Men with an educational attainment of graduate degree enjoy the highest average annual earnings of $118,667, while those with less than high school education earn the least with $26,285. Women with an educational attainment of graduate degree earn the most with the average annual earnings of $58,496, while those with less than high school education have the smallest earnings of $25,063.
| Educational Attainment | Male Income | Female Income |
| Less than High School | $26,285 | $25,063 |
| High School Diploma | $43,990 | $37,264 |
| College or Associate's Degree | $48,224 | $41,507 |
| Bachelor's Degree | $69,671 | $48,382 |
| Graduate Degree | $118,667 | $58,496 |
| Total | $55,106 | $42,185 |
Family Income in Fluvanna County
Family Income Brackets in Fluvanna County
According to the Fluvanna County family income data, there are 1,984 families falling into the $100,000 to $149,999 income range, which is the most common income bracket and makes up 26.7% of all families. Conversely, the $10,000 to $14,999 income bracket is the least frequent group with only 45 families (0.6%) belonging to this category.
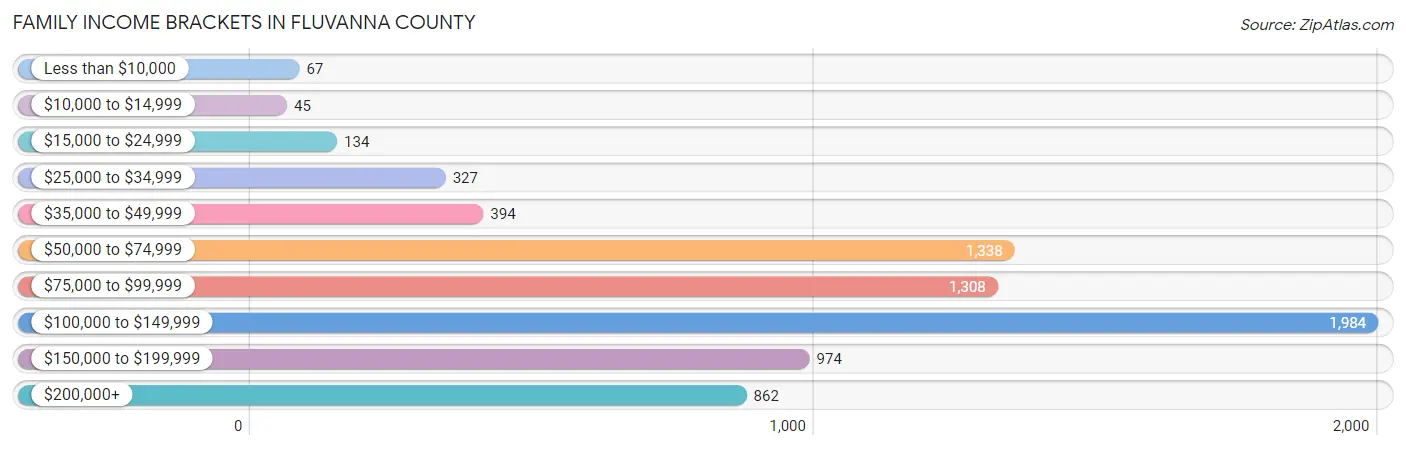
| Income Bracket | # Families | % Families |
| Less than $10,000 | 67 | 0.9% |
| $10,000 to $14,999 | 45 | 0.6% |
| $15,000 to $24,999 | 134 | 1.8% |
| $25,000 to $34,999 | 327 | 4.4% |
| $35,000 to $49,999 | 394 | 5.3% |
| $50,000 to $74,999 | 1,338 | 18.0% |
| $75,000 to $99,999 | 1,308 | 17.6% |
| $100,000 to $149,999 | 1,984 | 26.7% |
| $150,000 to $199,999 | 974 | 13.1% |
| $200,000+ | 862 | 11.6% |
Family Income by Famaliy Size in Fluvanna County
7+ person families (112 | 1.5%) account for the highest median family income in Fluvanna County with $144,000 per family, while 2-person families (3,763 | 50.6%) have the highest median income of $45,302 per family member.
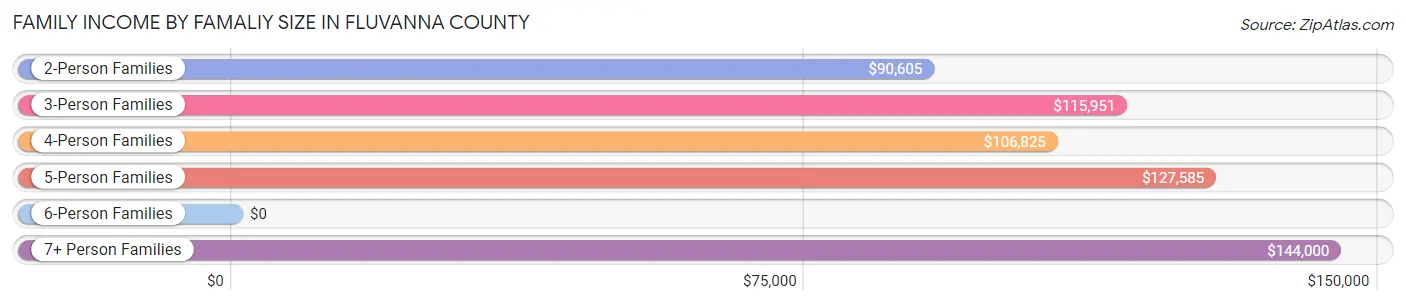
| Income Bracket | # Families | Median Income |
| 2-Person Families | 3,763 (50.6%) | $90,605 |
| 3-Person Families | 1,469 (19.8%) | $115,951 |
| 4-Person Families | 1,256 (16.9%) | $106,825 |
| 5-Person Families | 681 (9.2%) | $127,585 |
| 6-Person Families | 151 (2.0%) | $0 |
| 7+ Person Families | 112 (1.5%) | $144,000 |
| Total | 7,432 (100.0%) | $102,060 |
Family Income by Number of Earners in Fluvanna County
The median family income in Fluvanna County is $102,060, with families comprising 3+ earners (808) having the highest median family income of $166,774, while families with no earners (1,103) have the lowest median family income of $72,686, accounting for 10.9% and 14.8% of families, respectively.
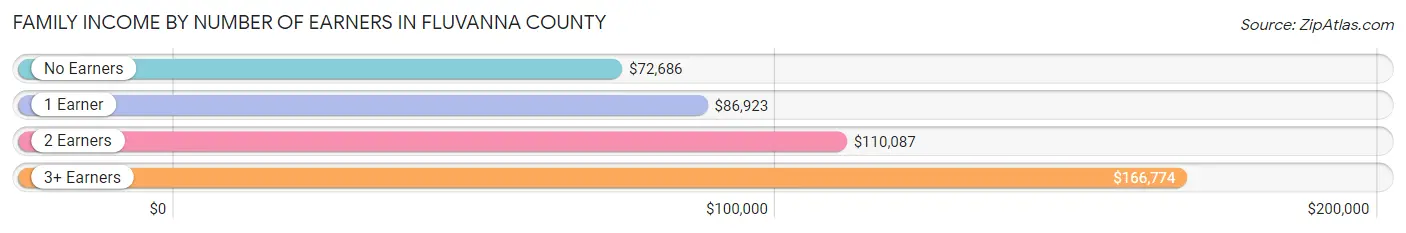
| Number of Earners | # Families | Median Income |
| No Earners | 1,103 (14.8%) | $72,686 |
| 1 Earner | 2,206 (29.7%) | $86,923 |
| 2 Earners | 3,315 (44.6%) | $110,087 |
| 3+ Earners | 808 (10.9%) | $166,774 |
| Total | 7,432 (100.0%) | $102,060 |
Household Income in Fluvanna County
Household Income Brackets in Fluvanna County
With 2,345 households falling in the category, the $100,000 to $149,999 income range is the most frequent in Fluvanna County, accounting for 23.0% of all households. In contrast, only 143 households (1.4%) fall into the $10,000 to $14,999 income bracket, making it the least populous group.
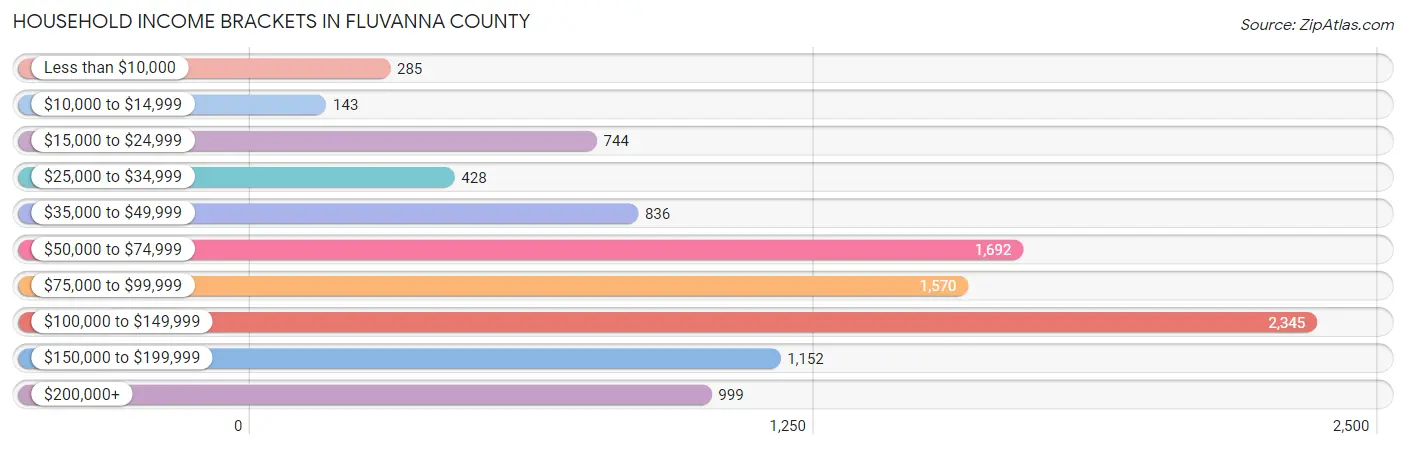
| Income Bracket | # Households | % Households |
| Less than $10,000 | 285 | 2.8% |
| $10,000 to $14,999 | 143 | 1.4% |
| $15,000 to $24,999 | 744 | 7.3% |
| $25,000 to $34,999 | 428 | 4.2% |
| $35,000 to $49,999 | 836 | 8.2% |
| $50,000 to $74,999 | 1,692 | 16.6% |
| $75,000 to $99,999 | 1,570 | 15.4% |
| $100,000 to $149,999 | 2,345 | 23.0% |
| $150,000 to $199,999 | 1,152 | 11.3% |
| $200,000+ | 999 | 9.8% |
Household Income by Householder Age in Fluvanna County
The median household income in Fluvanna County is $90,766, with the highest median household income of $105,359 found in the 45 to 64 years age bracket for the primary householder. A total of 4,109 households (40.3%) fall into this category. Meanwhile, the 15 to 24 years age bracket for the primary householder has the lowest median household income of $0, with 78 households (0.8%) in this group.
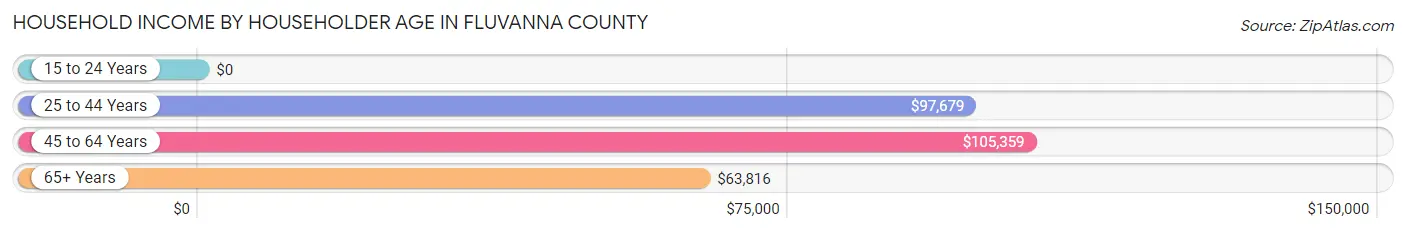
| Income Bracket | # Households | Median Income |
| 15 to 24 Years | 78 (0.8%) | $0 |
| 25 to 44 Years | 2,942 (28.9%) | $97,679 |
| 45 to 64 Years | 4,109 (40.3%) | $105,359 |
| 65+ Years | 3,066 (30.1%) | $63,816 |
| Total | 10,195 (100.0%) | $90,766 |
Poverty in Fluvanna County
Income Below Poverty by Sex and Age in Fluvanna County
With 6.9% poverty level for males and 5.3% for females among the residents of Fluvanna County, 5 year old males and 5 year old females are the most vulnerable to poverty, with 48 males (27.4%) and 30 females (14.1%) in their respective age groups living below the poverty level.
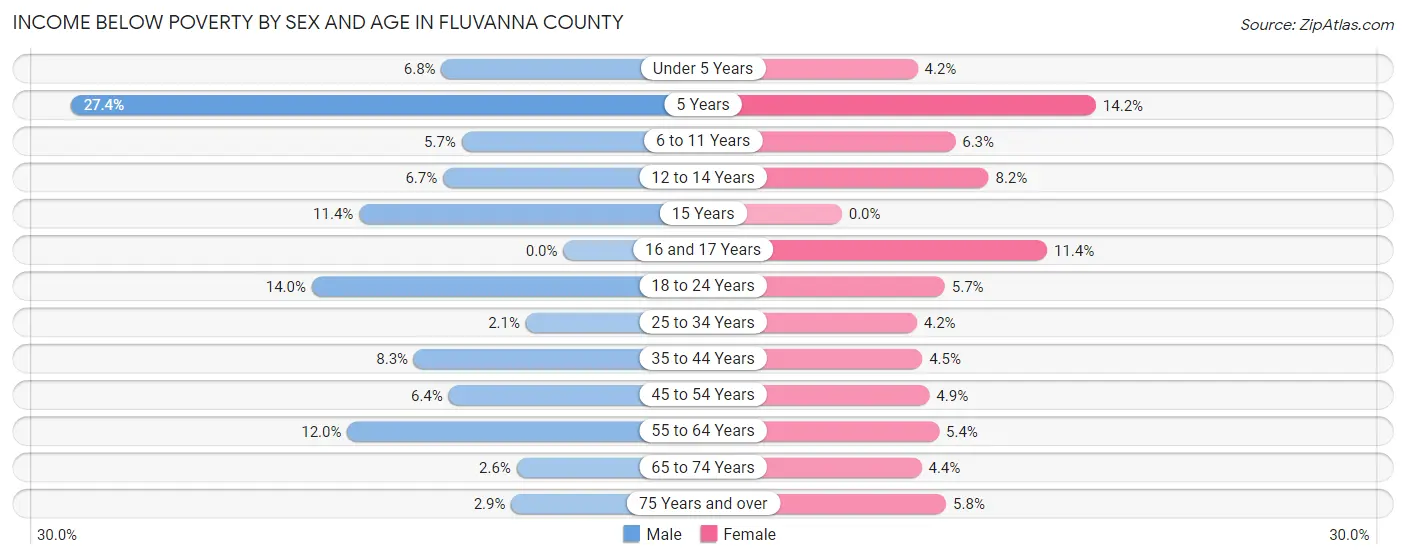
| Age Bracket | Male | Female |
| Under 5 Years | 42 (6.8%) | 26 (4.2%) |
| 5 Years | 48 (27.4%) | 30 (14.1%) |
| 6 to 11 Years | 49 (5.7%) | 46 (6.3%) |
| 12 to 14 Years | 31 (6.7%) | 25 (8.2%) |
| 15 Years | 24 (11.4%) | 0 (0.0%) |
| 16 and 17 Years | 0 (0.0%) | 36 (11.4%) |
| 18 to 24 Years | 116 (14.0%) | 51 (5.7%) |
| 25 to 34 Years | 34 (2.1%) | 75 (4.2%) |
| 35 to 44 Years | 131 (8.3%) | 64 (4.5%) |
| 45 to 54 Years | 100 (6.4%) | 82 (4.9%) |
| 55 to 64 Years | 226 (12.0%) | 107 (5.4%) |
| 65 to 74 Years | 39 (2.6%) | 78 (4.4%) |
| 75 Years and over | 31 (2.9%) | 70 (5.8%) |
| Total | 871 (6.9%) | 690 (5.3%) |
Income Above Poverty by Sex and Age in Fluvanna County
According to the poverty statistics in Fluvanna County, males aged 16 and 17 years and females aged 15 years are the age groups that are most secure financially, with 100.0% of males and 100.0% of females in these age groups living above the poverty line.
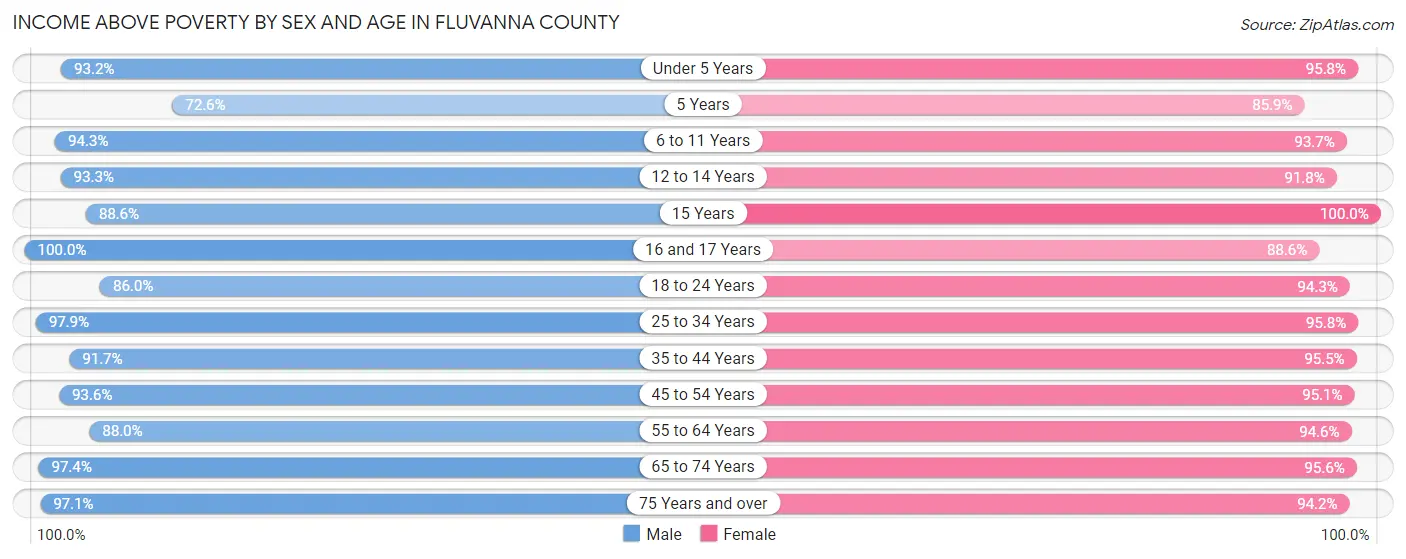
| Age Bracket | Male | Female |
| Under 5 Years | 577 (93.2%) | 590 (95.8%) |
| 5 Years | 127 (72.6%) | 182 (85.9%) |
| 6 to 11 Years | 816 (94.3%) | 682 (93.7%) |
| 12 to 14 Years | 432 (93.3%) | 281 (91.8%) |
| 15 Years | 187 (88.6%) | 156 (100.0%) |
| 16 and 17 Years | 345 (100.0%) | 279 (88.6%) |
| 18 to 24 Years | 712 (86.0%) | 838 (94.3%) |
| 25 to 34 Years | 1,589 (97.9%) | 1,720 (95.8%) |
| 35 to 44 Years | 1,443 (91.7%) | 1,366 (95.5%) |
| 45 to 54 Years | 1,464 (93.6%) | 1,600 (95.1%) |
| 55 to 64 Years | 1,653 (88.0%) | 1,868 (94.6%) |
| 65 to 74 Years | 1,460 (97.4%) | 1,678 (95.6%) |
| 75 Years and over | 1,038 (97.1%) | 1,134 (94.2%) |
| Total | 11,843 (93.1%) | 12,374 (94.7%) |
Income Below Poverty Among Married-Couple Families in Fluvanna County
The poverty statistics for married-couple families in Fluvanna County show that 3.5% or 209 of the total 5,961 families live below the poverty line. Families with 5 or more children have the highest poverty rate of 51.2%, comprising of 21 families. On the other hand, families with 1 or 2 children have the lowest poverty rate of 1.9%, which includes 39 families.
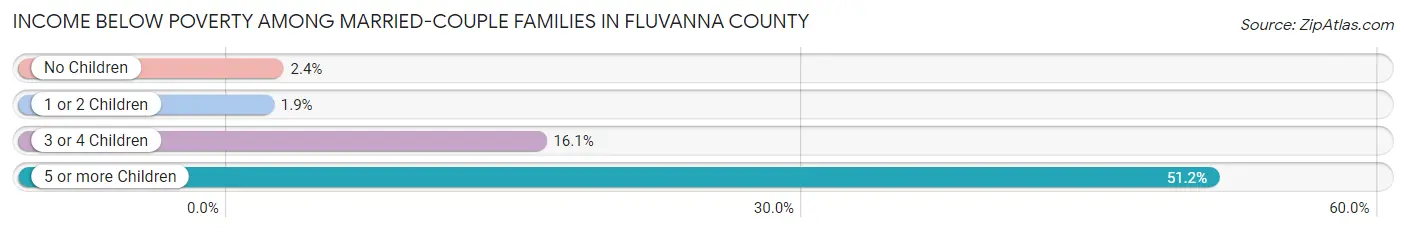
| Children | Above Poverty | Below Poverty |
| No Children | 3,329 (97.6%) | 81 (2.4%) |
| 1 or 2 Children | 2,049 (98.1%) | 39 (1.9%) |
| 3 or 4 Children | 354 (83.9%) | 68 (16.1%) |
| 5 or more Children | 20 (48.8%) | 21 (51.2%) |
| Total | 5,752 (96.5%) | 209 (3.5%) |
Income Below Poverty Among Single-Parent Households in Fluvanna County
According to the poverty data in Fluvanna County, 20.1% or 62 single-father households and 3.3% or 38 single-mother households are living below the poverty line. Among single-father households, those with no children have the highest poverty rate, with 53 households (32.1%) experiencing poverty. Likewise, among single-mother households, those with 1 or 2 children have the highest poverty rate, with 22 households (5.6%) falling below the poverty line.
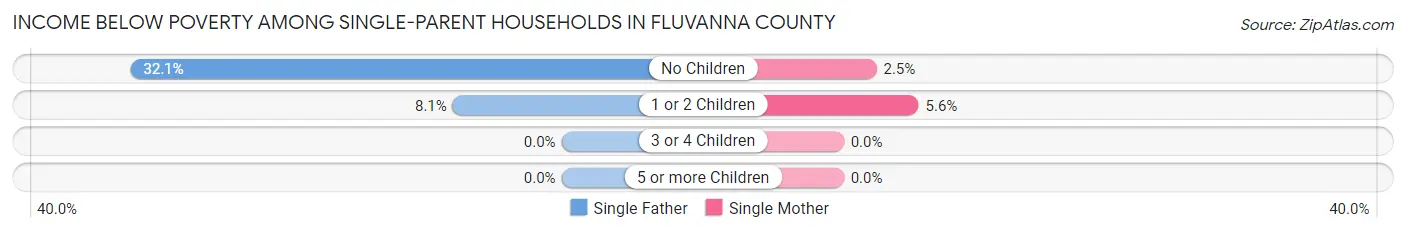
| Children | Single Father | Single Mother |
| No Children | 53 (32.1%) | 16 (2.5%) |
| 1 or 2 Children | 9 (8.1%) | 22 (5.6%) |
| 3 or 4 Children | 0 (0.0%) | 0 (0.0%) |
| 5 or more Children | 0 (0.0%) | 0 (0.0%) |
| Total | 62 (20.1%) | 38 (3.3%) |
Income Below Poverty Among Married-Couple vs Single-Parent Households in Fluvanna County
The poverty data for Fluvanna County shows that 209 of the married-couple family households (3.5%) and 100 of the single-parent households (6.8%) are living below the poverty level. Within the married-couple family households, those with 5 or more children have the highest poverty rate, with 21 households (51.2%) falling below the poverty line. Among the single-parent households, those with no children have the highest poverty rate, with 69 household (8.4%) living below poverty.
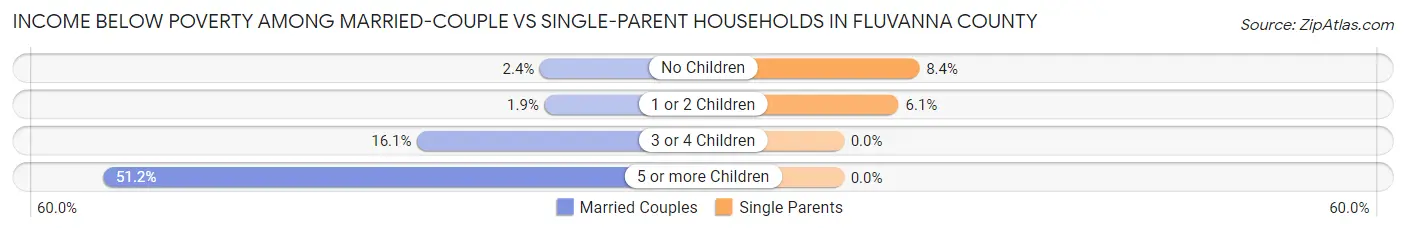
| Children | Married-Couple Families | Single-Parent Households |
| No Children | 81 (2.4%) | 69 (8.4%) |
| 1 or 2 Children | 39 (1.9%) | 31 (6.1%) |
| 3 or 4 Children | 68 (16.1%) | 0 (0.0%) |
| 5 or more Children | 21 (51.2%) | 0 (0.0%) |
| Total | 209 (3.5%) | 100 (6.8%) |
Race in Fluvanna County
The most populous races in Fluvanna County are White / Caucasian (21,205 | 77.3%), Black / African American (3,559 | 13.0%), and Two or more Races (1,712 | 6.2%).
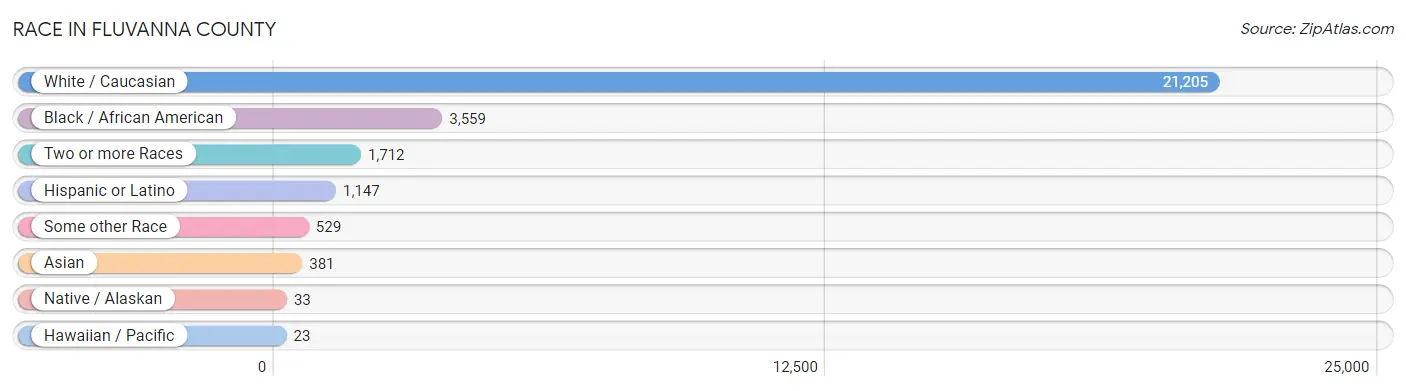
| Race | # Population | % Population |
| Asian | 381 | 1.4% |
| Black / African American | 3,559 | 13.0% |
| Hawaiian / Pacific | 23 | 0.1% |
| Hispanic or Latino | 1,147 | 4.2% |
| Native / Alaskan | 33 | 0.1% |
| White / Caucasian | 21,205 | 77.3% |
| Two or more Races | 1,712 | 6.2% |
| Some other Race | 529 | 1.9% |
| Total | 27,442 | 100.0% |
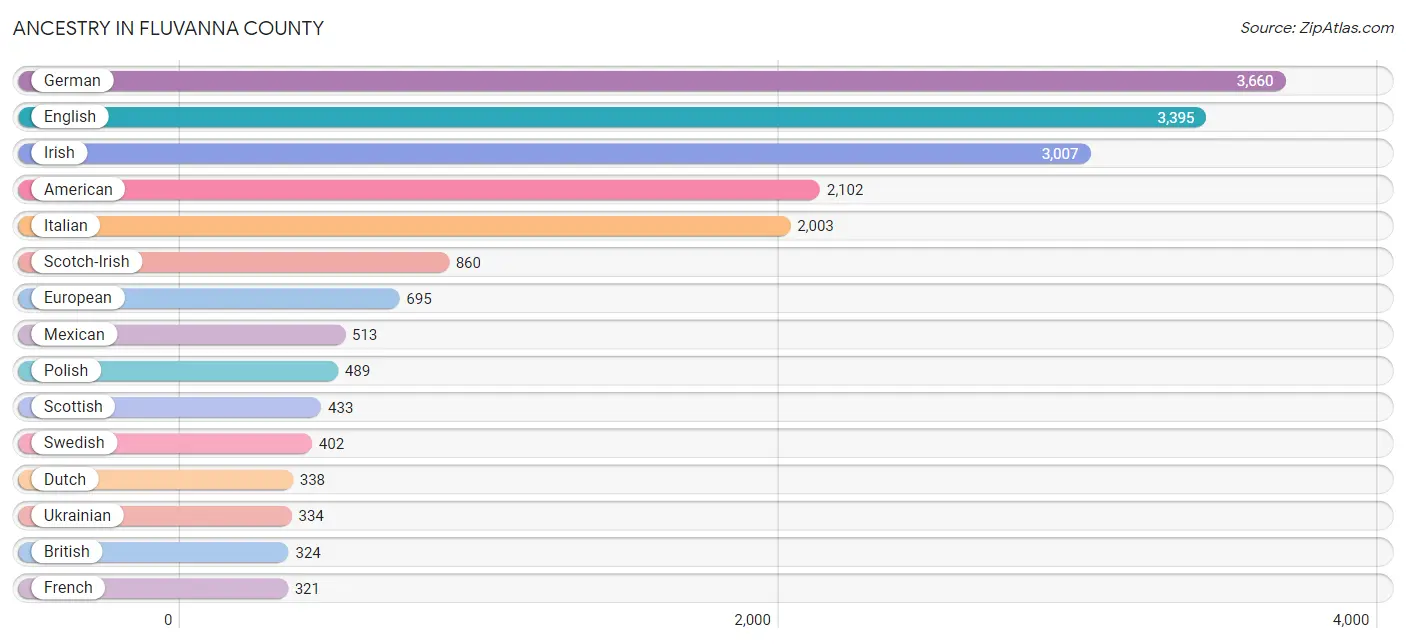
Ancestry in Fluvanna County
The most populous ancestries reported in Fluvanna County are German (3,660 | 13.3%), English (3,395 | 12.4%), Irish (3,007 | 11.0%), American (2,102 | 7.7%), and Italian (2,003 | 7.3%), together accounting for 51.6% of all Fluvanna County residents.
| Ancestry | # Population | % Population |
| African | 137 | 0.5% |
| Albanian | 80 | 0.3% |
| American | 2,102 | 7.7% |
| Apache | 3 | 0.0% |
| Arab | 13 | 0.1% |
| Austrian | 7 | 0.0% |
| Belgian | 8 | 0.0% |
| Bhutanese | 152 | 0.5% |
| British | 324 | 1.2% |
| Burmese | 163 | 0.6% |
| Canadian | 80 | 0.3% |
| Central American | 128 | 0.5% |
| Central American Indian | 32 | 0.1% |
| Cherokee | 180 | 0.7% |
| Choctaw | 15 | 0.1% |
| Costa Rican | 8 | 0.0% |
| Cuban | 16 | 0.1% |
| Cypriot | 12 | 0.0% |
| Czech | 21 | 0.1% |
| Danish | 119 | 0.4% |
| Dominican | 49 | 0.2% |
| Dutch | 338 | 1.2% |
| Eastern European | 21 | 0.1% |
| English | 3,395 | 12.4% |
| European | 695 | 2.5% |
| Finnish | 12 | 0.0% |
| French | 321 | 1.2% |
| French American Indian | 11 | 0.0% |
| French Canadian | 170 | 0.6% |
| German | 3,660 | 13.3% |
| Greek | 203 | 0.7% |
| Guatemalan | 22 | 0.1% |
| Haitian | 32 | 0.1% |
| Hungarian | 139 | 0.5% |
| Indian (Asian) | 106 | 0.4% |
| Irish | 3,007 | 11.0% |
| Italian | 2,003 | 7.3% |
| Kenyan | 4 | 0.0% |
| Korean | 147 | 0.5% |
| Lithuanian | 64 | 0.2% |
| Maltese | 10 | 0.0% |
| Mexican | 513 | 1.9% |
| Native Hawaiian | 16 | 0.1% |
| Northern European | 7 | 0.0% |
| Norwegian | 167 | 0.6% |
| Pakistani | 10 | 0.0% |
| Palestinian | 13 | 0.1% |
| Polish | 489 | 1.8% |
| Portuguese | 9 | 0.0% |
| Puerto Rican | 286 | 1.0% |
| Romanian | 19 | 0.1% |
| Russian | 259 | 0.9% |
| Salvadoran | 98 | 0.4% |
| Samoan | 39 | 0.1% |
| Scandinavian | 192 | 0.7% |
| Scotch-Irish | 860 | 3.1% |
| Scottish | 433 | 1.6% |
| Slovene | 16 | 0.1% |
| Spaniard | 93 | 0.3% |
| Subsaharan African | 141 | 0.5% |
| Swedish | 402 | 1.5% |
| Thai | 27 | 0.1% |
| Ukrainian | 334 | 1.2% |
| Welsh | 317 | 1.2% |
| Yugoslavian | 13 | 0.1% | View All 65 Rows |
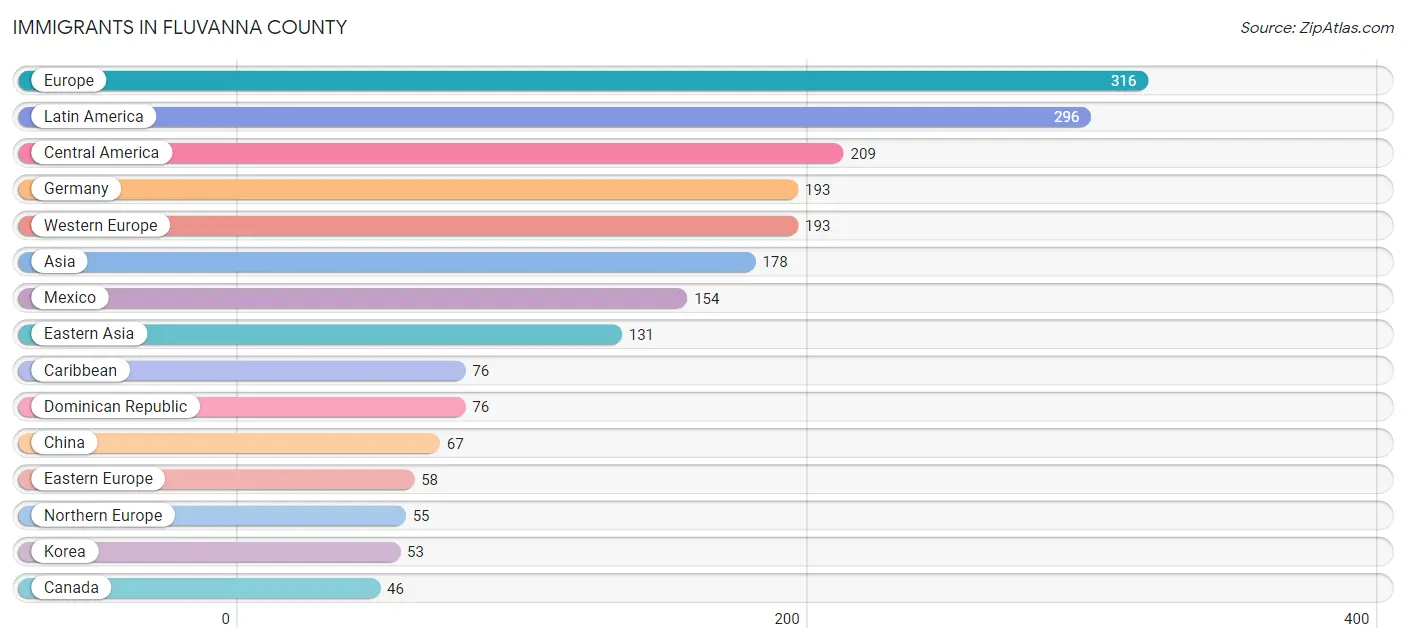
Immigrants in Fluvanna County
The most numerous immigrant groups reported in Fluvanna County came from Europe (316 | 1.1%), Latin America (296 | 1.1%), Central America (209 | 0.8%), Germany (193 | 0.7%), and Western Europe (193 | 0.7%), together accounting for 4.4% of all Fluvanna County residents.
| Immigration Origin | # Population | % Population |
| Africa | 8 | 0.0% |
| Asia | 178 | 0.6% |
| Bosnia and Herzegovina | 13 | 0.1% |
| Canada | 46 | 0.2% |
| Caribbean | 76 | 0.3% |
| Central America | 209 | 0.8% |
| Chile | 11 | 0.0% |
| China | 67 | 0.2% |
| Denmark | 20 | 0.1% |
| Dominican Republic | 76 | 0.3% |
| Eastern Africa | 8 | 0.0% |
| Eastern Asia | 131 | 0.5% |
| Eastern Europe | 58 | 0.2% |
| El Salvador | 33 | 0.1% |
| England | 13 | 0.1% |
| Ethiopia | 4 | 0.0% |
| Europe | 316 | 1.1% |
| Germany | 193 | 0.7% |
| Guatemala | 22 | 0.1% |
| Japan | 11 | 0.0% |
| Kenya | 4 | 0.0% |
| Korea | 53 | 0.2% |
| Latin America | 296 | 1.1% |
| Mexico | 154 | 0.6% |
| Northern Europe | 55 | 0.2% |
| Philippines | 24 | 0.1% |
| Romania | 10 | 0.0% |
| Russia | 1 | 0.0% |
| South America | 11 | 0.0% |
| South Eastern Asia | 34 | 0.1% |
| Southern Europe | 10 | 0.0% |
| Thailand | 10 | 0.0% |
| Western Europe | 193 | 0.7% | View All 33 Rows |
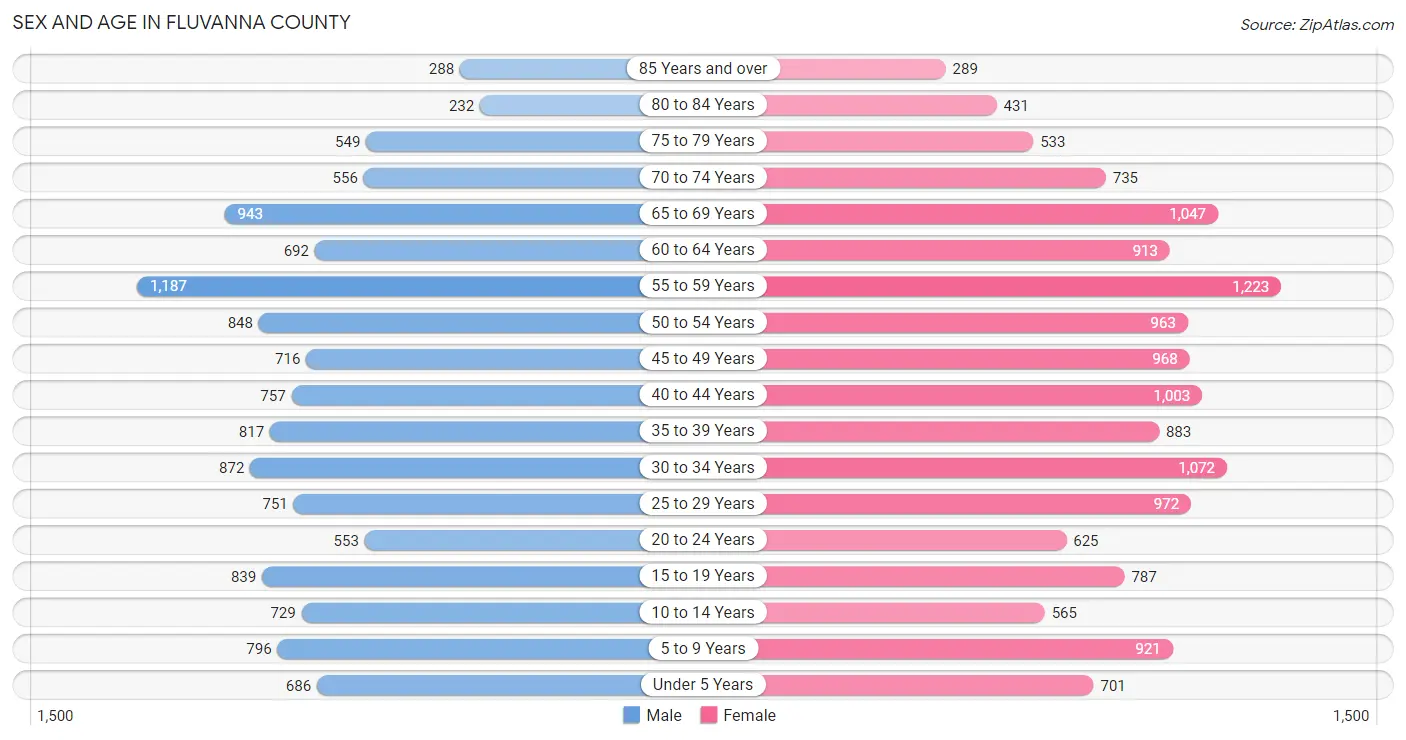
Sex and Age in Fluvanna County
Sex and Age in Fluvanna County
The most populous age groups in Fluvanna County are 55 to 59 Years (1,187 | 9.3%) for men and 55 to 59 Years (1,223 | 8.4%) for women.
| Age Bracket | Male | Female |
| Under 5 Years | 686 (5.3%) | 701 (4.8%) |
| 5 to 9 Years | 796 (6.2%) | 921 (6.3%) |
| 10 to 14 Years | 729 (5.7%) | 565 (3.9%) |
| 15 to 19 Years | 839 (6.6%) | 787 (5.4%) |
| 20 to 24 Years | 553 (4.3%) | 625 (4.3%) |
| 25 to 29 Years | 751 (5.9%) | 972 (6.6%) |
| 30 to 34 Years | 872 (6.8%) | 1,072 (7.3%) |
| 35 to 39 Years | 817 (6.4%) | 883 (6.0%) |
| 40 to 44 Years | 757 (5.9%) | 1,003 (6.9%) |
| 45 to 49 Years | 716 (5.6%) | 968 (6.6%) |
| 50 to 54 Years | 848 (6.6%) | 963 (6.6%) |
| 55 to 59 Years | 1,187 (9.3%) | 1,223 (8.4%) |
| 60 to 64 Years | 692 (5.4%) | 913 (6.2%) |
| 65 to 69 Years | 943 (7.4%) | 1,047 (7.2%) |
| 70 to 74 Years | 556 (4.3%) | 735 (5.0%) |
| 75 to 79 Years | 549 (4.3%) | 533 (3.6%) |
| 80 to 84 Years | 232 (1.8%) | 431 (2.9%) |
| 85 Years and over | 288 (2.2%) | 289 (2.0%) |
| Total | 12,811 (100.0%) | 14,631 (100.0%) |
Families and Households in Fluvanna County
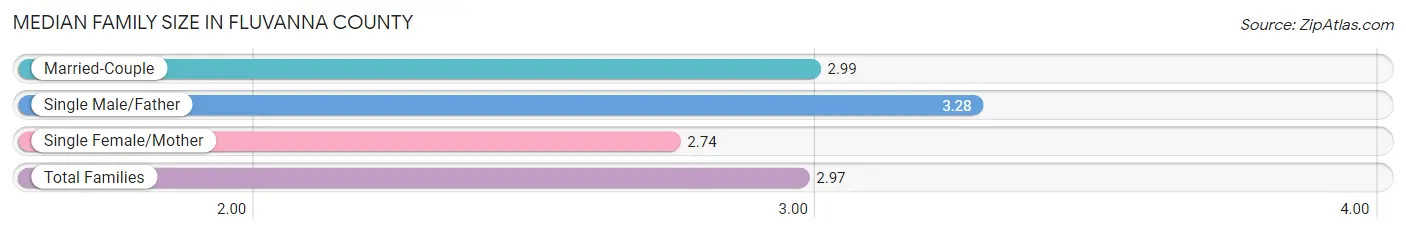
Median Family Size in Fluvanna County
The median family size in Fluvanna County is 2.97 persons per family, with single male/father families (309 | 4.2%) accounting for the largest median family size of 3.28 persons per family. On the other hand, single female/mother families (1,162 | 15.6%) represent the smallest median family size with 2.74 persons per family.
| Family Type | # Families | Family Size |
| Married-Couple | 5,961 (80.2%) | 2.99 |
| Single Male/Father | 309 (4.2%) | 3.28 |
| Single Female/Mother | 1,162 (15.6%) | 2.74 |
| Total Families | 7,432 (100.0%) | 2.97 |
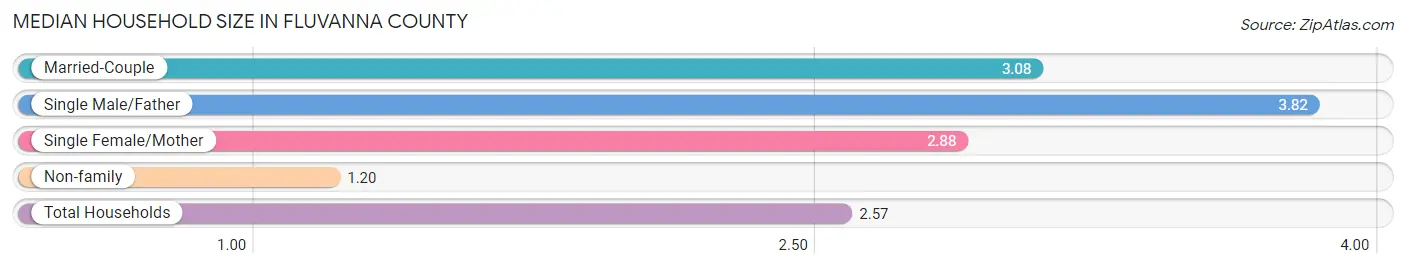
Median Household Size in Fluvanna County
The median household size in Fluvanna County is 2.57 persons per household, with single male/father households (309 | 3.0%) accounting for the largest median household size of 3.82 persons per household. non-family households (2,763 | 27.1%) represent the smallest median household size with 1.20 persons per household.
| Household Type | # Households | Household Size |
| Married-Couple | 5,961 (58.5%) | 3.08 |
| Single Male/Father | 309 (3.0%) | 3.82 |
| Single Female/Mother | 1,162 (11.4%) | 2.88 |
| Non-family | 2,763 (27.1%) | 1.20 |
| Total Households | 10,195 (100.0%) | 2.57 |
Household Size by Marriage Status in Fluvanna County
Out of a total of 10,195 households in Fluvanna County, 7,432 (72.9%) are family households, while 2,763 (27.1%) are nonfamily households. The most numerous type of family households are 2-person households, comprising 3,592, and the most common type of nonfamily households are 1-person households, comprising 2,338.
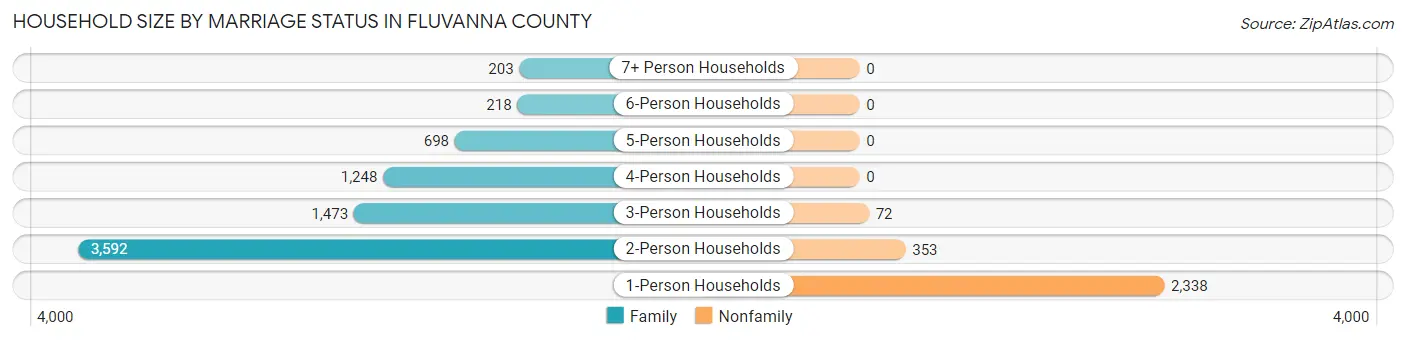
| Household Size | Family Households | Nonfamily Households |
| 1-Person Households | - | 2,338 (22.9%) |
| 2-Person Households | 3,592 (35.2%) | 353 (3.5%) |
| 3-Person Households | 1,473 (14.4%) | 72 (0.7%) |
| 4-Person Households | 1,248 (12.2%) | 0 (0.0%) |
| 5-Person Households | 698 (6.9%) | 0 (0.0%) |
| 6-Person Households | 218 (2.1%) | 0 (0.0%) |
| 7+ Person Households | 203 (2.0%) | 0 (0.0%) |
| Total | 7,432 (72.9%) | 2,763 (27.1%) |
Female Fertility in Fluvanna County
Fertility by Age in Fluvanna County
Average fertility rate in Fluvanna County is 41.0 births per 1,000 women. Women in the age bracket of 20 to 34 years have the highest fertility rate with 93.0 births per 1,000 women. Women in the age bracket of 20 to 34 years acount for 92.9% of all women with births.
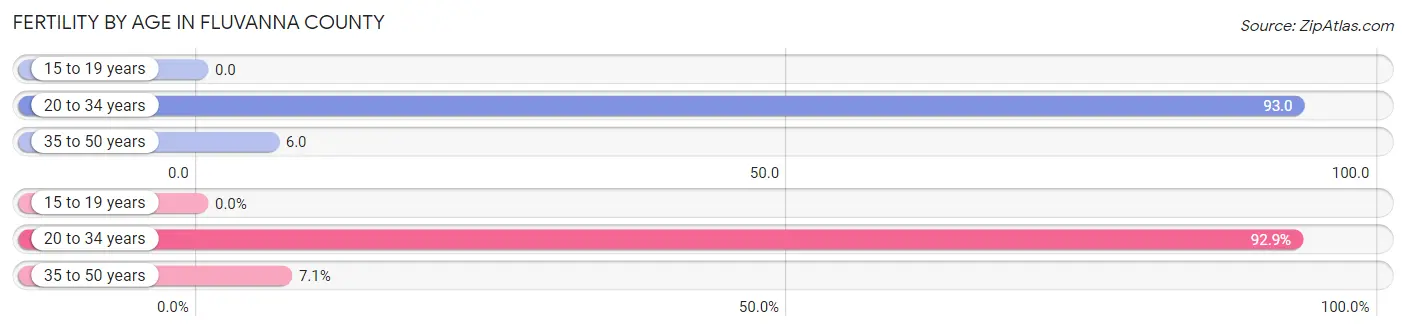
| Age Bracket | Women with Births | Births / 1,000 Women |
| 15 to 19 years | 0 (0.0%) | 0.0 |
| 20 to 34 years | 248 (92.9%) | 93.0 |
| 35 to 50 years | 19 (7.1%) | 6.0 |
| Total | 267 (100.0%) | 41.0 |
Fertility by Age by Marriage Status in Fluvanna County
86.1% of women with births (267) in Fluvanna County are married. The highest percentage of unmarried women with births falls into 35 to 50 years age bracket with 31.6% of them unmarried at the time of birth, while the lowest percentage of unmarried women with births belong to 20 to 34 years age bracket with 12.5% of them unmarried.
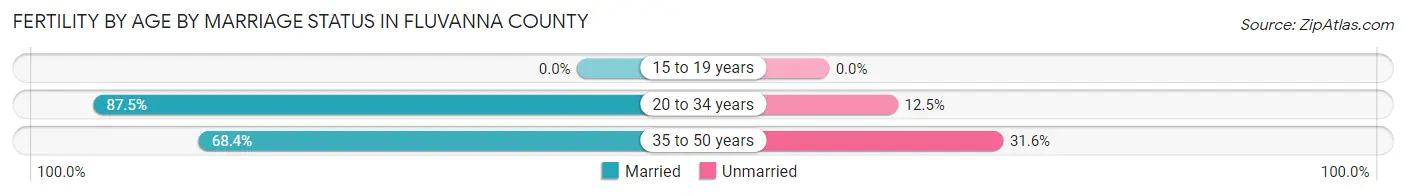
| Age Bracket | Married | Unmarried |
| 15 to 19 years | 0 (0.0%) | 0 (0.0%) |
| 20 to 34 years | 217 (87.5%) | 31 (12.5%) |
| 35 to 50 years | 13 (68.4%) | 6 (31.6%) |
| Total | 230 (86.1%) | 37 (13.9%) |
Fertility by Education in Fluvanna County
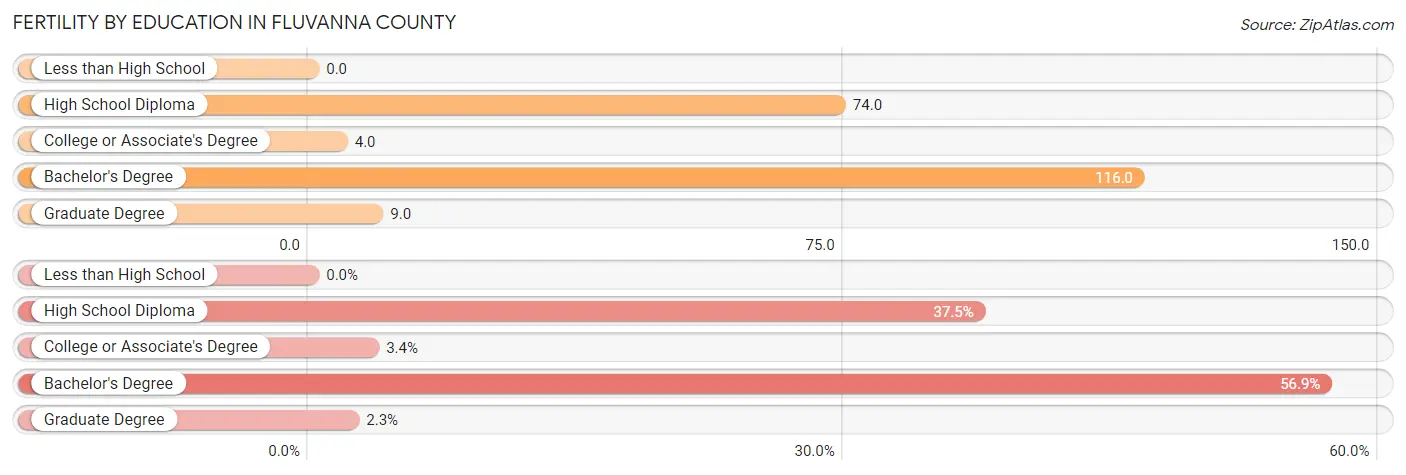
| Educational Attainment | Women with Births | Births / 1,000 Women |
| Less than High School | 0 (0.0%) | 0.0 |
| High School Diploma | 100 (37.4%) | 74.0 |
| College or Associate's Degree | 9 (3.4%) | 4.0 |
| Bachelor's Degree | 152 (56.9%) | 116.0 |
| Graduate Degree | 6 (2.2%) | 9.0 |
| Total | 267 (100.0%) | 41.0 |
Fertility by Education by Marriage Status in Fluvanna County
13.9% of women with births in Fluvanna County are unmarried. Women with the educational attainment of bachelor's degree are most likely to be married with 100.0% of them married at childbirth, while women with the educational attainment of college or associate's degree are least likely to be married with 100.0% of them unmarried at childbirth.
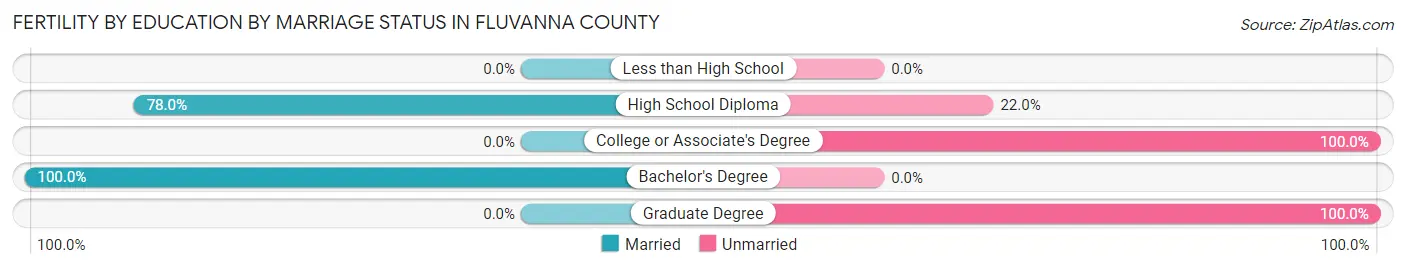
| Educational Attainment | Married | Unmarried |
| Less than High School | 0 (0.0%) | 0 (0.0%) |
| High School Diploma | 78 (78.0%) | 22 (22.0%) |
| College or Associate's Degree | 0 (0.0%) | 9 (100.0%) |
| Bachelor's Degree | 152 (100.0%) | 0 (0.0%) |
| Graduate Degree | 0 (0.0%) | 6 (100.0%) |
| Total | 230 (86.1%) | 37 (13.9%) |
Employment Characteristics in Fluvanna County
Employment by Class of Employer in Fluvanna County
Among the 13,164 employed individuals in Fluvanna County, private company employees (7,973 | 60.6%), local government employees (1,323 | 10.1%), and state government employees (1,207 | 9.2%) make up the most common classes of employment.
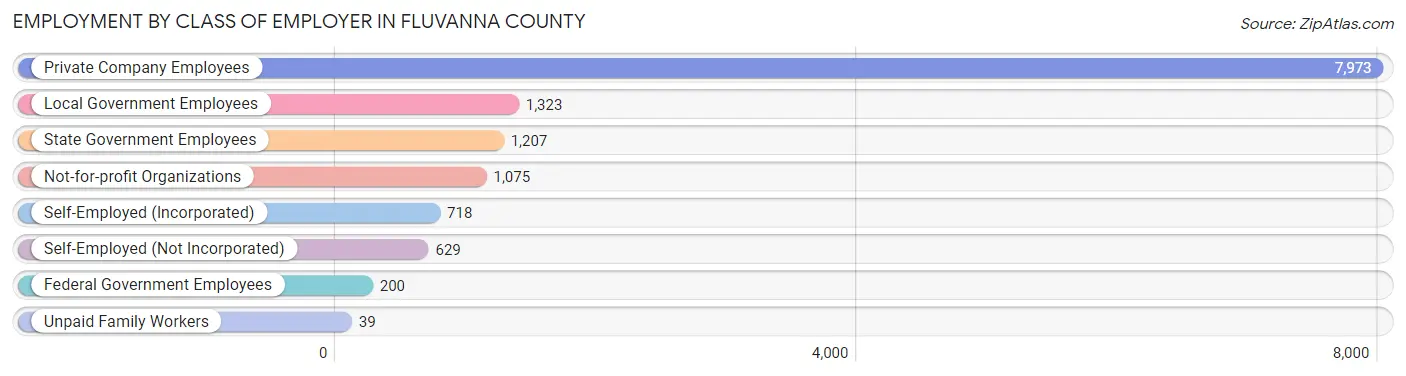
| Employer Class | # Employees | % Employees |
| Private Company Employees | 7,973 | 60.6% |
| Self-Employed (Incorporated) | 718 | 5.4% |
| Self-Employed (Not Incorporated) | 629 | 4.8% |
| Not-for-profit Organizations | 1,075 | 8.2% |
| Local Government Employees | 1,323 | 10.1% |
| State Government Employees | 1,207 | 9.2% |
| Federal Government Employees | 200 | 1.5% |
| Unpaid Family Workers | 39 | 0.3% |
| Total | 13,164 | 100.0% |
Employment Status by Age in Fluvanna County
According to the labor force statistics for Fluvanna County, out of the total population over 16 years of age (22,677), 61.0% or 13,833 individuals are in the labor force, with 3.0% or 415 of them unemployed. The age group with the highest labor force participation rate is 20 to 24 years, with 86.1% or 1,014 individuals in the labor force. Within the labor force, the 30 to 34 years age range has the highest percentage of unemployed individuals, with 9.0% or 133 of them being unemployed.
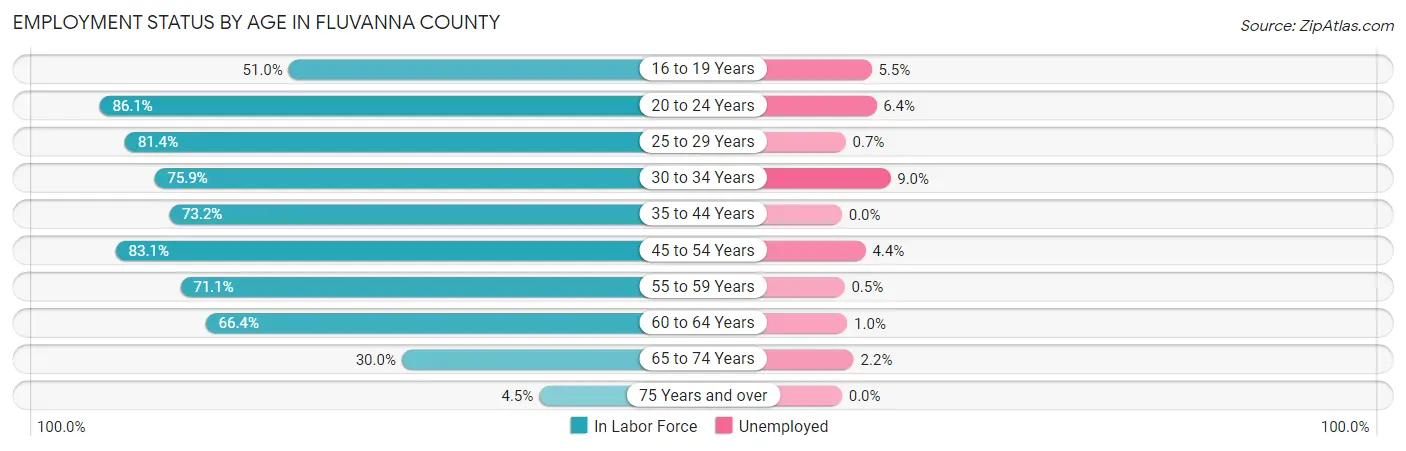
| Age Bracket | In Labor Force | Unemployed |
| 16 to 19 Years | 642 (51.0%) | 35 (5.5%) |
| 20 to 24 Years | 1,014 (86.1%) | 65 (6.4%) |
| 25 to 29 Years | 1,403 (81.4%) | 10 (0.7%) |
| 30 to 34 Years | 1,475 (75.9%) | 133 (9.0%) |
| 35 to 44 Years | 2,533 (73.2%) | 0 (0.0%) |
| 45 to 54 Years | 2,904 (83.1%) | 128 (4.4%) |
| 55 to 59 Years | 1,714 (71.1%) | 9 (0.5%) |
| 60 to 64 Years | 1,066 (66.4%) | 11 (1.0%) |
| 65 to 74 Years | 984 (30.0%) | 22 (2.2%) |
| 75 Years and over | 104 (4.5%) | 0 (0.0%) |
| Total | 13,833 (61.0%) | 415 (3.0%) |
Employment Status by Educational Attainment in Fluvanna County
According to labor force statistics for Fluvanna County, 75.8% of individuals (11,095) out of the total population between 25 and 64 years of age (14,637) are in the labor force, with 2.6% or 288 of them being unemployed. The group with the highest labor force participation rate are those with the educational attainment of bachelor's degree or higher, with 84.4% or 4,464 individuals in the labor force. Within the labor force, individuals with college / associate degree education have the highest percentage of unemployment, with 3.8% or 144 of them being unemployed.
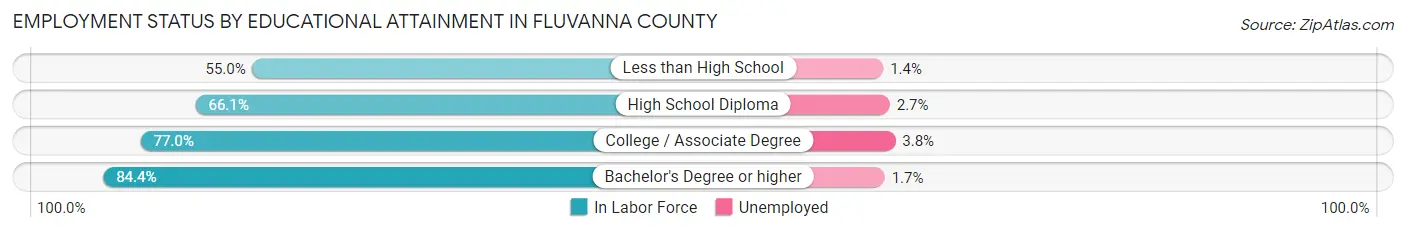
| Educational Attainment | In Labor Force | Unemployed |
| Less than High School | 415 (55.0%) | 11 (1.4%) |
| High School Diploma | 2,436 (66.1%) | 99 (2.7%) |
| College / Associate Degree | 3,779 (77.0%) | 187 (3.8%) |
| Bachelor's Degree or higher | 4,464 (84.4%) | 90 (1.7%) |
| Total | 11,095 (75.8%) | 381 (2.6%) |
Employment Occupations by Sex in Fluvanna County
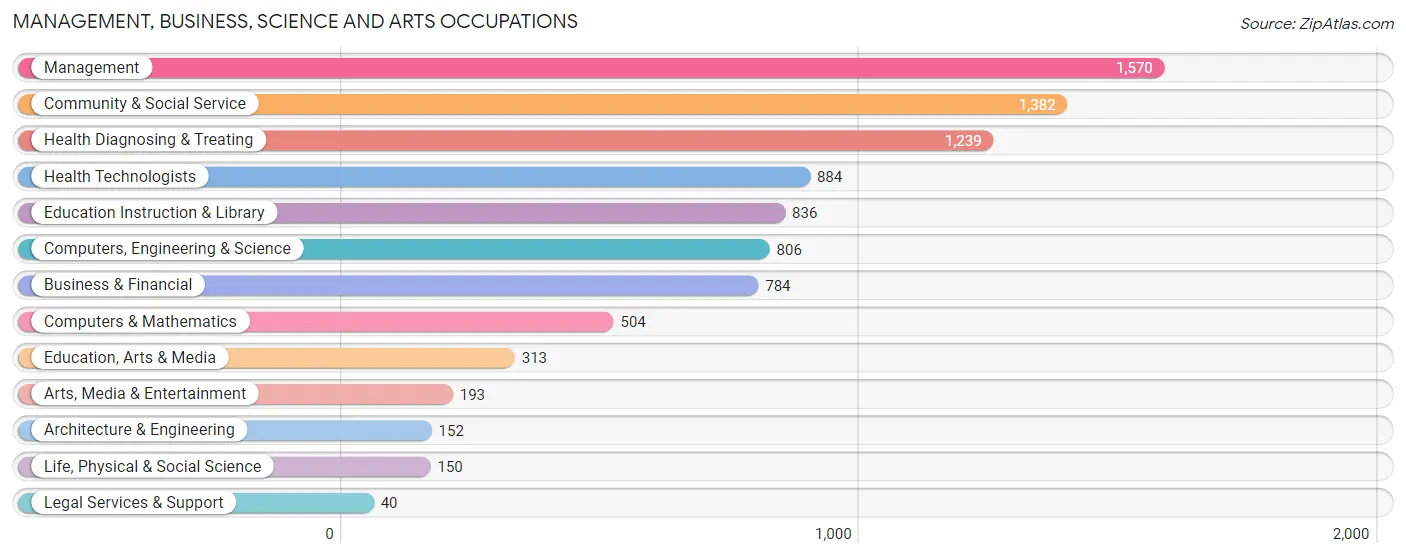
Management, Business, Science and Arts Occupations
The most common Management, Business, Science and Arts occupations in Fluvanna County are Management (1,570 | 11.7%), Community & Social Service (1,382 | 10.3%), Health Diagnosing & Treating (1,239 | 9.3%), Health Technologists (884 | 6.6%), and Education Instruction & Library (836 | 6.2%).
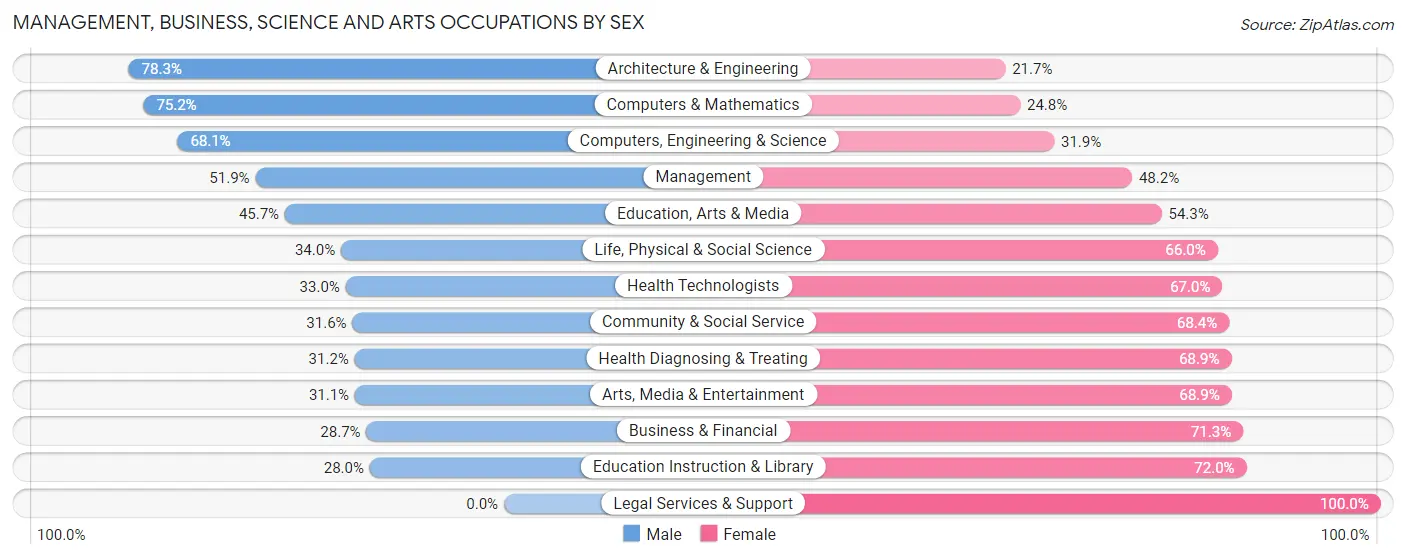
Management, Business, Science and Arts Occupations by Sex
Within the Management, Business, Science and Arts occupations in Fluvanna County, the most male-oriented occupations are Architecture & Engineering (78.3%), Computers & Mathematics (75.2%), and Computers, Engineering & Science (68.1%), while the most female-oriented occupations are Legal Services & Support (100.0%), Education Instruction & Library (72.0%), and Business & Financial (71.3%).
| Occupation | Male | Female |
| Management | 814 (51.8%) | 756 (48.1%) |
| Business & Financial | 225 (28.7%) | 559 (71.3%) |
| Computers, Engineering & Science | 549 (68.1%) | 257 (31.9%) |
| Computers & Mathematics | 379 (75.2%) | 125 (24.8%) |
| Architecture & Engineering | 119 (78.3%) | 33 (21.7%) |
| Life, Physical & Social Science | 51 (34.0%) | 99 (66.0%) |
| Community & Social Service | 437 (31.6%) | 945 (68.4%) |
| Education, Arts & Media | 143 (45.7%) | 170 (54.3%) |
| Legal Services & Support | 0 (0.0%) | 40 (100.0%) |
| Education Instruction & Library | 234 (28.0%) | 602 (72.0%) |
| Arts, Media & Entertainment | 60 (31.1%) | 133 (68.9%) |
| Health Diagnosing & Treating | 386 (31.1%) | 853 (68.9%) |
| Health Technologists | 292 (33.0%) | 592 (67.0%) |
| Total (Category) | 2,411 (41.7%) | 3,370 (58.3%) |
| Total (Overall) | 6,891 (51.5%) | 6,488 (48.5%) |
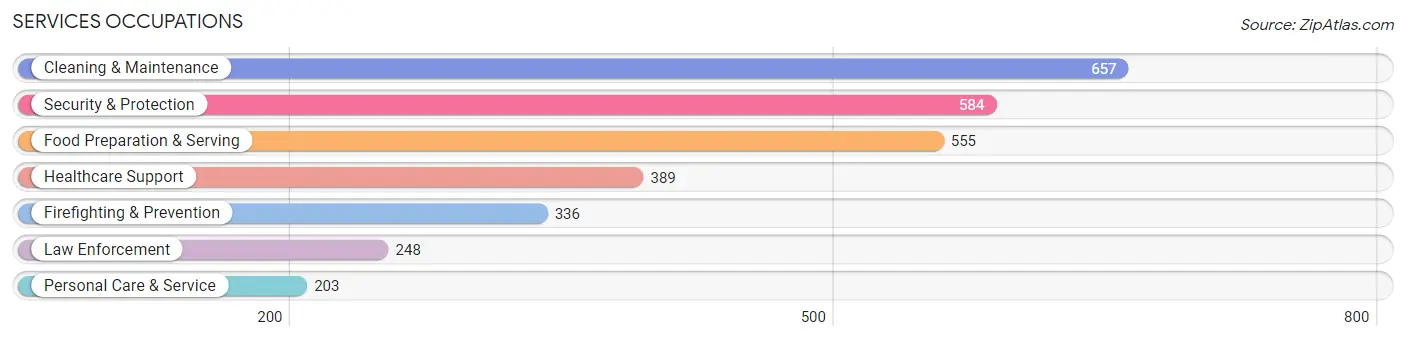
Services Occupations
The most common Services occupations in Fluvanna County are Cleaning & Maintenance (657 | 4.9%), Security & Protection (584 | 4.4%), Food Preparation & Serving (555 | 4.2%), Healthcare Support (389 | 2.9%), and Firefighting & Prevention (336 | 2.5%).
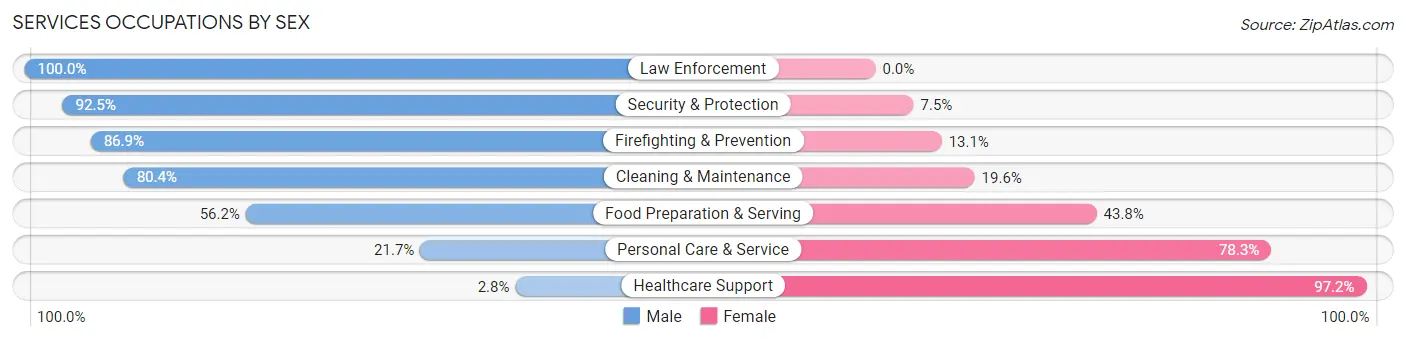
Services Occupations by Sex
Within the Services occupations in Fluvanna County, the most male-oriented occupations are Law Enforcement (100.0%), Security & Protection (92.5%), and Firefighting & Prevention (86.9%), while the most female-oriented occupations are Healthcare Support (97.2%), Personal Care & Service (78.3%), and Food Preparation & Serving (43.8%).
| Occupation | Male | Female |
| Healthcare Support | 11 (2.8%) | 378 (97.2%) |
| Security & Protection | 540 (92.5%) | 44 (7.5%) |
| Firefighting & Prevention | 292 (86.9%) | 44 (13.1%) |
| Law Enforcement | 248 (100.0%) | 0 (0.0%) |
| Food Preparation & Serving | 312 (56.2%) | 243 (43.8%) |
| Cleaning & Maintenance | 528 (80.4%) | 129 (19.6%) |
| Personal Care & Service | 44 (21.7%) | 159 (78.3%) |
| Total (Category) | 1,435 (60.1%) | 953 (39.9%) |
| Total (Overall) | 6,891 (51.5%) | 6,488 (48.5%) |
Sales and Office Occupations
The most common Sales and Office occupations in Fluvanna County are Office & Administration (1,458 | 10.9%), and Sales & Related (1,025 | 7.7%).

Sales and Office Occupations by Sex

| Occupation | Male | Female |
| Sales & Related | 472 (46.1%) | 553 (53.9%) |
| Office & Administration | 146 (10.0%) | 1,312 (90.0%) |
| Total (Category) | 618 (24.9%) | 1,865 (75.1%) |
| Total (Overall) | 6,891 (51.5%) | 6,488 (48.5%) |
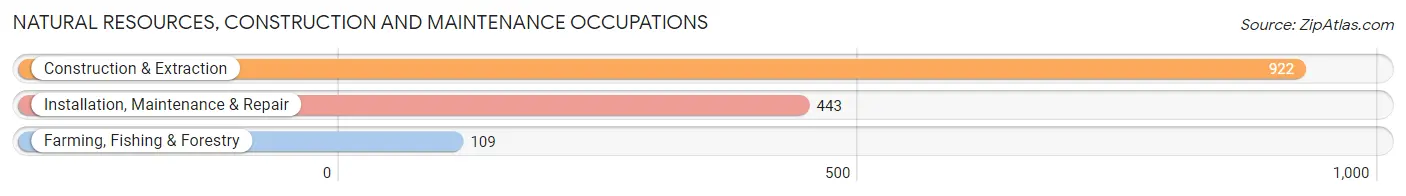
Natural Resources, Construction and Maintenance Occupations
The most common Natural Resources, Construction and Maintenance occupations in Fluvanna County are Construction & Extraction (922 | 6.9%), Installation, Maintenance & Repair (443 | 3.3%), and Farming, Fishing & Forestry (109 | 0.8%).
Natural Resources, Construction and Maintenance Occupations by Sex
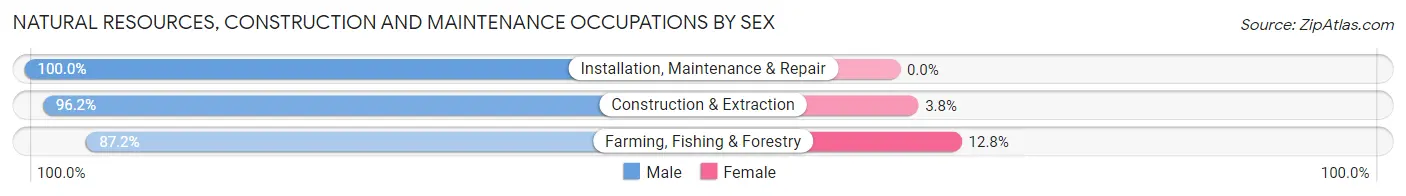
| Occupation | Male | Female |
| Farming, Fishing & Forestry | 95 (87.2%) | 14 (12.8%) |
| Construction & Extraction | 887 (96.2%) | 35 (3.8%) |
| Installation, Maintenance & Repair | 443 (100.0%) | 0 (0.0%) |
| Total (Category) | 1,425 (96.7%) | 49 (3.3%) |
| Total (Overall) | 6,891 (51.5%) | 6,488 (48.5%) |
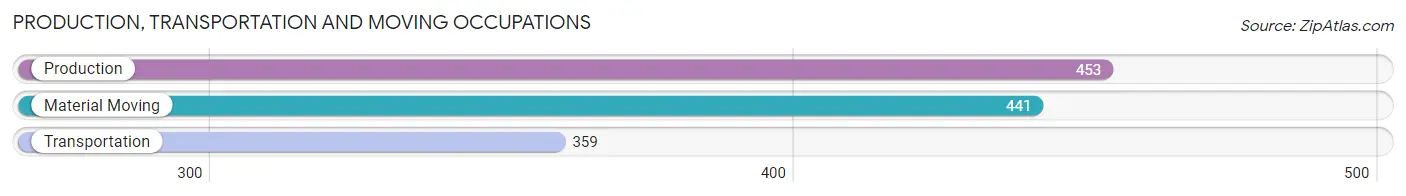
Production, Transportation and Moving Occupations
The most common Production, Transportation and Moving occupations in Fluvanna County are Production (453 | 3.4%), Material Moving (441 | 3.3%), and Transportation (359 | 2.7%).
Production, Transportation and Moving Occupations by Sex
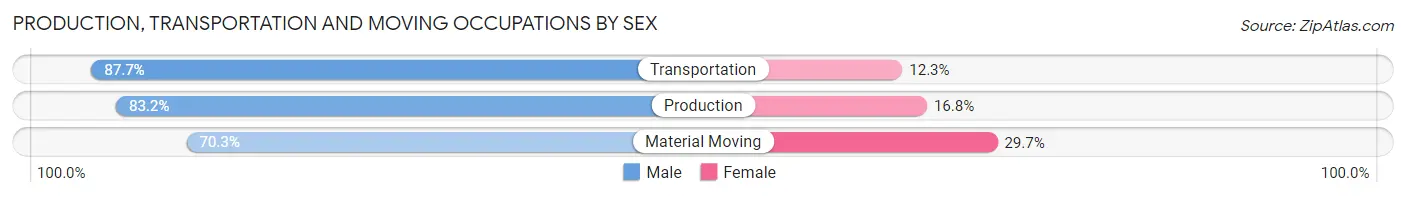
| Occupation | Male | Female |
| Production | 377 (83.2%) | 76 (16.8%) |
| Transportation | 315 (87.7%) | 44 (12.3%) |
| Material Moving | 310 (70.3%) | 131 (29.7%) |
| Total (Category) | 1,002 (80.0%) | 251 (20.0%) |
| Total (Overall) | 6,891 (51.5%) | 6,488 (48.5%) |
Employment Industries by Sex in Fluvanna County
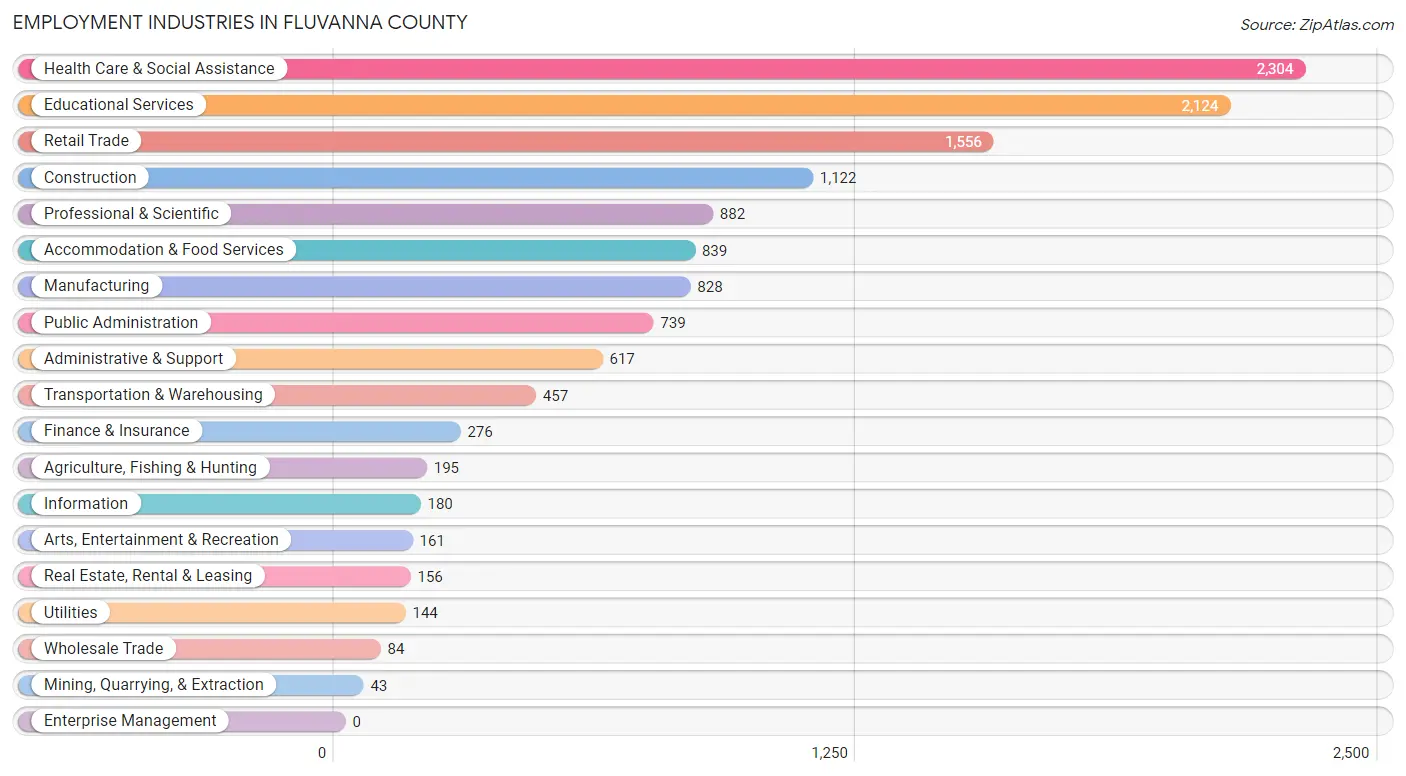
Employment Industries in Fluvanna County
The major employment industries in Fluvanna County include Health Care & Social Assistance (2,304 | 17.2%), Educational Services (2,124 | 15.9%), Retail Trade (1,556 | 11.6%), Construction (1,122 | 8.4%), and Professional & Scientific (882 | 6.6%).
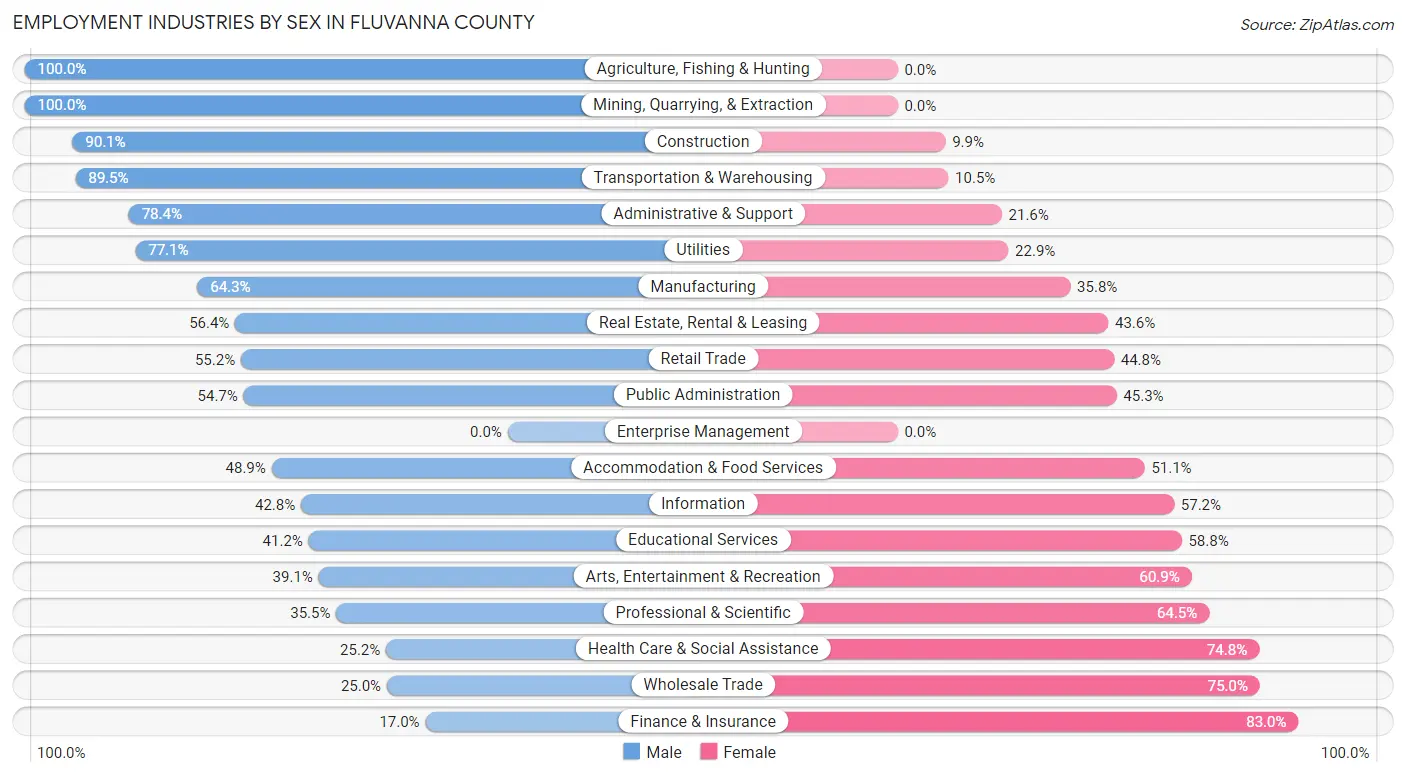
Employment Industries by Sex in Fluvanna County
The Fluvanna County industries that see more men than women are Agriculture, Fishing & Hunting (100.0%), Mining, Quarrying, & Extraction (100.0%), and Construction (90.1%), whereas the industries that tend to have a higher number of women are Finance & Insurance (83.0%), Wholesale Trade (75.0%), and Health Care & Social Assistance (74.8%).
| Industry | Male | Female |
| Agriculture, Fishing & Hunting | 195 (100.0%) | 0 (0.0%) |
| Mining, Quarrying, & Extraction | 43 (100.0%) | 0 (0.0%) |
| Construction | 1,011 (90.1%) | 111 (9.9%) |
| Manufacturing | 532 (64.2%) | 296 (35.7%) |
| Wholesale Trade | 21 (25.0%) | 63 (75.0%) |
| Retail Trade | 859 (55.2%) | 697 (44.8%) |
| Transportation & Warehousing | 409 (89.5%) | 48 (10.5%) |
| Utilities | 111 (77.1%) | 33 (22.9%) |
| Information | 77 (42.8%) | 103 (57.2%) |
| Finance & Insurance | 47 (17.0%) | 229 (83.0%) |
| Real Estate, Rental & Leasing | 88 (56.4%) | 68 (43.6%) |
| Professional & Scientific | 313 (35.5%) | 569 (64.5%) |
| Enterprise Management | 0 (0.0%) | 0 (0.0%) |
| Administrative & Support | 484 (78.4%) | 133 (21.6%) |
| Educational Services | 875 (41.2%) | 1,249 (58.8%) |
| Health Care & Social Assistance | 580 (25.2%) | 1,724 (74.8%) |
| Arts, Entertainment & Recreation | 63 (39.1%) | 98 (60.9%) |
| Accommodation & Food Services | 410 (48.9%) | 429 (51.1%) |
| Public Administration | 404 (54.7%) | 335 (45.3%) |
| Total | 6,891 (51.5%) | 6,488 (48.5%) |
Education in Fluvanna County
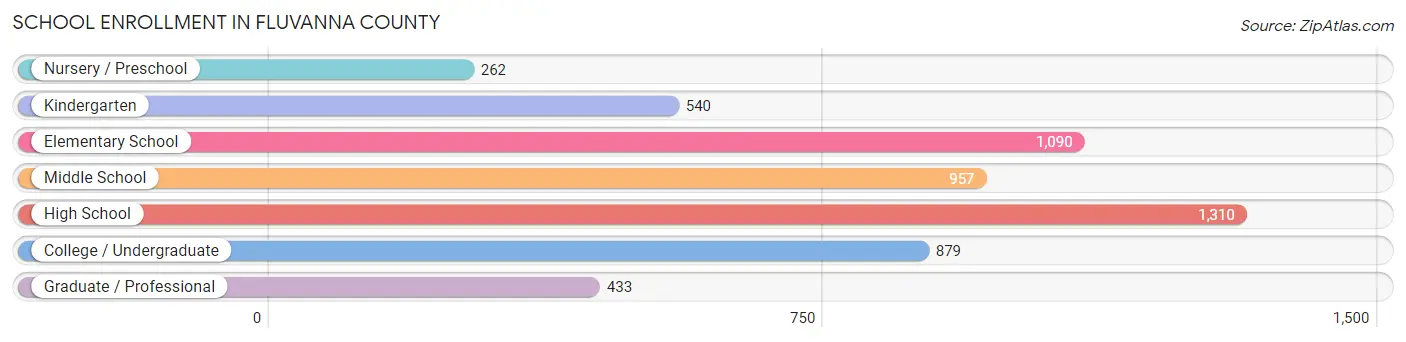
School Enrollment in Fluvanna County
The most common levels of schooling among the 5,471 students in Fluvanna County are high school (1,310 | 23.9%), elementary school (1,090 | 19.9%), and middle school (957 | 17.5%).
| School Level | # Students | % Students |
| Nursery / Preschool | 262 | 4.8% |
| Kindergarten | 540 | 9.9% |
| Elementary School | 1,090 | 19.9% |
| Middle School | 957 | 17.5% |
| High School | 1,310 | 23.9% |
| College / Undergraduate | 879 | 16.1% |
| Graduate / Professional | 433 | 7.9% |
| Total | 5,471 | 100.0% |
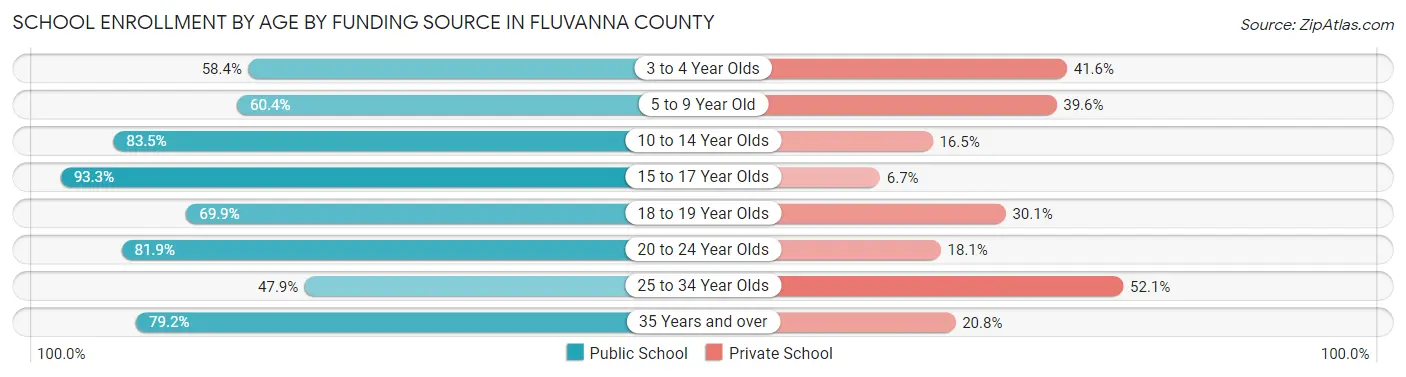
School Enrollment by Age by Funding Source in Fluvanna County
Out of a total of 5,471 students who are enrolled in schools in Fluvanna County, 1,406 (25.7%) attend a private institution, while the remaining 4,065 (74.3%) are enrolled in public schools. The age group of 25 to 34 year olds has the highest likelihood of being enrolled in private schools, with 177 (52.1% in the age bracket) enrolled. Conversely, the age group of 15 to 17 year olds has the lowest likelihood of being enrolled in a private school, with 900 (93.3% in the age bracket) attending a public institution.
| Age Bracket | Public School | Private School |
| 3 to 4 Year Olds | 142 (58.4%) | 101 (41.6%) |
| 5 to 9 Year Old | 938 (60.4%) | 615 (39.6%) |
| 10 to 14 Year Olds | 1,060 (83.5%) | 210 (16.5%) |
| 15 to 17 Year Olds | 900 (93.3%) | 65 (6.7%) |
| 18 to 19 Year Olds | 146 (69.9%) | 63 (30.1%) |
| 20 to 24 Year Olds | 245 (81.9%) | 54 (18.1%) |
| 25 to 34 Year Olds | 163 (47.9%) | 177 (52.1%) |
| 35 Years and over | 469 (79.2%) | 123 (20.8%) |
| Total | 4,065 (74.3%) | 1,406 (25.7%) |
Educational Attainment by Field of Study in Fluvanna County
Science & technology (1,391 | 17.4%), business (1,008 | 12.6%), education (779 | 9.8%), arts & humanities (763 | 9.6%), and social sciences (694 | 8.7%) are the most common fields of study among 7,984 individuals in Fluvanna County who have obtained a bachelor's degree or higher.
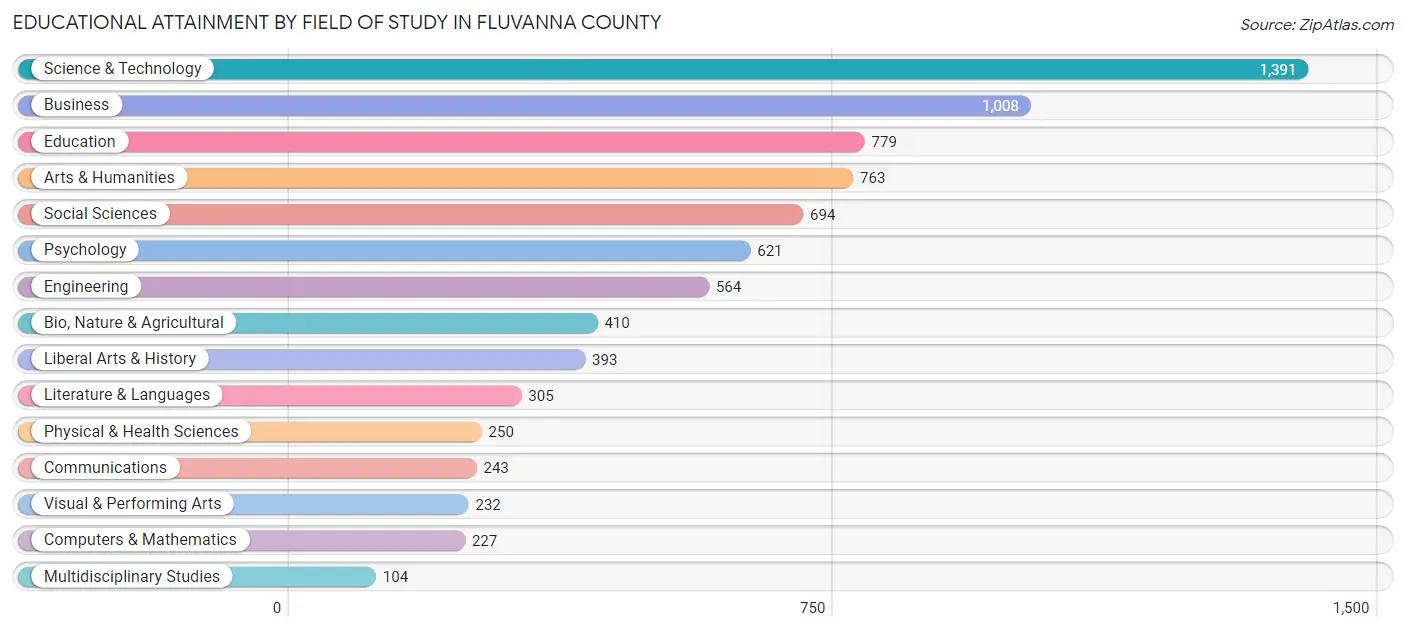
| Field of Study | # Graduates | % Graduates |
| Computers & Mathematics | 227 | 2.8% |
| Bio, Nature & Agricultural | 410 | 5.1% |
| Physical & Health Sciences | 250 | 3.1% |
| Psychology | 621 | 7.8% |
| Social Sciences | 694 | 8.7% |
| Engineering | 564 | 7.1% |
| Multidisciplinary Studies | 104 | 1.3% |
| Science & Technology | 1,391 | 17.4% |
| Business | 1,008 | 12.6% |
| Education | 779 | 9.8% |
| Literature & Languages | 305 | 3.8% |
| Liberal Arts & History | 393 | 4.9% |
| Visual & Performing Arts | 232 | 2.9% |
| Communications | 243 | 3.0% |
| Arts & Humanities | 763 | 9.6% |
| Total | 7,984 | 100.0% |
Transportation & Commute in Fluvanna County
Vehicle Availability by Sex in Fluvanna County
The most prevalent vehicle ownership categories in Fluvanna County are males with 2 vehicles (2,665, accounting for 38.9%) and females with 2 vehicles (2,675, making up 42.3%).
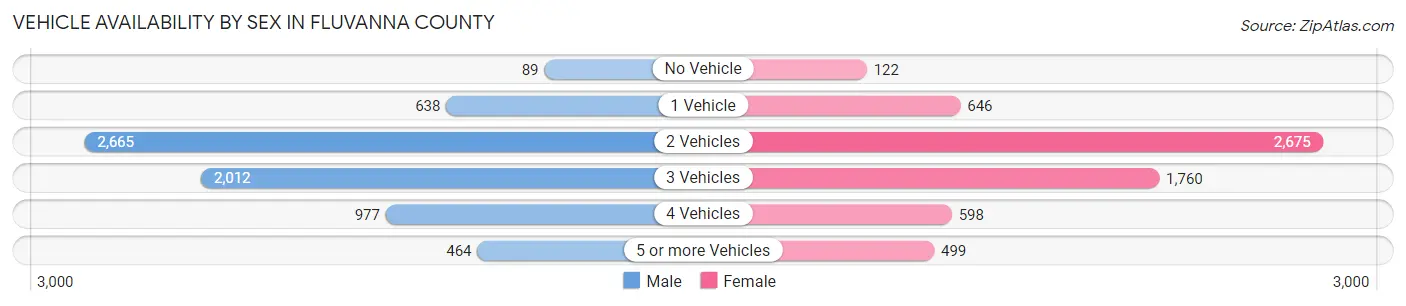
| Vehicles Available | Male | Female |
| No Vehicle | 89 (1.3%) | 122 (1.9%) |
| 1 Vehicle | 638 (9.3%) | 646 (10.2%) |
| 2 Vehicles | 2,665 (38.9%) | 2,675 (42.5%) |
| 3 Vehicles | 2,012 (29.4%) | 1,760 (27.9%) |
| 4 Vehicles | 977 (14.3%) | 598 (9.5%) |
| 5 or more Vehicles | 464 (6.8%) | 499 (7.9%) |
| Total | 6,845 (100.0%) | 6,300 (100.0%) |
Commute Time in Fluvanna County
The most frequently occuring commute durations in Fluvanna County are 30 to 34 minutes (2,479 commuters, 21.3%), 45 to 59 minutes (1,707 commuters, 14.7%), and 25 to 29 minutes (1,127 commuters, 9.7%).
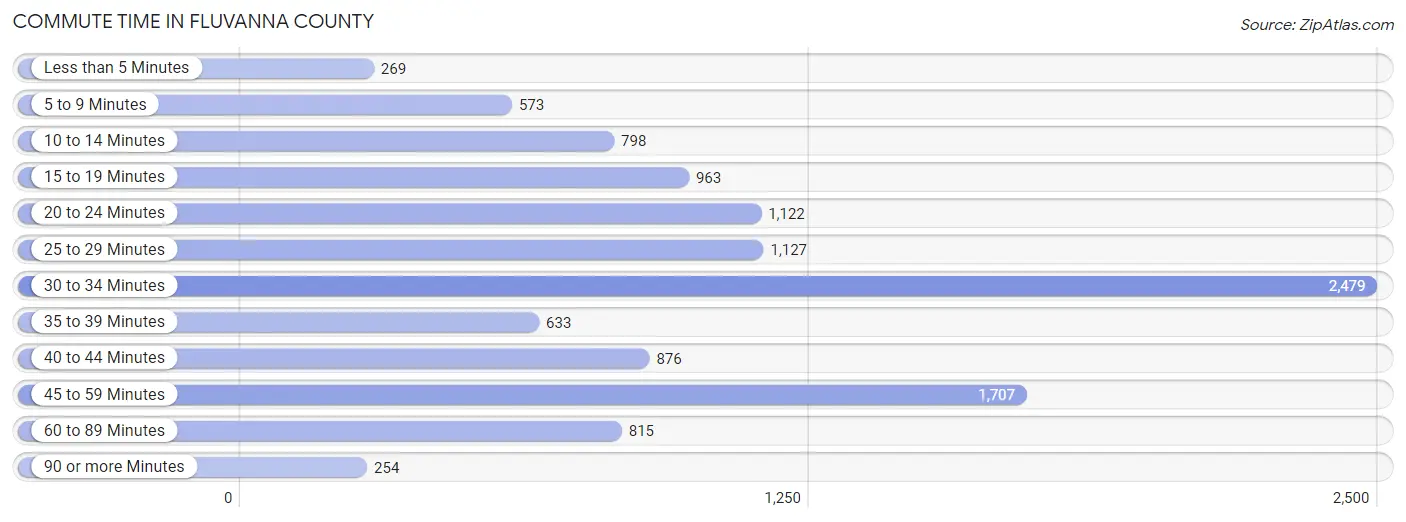
| Commute Time | # Commuters | % Commuters |
| Less than 5 Minutes | 269 | 2.3% |
| 5 to 9 Minutes | 573 | 4.9% |
| 10 to 14 Minutes | 798 | 6.9% |
| 15 to 19 Minutes | 963 | 8.3% |
| 20 to 24 Minutes | 1,122 | 9.7% |
| 25 to 29 Minutes | 1,127 | 9.7% |
| 30 to 34 Minutes | 2,479 | 21.3% |
| 35 to 39 Minutes | 633 | 5.4% |
| 40 to 44 Minutes | 876 | 7.5% |
| 45 to 59 Minutes | 1,707 | 14.7% |
| 60 to 89 Minutes | 815 | 7.0% |
| 90 or more Minutes | 254 | 2.2% |
Commute Time by Sex in Fluvanna County
The most common commute times in Fluvanna County are 30 to 34 minutes (1,213 commuters, 20.1%) for males and 30 to 34 minutes (1,266 commuters, 22.6%) for females.
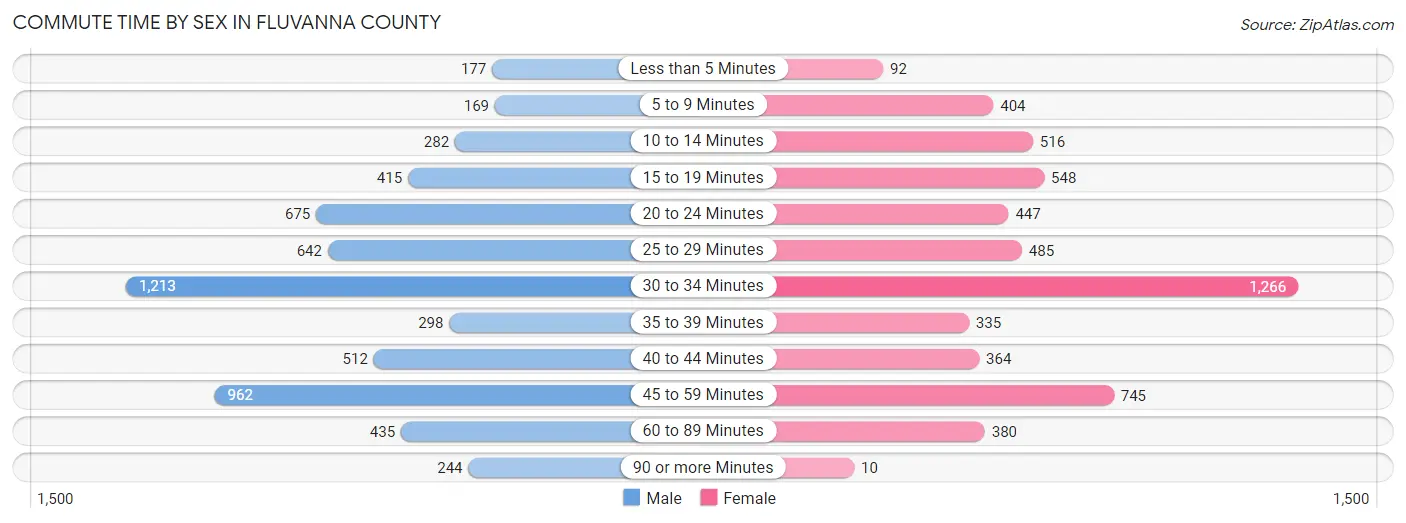
| Commute Time | Male | Female |
| Less than 5 Minutes | 177 (2.9%) | 92 (1.7%) |
| 5 to 9 Minutes | 169 (2.8%) | 404 (7.2%) |
| 10 to 14 Minutes | 282 (4.7%) | 516 (9.2%) |
| 15 to 19 Minutes | 415 (6.9%) | 548 (9.8%) |
| 20 to 24 Minutes | 675 (11.2%) | 447 (8.0%) |
| 25 to 29 Minutes | 642 (10.7%) | 485 (8.7%) |
| 30 to 34 Minutes | 1,213 (20.1%) | 1,266 (22.6%) |
| 35 to 39 Minutes | 298 (5.0%) | 335 (6.0%) |
| 40 to 44 Minutes | 512 (8.5%) | 364 (6.5%) |
| 45 to 59 Minutes | 962 (16.0%) | 745 (13.3%) |
| 60 to 89 Minutes | 435 (7.2%) | 380 (6.8%) |
| 90 or more Minutes | 244 (4.1%) | 10 (0.2%) |
Time of Departure to Work by Sex in Fluvanna County
The most frequent times of departure to work in Fluvanna County are 6:00 AM to 6:29 AM (1,025, 17.0%) for males and 7:00 AM to 7:29 AM (1,151, 20.6%) for females.
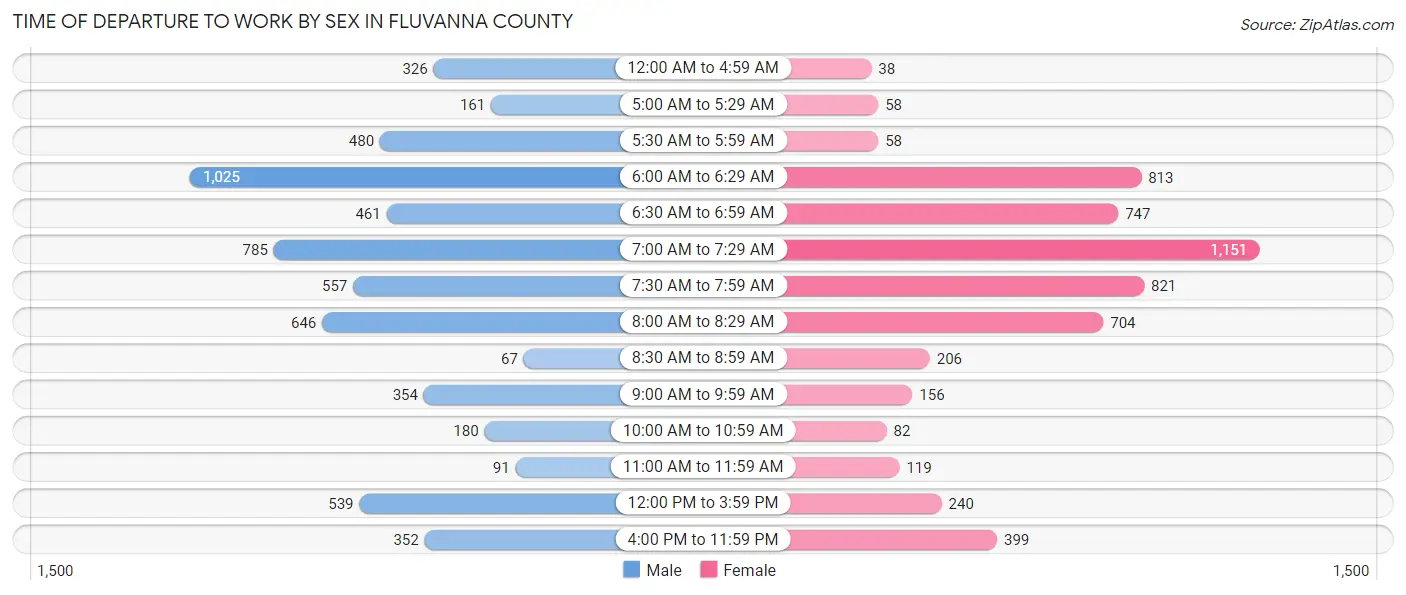
| Time of Departure | Male | Female |
| 12:00 AM to 4:59 AM | 326 (5.4%) | 38 (0.7%) |
| 5:00 AM to 5:29 AM | 161 (2.7%) | 58 (1.0%) |
| 5:30 AM to 5:59 AM | 480 (8.0%) | 58 (1.0%) |
| 6:00 AM to 6:29 AM | 1,025 (17.0%) | 813 (14.5%) |
| 6:30 AM to 6:59 AM | 461 (7.6%) | 747 (13.4%) |
| 7:00 AM to 7:29 AM | 785 (13.0%) | 1,151 (20.6%) |
| 7:30 AM to 7:59 AM | 557 (9.2%) | 821 (14.7%) |
| 8:00 AM to 8:29 AM | 646 (10.7%) | 704 (12.6%) |
| 8:30 AM to 8:59 AM | 67 (1.1%) | 206 (3.7%) |
| 9:00 AM to 9:59 AM | 354 (5.9%) | 156 (2.8%) |
| 10:00 AM to 10:59 AM | 180 (3.0%) | 82 (1.5%) |
| 11:00 AM to 11:59 AM | 91 (1.5%) | 119 (2.1%) |
| 12:00 PM to 3:59 PM | 539 (8.9%) | 240 (4.3%) |
| 4:00 PM to 11:59 PM | 352 (5.8%) | 399 (7.1%) |
| Total | 6,024 (100.0%) | 5,592 (100.0%) |
Housing Occupancy in Fluvanna County
Occupancy by Ownership in Fluvanna County
Of the total 10,195 dwellings in Fluvanna County, owner-occupied units account for 9,014 (88.4%), while renter-occupied units make up 1,181 (11.6%).
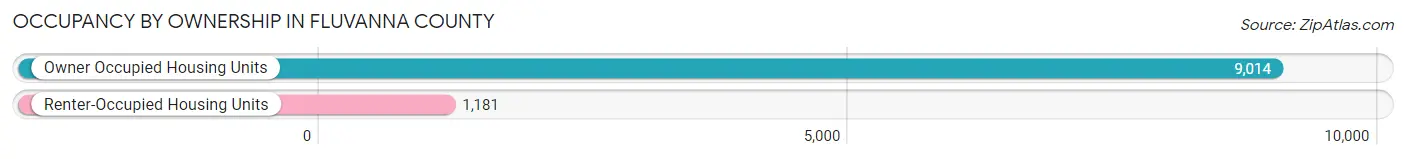
| Occupancy | # Housing Units | % Housing Units |
| Owner Occupied Housing Units | 9,014 | 88.4% |
| Renter-Occupied Housing Units | 1,181 | 11.6% |
| Total Occupied Housing Units | 10,195 | 100.0% |
Occupancy by Household Size in Fluvanna County
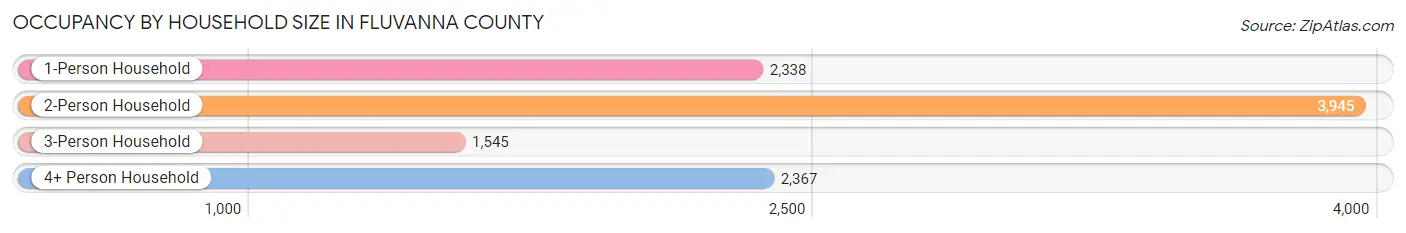
| Household Size | # Housing Units | % Housing Units |
| 1-Person Household | 2,338 | 22.9% |
| 2-Person Household | 3,945 | 38.7% |
| 3-Person Household | 1,545 | 15.1% |
| 4+ Person Household | 2,367 | 23.2% |
| Total Housing Units | 10,195 | 100.0% |
Occupancy by Ownership by Household Size in Fluvanna County
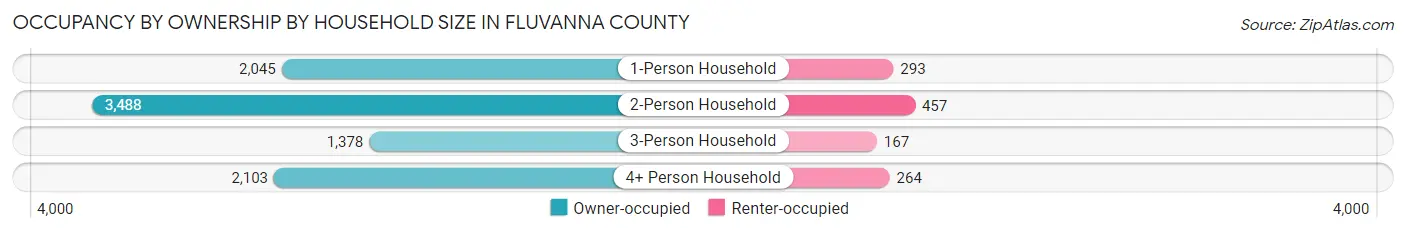
| Household Size | Owner-occupied | Renter-occupied |
| 1-Person Household | 2,045 (87.5%) | 293 (12.5%) |
| 2-Person Household | 3,488 (88.4%) | 457 (11.6%) |
| 3-Person Household | 1,378 (89.2%) | 167 (10.8%) |
| 4+ Person Household | 2,103 (88.8%) | 264 (11.2%) |
| Total Housing Units | 9,014 (88.4%) | 1,181 (11.6%) |
Occupancy by Educational Attainment in Fluvanna County
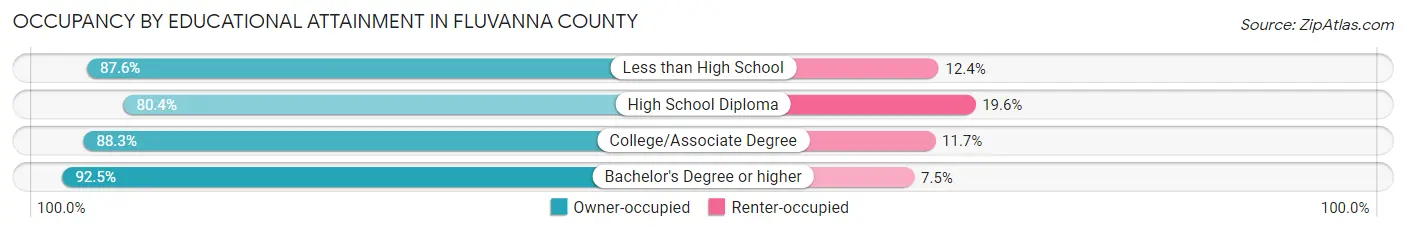
| Household Size | Owner-occupied | Renter-occupied |
| Less than High School | 489 (87.6%) | 69 (12.4%) |
| High School Diploma | 1,634 (80.4%) | 399 (19.6%) |
| College/Associate Degree | 2,994 (88.3%) | 396 (11.7%) |
| Bachelor's Degree or higher | 3,897 (92.5%) | 317 (7.5%) |
Occupancy by Age of Householder in Fluvanna County
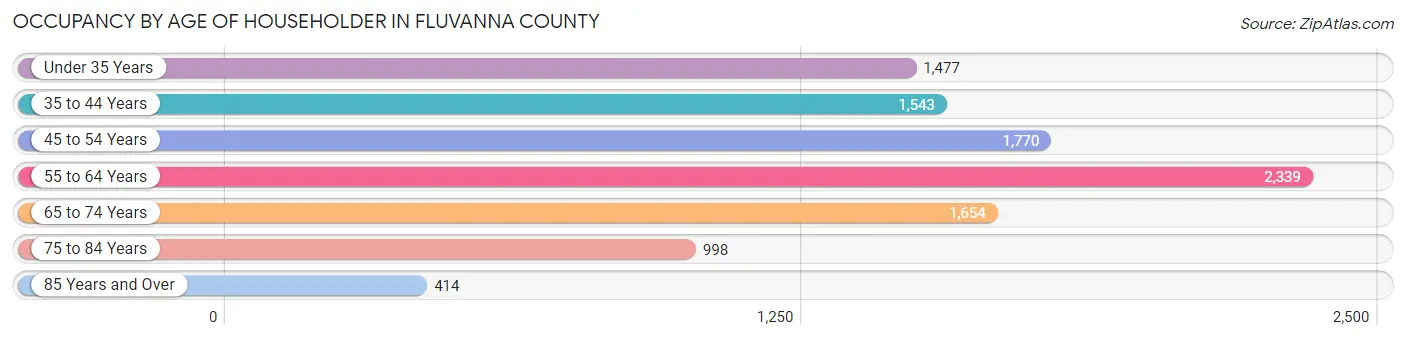
| Age Bracket | # Households | % Households |
| Under 35 Years | 1,477 | 14.5% |
| 35 to 44 Years | 1,543 | 15.1% |
| 45 to 54 Years | 1,770 | 17.4% |
| 55 to 64 Years | 2,339 | 22.9% |
| 65 to 74 Years | 1,654 | 16.2% |
| 75 to 84 Years | 998 | 9.8% |
| 85 Years and Over | 414 | 4.1% |
| Total | 10,195 | 100.0% |
Housing Finances in Fluvanna County
Median Income by Occupancy in Fluvanna County
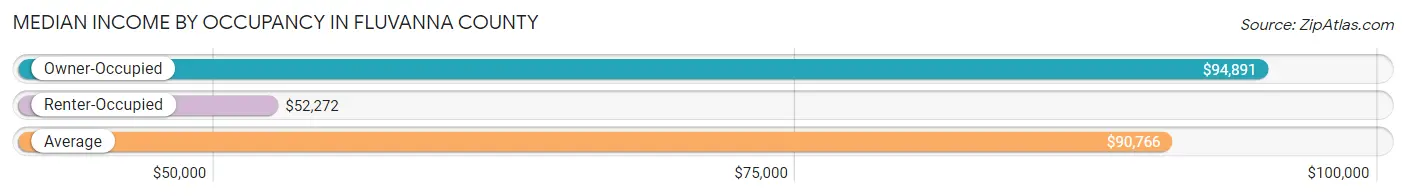
| Occupancy Type | # Households | Median Income |
| Owner-Occupied | 9,014 (88.4%) | $94,891 |
| Renter-Occupied | 1,181 (11.6%) | $52,272 |
| Average | 10,195 (100.0%) | $90,766 |
Occupancy by Householder Income Bracket in Fluvanna County
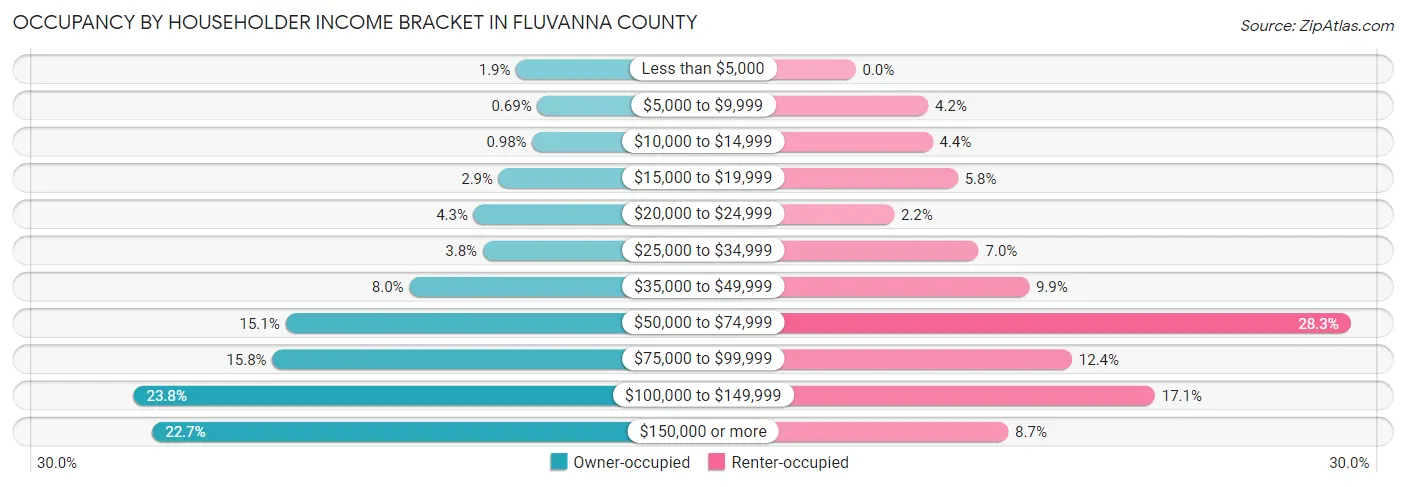
| Income Bracket | Owner-occupied | Renter-occupied |
| Less than $5,000 | 171 (1.9%) | 0 (0.0%) |
| $5,000 to $9,999 | 62 (0.7%) | 49 (4.2%) |
| $10,000 to $14,999 | 88 (1.0%) | 52 (4.4%) |
| $15,000 to $19,999 | 261 (2.9%) | 69 (5.8%) |
| $20,000 to $24,999 | 390 (4.3%) | 26 (2.2%) |
| $25,000 to $34,999 | 343 (3.8%) | 83 (7.0%) |
| $35,000 to $49,999 | 722 (8.0%) | 117 (9.9%) |
| $50,000 to $74,999 | 1,360 (15.1%) | 334 (28.3%) |
| $75,000 to $99,999 | 1,428 (15.8%) | 146 (12.4%) |
| $100,000 to $149,999 | 2,143 (23.8%) | 202 (17.1%) |
| $150,000 or more | 2,046 (22.7%) | 103 (8.7%) |
| Total | 9,014 (100.0%) | 1,181 (100.0%) |
Monthly Housing Cost Tiers in Fluvanna County
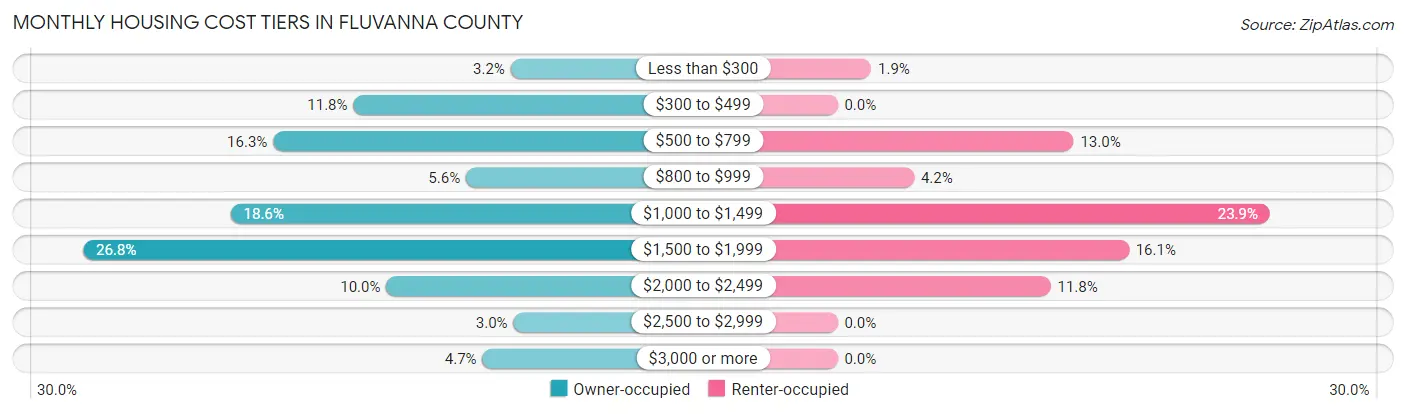
| Monthly Cost | Owner-occupied | Renter-occupied |
| Less than $300 | 284 (3.2%) | 22 (1.9%) |
| $300 to $499 | 1,067 (11.8%) | 0 (0.0%) |
| $500 to $799 | 1,467 (16.3%) | 154 (13.0%) |
| $800 to $999 | 507 (5.6%) | 50 (4.2%) |
| $1,000 to $1,499 | 1,678 (18.6%) | 282 (23.9%) |
| $1,500 to $1,999 | 2,413 (26.8%) | 190 (16.1%) |
| $2,000 to $2,499 | 903 (10.0%) | 139 (11.8%) |
| $2,500 to $2,999 | 270 (3.0%) | 0 (0.0%) |
| $3,000 or more | 425 (4.7%) | 0 (0.0%) |
| Total | 9,014 (100.0%) | 1,181 (100.0%) |
Physical Housing Characteristics in Fluvanna County
Housing Structures in Fluvanna County
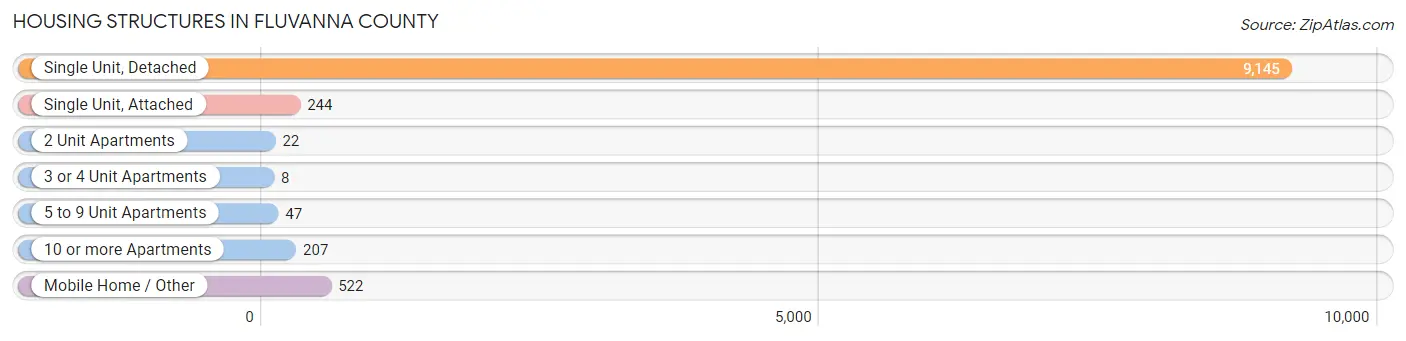
| Structure Type | # Housing Units | % Housing Units |
| Single Unit, Detached | 9,145 | 89.7% |
| Single Unit, Attached | 244 | 2.4% |
| 2 Unit Apartments | 22 | 0.2% |
| 3 or 4 Unit Apartments | 8 | 0.1% |
| 5 to 9 Unit Apartments | 47 | 0.5% |
| 10 or more Apartments | 207 | 2.0% |
| Mobile Home / Other | 522 | 5.1% |
| Total | 10,195 | 100.0% |
Housing Structures by Occupancy in Fluvanna County
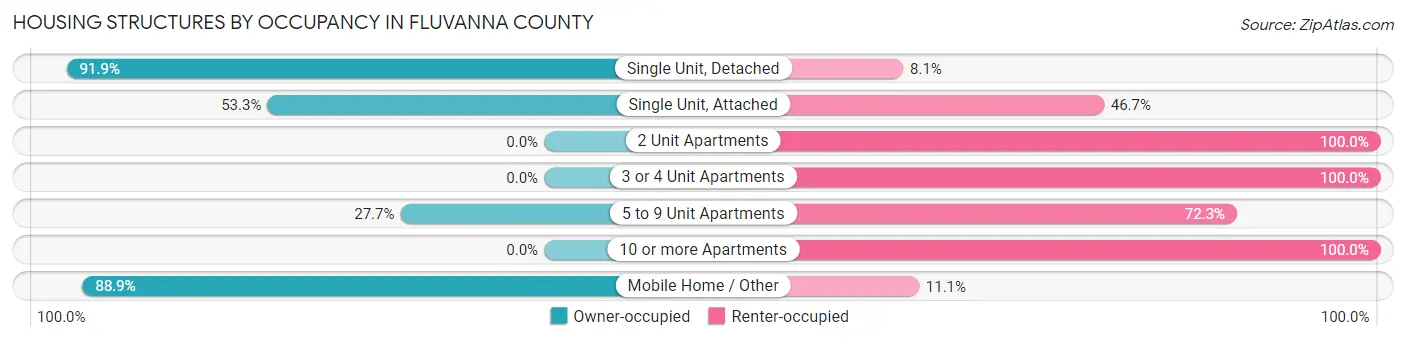
| Structure Type | Owner-occupied | Renter-occupied |
| Single Unit, Detached | 8,407 (91.9%) | 738 (8.1%) |
| Single Unit, Attached | 130 (53.3%) | 114 (46.7%) |
| 2 Unit Apartments | 0 (0.0%) | 22 (100.0%) |
| 3 or 4 Unit Apartments | 0 (0.0%) | 8 (100.0%) |
| 5 to 9 Unit Apartments | 13 (27.7%) | 34 (72.3%) |
| 10 or more Apartments | 0 (0.0%) | 207 (100.0%) |
| Mobile Home / Other | 464 (88.9%) | 58 (11.1%) |
| Total | 9,014 (88.4%) | 1,181 (11.6%) |
Housing Structures by Number of Rooms in Fluvanna County
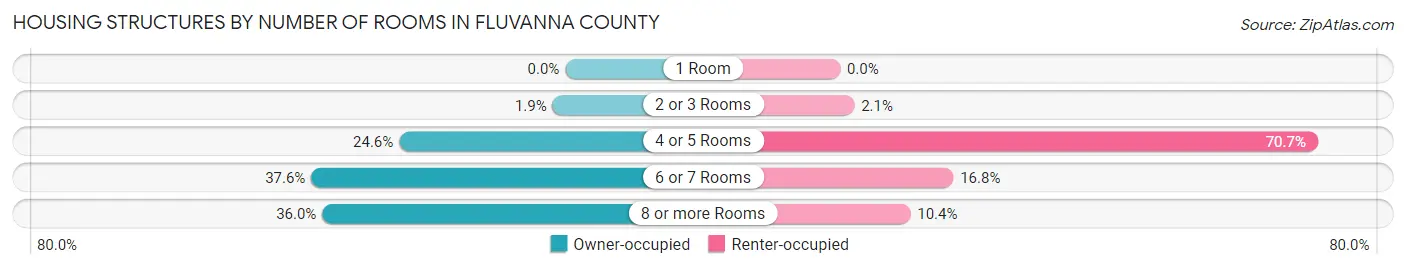
| Number of Rooms | Owner-occupied | Renter-occupied |
| 1 Room | 0 (0.0%) | 0 (0.0%) |
| 2 or 3 Rooms | 169 (1.9%) | 25 (2.1%) |
| 4 or 5 Rooms | 2,216 (24.6%) | 835 (70.7%) |
| 6 or 7 Rooms | 3,388 (37.6%) | 198 (16.8%) |
| 8 or more Rooms | 3,241 (36.0%) | 123 (10.4%) |
| Total | 9,014 (100.0%) | 1,181 (100.0%) |
Housing Structure by Heating Type in Fluvanna County
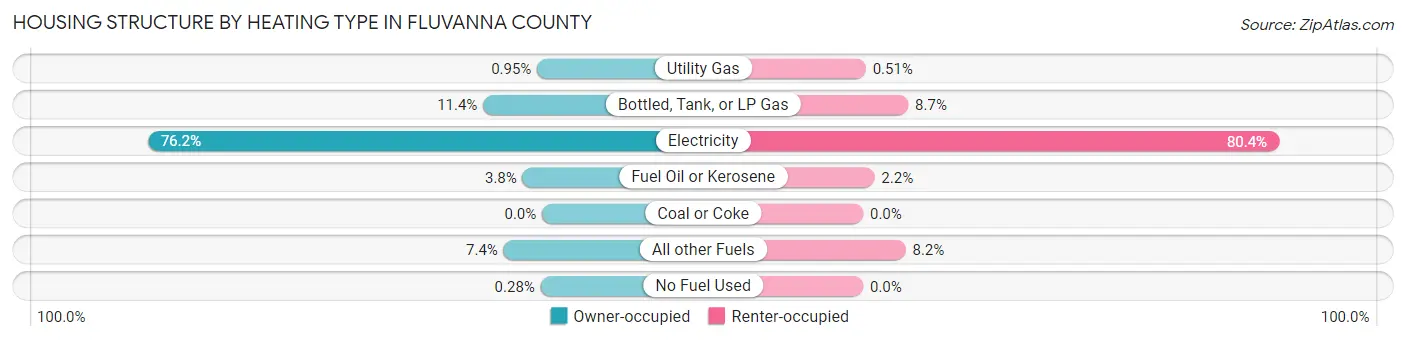
| Heating Type | Owner-occupied | Renter-occupied |
| Utility Gas | 86 (0.9%) | 6 (0.5%) |
| Bottled, Tank, or LP Gas | 1,026 (11.4%) | 103 (8.7%) |
| Electricity | 6,869 (76.2%) | 949 (80.4%) |
| Fuel Oil or Kerosene | 339 (3.8%) | 26 (2.2%) |
| Coal or Coke | 0 (0.0%) | 0 (0.0%) |
| All other Fuels | 669 (7.4%) | 97 (8.2%) |
| No Fuel Used | 25 (0.3%) | 0 (0.0%) |
| Total | 9,014 (100.0%) | 1,181 (100.0%) |
Household Vehicle Usage in Fluvanna County
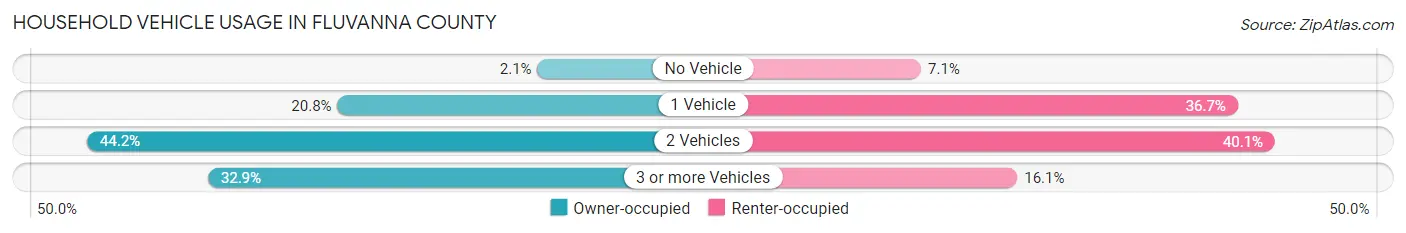
| Vehicles per Household | Owner-occupied | Renter-occupied |
| No Vehicle | 192 (2.1%) | 84 (7.1%) |
| 1 Vehicle | 1,875 (20.8%) | 433 (36.7%) |
| 2 Vehicles | 3,982 (44.2%) | 474 (40.1%) |
| 3 or more Vehicles | 2,965 (32.9%) | 190 (16.1%) |
| Total | 9,014 (100.0%) | 1,181 (100.0%) |
Real Estate & Mortgages in Fluvanna County
Real Estate and Mortgage Overview in Fluvanna County
| Characteristic | Without Mortgage | With Mortgage |
| Housing Units | 2,844 | 6,170 |
| Median Property Value | $297,400 | $259,600 |
| Median Household Income | $67,799 | $1,570 |
| Monthly Housing Costs | $570 | $414 |
| Real Estate Taxes | $2,287 | $207 |
Property Value by Mortgage Status in Fluvanna County
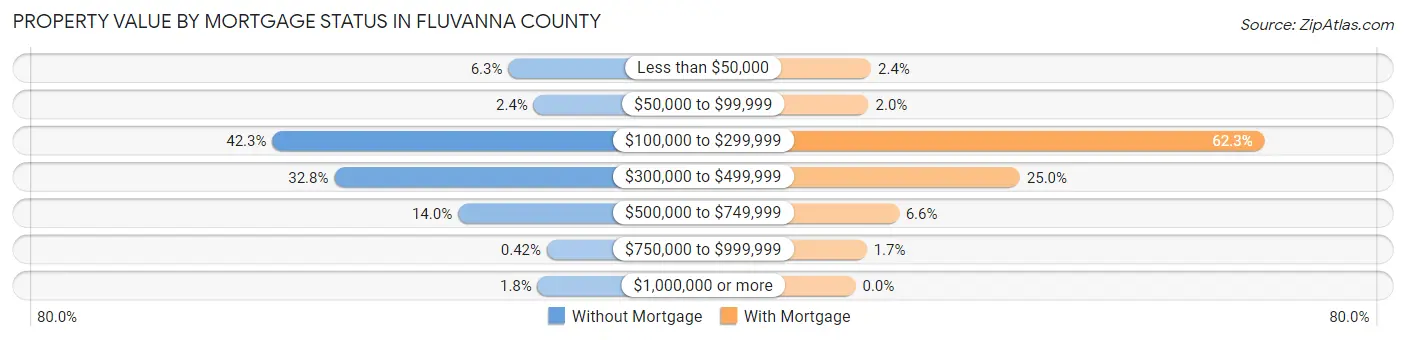
| Property Value | Without Mortgage | With Mortgage |
| Less than $50,000 | 179 (6.3%) | 146 (2.4%) |
| $50,000 to $99,999 | 69 (2.4%) | 123 (2.0%) |
| $100,000 to $299,999 | 1,202 (42.3%) | 3,845 (62.3%) |
| $300,000 to $499,999 | 933 (32.8%) | 1,545 (25.0%) |
| $500,000 to $749,999 | 397 (14.0%) | 406 (6.6%) |
| $750,000 to $999,999 | 12 (0.4%) | 105 (1.7%) |
| $1,000,000 or more | 52 (1.8%) | 0 (0.0%) |
| Total | 2,844 (100.0%) | 6,170 (100.0%) |
Household Income by Mortgage Status in Fluvanna County
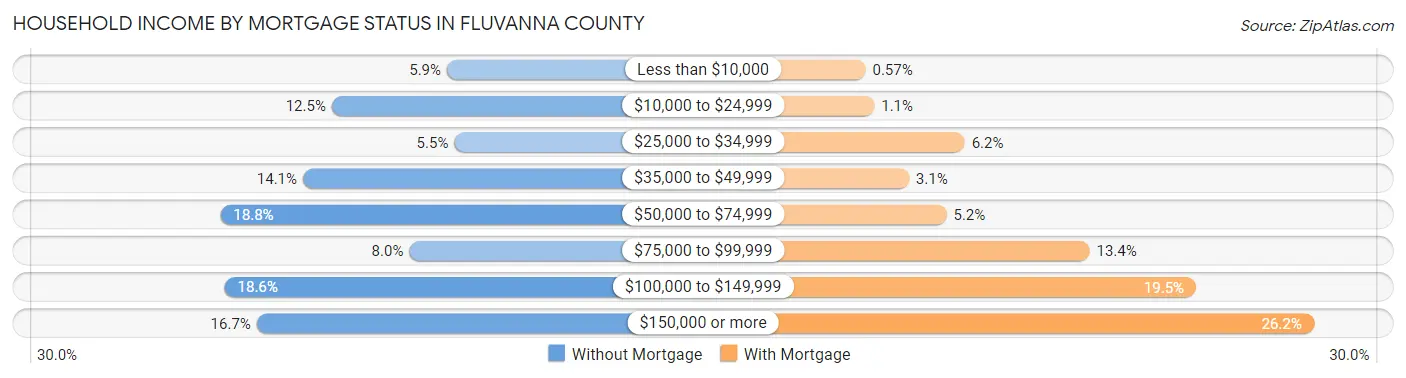
| Household Income | Without Mortgage | With Mortgage |
| Less than $10,000 | 167 (5.9%) | 35 (0.6%) |
| $10,000 to $24,999 | 354 (12.4%) | 66 (1.1%) |
| $25,000 to $34,999 | 155 (5.4%) | 385 (6.2%) |
| $35,000 to $49,999 | 401 (14.1%) | 188 (3.0%) |
| $50,000 to $74,999 | 535 (18.8%) | 321 (5.2%) |
| $75,000 to $99,999 | 228 (8.0%) | 825 (13.4%) |
| $100,000 to $149,999 | 528 (18.6%) | 1,200 (19.5%) |
| $150,000 or more | 476 (16.7%) | 1,615 (26.2%) |
| Total | 2,844 (100.0%) | 6,170 (100.0%) |
Property Value to Household Income Ratio in Fluvanna County
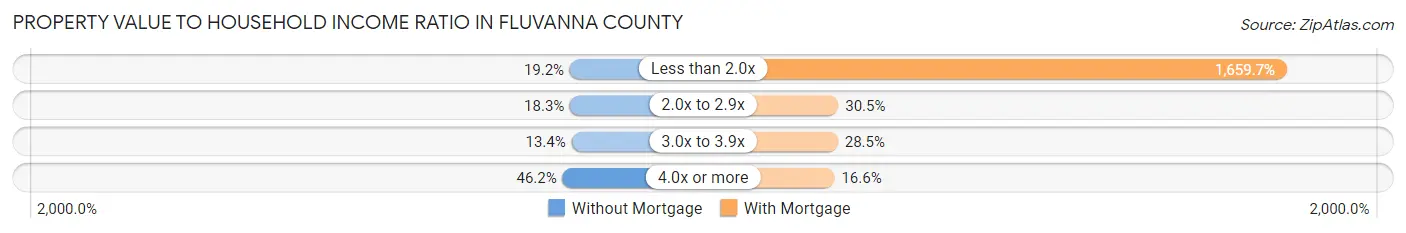
| Value-to-Income Ratio | Without Mortgage | With Mortgage |
| Less than 2.0x | 545 (19.2%) | 102,404 (1,659.7%) |
| 2.0x to 2.9x | 521 (18.3%) | 1,884 (30.5%) |
| 3.0x to 3.9x | 381 (13.4%) | 1,759 (28.5%) |
| 4.0x or more | 1,313 (46.2%) | 1,021 (16.6%) |
| Total | 2,844 (100.0%) | 6,170 (100.0%) |
Real Estate Taxes by Mortgage Status in Fluvanna County
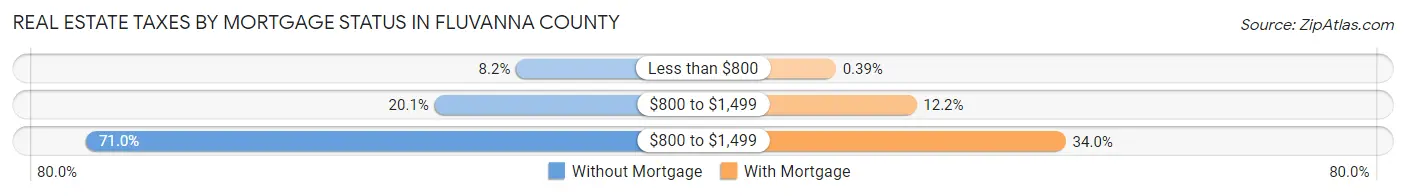
| Property Taxes | Without Mortgage | With Mortgage |
| Less than $800 | 232 (8.2%) | 24 (0.4%) |
| $800 to $1,499 | 571 (20.1%) | 751 (12.2%) |
| $800 to $1,499 | 2,020 (71.0%) | 2,097 (34.0%) |
| Total | 2,844 (100.0%) | 6,170 (100.0%) |
Health & Disability in Fluvanna County
Health Insurance Coverage by Age in Fluvanna County
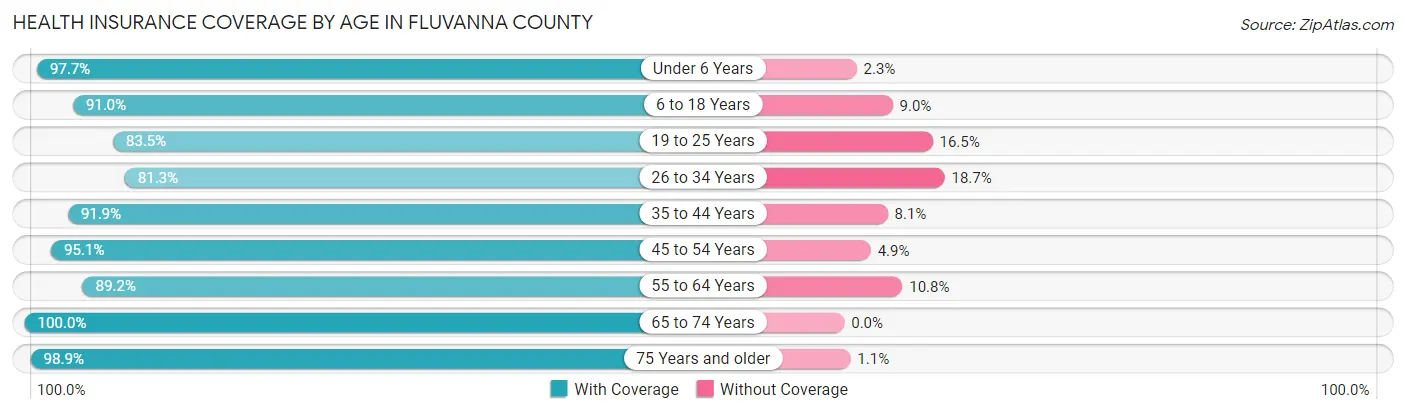
| Age Bracket | With Coverage | Without Coverage |
| Under 6 Years | 1,872 (97.7%) | 44 (2.3%) |
| 6 to 18 Years | 3,362 (91.0%) | 333 (9.0%) |
| 19 to 25 Years | 1,639 (83.5%) | 323 (16.5%) |
| 26 to 34 Years | 2,413 (81.3%) | 555 (18.7%) |
| 35 to 44 Years | 2,746 (91.9%) | 241 (8.1%) |
| 45 to 54 Years | 3,086 (95.1%) | 160 (4.9%) |
| 55 to 64 Years | 3,437 (89.2%) | 417 (10.8%) |
| 65 to 74 Years | 3,255 (100.0%) | 0 (0.0%) |
| 75 Years and older | 2,247 (98.9%) | 26 (1.1%) |
| Total | 24,057 (92.0%) | 2,099 (8.0%) |
Health Insurance Coverage by Citizenship Status in Fluvanna County
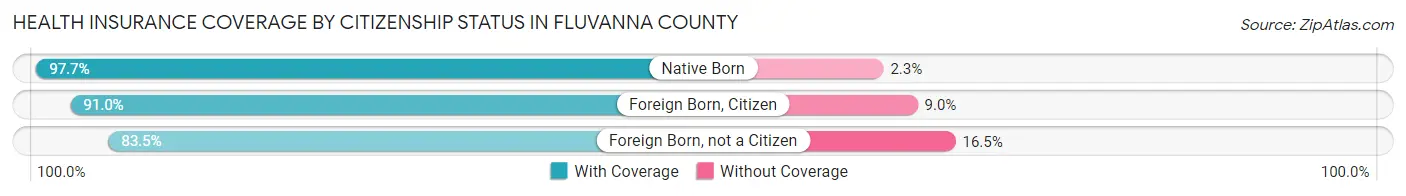
| Citizenship Status | With Coverage | Without Coverage |
| Native Born | 1,872 (97.7%) | 44 (2.3%) |
| Foreign Born, Citizen | 3,362 (91.0%) | 333 (9.0%) |
| Foreign Born, not a Citizen | 1,639 (83.5%) | 323 (16.5%) |
Health Insurance Coverage by Household Income in Fluvanna County
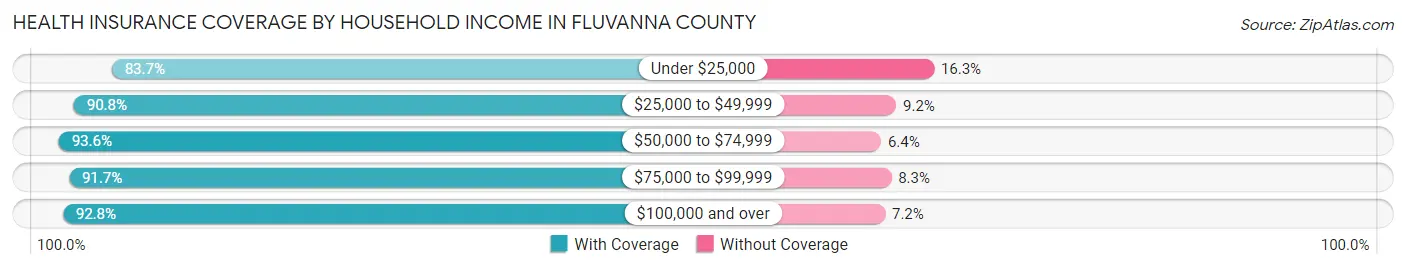
| Household Income | With Coverage | Without Coverage |
| Under $25,000 | 1,342 (83.7%) | 262 (16.3%) |
| $25,000 to $49,999 | 2,360 (90.8%) | 240 (9.2%) |
| $50,000 to $74,999 | 3,422 (93.6%) | 234 (6.4%) |
| $75,000 to $99,999 | 3,800 (91.7%) | 345 (8.3%) |
| $100,000 and over | 13,106 (92.8%) | 1,010 (7.2%) |
Public vs Private Health Insurance Coverage by Age in Fluvanna County
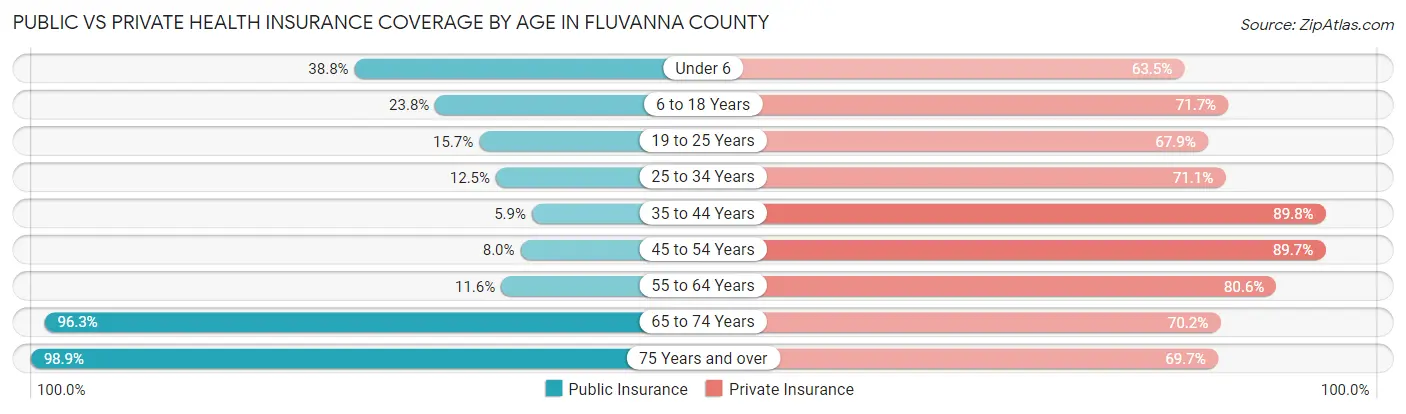
| Age Bracket | Public Insurance | Private Insurance |
| Under 6 | 743 (38.8%) | 1,217 (63.5%) |
| 6 to 18 Years | 879 (23.8%) | 2,648 (71.7%) |
| 19 to 25 Years | 307 (15.7%) | 1,332 (67.9%) |
| 25 to 34 Years | 372 (12.5%) | 2,111 (71.1%) |
| 35 to 44 Years | 175 (5.9%) | 2,681 (89.8%) |
| 45 to 54 Years | 259 (8.0%) | 2,911 (89.7%) |
| 55 to 64 Years | 446 (11.6%) | 3,107 (80.6%) |
| 65 to 74 Years | 3,135 (96.3%) | 2,285 (70.2%) |
| 75 Years and over | 2,247 (98.9%) | 1,585 (69.7%) |
| Total | 8,563 (32.7%) | 19,877 (76.0%) |
Disability Status by Sex by Age in Fluvanna County
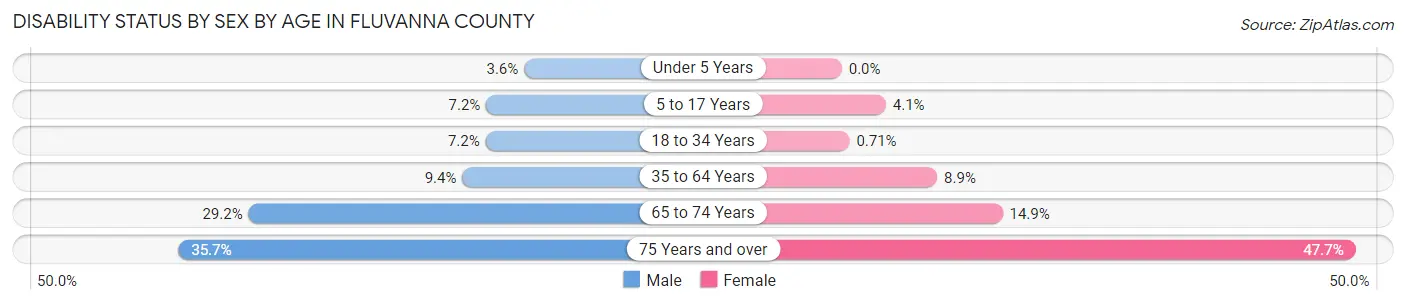
| Age Bracket | Male | Female |
| Under 5 Years | 25 (3.6%) | 0 (0.0%) |
| 5 to 17 Years | 149 (7.2%) | 80 (4.1%) |
| 18 to 34 Years | 175 (7.2%) | 19 (0.7%) |
| 35 to 64 Years | 469 (9.4%) | 450 (8.8%) |
| 65 to 74 Years | 438 (29.2%) | 262 (14.9%) |
| 75 Years and over | 382 (35.7%) | 574 (47.7%) |
Disability Class by Sex by Age in Fluvanna County
Disability Class: Hearing Difficulty
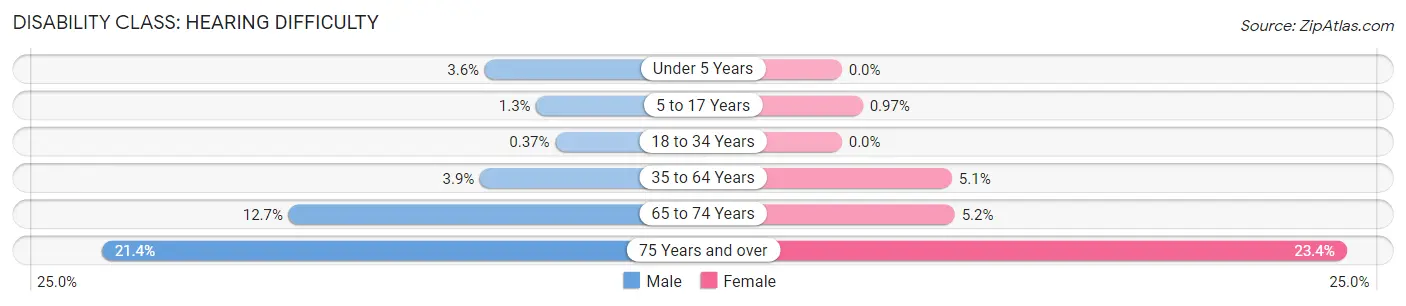
| Age Bracket | Male | Female |
| Under 5 Years | 25 (3.6%) | 0 (0.0%) |
| 5 to 17 Years | 26 (1.3%) | 19 (1.0%) |
| 18 to 34 Years | 9 (0.4%) | 0 (0.0%) |
| 35 to 64 Years | 193 (3.9%) | 260 (5.1%) |
| 65 to 74 Years | 191 (12.7%) | 92 (5.2%) |
| 75 Years and over | 229 (21.4%) | 282 (23.4%) |
Disability Class: Vision Difficulty
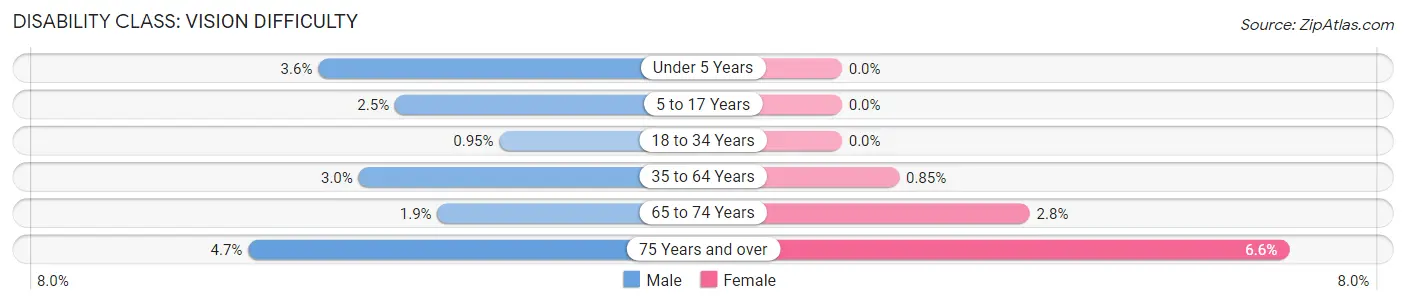
| Age Bracket | Male | Female |
| Under 5 Years | 25 (3.6%) | 0 (0.0%) |
| 5 to 17 Years | 52 (2.5%) | 0 (0.0%) |
| 18 to 34 Years | 23 (0.9%) | 0 (0.0%) |
| 35 to 64 Years | 152 (3.0%) | 43 (0.9%) |
| 65 to 74 Years | 28 (1.9%) | 49 (2.8%) |
| 75 Years and over | 50 (4.7%) | 80 (6.6%) |
Disability Class: Cognitive Difficulty
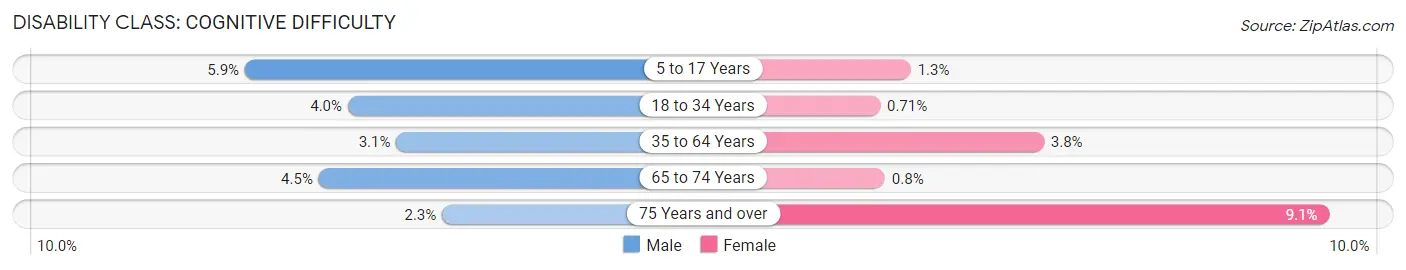
| Age Bracket | Male | Female |
| 5 to 17 Years | 123 (5.9%) | 25 (1.3%) |
| 18 to 34 Years | 97 (4.0%) | 19 (0.7%) |
| 35 to 64 Years | 155 (3.1%) | 191 (3.7%) |
| 65 to 74 Years | 68 (4.5%) | 14 (0.8%) |
| 75 Years and over | 24 (2.2%) | 109 (9.0%) |
Disability Class: Ambulatory Difficulty
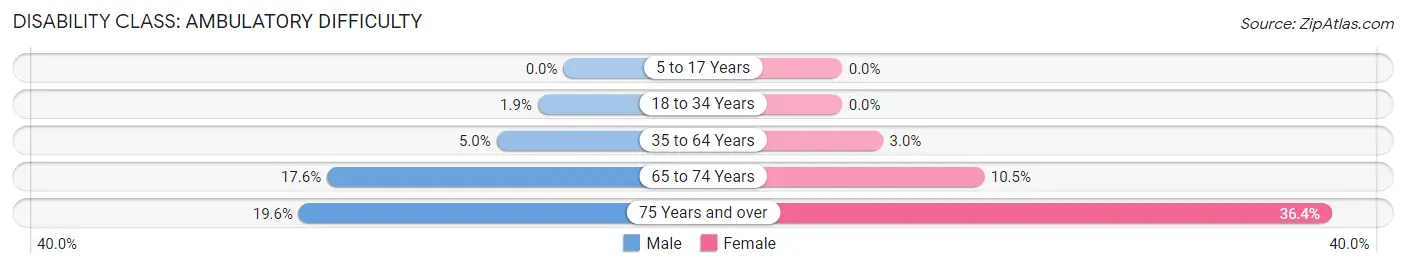
| Age Bracket | Male | Female |
| 5 to 17 Years | 0 (0.0%) | 0 (0.0%) |
| 18 to 34 Years | 46 (1.9%) | 0 (0.0%) |
| 35 to 64 Years | 248 (5.0%) | 154 (3.0%) |
| 65 to 74 Years | 263 (17.5%) | 185 (10.5%) |
| 75 Years and over | 210 (19.6%) | 438 (36.4%) |
Disability Class: Self-Care Difficulty
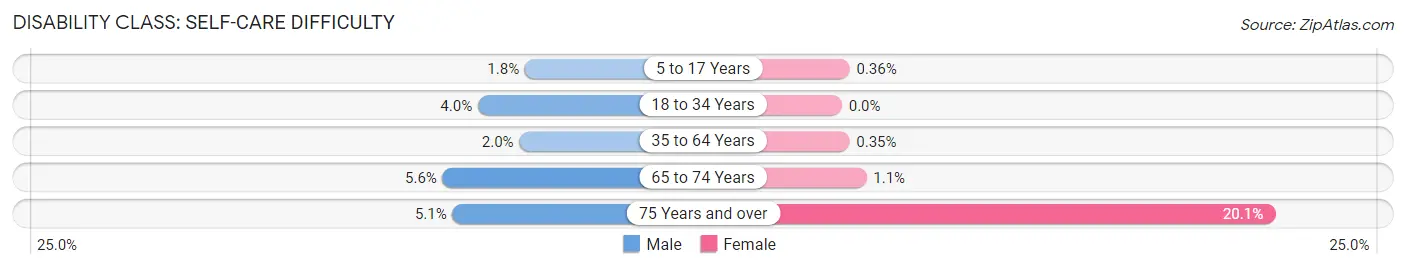
| Age Bracket | Male | Female |
| 5 to 17 Years | 37 (1.8%) | 7 (0.4%) |
| 18 to 34 Years | 96 (4.0%) | 0 (0.0%) |
| 35 to 64 Years | 102 (2.0%) | 18 (0.4%) |
| 65 to 74 Years | 84 (5.6%) | 20 (1.1%) |
| 75 Years and over | 55 (5.1%) | 242 (20.1%) |
Technology Access in Fluvanna County
Computing Device Access in Fluvanna County
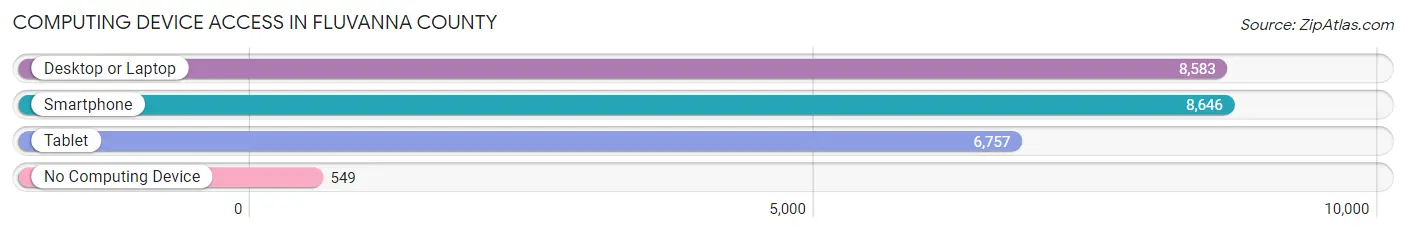
| Device Type | # Households | % Households |
| Desktop or Laptop | 8,583 | 84.2% |
| Smartphone | 8,646 | 84.8% |
| Tablet | 6,757 | 66.3% |
| No Computing Device | 549 | 5.4% |
| Total | 10,195 | 100.0% |
Internet Access in Fluvanna County
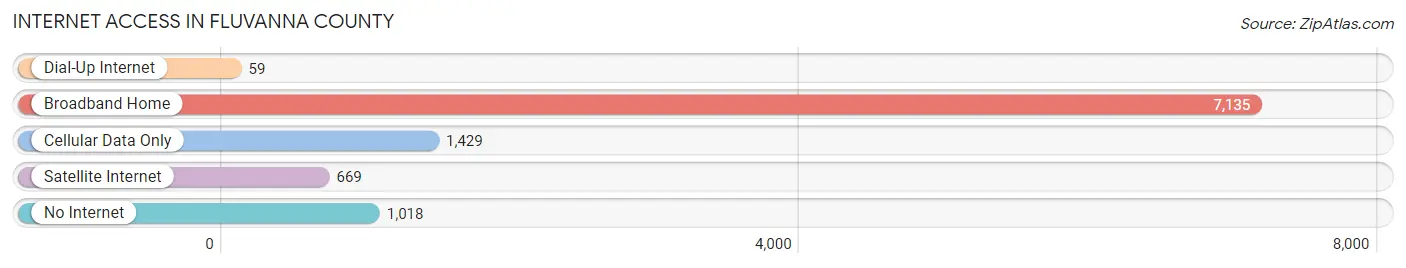
| Internet Type | # Households | % Households |
| Dial-Up Internet | 59 | 0.6% |
| Broadband Home | 7,135 | 70.0% |
| Cellular Data Only | 1,429 | 14.0% |
| Satellite Internet | 669 | 6.6% |
| No Internet | 1,018 | 10.0% |
| Total | 10,195 | 100.0% |
Fluvanna County Summary
Fluvanna County, Virginia is located in the central part of the state, just south of Charlottesville. It is part of the Charlottesville Metropolitan Statistical Area and is bordered by Albemarle County to the north, Louisa County to the east, Goochland County to the south, and Cumberland County to the west. The county seat is Palmyra, and the county is home to approximately 25,000 people.
History
Fluvanna County was formed in 1777 from part of Albemarle County. It was named for the Fluvanna River, which runs through the county. The county was originally part of the Virginia Colony, and was later part of the Commonwealth of Virginia. During the American Revolution, the county was the site of several battles, including the Battle of Trevilian Station.
In the 19th century, the county was home to several prominent families, including the Harrisons, the Carters, and the Randolphs. The county was also home to several prominent African-American families, including the Bowles, the Harrisons, and the Randolphs.
Geography
Fluvanna County is located in the Piedmont region of Virginia. The county is mostly rural, with rolling hills and valleys. The terrain is mostly forested, with some agricultural land. The county is home to several rivers, including the Rivanna, the James, and the Fluvanna.
The county is located in the humid subtropical climate zone, with hot, humid summers and mild winters. The average annual temperature is around 57 degrees Fahrenheit, and the average annual precipitation is around 43 inches.
Economy
Fluvanna County’s economy is largely based on agriculture and manufacturing. The county is home to several large farms, including the Carter Family Farm, the Randolph Family Farm, and the Bowles Family Farm. The county is also home to several manufacturing companies, including the Fluvanna Manufacturing Company and the Fluvanna Textile Company.
The county is also home to several small businesses, including restaurants, retail stores, and service providers. The county is home to several tourist attractions, including the James River State Park, the Rivanna River State Park, and the Fluvanna County Historical Society.
Demographics
As of the 2010 census, the population of Fluvanna County was 25,691. The population is mostly white (90.2%), with a small African-American population (5.2%) and a small Hispanic population (2.2%). The median household income is $60,945, and the median home value is $220,000.
The county is home to several educational institutions, including the University of Virginia, the University of Virginia’s College at Wise, and the Fluvanna County Public Schools. The county is also home to several churches, including the Fluvanna Baptist Church, the Fluvanna United Methodist Church, and the Fluvanna Presbyterian Church.
Conclusion
Fluvanna County, Virginia is a rural county located in the central part of the state. It is home to approximately 25,000 people, and its economy is largely based on agriculture and manufacturing. The county is home to several educational institutions, churches, and tourist attractions. The population is mostly white, with a small African-American and Hispanic population.
Common Questions
What is Per Capita Income in Fluvanna County?
Per Capita income in Fluvanna County is $48,426.
What is the Median Family Income in Fluvanna County?
Median Family Income in Fluvanna County is $102,060.
What is the Median Household income in Fluvanna County?
Median Household Income in Fluvanna County is $90,766.
What is Income or Wage Gap in Fluvanna County?
Income or Wage Gap in Fluvanna County is 17.7%.
Women in Fluvanna County earn 82.3 cents for every dollar earned by a man.
What is Family Income Deficit in Fluvanna County?
Family Income Deficit in Fluvanna County is $7,565.
Families that are below poverty line in Fluvanna County earn $7,565 less on average than the poverty threshold level.
What is Inequality or Gini Index in Fluvanna County?
Inequality or Gini Index in Fluvanna County is 0.48.
What is the Total Population of Fluvanna County?
Total Population of Fluvanna County is 27,442.
What is the Total Male Population of Fluvanna County?
Total Male Population of Fluvanna County is 12,811.
What is the Total Female Population of Fluvanna County?
Total Female Population of Fluvanna County is 14,631.
What is the Ratio of Males per 100 Females in Fluvanna County?
There are 87.56 Males per 100 Females in Fluvanna County.
What is the Ratio of Females per 100 Males in Fluvanna County?
There are 114.21 Females per 100 Males in Fluvanna County.
What is the Median Population Age in Fluvanna County?
Median Population Age in Fluvanna County is 43.1 Years.
What is the Average Family Size in Fluvanna County
Average Family Size in Fluvanna County is 3.0 People.
What is the Average Household Size in Fluvanna County
Average Household Size in Fluvanna County is 2.6 People.
How Large is the Labor Force in Fluvanna County?
There are 13,833 People in the Labor Forcein in Fluvanna County.
What is the Percentage of People in the Labor Force in Fluvanna County?
61.0% of People are in the Labor Force in Fluvanna County.
What is the Unemployment Rate in Fluvanna County?
Unemployment Rate in Fluvanna County is 3.0%.