Fauquier County, VA Map & Demographics
Fauquier County Map
Fauquier County Overview
$54,878
PER CAPITA INCOME
$141,358
AVG FAMILY INCOME
$122,785
AVG HOUSEHOLD INCOME
37.1%
WAGE / INCOME GAP [ % ]
62.9¢/ $1
WAGE / INCOME GAP [ $ ]
$8,537
FAMILY INCOME DEFICIT
0.42
INEQUALITY / GINI INDEX
73,290
TOTAL POPULATION
36,589
MALE POPULATION
36,701
FEMALE POPULATION
99.69
MALES / 100 FEMALES
100.31
FEMALES / 100 MALES
40.8
MEDIAN AGE
3.3
AVG FAMILY SIZE
2.8
AVG HOUSEHOLD SIZE
39,614
LABOR FORCE [ PEOPLE ]
67.7%
PERCENT IN LABOR FORCE
2.3%
UNEMPLOYMENT RATE
Income in Fauquier County
Income Overview in Fauquier County
Per Capita Income in Fauquier County is $54,878, while median incomes of families and households are $141,358 and $122,785 respectively.
| Characteristic | Number | Measure |
| Per Capita Income | 73,290 | $54,878 |
| Median Family Income | 19,194 | $141,358 |
| Mean Family Income | 19,194 | $170,190 |
| Median Household Income | 26,011 | $122,785 |
| Mean Household Income | 26,011 | $151,544 |
| Income Deficit | 19,194 | $8,537 |
| Wage / Income Gap (%) | 73,290 | 37.11% |
| Wage / Income Gap ($) | 73,290 | 62.89¢ per $1 |
| Gini / Inequality Index | 73,290 | 0.42 |
Earnings by Sex in Fauquier County
Average Earnings in Fauquier County are $55,635, $67,601 for men and $42,512 for women, a difference of 37.1%.
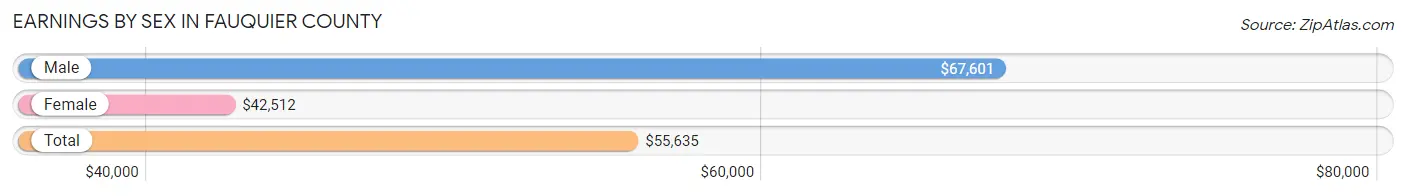
| Sex | Number | Average Earnings |
| Male | 22,450 (53.5%) | $67,601 |
| Female | 19,502 (46.5%) | $42,512 |
| Total | 41,952 (100.0%) | $55,635 |
Earnings by Sex by Income Bracket in Fauquier County
The most common earnings brackets in Fauquier County are $100,000+ for men (7,463 | 33.2%) and $100,000+ for women (3,351 | 17.2%).
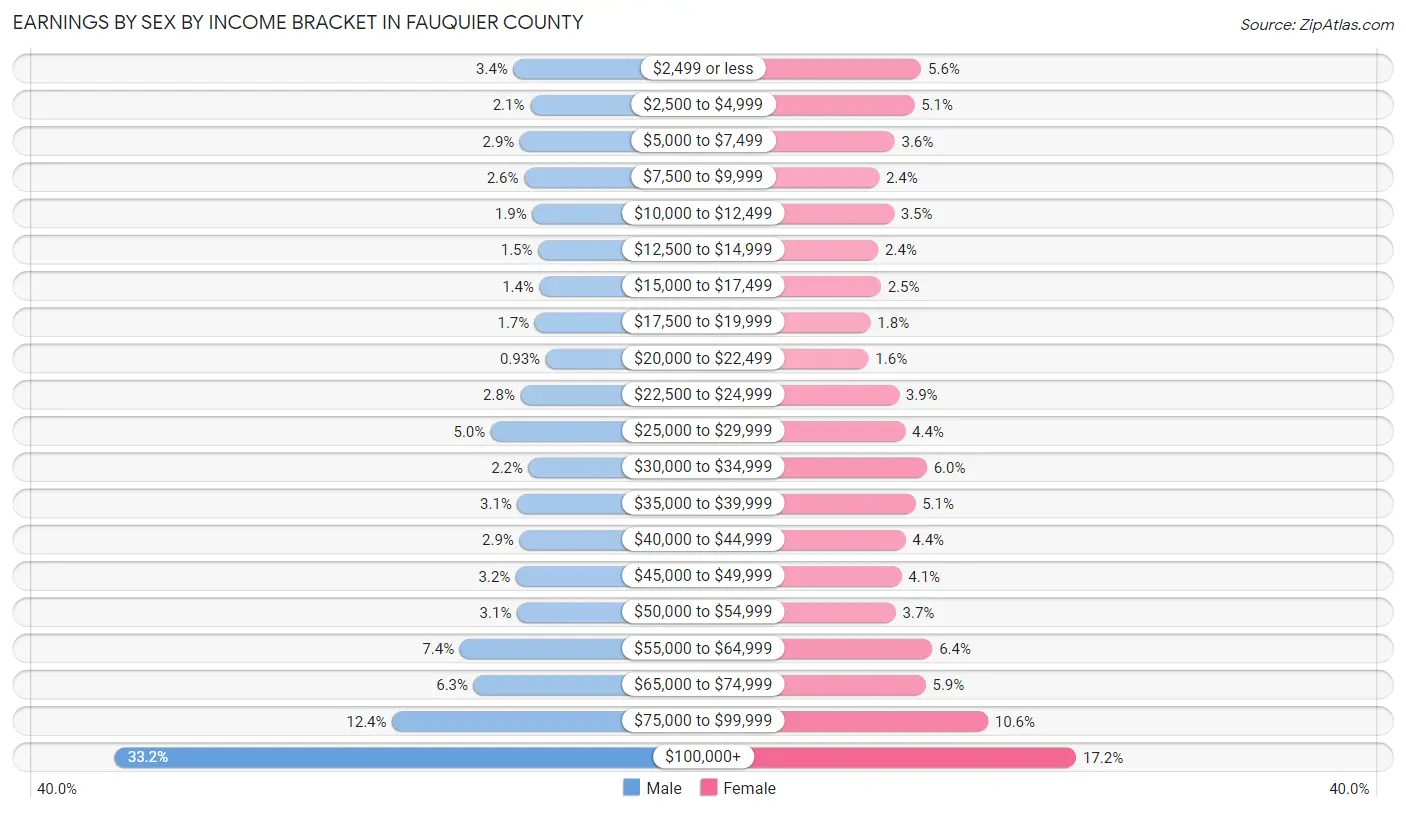
| Income | Male | Female |
| $2,499 or less | 752 (3.4%) | 1,087 (5.6%) |
| $2,500 to $4,999 | 471 (2.1%) | 985 (5.1%) |
| $5,000 to $7,499 | 641 (2.9%) | 698 (3.6%) |
| $7,500 to $9,999 | 572 (2.5%) | 470 (2.4%) |
| $10,000 to $12,499 | 433 (1.9%) | 687 (3.5%) |
| $12,500 to $14,999 | 337 (1.5%) | 458 (2.4%) |
| $15,000 to $17,499 | 313 (1.4%) | 496 (2.5%) |
| $17,500 to $19,999 | 390 (1.7%) | 345 (1.8%) |
| $20,000 to $22,499 | 209 (0.9%) | 316 (1.6%) |
| $22,500 to $24,999 | 633 (2.8%) | 761 (3.9%) |
| $25,000 to $29,999 | 1,131 (5.0%) | 852 (4.4%) |
| $30,000 to $34,999 | 497 (2.2%) | 1,169 (6.0%) |
| $35,000 to $39,999 | 685 (3.0%) | 1,000 (5.1%) |
| $40,000 to $44,999 | 652 (2.9%) | 856 (4.4%) |
| $45,000 to $49,999 | 709 (3.2%) | 798 (4.1%) |
| $50,000 to $54,999 | 692 (3.1%) | 713 (3.7%) |
| $55,000 to $64,999 | 1,655 (7.4%) | 1,248 (6.4%) |
| $65,000 to $74,999 | 1,422 (6.3%) | 1,150 (5.9%) |
| $75,000 to $99,999 | 2,793 (12.4%) | 2,062 (10.6%) |
| $100,000+ | 7,463 (33.2%) | 3,351 (17.2%) |
| Total | 22,450 (100.0%) | 19,502 (100.0%) |
Earnings by Sex by Educational Attainment in Fauquier County
Average earnings in Fauquier County are $79,499 for men and $50,124 for women, a difference of 36.9%. Men with an educational attainment of graduate degree enjoy the highest average annual earnings of $129,306, while those with less than high school education earn the least with $37,412. Women with an educational attainment of graduate degree earn the most with the average annual earnings of $68,900, while those with less than high school education have the smallest earnings of $27,351.
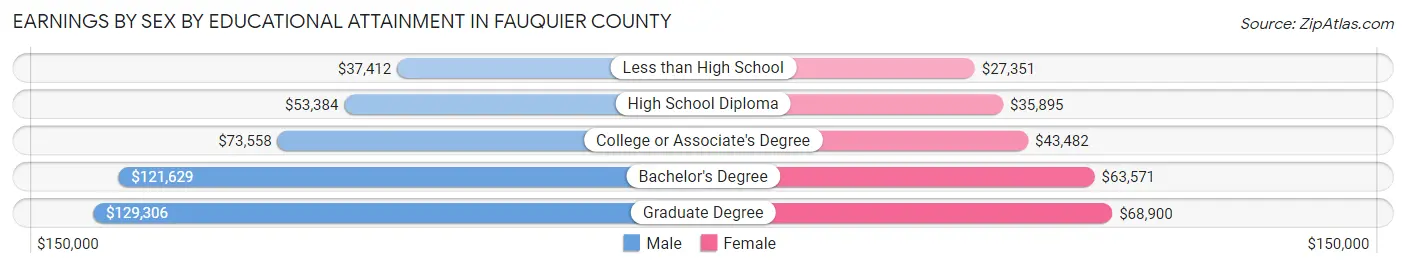
| Educational Attainment | Male Income | Female Income |
| Less than High School | $37,412 | $27,351 |
| High School Diploma | $53,384 | $35,895 |
| College or Associate's Degree | $73,558 | $43,482 |
| Bachelor's Degree | $121,629 | $63,571 |
| Graduate Degree | $129,306 | $68,900 |
| Total | $79,499 | $50,124 |
Family Income in Fauquier County
Family Income Brackets in Fauquier County
According to the Fauquier County family income data, there are 5,336 families falling into the $200,000+ income range, which is the most common income bracket and makes up 27.8% of all families. Conversely, the $10,000 to $14,999 income bracket is the least frequent group with only 154 families (0.8%) belonging to this category.
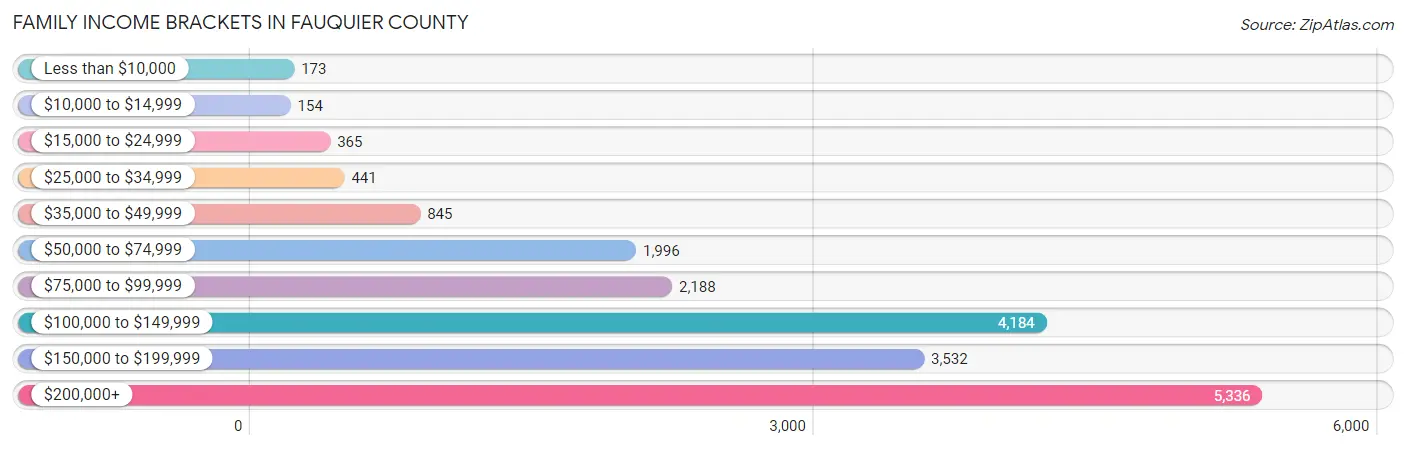
| Income Bracket | # Families | % Families |
| Less than $10,000 | 173 | 0.9% |
| $10,000 to $14,999 | 154 | 0.8% |
| $15,000 to $24,999 | 365 | 1.9% |
| $25,000 to $34,999 | 441 | 2.3% |
| $35,000 to $49,999 | 845 | 4.4% |
| $50,000 to $74,999 | 1,996 | 10.4% |
| $75,000 to $99,999 | 2,188 | 11.4% |
| $100,000 to $149,999 | 4,184 | 21.8% |
| $150,000 to $199,999 | 3,532 | 18.4% |
| $200,000+ | 5,336 | 27.8% |
Family Income by Famaliy Size in Fauquier County
7+ person families (159 | 0.8%) account for the highest median family income in Fauquier County with $250,001 per family, while 2-person families (8,395 | 43.7%) have the highest median income of $64,386 per family member.
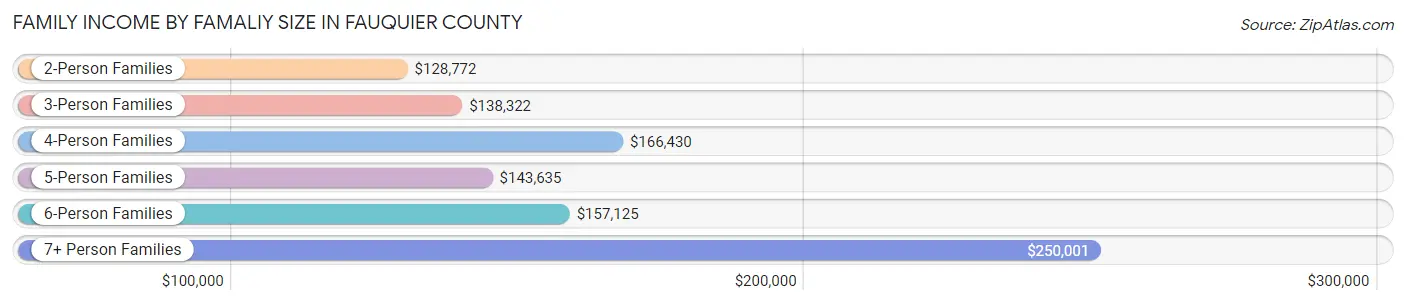
| Income Bracket | # Families | Median Income |
| 2-Person Families | 8,395 (43.7%) | $128,772 |
| 3-Person Families | 4,235 (22.1%) | $138,322 |
| 4-Person Families | 3,681 (19.2%) | $166,430 |
| 5-Person Families | 1,813 (9.5%) | $143,635 |
| 6-Person Families | 911 (4.8%) | $157,125 |
| 7+ Person Families | 159 (0.8%) | $250,001 |
| Total | 19,194 (100.0%) | $141,358 |
Family Income by Number of Earners in Fauquier County
The median family income in Fauquier County is $141,358, with families comprising 3+ earners (2,579) having the highest median family income of $176,464, while families with no earners (1,982) have the lowest median family income of $93,056, accounting for 13.4% and 10.3% of families, respectively.
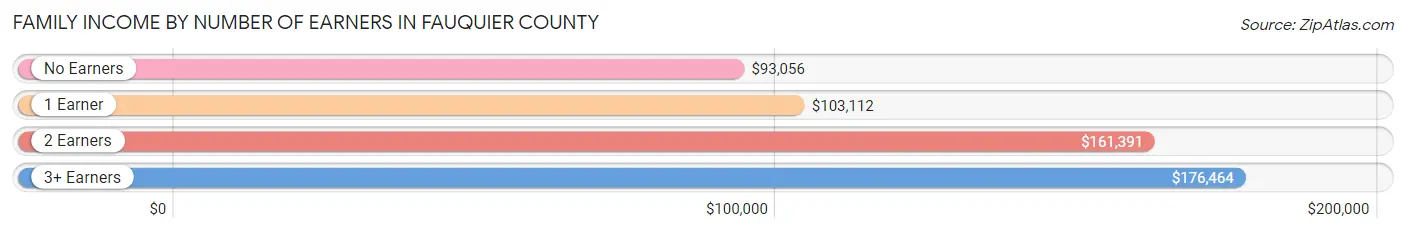
| Number of Earners | # Families | Median Income |
| No Earners | 1,982 (10.3%) | $93,056 |
| 1 Earner | 4,954 (25.8%) | $103,112 |
| 2 Earners | 9,679 (50.4%) | $161,391 |
| 3+ Earners | 2,579 (13.4%) | $176,464 |
| Total | 19,194 (100.0%) | $141,358 |
Household Income in Fauquier County
Household Income Brackets in Fauquier County
With 6,009 households falling in the category, the $200,000+ income range is the most frequent in Fauquier County, accounting for 23.1% of all households. In contrast, only 468 households (1.8%) fall into the less than $10,000 income bracket, making it the least populous group.
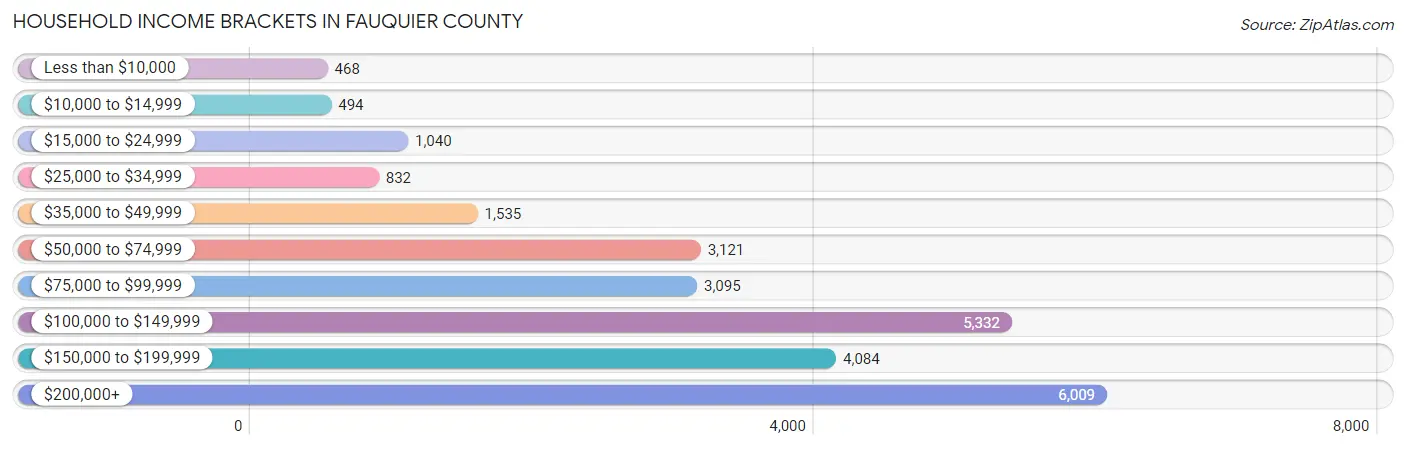
| Income Bracket | # Households | % Households |
| Less than $10,000 | 468 | 1.8% |
| $10,000 to $14,999 | 494 | 1.9% |
| $15,000 to $24,999 | 1,040 | 4.0% |
| $25,000 to $34,999 | 832 | 3.2% |
| $35,000 to $49,999 | 1,535 | 5.9% |
| $50,000 to $74,999 | 3,121 | 12.0% |
| $75,000 to $99,999 | 3,095 | 11.9% |
| $100,000 to $149,999 | 5,332 | 20.5% |
| $150,000 to $199,999 | 4,084 | 15.7% |
| $200,000+ | 6,009 | 23.1% |
Household Income by Householder Age in Fauquier County
The median household income in Fauquier County is $122,785, with the highest median household income of $149,724 found in the 45 to 64 years age bracket for the primary householder. A total of 10,657 households (41.0%) fall into this category. Meanwhile, the 15 to 24 years age bracket for the primary householder has the lowest median household income of $71,250, with 238 households (0.9%) in this group.
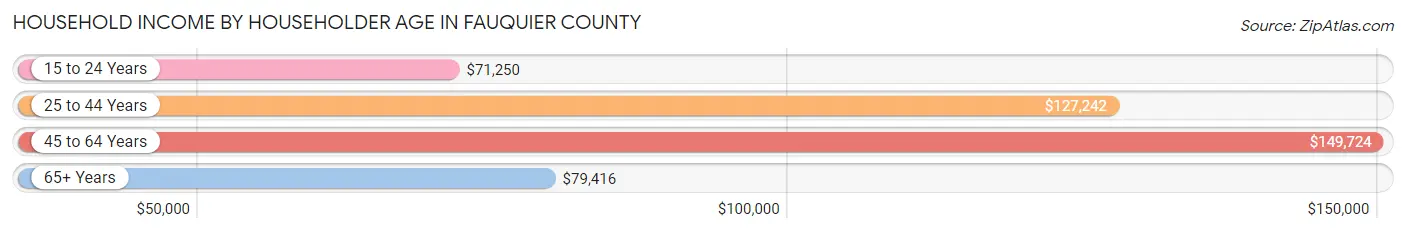
| Income Bracket | # Households | Median Income |
| 15 to 24 Years | 238 (0.9%) | $71,250 |
| 25 to 44 Years | 7,637 (29.4%) | $127,242 |
| 45 to 64 Years | 10,657 (41.0%) | $149,724 |
| 65+ Years | 7,479 (28.7%) | $79,416 |
| Total | 26,011 (100.0%) | $122,785 |
Poverty in Fauquier County
Income Below Poverty by Sex and Age in Fauquier County
With 5.5% poverty level for males and 6.1% for females among the residents of Fauquier County, 12 to 14 year old males and 16 and 17 year old females are the most vulnerable to poverty, with 154 males (11.5%) and 136 females (12.7%) in their respective age groups living below the poverty level.
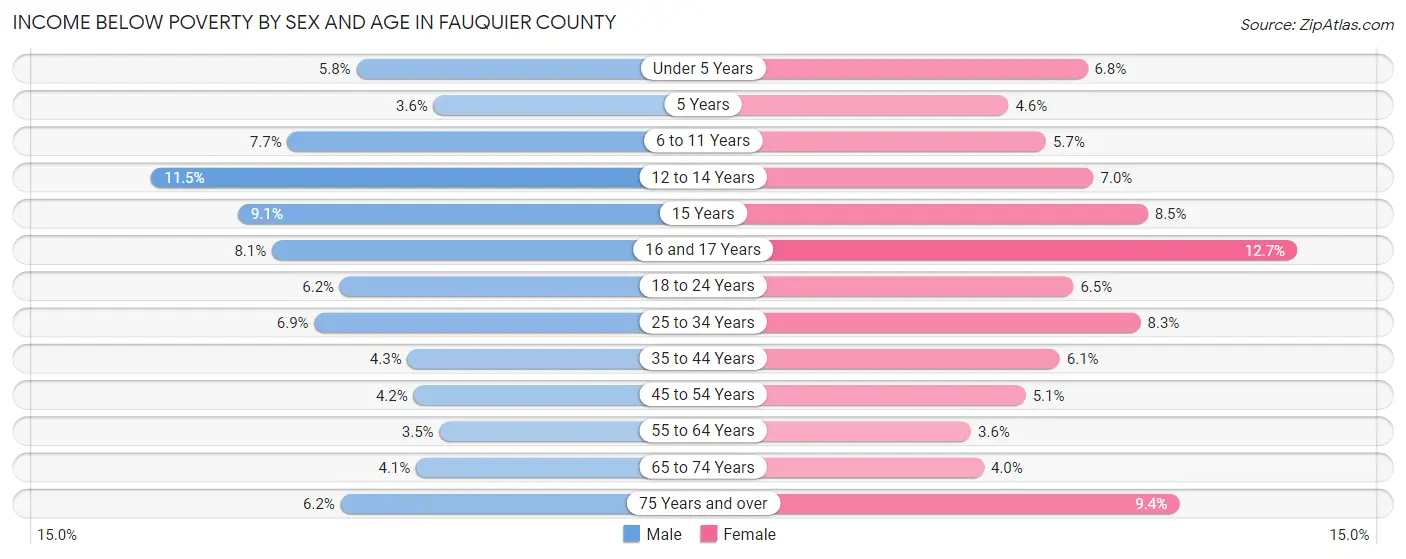
| Age Bracket | Male | Female |
| Under 5 Years | 117 (5.8%) | 141 (6.8%) |
| 5 Years | 19 (3.6%) | 7 (4.6%) |
| 6 to 11 Years | 237 (7.7%) | 150 (5.7%) |
| 12 to 14 Years | 154 (11.5%) | 121 (7.0%) |
| 15 Years | 51 (9.1%) | 41 (8.5%) |
| 16 and 17 Years | 89 (8.1%) | 136 (12.7%) |
| 18 to 24 Years | 190 (6.2%) | 188 (6.5%) |
| 25 to 34 Years | 265 (6.9%) | 319 (8.3%) |
| 35 to 44 Years | 213 (4.3%) | 276 (6.1%) |
| 45 to 54 Years | 199 (4.2%) | 259 (5.1%) |
| 55 to 64 Years | 195 (3.5%) | 196 (3.6%) |
| 65 to 74 Years | 143 (4.1%) | 147 (4.0%) |
| 75 Years and over | 132 (6.2%) | 256 (9.4%) |
| Total | 2,004 (5.5%) | 2,237 (6.1%) |
Income Above Poverty by Sex and Age in Fauquier County
According to the poverty statistics in Fauquier County, males aged 55 to 64 years and females aged 55 to 64 years are the age groups that are most secure financially, with 96.6% of males and 96.4% of females in these age groups living above the poverty line.
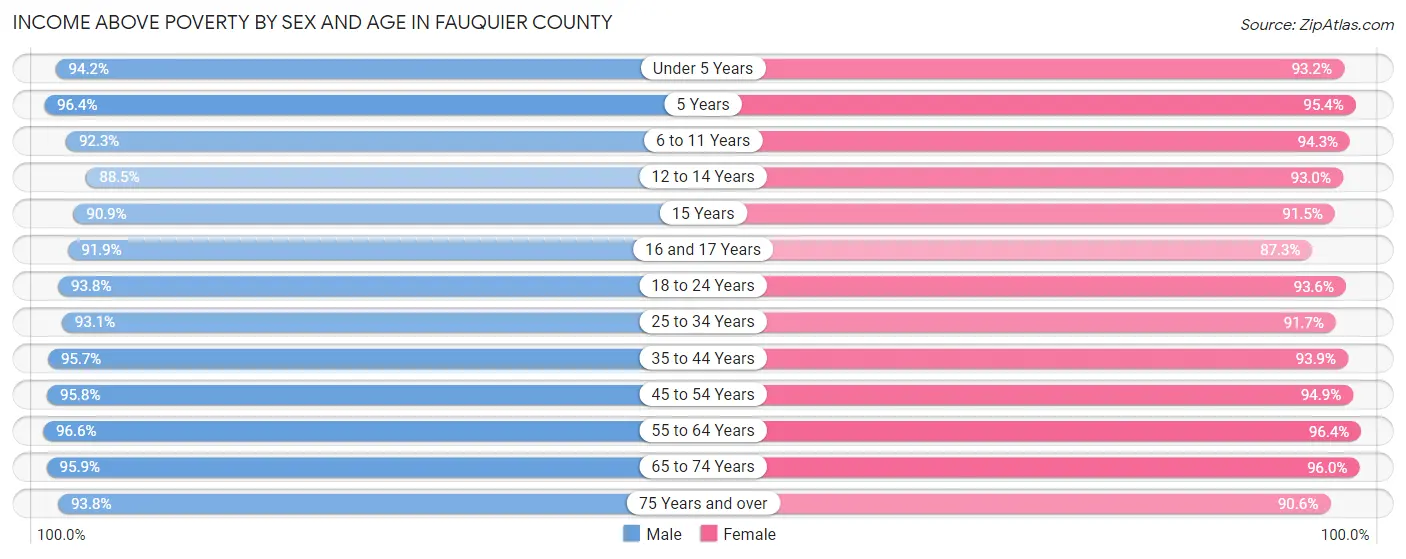
| Age Bracket | Male | Female |
| Under 5 Years | 1,915 (94.2%) | 1,920 (93.2%) |
| 5 Years | 508 (96.4%) | 144 (95.4%) |
| 6 to 11 Years | 2,849 (92.3%) | 2,487 (94.3%) |
| 12 to 14 Years | 1,189 (88.5%) | 1,604 (93.0%) |
| 15 Years | 512 (90.9%) | 440 (91.5%) |
| 16 and 17 Years | 1,008 (91.9%) | 937 (87.3%) |
| 18 to 24 Years | 2,866 (93.8%) | 2,728 (93.5%) |
| 25 to 34 Years | 3,558 (93.1%) | 3,513 (91.7%) |
| 35 to 44 Years | 4,695 (95.7%) | 4,273 (93.9%) |
| 45 to 54 Years | 4,576 (95.8%) | 4,802 (94.9%) |
| 55 to 64 Years | 5,450 (96.6%) | 5,245 (96.4%) |
| 65 to 74 Years | 3,344 (95.9%) | 3,564 (96.0%) |
| 75 Years and over | 1,998 (93.8%) | 2,471 (90.6%) |
| Total | 34,468 (94.5%) | 34,128 (93.9%) |
Income Below Poverty Among Married-Couple Families in Fauquier County
The poverty statistics for married-couple families in Fauquier County show that 2.3% or 353 of the total 15,117 families live below the poverty line. Families with 3 or 4 children have the highest poverty rate of 7.8%, comprising of 118 families. On the other hand, families with 5 or more children have the lowest poverty rate of 0.0%, which includes 0 families.
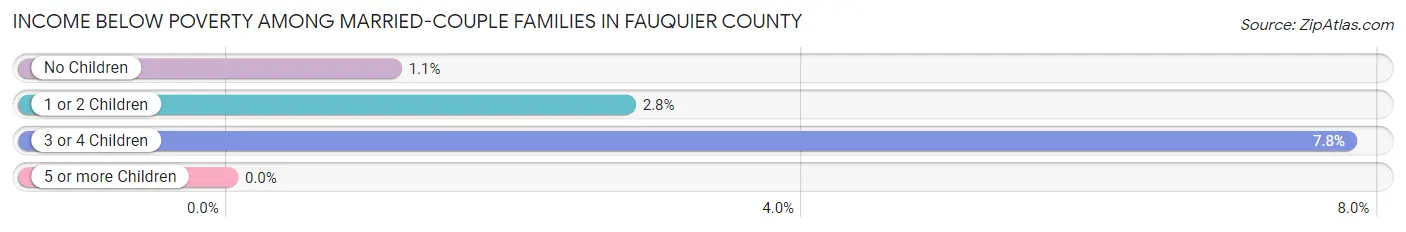
| Children | Above Poverty | Below Poverty |
| No Children | 8,466 (98.9%) | 98 (1.1%) |
| 1 or 2 Children | 4,817 (97.2%) | 137 (2.8%) |
| 3 or 4 Children | 1,397 (92.2%) | 118 (7.8%) |
| 5 or more Children | 84 (100.0%) | 0 (0.0%) |
| Total | 14,764 (97.7%) | 353 (2.3%) |
Income Below Poverty Among Single-Parent Households in Fauquier County
According to the poverty data in Fauquier County, 5.8% or 74 single-father households and 10.4% or 291 single-mother households are living below the poverty line. Among single-father households, those with 3 or 4 children have the highest poverty rate, with 24 households (22.9%) experiencing poverty. Likewise, among single-mother households, those with 3 or 4 children have the highest poverty rate, with 26 households (23.2%) falling below the poverty line.
| Children | Single Father | Single Mother |
| No Children | 40 (6.8%) | 59 (4.9%) |
| 1 or 2 Children | 10 (1.7%) | 206 (13.9%) |
| 3 or 4 Children | 24 (22.9%) | 26 (23.2%) |
| 5 or more Children | 0 (0.0%) | 0 (0.0%) |
| Total | 74 (5.8%) | 291 (10.4%) |
Income Below Poverty Among Married-Couple vs Single-Parent Households in Fauquier County
The poverty data for Fauquier County shows that 353 of the married-couple family households (2.3%) and 365 of the single-parent households (8.9%) are living below the poverty level. Within the married-couple family households, those with 3 or 4 children have the highest poverty rate, with 118 households (7.8%) falling below the poverty line. Among the single-parent households, those with 3 or 4 children have the highest poverty rate, with 50 household (23.0%) living below poverty.
| Children | Married-Couple Families | Single-Parent Households |
| No Children | 98 (1.1%) | 99 (5.5%) |
| 1 or 2 Children | 137 (2.8%) | 216 (10.4%) |
| 3 or 4 Children | 118 (7.8%) | 50 (23.0%) |
| 5 or more Children | 0 (0.0%) | 0 (0.0%) |
| Total | 353 (2.3%) | 365 (8.9%) |
Race in Fauquier County
The most populous races in Fauquier County are White / Caucasian (60,832 | 83.0%), Hispanic or Latino (7,224 | 9.9%), and Two or more Races (4,977 | 6.8%).
| Race | # Population | % Population |
| Asian | 1,318 | 1.8% |
| Black / African American | 4,844 | 6.6% |
| Hawaiian / Pacific | 21 | 0.0% |
| Hispanic or Latino | 7,224 | 9.9% |
| Native / Alaskan | 171 | 0.2% |
| White / Caucasian | 60,832 | 83.0% |
| Two or more Races | 4,977 | 6.8% |
| Some other Race | 1,127 | 1.5% |
| Total | 73,290 | 100.0% |
Ancestry in Fauquier County
The most populous ancestries reported in Fauquier County are German (11,689 | 16.0%), English (11,546 | 15.8%), Irish (8,867 | 12.1%), American (4,620 | 6.3%), and Italian (3,574 | 4.9%), together accounting for 55.0% of all Fauquier County residents.
| Ancestry | # Population | % Population |
| Afghan | 1 | 0.0% |
| African | 374 | 0.5% |
| Albanian | 43 | 0.1% |
| Alsatian | 16 | 0.0% |
| American | 4,620 | 6.3% |
| Apache | 2 | 0.0% |
| Arab | 168 | 0.2% |
| Argentinean | 127 | 0.2% |
| Armenian | 121 | 0.2% |
| Australian | 36 | 0.1% |
| Austrian | 134 | 0.2% |
| Belgian | 61 | 0.1% |
| Bermudan | 14 | 0.0% |
| Bhutanese | 131 | 0.2% |
| Blackfeet | 1 | 0.0% |
| Bolivian | 153 | 0.2% |
| Brazilian | 82 | 0.1% |
| British | 671 | 0.9% |
| British West Indian | 7 | 0.0% |
| Bulgarian | 83 | 0.1% |
| Burmese | 221 | 0.3% |
| Cajun | 35 | 0.1% |
| Canadian | 169 | 0.2% |
| Celtic | 43 | 0.1% |
| Central American | 2,264 | 3.1% |
| Central American Indian | 155 | 0.2% |
| Cherokee | 142 | 0.2% |
| Chilean | 49 | 0.1% |
| Chinese | 14 | 0.0% |
| Chippewa | 46 | 0.1% |
| Choctaw | 14 | 0.0% |
| Colombian | 246 | 0.3% |
| Comanche | 4 | 0.0% |
| Costa Rican | 73 | 0.1% |
| Croatian | 125 | 0.2% |
| Cuban | 308 | 0.4% |
| Cypriot | 190 | 0.3% |
| Czech | 140 | 0.2% |
| Czechoslovakian | 215 | 0.3% |
| Danish | 268 | 0.4% |
| Dominican | 64 | 0.1% |
| Dutch | 815 | 1.1% |
| Dutch West Indian | 10 | 0.0% |
| Eastern European | 270 | 0.4% |
| Ecuadorian | 34 | 0.1% |
| Egyptian | 17 | 0.0% |
| English | 11,546 | 15.8% |
| Ethiopian | 23 | 0.0% |
| European | 1,974 | 2.7% |
| Finnish | 128 | 0.2% |
| French | 1,690 | 2.3% |
| French Canadian | 295 | 0.4% |
| German | 11,689 | 16.0% |
| Greek | 664 | 0.9% |
| Guatemalan | 478 | 0.6% |
| Guyanese | 26 | 0.0% |
| Haitian | 74 | 0.1% |
| Honduran | 173 | 0.2% |
| Hungarian | 343 | 0.5% |
| Icelander | 54 | 0.1% |
| Indian (Asian) | 204 | 0.3% |
| Iranian | 20 | 0.0% |
| Iraqi | 1 | 0.0% |
| Irish | 8,867 | 12.1% |
| Iroquois | 19 | 0.0% |
| Israeli | 55 | 0.1% |
| Italian | 3,574 | 4.9% |
| Jamaican | 74 | 0.1% |
| Japanese | 23 | 0.0% |
| Korean | 442 | 0.6% |
| Laotian | 7 | 0.0% |
| Latvian | 53 | 0.1% |
| Lebanese | 56 | 0.1% |
| Lithuanian | 98 | 0.1% |
| Mexican | 2,551 | 3.5% |
| Mexican American Indian | 87 | 0.1% |
| Moroccan | 64 | 0.1% |
| Native Hawaiian | 56 | 0.1% |
| Navajo | 17 | 0.0% |
| New Zealander | 7 | 0.0% |
| Nicaraguan | 80 | 0.1% |
| Nigerian | 24 | 0.0% |
| Northern European | 266 | 0.4% |
| Norwegian | 666 | 0.9% |
| Pakistani | 10 | 0.0% |
| Panamanian | 15 | 0.0% |
| Pennsylvania German | 72 | 0.1% |
| Peruvian | 287 | 0.4% |
| Polish | 2,107 | 2.9% |
| Portuguese | 248 | 0.3% |
| Puerto Rican | 696 | 0.9% |
| Romanian | 48 | 0.1% |
| Russian | 332 | 0.4% |
| Salvadoran | 1,445 | 2.0% |
| Scandinavian | 562 | 0.8% |
| Scotch-Irish | 1,132 | 1.5% |
| Scottish | 2,903 | 4.0% |
| Serbian | 4 | 0.0% |
| Slavic | 50 | 0.1% |
| Slovak | 275 | 0.4% |
| South African | 37 | 0.1% |
| South American | 949 | 1.3% |
| Spaniard | 92 | 0.1% |
| Spanish | 59 | 0.1% |
| Sri Lankan | 129 | 0.2% |
| Subsaharan African | 458 | 0.6% |
| Swedish | 610 | 0.8% |
| Swiss | 105 | 0.1% |
| Syrian | 18 | 0.0% |
| Thai | 200 | 0.3% |
| Trinidadian and Tobagonian | 65 | 0.1% |
| Turkish | 61 | 0.1% |
| Ukrainian | 196 | 0.3% |
| Venezuelan | 53 | 0.1% |
| Vietnamese | 260 | 0.4% |
| Welsh | 557 | 0.8% |
| West Indian | 17 | 0.0% |
| Yaqui | 4 | 0.0% |
| Yugoslavian | 32 | 0.0% | View All 119 Rows |
Immigrants in Fauquier County
The most numerous immigrant groups reported in Fauquier County came from Latin America (3,483 | 4.8%), Central America (2,641 | 3.6%), Mexico (1,232 | 1.7%), Asia (1,069 | 1.5%), and Europe (856 | 1.2%), together accounting for 12.7% of all Fauquier County residents.
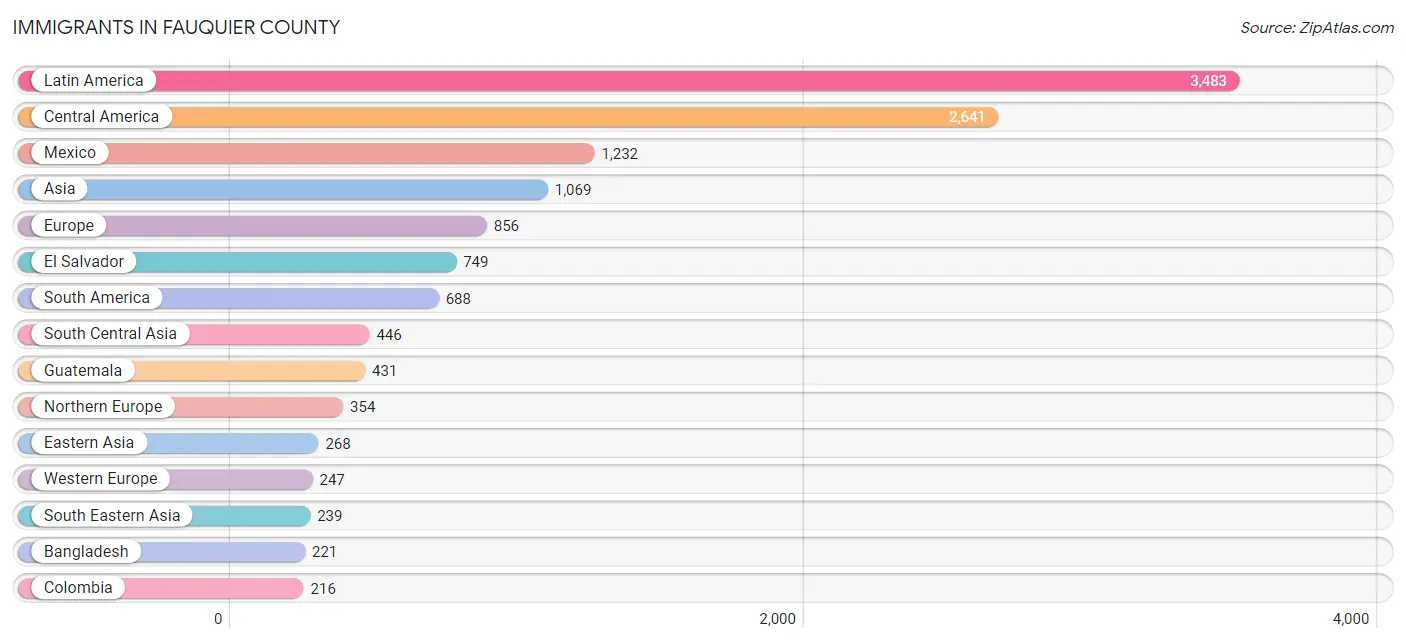
| Immigration Origin | # Population | % Population |
| Afghanistan | 1 | 0.0% |
| Africa | 109 | 0.2% |
| Asia | 1,069 | 1.5% |
| Australia | 30 | 0.0% |
| Austria | 7 | 0.0% |
| Bangladesh | 221 | 0.3% |
| Belarus | 29 | 0.0% |
| Belgium | 33 | 0.1% |
| Bolivia | 38 | 0.1% |
| Brazil | 149 | 0.2% |
| Bulgaria | 52 | 0.1% |
| Cambodia | 11 | 0.0% |
| Canada | 132 | 0.2% |
| Caribbean | 154 | 0.2% |
| Central America | 2,641 | 3.6% |
| Chile | 49 | 0.1% |
| China | 71 | 0.1% |
| Colombia | 216 | 0.3% |
| Costa Rica | 66 | 0.1% |
| Cuba | 11 | 0.0% |
| Czechoslovakia | 20 | 0.0% |
| Dominican Republic | 47 | 0.1% |
| Eastern Africa | 49 | 0.1% |
| Eastern Asia | 268 | 0.4% |
| Eastern Europe | 152 | 0.2% |
| Egypt | 14 | 0.0% |
| El Salvador | 749 | 1.0% |
| England | 95 | 0.1% |
| Europe | 856 | 1.2% |
| France | 25 | 0.0% |
| Germany | 161 | 0.2% |
| Ghana | 22 | 0.0% |
| Greece | 61 | 0.1% |
| Grenada | 7 | 0.0% |
| Guatemala | 431 | 0.6% |
| Guyana | 26 | 0.0% |
| Haiti | 12 | 0.0% |
| Honduras | 129 | 0.2% |
| Hungary | 25 | 0.0% |
| India | 156 | 0.2% |
| Indonesia | 7 | 0.0% |
| Ireland | 12 | 0.0% |
| Israel | 15 | 0.0% |
| Italy | 28 | 0.0% |
| Jamaica | 45 | 0.1% |
| Japan | 45 | 0.1% |
| Kenya | 12 | 0.0% |
| Korea | 152 | 0.2% |
| Latin America | 3,483 | 4.8% |
| Lithuania | 5 | 0.0% |
| Mexico | 1,232 | 1.7% |
| Morocco | 5 | 0.0% |
| Netherlands | 21 | 0.0% |
| Nicaragua | 34 | 0.1% |
| Nigeria | 17 | 0.0% |
| Northern Africa | 19 | 0.0% |
| Northern Europe | 354 | 0.5% |
| Oceania | 37 | 0.1% |
| Pakistan | 68 | 0.1% |
| Peru | 157 | 0.2% |
| Philippines | 186 | 0.3% |
| Portugal | 14 | 0.0% |
| Scotland | 95 | 0.1% |
| Singapore | 4 | 0.0% |
| South Africa | 2 | 0.0% |
| South America | 688 | 0.9% |
| South Central Asia | 446 | 0.6% |
| South Eastern Asia | 239 | 0.3% |
| Southern Europe | 103 | 0.1% |
| Taiwan | 8 | 0.0% |
| Thailand | 9 | 0.0% |
| Trinidad and Tobago | 27 | 0.0% |
| Turkey | 49 | 0.1% |
| Ukraine | 21 | 0.0% |
| Venezuela | 53 | 0.1% |
| Vietnam | 22 | 0.0% |
| Western Africa | 39 | 0.1% |
| Western Asia | 116 | 0.2% |
| Western Europe | 247 | 0.3% |
| Zimbabwe | 37 | 0.1% | View All 80 Rows |
Sex and Age in Fauquier County
Sex and Age in Fauquier County
The most populous age groups in Fauquier County are 35 to 39 Years (3,136 | 8.6%) for men and 55 to 59 Years (3,108 | 8.5%) for women.
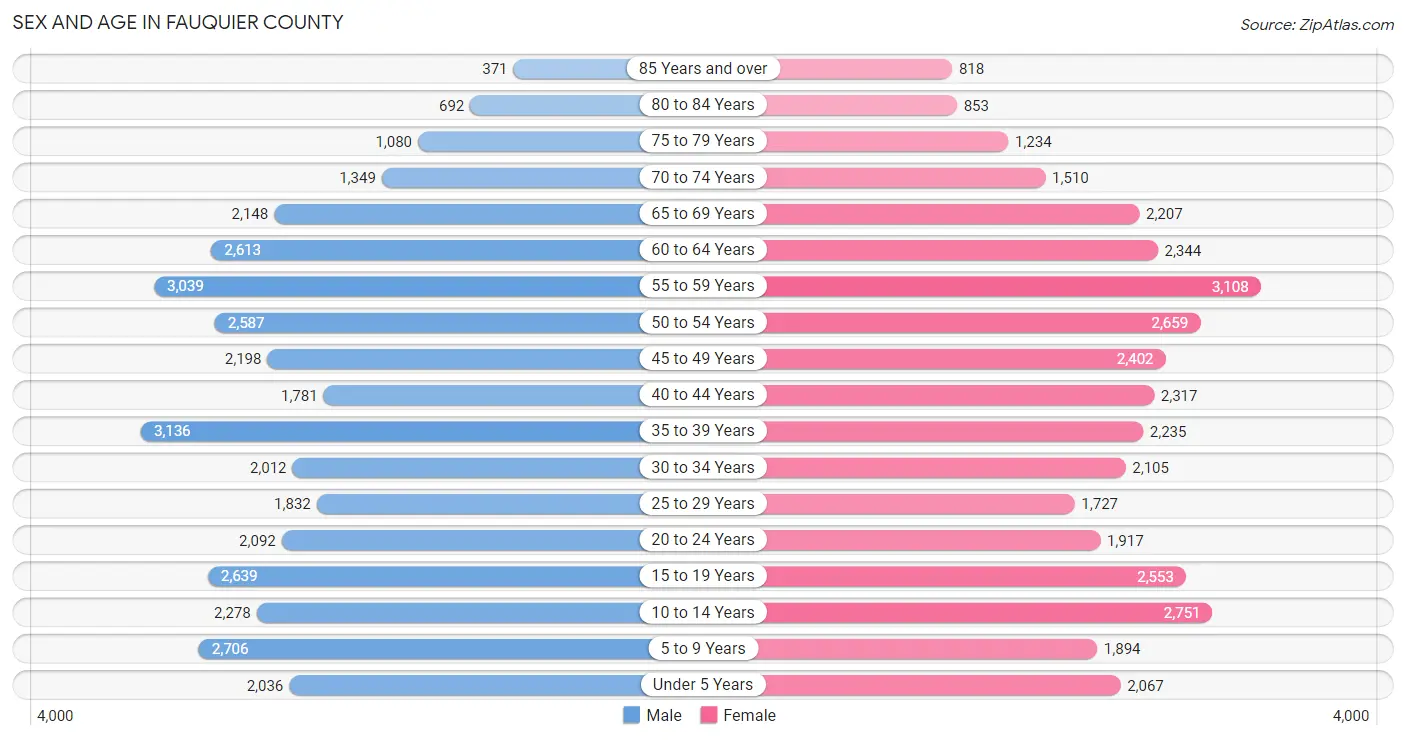
| Age Bracket | Male | Female |
| Under 5 Years | 2,036 (5.6%) | 2,067 (5.6%) |
| 5 to 9 Years | 2,706 (7.4%) | 1,894 (5.2%) |
| 10 to 14 Years | 2,278 (6.2%) | 2,751 (7.5%) |
| 15 to 19 Years | 2,639 (7.2%) | 2,553 (7.0%) |
| 20 to 24 Years | 2,092 (5.7%) | 1,917 (5.2%) |
| 25 to 29 Years | 1,832 (5.0%) | 1,727 (4.7%) |
| 30 to 34 Years | 2,012 (5.5%) | 2,105 (5.7%) |
| 35 to 39 Years | 3,136 (8.6%) | 2,235 (6.1%) |
| 40 to 44 Years | 1,781 (4.9%) | 2,317 (6.3%) |
| 45 to 49 Years | 2,198 (6.0%) | 2,402 (6.5%) |
| 50 to 54 Years | 2,587 (7.1%) | 2,659 (7.2%) |
| 55 to 59 Years | 3,039 (8.3%) | 3,108 (8.5%) |
| 60 to 64 Years | 2,613 (7.1%) | 2,344 (6.4%) |
| 65 to 69 Years | 2,148 (5.9%) | 2,207 (6.0%) |
| 70 to 74 Years | 1,349 (3.7%) | 1,510 (4.1%) |
| 75 to 79 Years | 1,080 (2.9%) | 1,234 (3.4%) |
| 80 to 84 Years | 692 (1.9%) | 853 (2.3%) |
| 85 Years and over | 371 (1.0%) | 818 (2.2%) |
| Total | 36,589 (100.0%) | 36,701 (100.0%) |
Families and Households in Fauquier County
Median Family Size in Fauquier County
The median family size in Fauquier County is 3.26 persons per family, with married-couple families (15,117 | 78.8%) accounting for the largest median family size of 3.31 persons per family. On the other hand, single male/father families (1,287 | 6.7%) represent the smallest median family size with 2.73 persons per family.
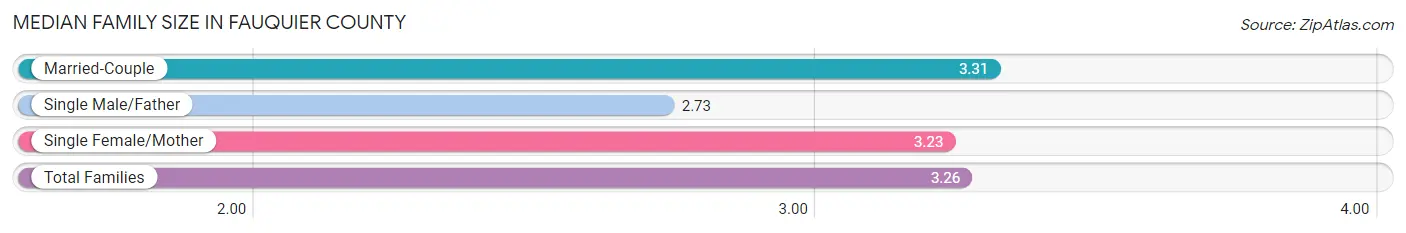
| Family Type | # Families | Family Size |
| Married-Couple | 15,117 (78.8%) | 3.31 |
| Single Male/Father | 1,287 (6.7%) | 2.73 |
| Single Female/Mother | 2,790 (14.5%) | 3.23 |
| Total Families | 19,194 (100.0%) | 3.26 |
Median Household Size in Fauquier County
The median household size in Fauquier County is 2.80 persons per household, with single female/mother households (2,790 | 10.7%) accounting for the largest median household size of 3.53 persons per household. non-family households (6,817 | 26.2%) represent the smallest median household size with 1.25 persons per household.
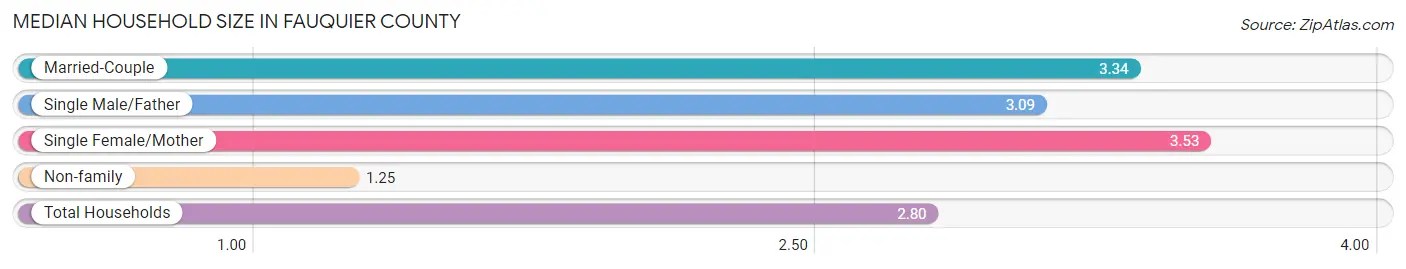
| Household Type | # Households | Household Size |
| Married-Couple | 15,117 (58.1%) | 3.34 |
| Single Male/Father | 1,287 (5.0%) | 3.09 |
| Single Female/Mother | 2,790 (10.7%) | 3.53 |
| Non-family | 6,817 (26.2%) | 1.25 |
| Total Households | 26,011 (100.0%) | 2.80 |
Household Size by Marriage Status in Fauquier County
Out of a total of 26,011 households in Fauquier County, 19,194 (73.8%) are family households, while 6,817 (26.2%) are nonfamily households. The most numerous type of family households are 2-person households, comprising 7,824, and the most common type of nonfamily households are 1-person households, comprising 5,576.
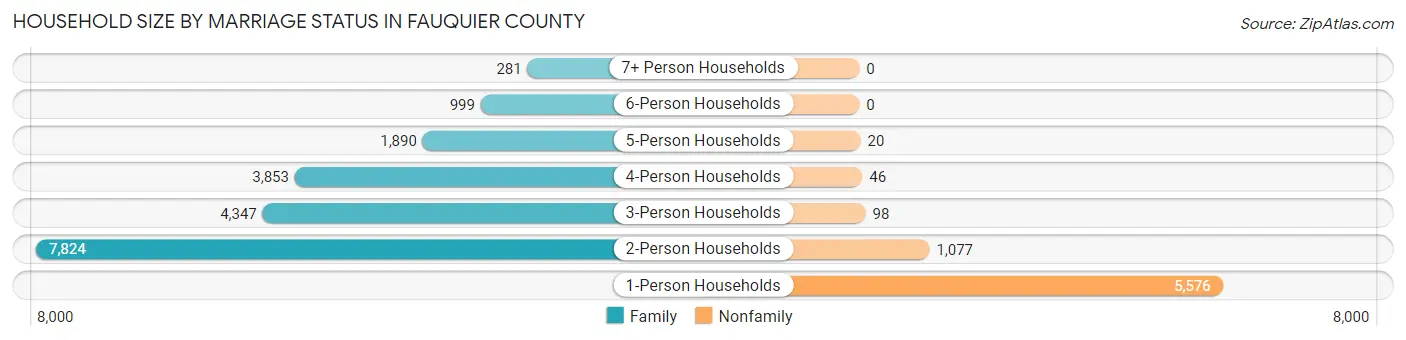
| Household Size | Family Households | Nonfamily Households |
| 1-Person Households | - | 5,576 (21.4%) |
| 2-Person Households | 7,824 (30.1%) | 1,077 (4.1%) |
| 3-Person Households | 4,347 (16.7%) | 98 (0.4%) |
| 4-Person Households | 3,853 (14.8%) | 46 (0.2%) |
| 5-Person Households | 1,890 (7.3%) | 20 (0.1%) |
| 6-Person Households | 999 (3.8%) | 0 (0.0%) |
| 7+ Person Households | 281 (1.1%) | 0 (0.0%) |
| Total | 19,194 (73.8%) | 6,817 (26.2%) |
Female Fertility in Fauquier County
Fertility by Age in Fauquier County
Average fertility rate in Fauquier County is 44.0 births per 1,000 women. Women in the age bracket of 20 to 34 years have the highest fertility rate with 96.0 births per 1,000 women. Women in the age bracket of 20 to 34 years acount for 79.7% of all women with births.
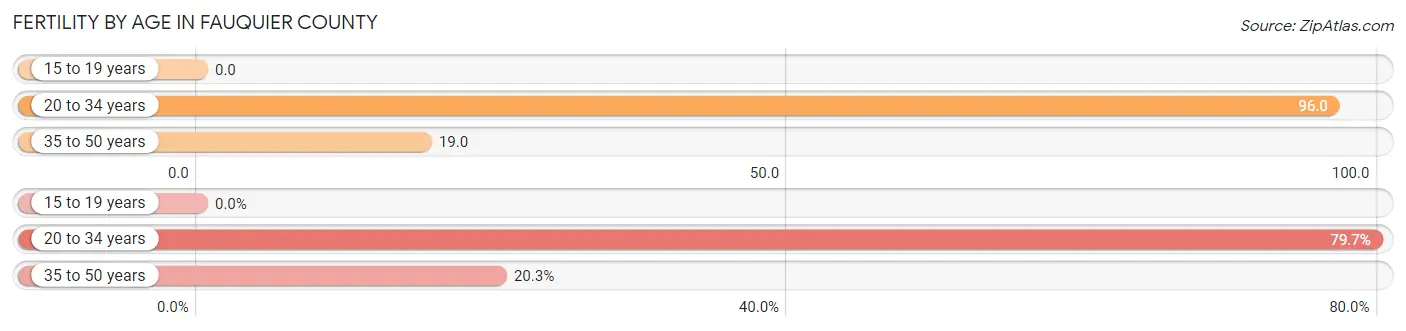
| Age Bracket | Women with Births | Births / 1,000 Women |
| 15 to 19 years | 0 (0.0%) | 0.0 |
| 20 to 34 years | 554 (79.7%) | 96.0 |
| 35 to 50 years | 141 (20.3%) | 19.0 |
| Total | 695 (100.0%) | 44.0 |
Fertility by Age by Marriage Status in Fauquier County
89.1% of women with births (695) in Fauquier County are married. The highest percentage of unmarried women with births falls into 20 to 34 years age bracket with 13.7% of them unmarried at the time of birth, while the lowest percentage of unmarried women with births belong to 35 to 50 years age bracket with 0.0% of them unmarried.
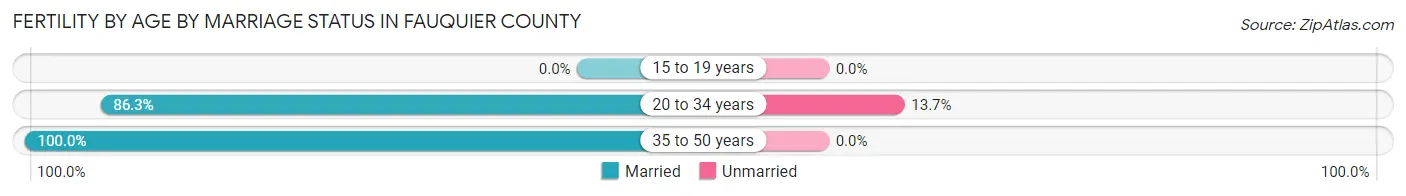
| Age Bracket | Married | Unmarried |
| 15 to 19 years | 0 (0.0%) | 0 (0.0%) |
| 20 to 34 years | 478 (86.3%) | 76 (13.7%) |
| 35 to 50 years | 141 (100.0%) | 0 (0.0%) |
| Total | 619 (89.1%) | 76 (10.9%) |
Fertility by Education in Fauquier County
Average fertility rate in Fauquier County is 44.0 births per 1,000 women. Women with the education attainment of college or associate's degree have the highest fertility rate of 60.0 births per 1,000 women, while women with the education attainment of less than high school have the lowest fertility at 15.0 births per 1,000 women. Women with the education attainment of college or associate's degree represent 41.1% of all women with births.
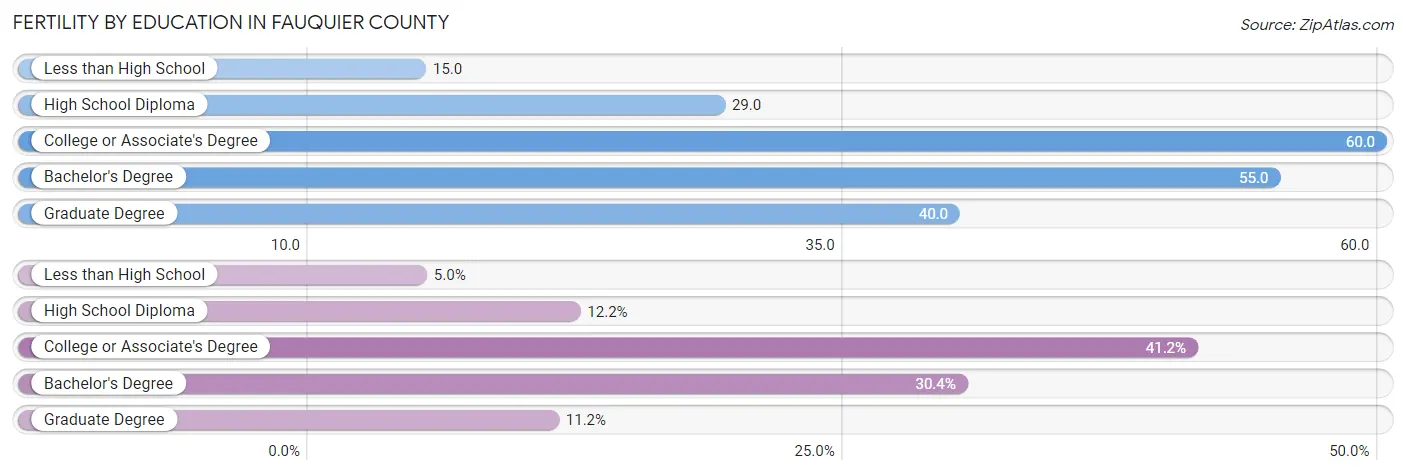
| Educational Attainment | Women with Births | Births / 1,000 Women |
| Less than High School | 35 (5.0%) | 15.0 |
| High School Diploma | 85 (12.2%) | 29.0 |
| College or Associate's Degree | 286 (41.1%) | 60.0 |
| Bachelor's Degree | 211 (30.4%) | 55.0 |
| Graduate Degree | 78 (11.2%) | 40.0 |
| Total | 695 (100.0%) | 44.0 |
Fertility by Education by Marriage Status in Fauquier County
10.9% of women with births in Fauquier County are unmarried. Women with the educational attainment of bachelor's degree are most likely to be married with 100.0% of them married at childbirth, while women with the educational attainment of less than high school are least likely to be married with 74.3% of them unmarried at childbirth.
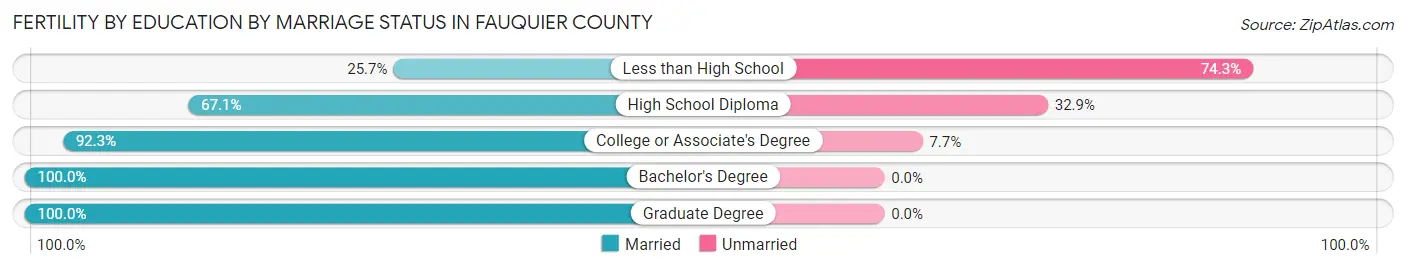
| Educational Attainment | Married | Unmarried |
| Less than High School | 9 (25.7%) | 26 (74.3%) |
| High School Diploma | 57 (67.1%) | 28 (32.9%) |
| College or Associate's Degree | 264 (92.3%) | 22 (7.7%) |
| Bachelor's Degree | 211 (100.0%) | 0 (0.0%) |
| Graduate Degree | 78 (100.0%) | 0 (0.0%) |
| Total | 619 (89.1%) | 76 (10.9%) |
Employment Characteristics in Fauquier County
Employment by Class of Employer in Fauquier County
Among the 38,097 employed individuals in Fauquier County, private company employees (24,141 | 63.4%), local government employees (4,094 | 10.7%), and federal government employees (2,854 | 7.5%) make up the most common classes of employment.
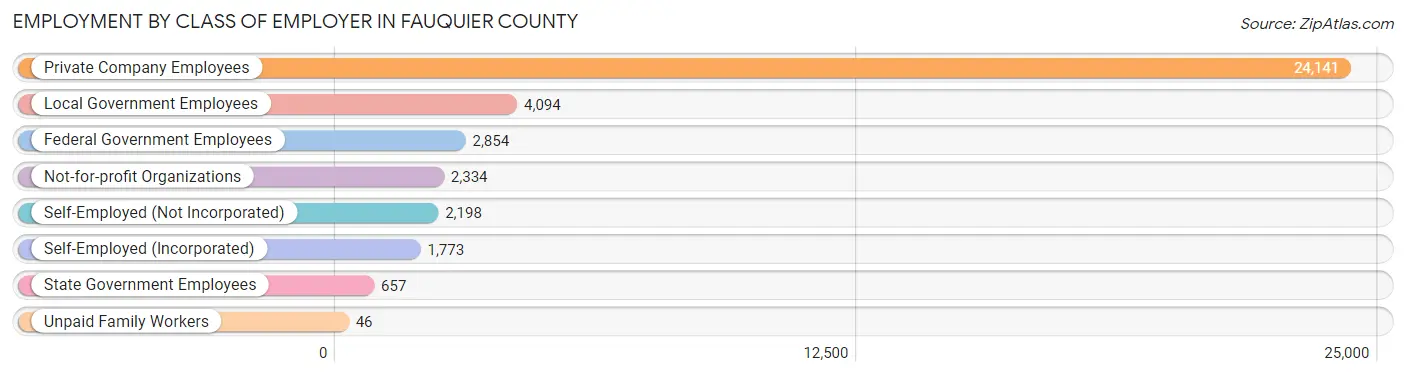
| Employer Class | # Employees | % Employees |
| Private Company Employees | 24,141 | 63.4% |
| Self-Employed (Incorporated) | 1,773 | 4.6% |
| Self-Employed (Not Incorporated) | 2,198 | 5.8% |
| Not-for-profit Organizations | 2,334 | 6.1% |
| Local Government Employees | 4,094 | 10.7% |
| State Government Employees | 657 | 1.7% |
| Federal Government Employees | 2,854 | 7.5% |
| Unpaid Family Workers | 46 | 0.1% |
| Total | 38,097 | 100.0% |
Employment Status by Age in Fauquier County
According to the labor force statistics for Fauquier County, out of the total population over 16 years of age (58,514), 67.7% or 39,614 individuals are in the labor force, with 2.3% or 911 of them unemployed. The age group with the highest labor force participation rate is 35 to 44 years, with 90.9% or 8,607 individuals in the labor force. Within the labor force, the 16 to 19 years age range has the highest percentage of unemployed individuals, with 6.2% or 117 of them being unemployed.
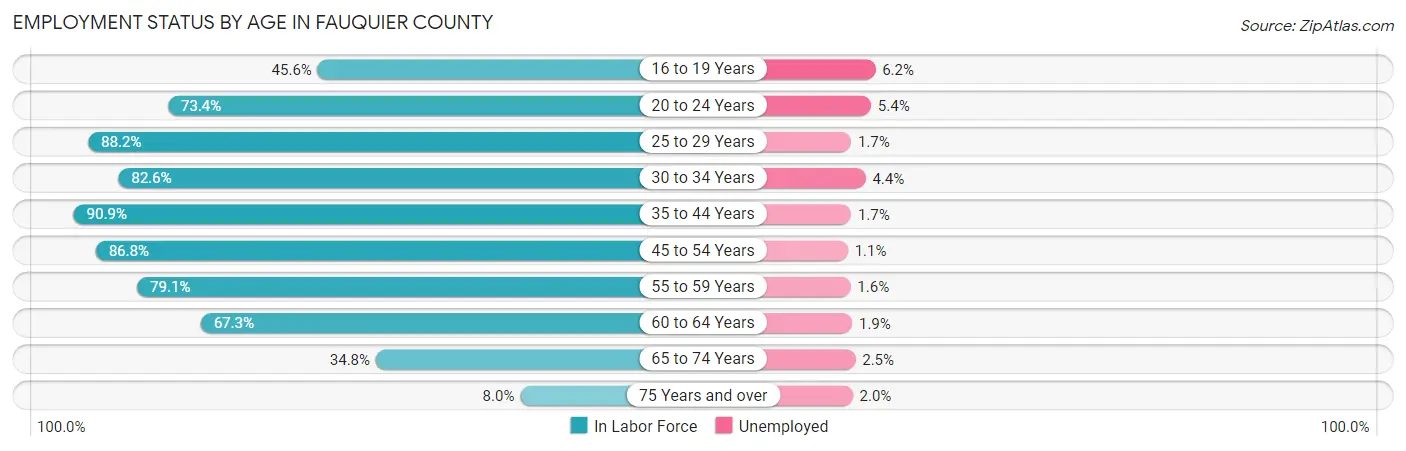
| Age Bracket | In Labor Force | Unemployed |
| 16 to 19 Years | 1,891 (45.6%) | 117 (6.2%) |
| 20 to 24 Years | 2,943 (73.4%) | 159 (5.4%) |
| 25 to 29 Years | 3,139 (88.2%) | 53 (1.7%) |
| 30 to 34 Years | 3,401 (82.6%) | 150 (4.4%) |
| 35 to 44 Years | 8,607 (90.9%) | 146 (1.7%) |
| 45 to 54 Years | 8,546 (86.8%) | 94 (1.1%) |
| 55 to 59 Years | 4,862 (79.1%) | 78 (1.6%) |
| 60 to 64 Years | 3,336 (67.3%) | 63 (1.9%) |
| 65 to 74 Years | 2,510 (34.8%) | 63 (2.5%) |
| 75 Years and over | 404 (8.0%) | 8 (2.0%) |
| Total | 39,614 (67.7%) | 911 (2.3%) |
Employment Status by Educational Attainment in Fauquier County
According to labor force statistics for Fauquier County, 83.7% of individuals (31,886) out of the total population between 25 and 64 years of age (38,095) are in the labor force, with 1.8% or 574 of them being unemployed. The group with the highest labor force participation rate are those with the educational attainment of bachelor's degree or higher, with 88.2% or 13,500 individuals in the labor force. Within the labor force, individuals with less than high school education have the highest percentage of unemployment, with 4.3% or 89 of them being unemployed.
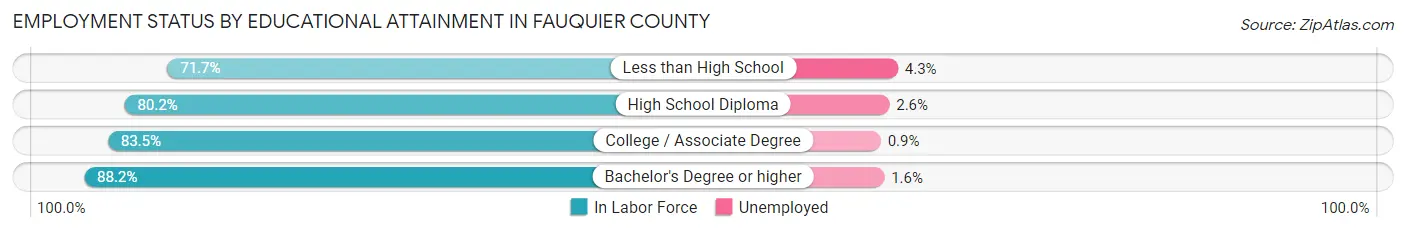
| Educational Attainment | In Labor Force | Unemployed |
| Less than High School | 2,074 (71.7%) | 124 (4.3%) |
| High School Diploma | 6,961 (80.2%) | 226 (2.6%) |
| College / Associate Degree | 9,366 (83.5%) | 101 (0.9%) |
| Bachelor's Degree or higher | 13,500 (88.2%) | 245 (1.6%) |
| Total | 31,886 (83.7%) | 686 (1.8%) |
Employment Occupations by Sex in Fauquier County
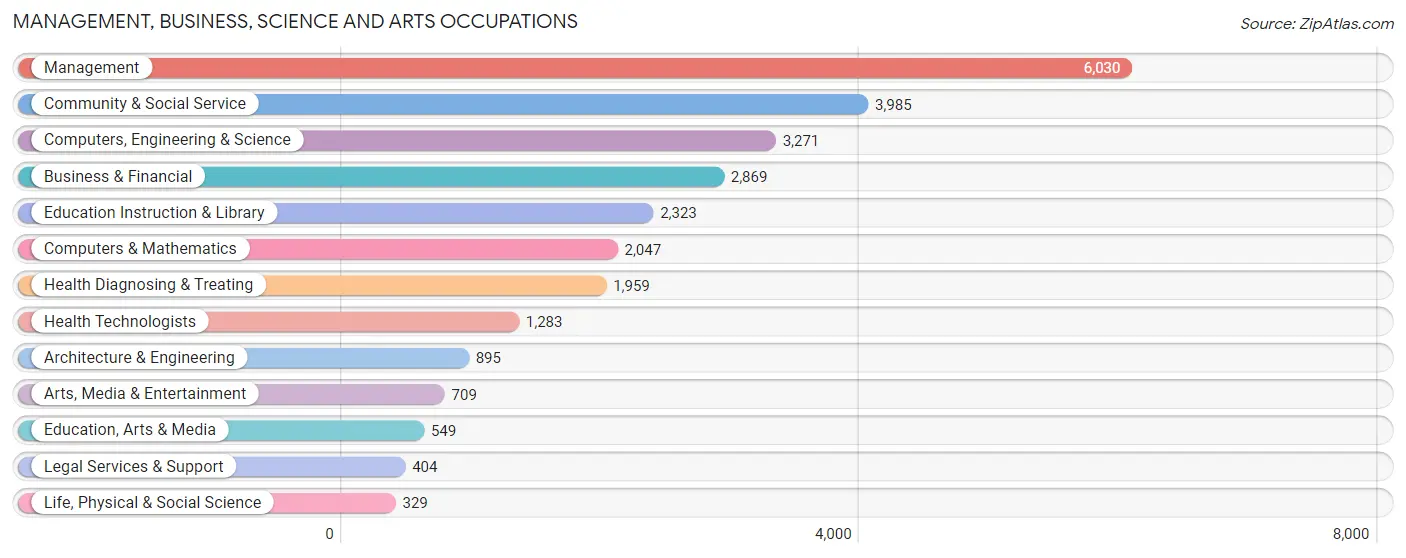
Management, Business, Science and Arts Occupations
The most common Management, Business, Science and Arts occupations in Fauquier County are Management (6,030 | 15.6%), Community & Social Service (3,985 | 10.3%), Computers, Engineering & Science (3,271 | 8.5%), Business & Financial (2,869 | 7.4%), and Education Instruction & Library (2,323 | 6.0%).
Management, Business, Science and Arts Occupations by Sex
Within the Management, Business, Science and Arts occupations in Fauquier County, the most male-oriented occupations are Architecture & Engineering (85.9%), Computers & Mathematics (79.8%), and Computers, Engineering & Science (78.5%), while the most female-oriented occupations are Health Diagnosing & Treating (79.0%), Health Technologists (78.1%), and Education Instruction & Library (74.8%).
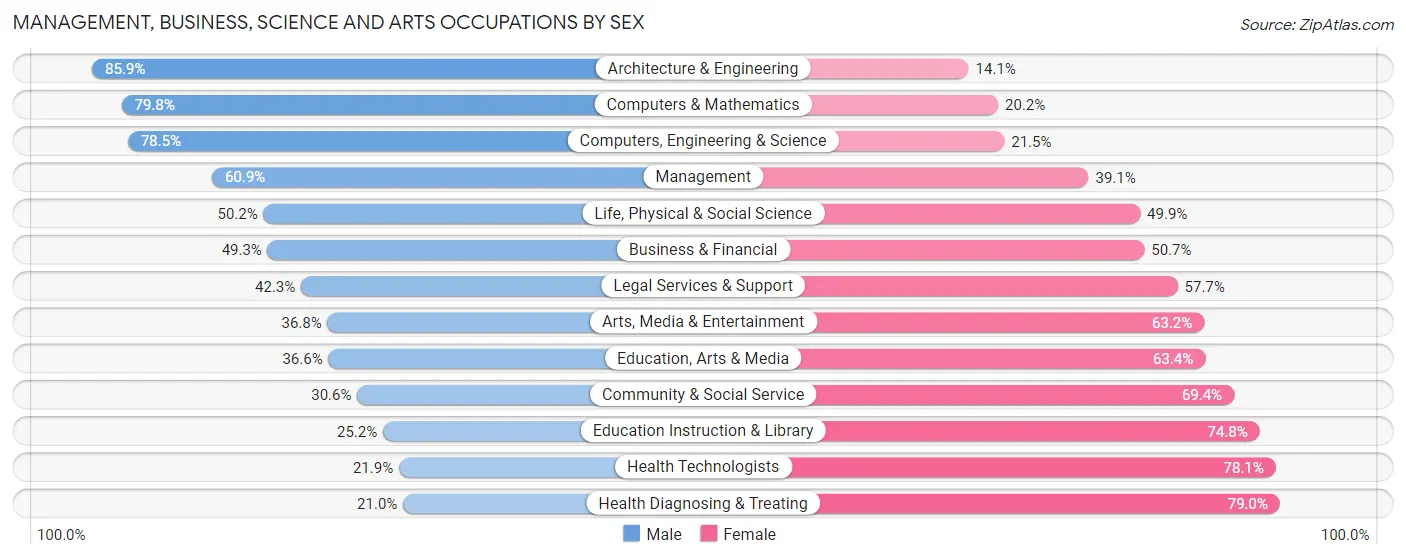
| Occupation | Male | Female |
| Management | 3,673 (60.9%) | 2,357 (39.1%) |
| Business & Financial | 1,414 (49.3%) | 1,455 (50.7%) |
| Computers, Engineering & Science | 2,567 (78.5%) | 704 (21.5%) |
| Computers & Mathematics | 1,633 (79.8%) | 414 (20.2%) |
| Architecture & Engineering | 769 (85.9%) | 126 (14.1%) |
| Life, Physical & Social Science | 165 (50.1%) | 164 (49.8%) |
| Community & Social Service | 1,219 (30.6%) | 2,766 (69.4%) |
| Education, Arts & Media | 201 (36.6%) | 348 (63.4%) |
| Legal Services & Support | 171 (42.3%) | 233 (57.7%) |
| Education Instruction & Library | 586 (25.2%) | 1,737 (74.8%) |
| Arts, Media & Entertainment | 261 (36.8%) | 448 (63.2%) |
| Health Diagnosing & Treating | 412 (21.0%) | 1,547 (79.0%) |
| Health Technologists | 281 (21.9%) | 1,002 (78.1%) |
| Total (Category) | 9,285 (51.3%) | 8,829 (48.7%) |
| Total (Overall) | 20,900 (54.0%) | 17,789 (46.0%) |
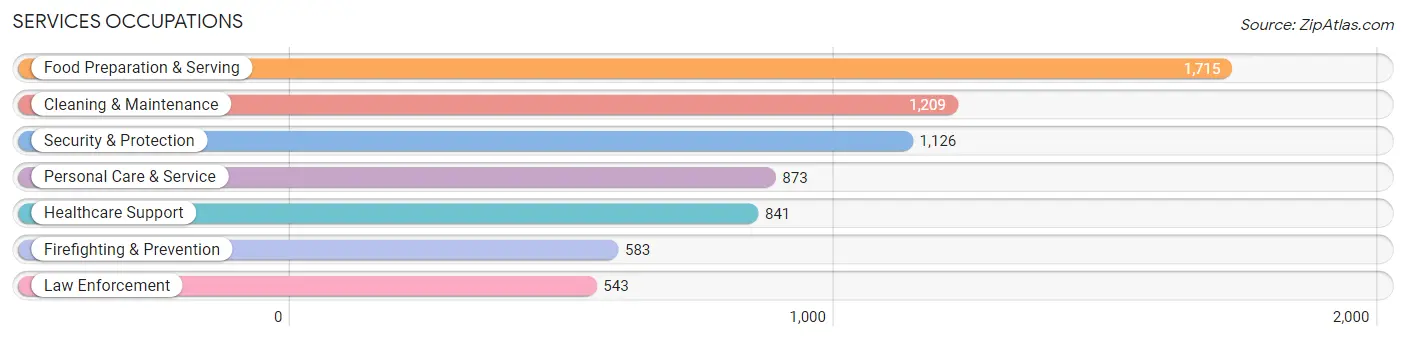
Services Occupations
The most common Services occupations in Fauquier County are Food Preparation & Serving (1,715 | 4.4%), Cleaning & Maintenance (1,209 | 3.1%), Security & Protection (1,126 | 2.9%), Personal Care & Service (873 | 2.3%), and Healthcare Support (841 | 2.2%).
Services Occupations by Sex
Within the Services occupations in Fauquier County, the most male-oriented occupations are Firefighting & Prevention (81.0%), Security & Protection (75.7%), and Law Enforcement (70.0%), while the most female-oriented occupations are Healthcare Support (90.6%), Personal Care & Service (76.7%), and Food Preparation & Serving (52.7%).
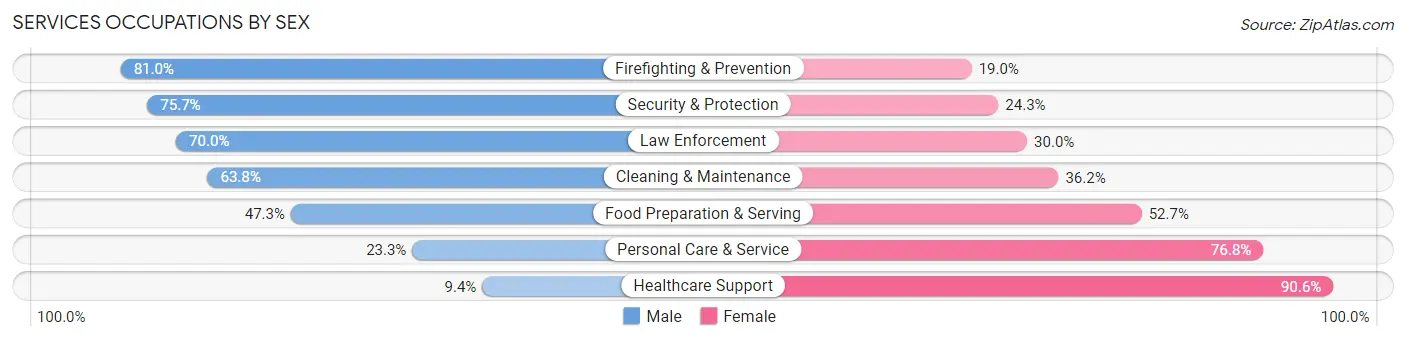
| Occupation | Male | Female |
| Healthcare Support | 79 (9.4%) | 762 (90.6%) |
| Security & Protection | 852 (75.7%) | 274 (24.3%) |
| Firefighting & Prevention | 472 (81.0%) | 111 (19.0%) |
| Law Enforcement | 380 (70.0%) | 163 (30.0%) |
| Food Preparation & Serving | 811 (47.3%) | 904 (52.7%) |
| Cleaning & Maintenance | 771 (63.8%) | 438 (36.2%) |
| Personal Care & Service | 203 (23.3%) | 670 (76.7%) |
| Total (Category) | 2,716 (47.1%) | 3,048 (52.9%) |
| Total (Overall) | 20,900 (54.0%) | 17,789 (46.0%) |
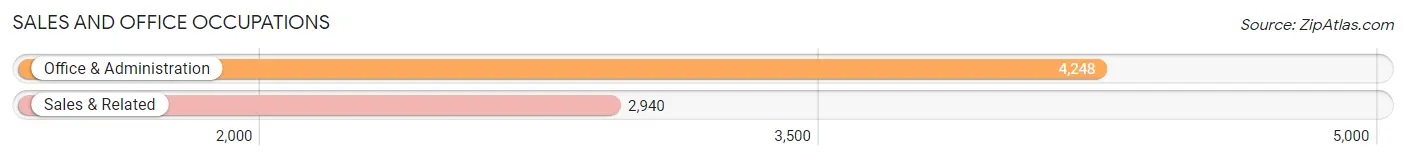
Sales and Office Occupations
The most common Sales and Office occupations in Fauquier County are Office & Administration (4,248 | 11.0%), and Sales & Related (2,940 | 7.6%).
Sales and Office Occupations by Sex
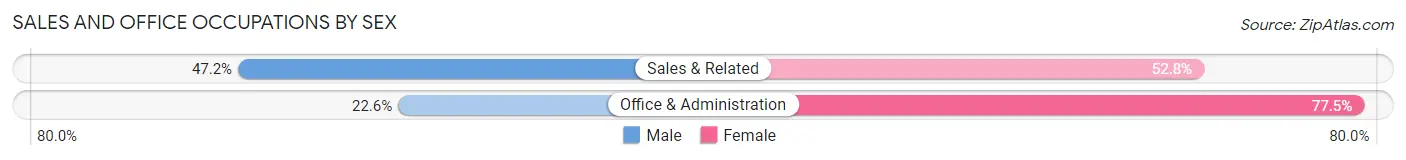
| Occupation | Male | Female |
| Sales & Related | 1,387 (47.2%) | 1,553 (52.8%) |
| Office & Administration | 958 (22.6%) | 3,290 (77.4%) |
| Total (Category) | 2,345 (32.6%) | 4,843 (67.4%) |
| Total (Overall) | 20,900 (54.0%) | 17,789 (46.0%) |
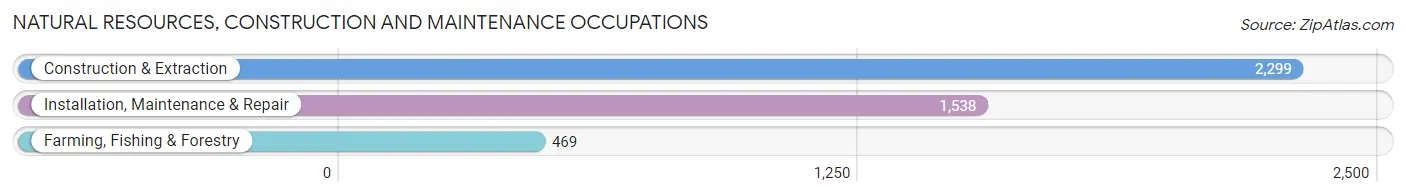
Natural Resources, Construction and Maintenance Occupations
The most common Natural Resources, Construction and Maintenance occupations in Fauquier County are Construction & Extraction (2,299 | 5.9%), Installation, Maintenance & Repair (1,538 | 4.0%), and Farming, Fishing & Forestry (469 | 1.2%).
Natural Resources, Construction and Maintenance Occupations by Sex
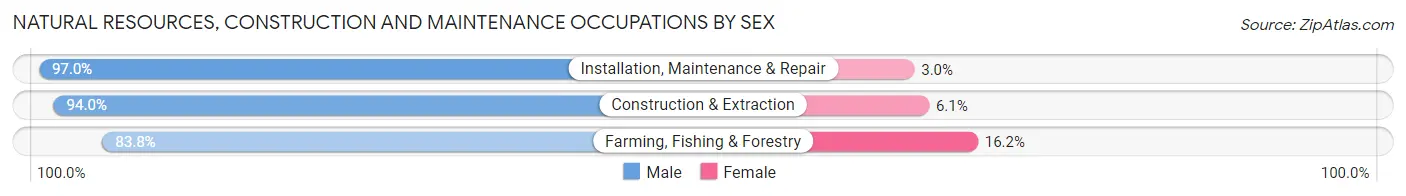
| Occupation | Male | Female |
| Farming, Fishing & Forestry | 393 (83.8%) | 76 (16.2%) |
| Construction & Extraction | 2,160 (94.0%) | 139 (6.0%) |
| Installation, Maintenance & Repair | 1,492 (97.0%) | 46 (3.0%) |
| Total (Category) | 4,045 (93.9%) | 261 (6.1%) |
| Total (Overall) | 20,900 (54.0%) | 17,789 (46.0%) |
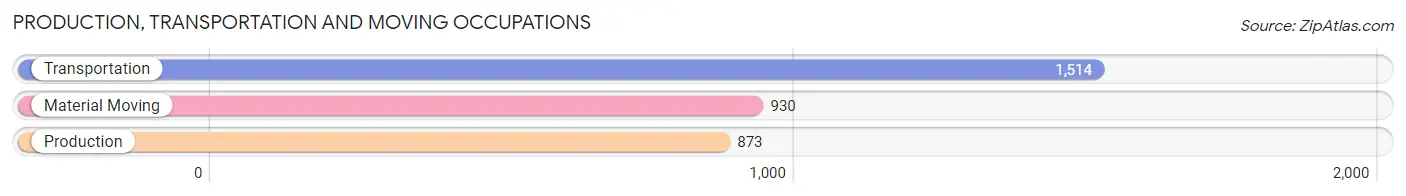
Production, Transportation and Moving Occupations
The most common Production, Transportation and Moving occupations in Fauquier County are Transportation (1,514 | 3.9%), Material Moving (930 | 2.4%), and Production (873 | 2.3%).
Production, Transportation and Moving Occupations by Sex
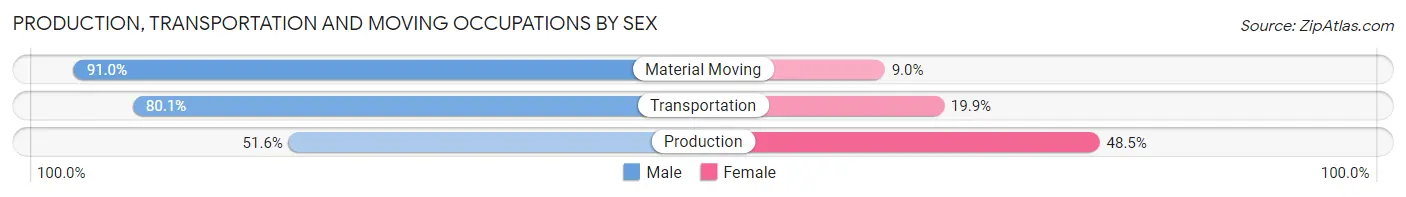
| Occupation | Male | Female |
| Production | 450 (51.5%) | 423 (48.4%) |
| Transportation | 1,213 (80.1%) | 301 (19.9%) |
| Material Moving | 846 (91.0%) | 84 (9.0%) |
| Total (Category) | 2,509 (75.6%) | 808 (24.4%) |
| Total (Overall) | 20,900 (54.0%) | 17,789 (46.0%) |
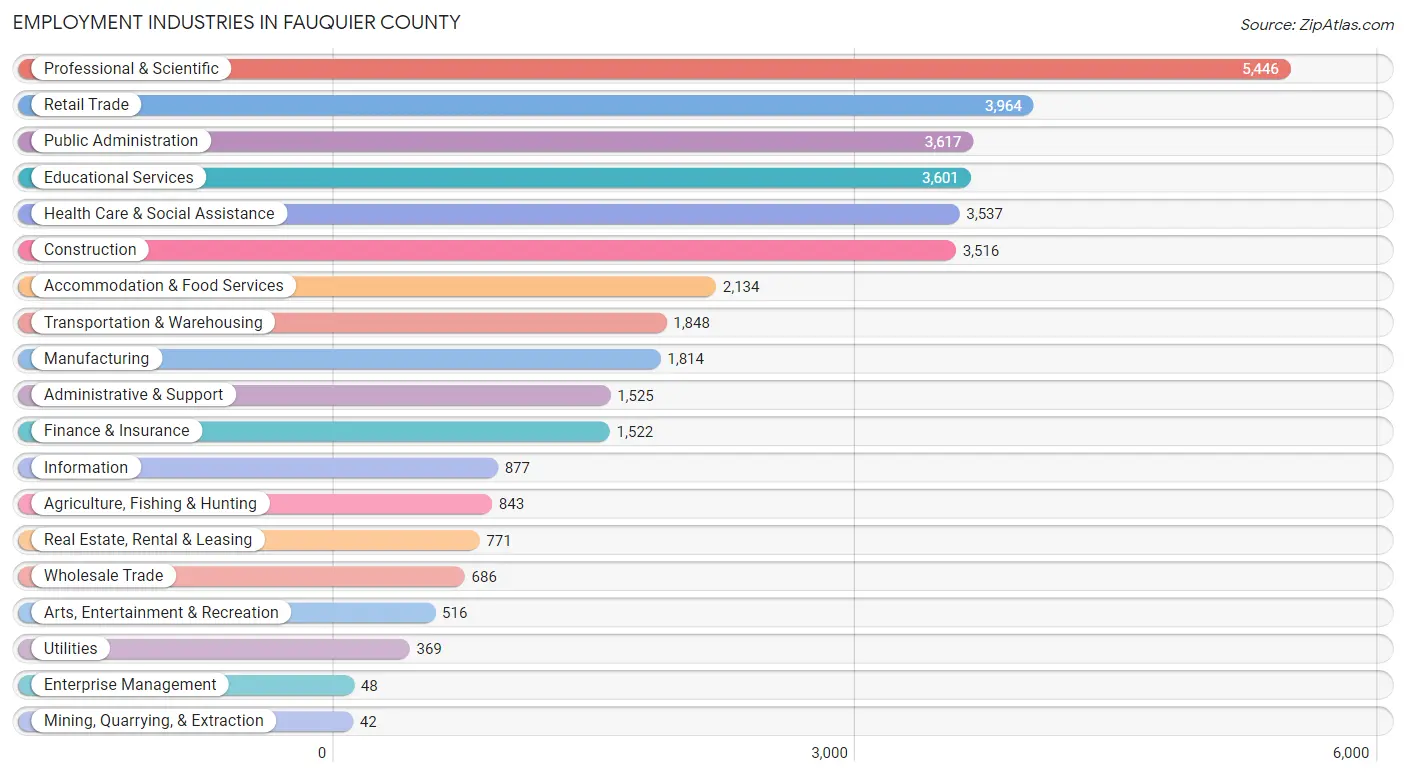
Employment Industries by Sex in Fauquier County
Employment Industries in Fauquier County
The major employment industries in Fauquier County include Professional & Scientific (5,446 | 14.1%), Retail Trade (3,964 | 10.2%), Public Administration (3,617 | 9.3%), Educational Services (3,601 | 9.3%), and Health Care & Social Assistance (3,537 | 9.1%).
Employment Industries by Sex in Fauquier County
The Fauquier County industries that see more men than women are Mining, Quarrying, & Extraction (100.0%), Construction (86.3%), and Utilities (80.8%), whereas the industries that tend to have a higher number of women are Enterprise Management (89.6%), Health Care & Social Assistance (81.4%), and Educational Services (74.8%).
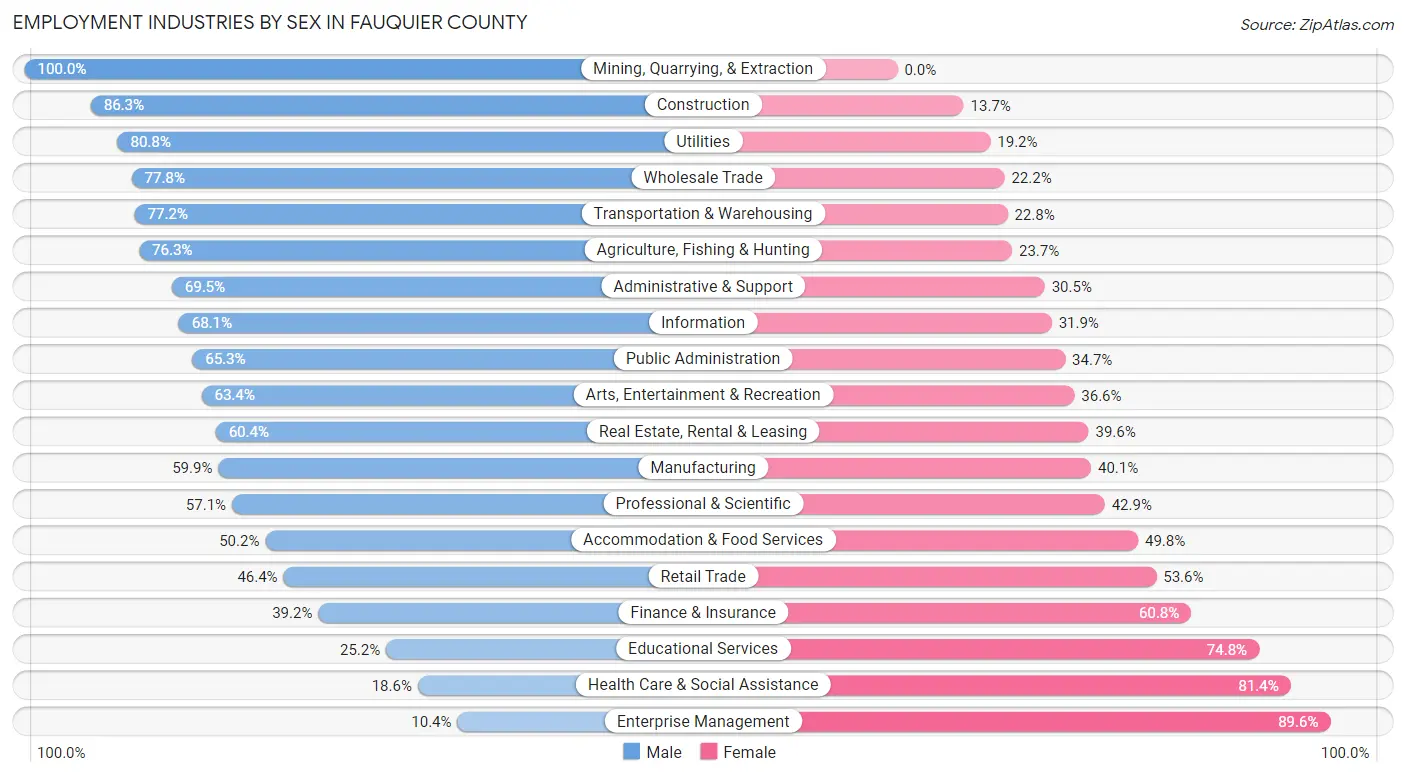
| Industry | Male | Female |
| Agriculture, Fishing & Hunting | 643 (76.3%) | 200 (23.7%) |
| Mining, Quarrying, & Extraction | 42 (100.0%) | 0 (0.0%) |
| Construction | 3,034 (86.3%) | 482 (13.7%) |
| Manufacturing | 1,087 (59.9%) | 727 (40.1%) |
| Wholesale Trade | 534 (77.8%) | 152 (22.2%) |
| Retail Trade | 1,840 (46.4%) | 2,124 (53.6%) |
| Transportation & Warehousing | 1,427 (77.2%) | 421 (22.8%) |
| Utilities | 298 (80.8%) | 71 (19.2%) |
| Information | 597 (68.1%) | 280 (31.9%) |
| Finance & Insurance | 597 (39.2%) | 925 (60.8%) |
| Real Estate, Rental & Leasing | 466 (60.4%) | 305 (39.6%) |
| Professional & Scientific | 3,109 (57.1%) | 2,337 (42.9%) |
| Enterprise Management | 5 (10.4%) | 43 (89.6%) |
| Administrative & Support | 1,060 (69.5%) | 465 (30.5%) |
| Educational Services | 907 (25.2%) | 2,694 (74.8%) |
| Health Care & Social Assistance | 659 (18.6%) | 2,878 (81.4%) |
| Arts, Entertainment & Recreation | 327 (63.4%) | 189 (36.6%) |
| Accommodation & Food Services | 1,071 (50.2%) | 1,063 (49.8%) |
| Public Administration | 2,361 (65.3%) | 1,256 (34.7%) |
| Total | 20,900 (54.0%) | 17,789 (46.0%) |
Education in Fauquier County
School Enrollment in Fauquier County
The most common levels of schooling among the 17,635 students in Fauquier County are high school (4,067 | 23.1%), middle school (3,988 | 22.6%), and elementary school (3,563 | 20.2%).
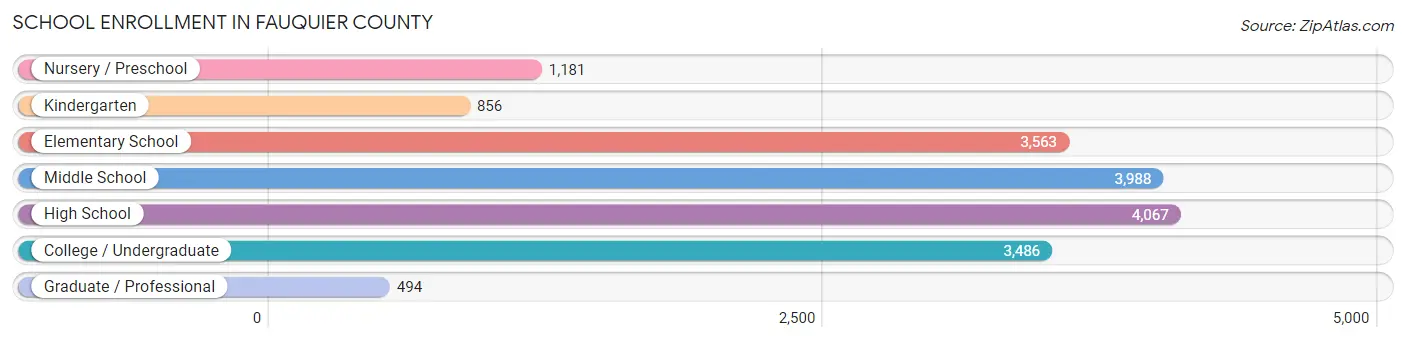
| School Level | # Students | % Students |
| Nursery / Preschool | 1,181 | 6.7% |
| Kindergarten | 856 | 4.9% |
| Elementary School | 3,563 | 20.2% |
| Middle School | 3,988 | 22.6% |
| High School | 4,067 | 23.1% |
| College / Undergraduate | 3,486 | 19.8% |
| Graduate / Professional | 494 | 2.8% |
| Total | 17,635 | 100.0% |
School Enrollment by Age by Funding Source in Fauquier County
Out of a total of 17,635 students who are enrolled in schools in Fauquier County, 3,474 (19.7%) attend a private institution, while the remaining 14,161 (80.3%) are enrolled in public schools. The age group of 3 to 4 year olds has the highest likelihood of being enrolled in private schools, with 764 (76.5% in the age bracket) enrolled. Conversely, the age group of 15 to 17 year olds has the lowest likelihood of being enrolled in a private school, with 2,821 (92.0% in the age bracket) attending a public institution.
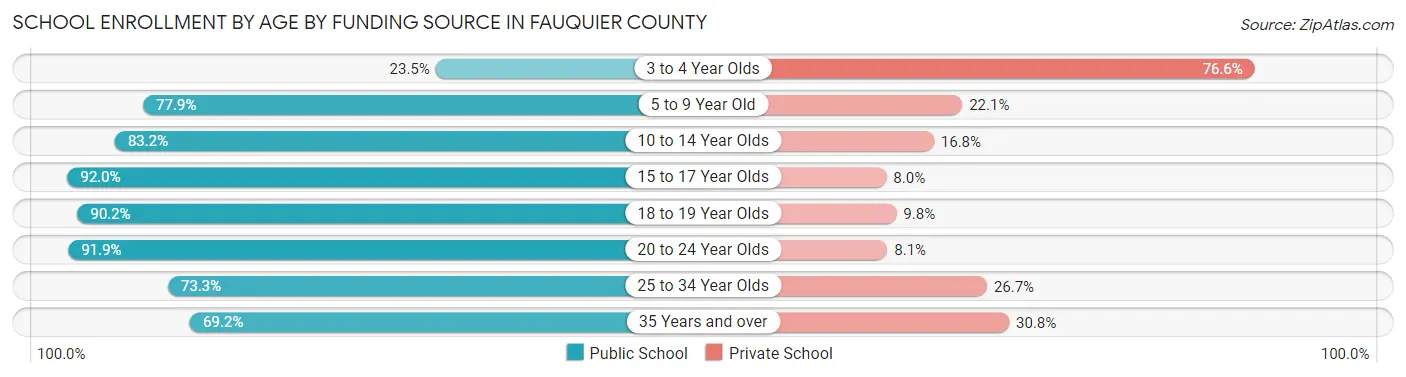
| Age Bracket | Public School | Private School |
| 3 to 4 Year Olds | 234 (23.4%) | 764 (76.5%) |
| 5 to 9 Year Old | 3,339 (77.9%) | 946 (22.1%) |
| 10 to 14 Year Olds | 3,931 (83.2%) | 794 (16.8%) |
| 15 to 17 Year Olds | 2,821 (92.0%) | 244 (8.0%) |
| 18 to 19 Year Olds | 1,249 (90.2%) | 136 (9.8%) |
| 20 to 24 Year Olds | 1,491 (91.9%) | 132 (8.1%) |
| 25 to 34 Year Olds | 423 (73.3%) | 154 (26.7%) |
| 35 Years and over | 676 (69.2%) | 301 (30.8%) |
| Total | 14,161 (80.3%) | 3,474 (19.7%) |
Educational Attainment by Field of Study in Fauquier County
Business (3,480 | 16.0%), social sciences (2,648 | 12.1%), education (1,943 | 8.9%), arts & humanities (1,726 | 7.9%), and engineering (1,653 | 7.6%) are the most common fields of study among 21,808 individuals in Fauquier County who have obtained a bachelor's degree or higher.
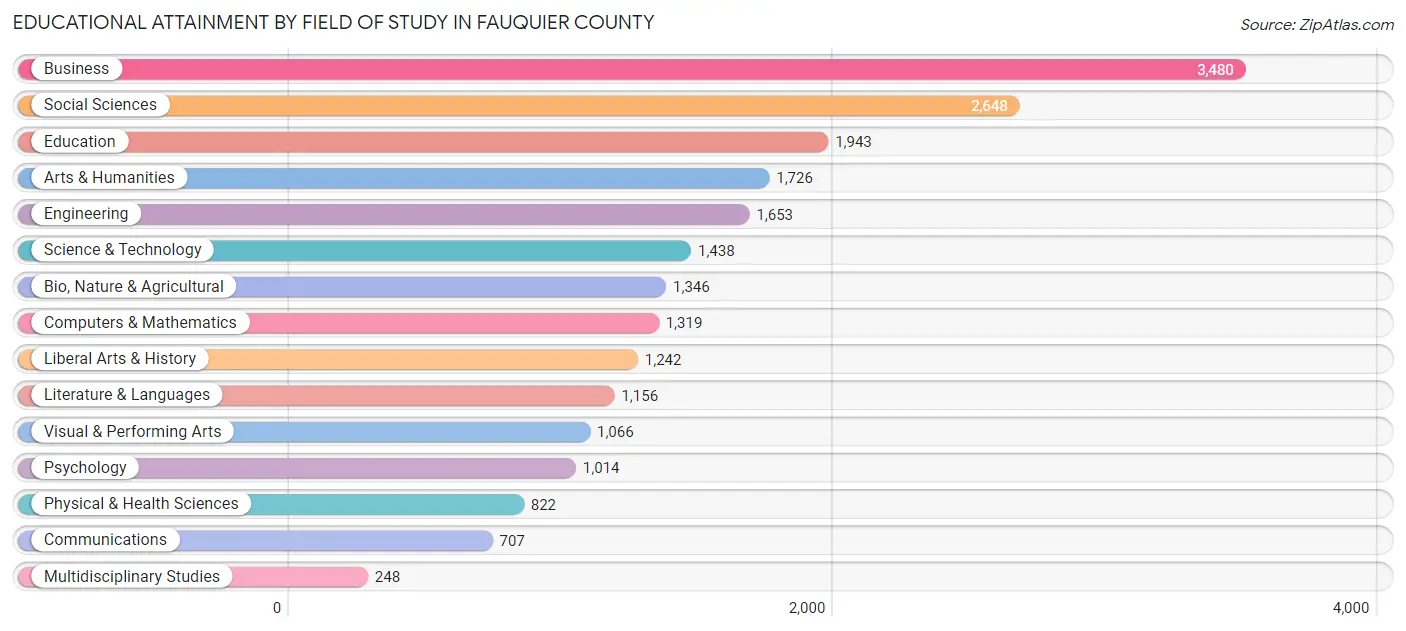
| Field of Study | # Graduates | % Graduates |
| Computers & Mathematics | 1,319 | 6.0% |
| Bio, Nature & Agricultural | 1,346 | 6.2% |
| Physical & Health Sciences | 822 | 3.8% |
| Psychology | 1,014 | 4.6% |
| Social Sciences | 2,648 | 12.1% |
| Engineering | 1,653 | 7.6% |
| Multidisciplinary Studies | 248 | 1.1% |
| Science & Technology | 1,438 | 6.6% |
| Business | 3,480 | 16.0% |
| Education | 1,943 | 8.9% |
| Literature & Languages | 1,156 | 5.3% |
| Liberal Arts & History | 1,242 | 5.7% |
| Visual & Performing Arts | 1,066 | 4.9% |
| Communications | 707 | 3.2% |
| Arts & Humanities | 1,726 | 7.9% |
| Total | 21,808 | 100.0% |
Transportation & Commute in Fauquier County
Vehicle Availability by Sex in Fauquier County
The most prevalent vehicle ownership categories in Fauquier County are males with 2 vehicles (7,696, accounting for 37.4%) and females with 2 vehicles (6,129, making up 44.0%).
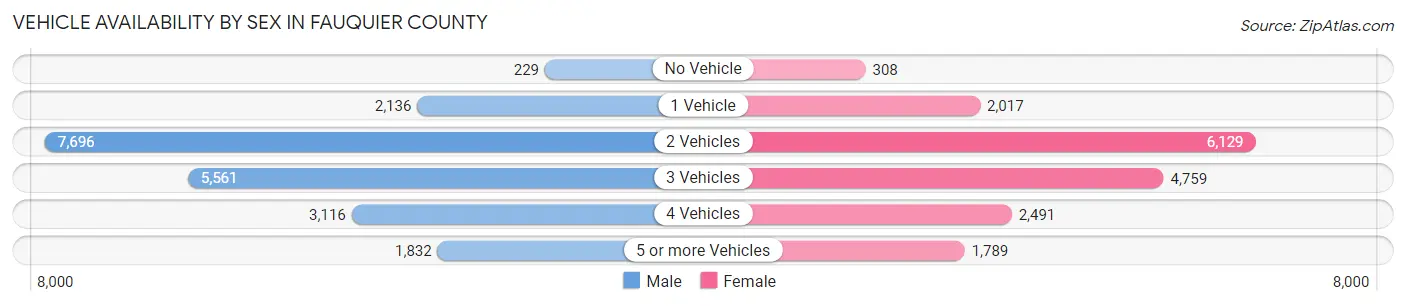
| Vehicles Available | Male | Female |
| No Vehicle | 229 (1.1%) | 308 (1.8%) |
| 1 Vehicle | 2,136 (10.4%) | 2,017 (11.5%) |
| 2 Vehicles | 7,696 (37.4%) | 6,129 (35.0%) |
| 3 Vehicles | 5,561 (27.0%) | 4,759 (27.2%) |
| 4 Vehicles | 3,116 (15.1%) | 2,491 (14.2%) |
| 5 or more Vehicles | 1,832 (8.9%) | 1,789 (10.2%) |
| Total | 20,570 (100.0%) | 17,493 (100.0%) |
Commute Time in Fauquier County
The most frequently occuring commute durations in Fauquier County are 60 to 89 minutes (5,336 commuters, 16.3%), 45 to 59 minutes (5,033 commuters, 15.4%), and 30 to 34 minutes (3,594 commuters, 11.0%).
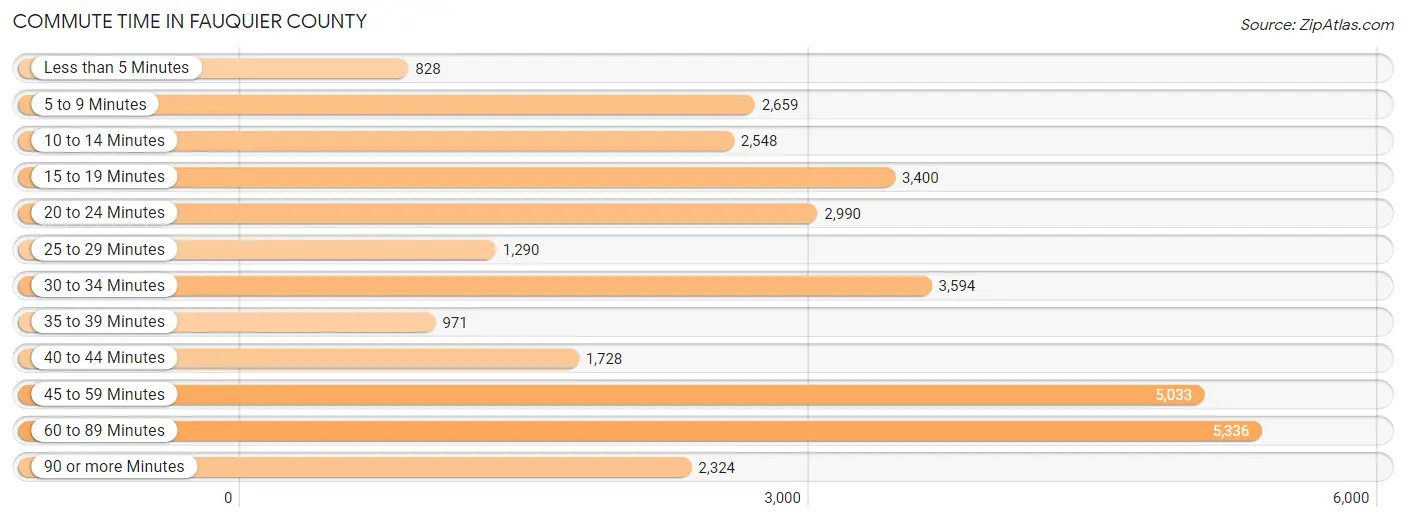
| Commute Time | # Commuters | % Commuters |
| Less than 5 Minutes | 828 | 2.5% |
| 5 to 9 Minutes | 2,659 | 8.1% |
| 10 to 14 Minutes | 2,548 | 7.8% |
| 15 to 19 Minutes | 3,400 | 10.4% |
| 20 to 24 Minutes | 2,990 | 9.1% |
| 25 to 29 Minutes | 1,290 | 3.9% |
| 30 to 34 Minutes | 3,594 | 11.0% |
| 35 to 39 Minutes | 971 | 3.0% |
| 40 to 44 Minutes | 1,728 | 5.3% |
| 45 to 59 Minutes | 5,033 | 15.4% |
| 60 to 89 Minutes | 5,336 | 16.3% |
| 90 or more Minutes | 2,324 | 7.1% |
Commute Time by Sex in Fauquier County
The most common commute times in Fauquier County are 45 to 59 minutes (3,472 commuters, 19.4%) for males and 60 to 89 minutes (1,880 commuters, 12.7%) for females.
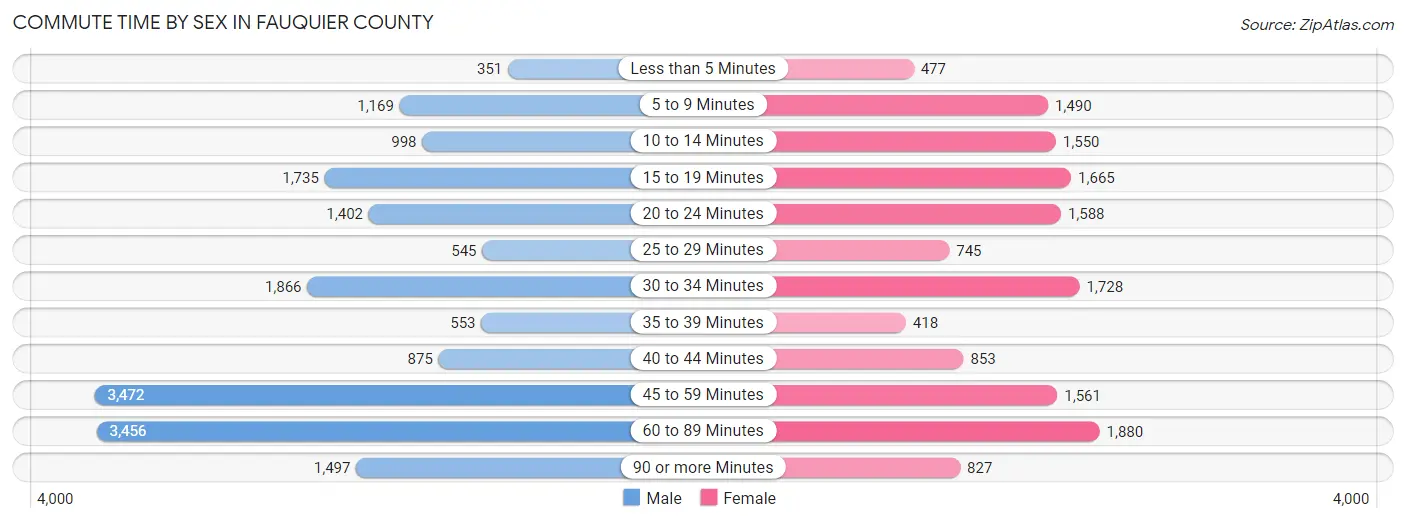
| Commute Time | Male | Female |
| Less than 5 Minutes | 351 (2.0%) | 477 (3.2%) |
| 5 to 9 Minutes | 1,169 (6.5%) | 1,490 (10.1%) |
| 10 to 14 Minutes | 998 (5.6%) | 1,550 (10.5%) |
| 15 to 19 Minutes | 1,735 (9.7%) | 1,665 (11.3%) |
| 20 to 24 Minutes | 1,402 (7.8%) | 1,588 (10.7%) |
| 25 to 29 Minutes | 545 (3.0%) | 745 (5.0%) |
| 30 to 34 Minutes | 1,866 (10.4%) | 1,728 (11.7%) |
| 35 to 39 Minutes | 553 (3.1%) | 418 (2.8%) |
| 40 to 44 Minutes | 875 (4.9%) | 853 (5.8%) |
| 45 to 59 Minutes | 3,472 (19.4%) | 1,561 (10.6%) |
| 60 to 89 Minutes | 3,456 (19.3%) | 1,880 (12.7%) |
| 90 or more Minutes | 1,497 (8.4%) | 827 (5.6%) |
Time of Departure to Work by Sex in Fauquier County
The most frequent times of departure to work in Fauquier County are 12:00 AM to 4:59 AM (2,576, 14.4%) for males and 7:00 AM to 7:29 AM (2,144, 14.5%) for females.
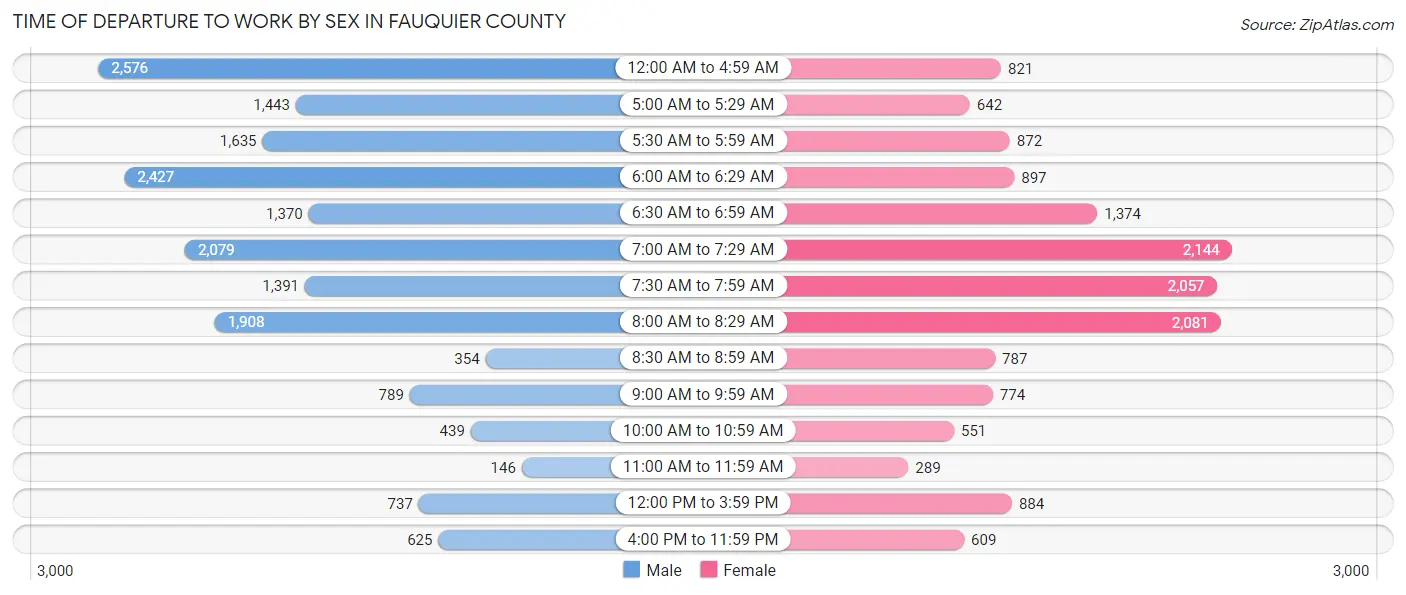
| Time of Departure | Male | Female |
| 12:00 AM to 4:59 AM | 2,576 (14.4%) | 821 (5.6%) |
| 5:00 AM to 5:29 AM | 1,443 (8.1%) | 642 (4.3%) |
| 5:30 AM to 5:59 AM | 1,635 (9.1%) | 872 (5.9%) |
| 6:00 AM to 6:29 AM | 2,427 (13.5%) | 897 (6.1%) |
| 6:30 AM to 6:59 AM | 1,370 (7.6%) | 1,374 (9.3%) |
| 7:00 AM to 7:29 AM | 2,079 (11.6%) | 2,144 (14.5%) |
| 7:30 AM to 7:59 AM | 1,391 (7.8%) | 2,057 (13.9%) |
| 8:00 AM to 8:29 AM | 1,908 (10.6%) | 2,081 (14.1%) |
| 8:30 AM to 8:59 AM | 354 (2.0%) | 787 (5.3%) |
| 9:00 AM to 9:59 AM | 789 (4.4%) | 774 (5.2%) |
| 10:00 AM to 10:59 AM | 439 (2.5%) | 551 (3.7%) |
| 11:00 AM to 11:59 AM | 146 (0.8%) | 289 (2.0%) |
| 12:00 PM to 3:59 PM | 737 (4.1%) | 884 (6.0%) |
| 4:00 PM to 11:59 PM | 625 (3.5%) | 609 (4.1%) |
| Total | 17,919 (100.0%) | 14,782 (100.0%) |
Housing Occupancy in Fauquier County
Occupancy by Ownership in Fauquier County
Of the total 26,011 dwellings in Fauquier County, owner-occupied units account for 20,158 (77.5%), while renter-occupied units make up 5,853 (22.5%).
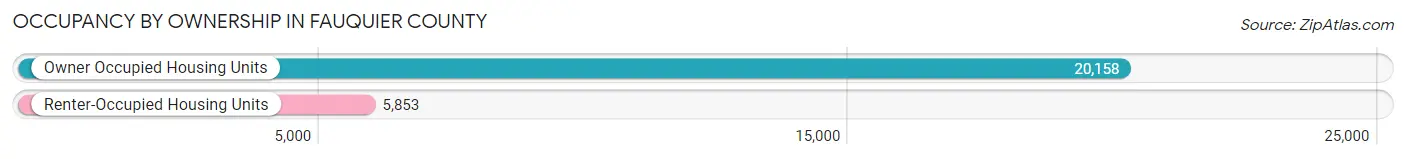
| Occupancy | # Housing Units | % Housing Units |
| Owner Occupied Housing Units | 20,158 | 77.5% |
| Renter-Occupied Housing Units | 5,853 | 22.5% |
| Total Occupied Housing Units | 26,011 | 100.0% |
Occupancy by Household Size in Fauquier County
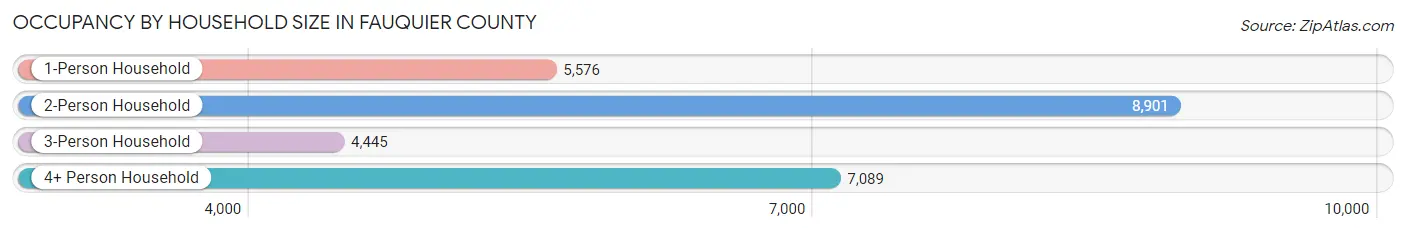
| Household Size | # Housing Units | % Housing Units |
| 1-Person Household | 5,576 | 21.4% |
| 2-Person Household | 8,901 | 34.2% |
| 3-Person Household | 4,445 | 17.1% |
| 4+ Person Household | 7,089 | 27.3% |
| Total Housing Units | 26,011 | 100.0% |
Occupancy by Ownership by Household Size in Fauquier County
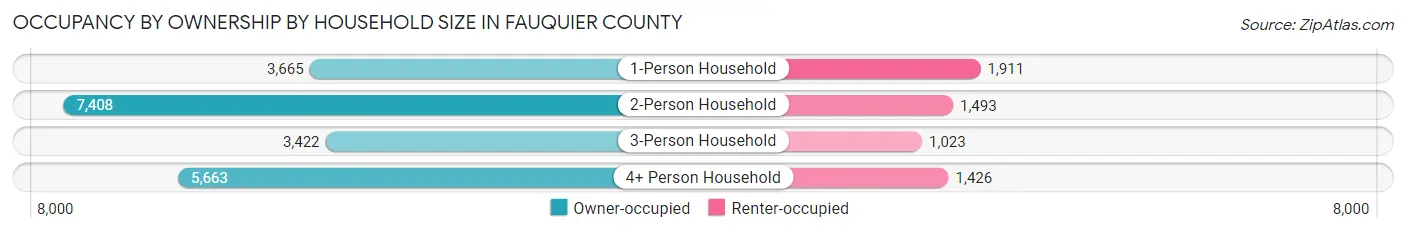
| Household Size | Owner-occupied | Renter-occupied |
| 1-Person Household | 3,665 (65.7%) | 1,911 (34.3%) |
| 2-Person Household | 7,408 (83.2%) | 1,493 (16.8%) |
| 3-Person Household | 3,422 (77.0%) | 1,023 (23.0%) |
| 4+ Person Household | 5,663 (79.9%) | 1,426 (20.1%) |
| Total Housing Units | 20,158 (77.5%) | 5,853 (22.5%) |
Occupancy by Educational Attainment in Fauquier County
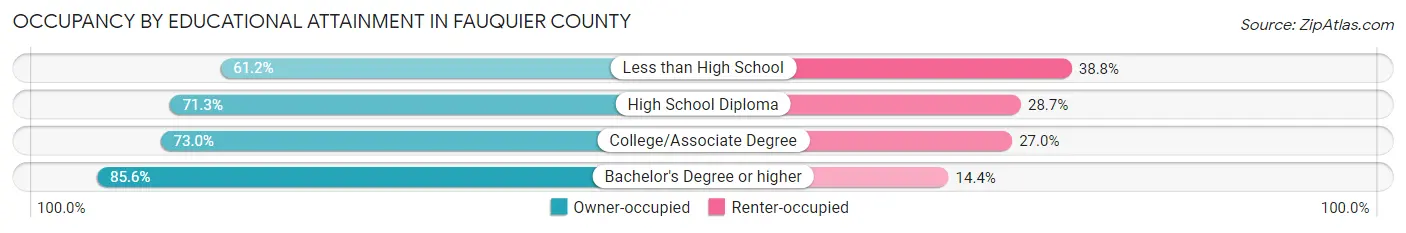
| Household Size | Owner-occupied | Renter-occupied |
| Less than High School | 970 (61.2%) | 615 (38.8%) |
| High School Diploma | 3,693 (71.3%) | 1,489 (28.7%) |
| College/Associate Degree | 5,696 (73.0%) | 2,105 (27.0%) |
| Bachelor's Degree or higher | 9,799 (85.6%) | 1,644 (14.4%) |
Occupancy by Age of Householder in Fauquier County
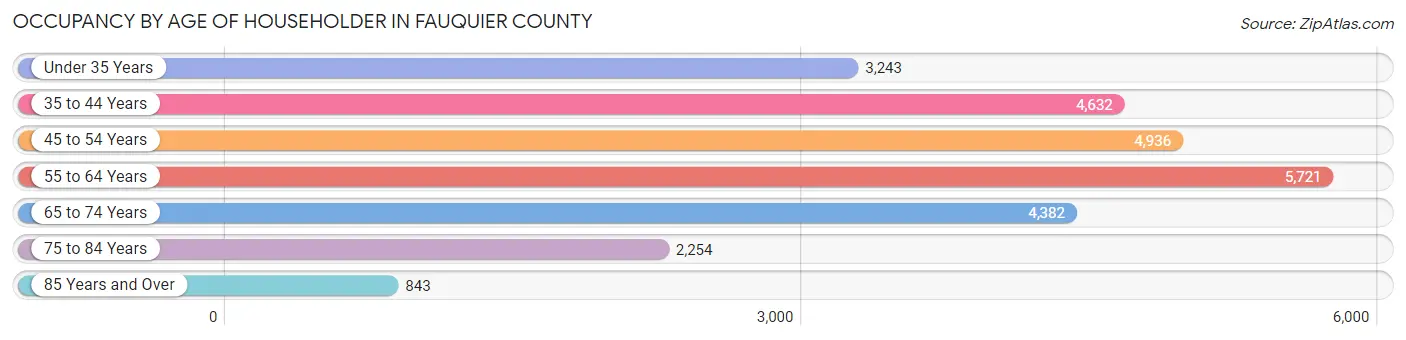
| Age Bracket | # Households | % Households |
| Under 35 Years | 3,243 | 12.5% |
| 35 to 44 Years | 4,632 | 17.8% |
| 45 to 54 Years | 4,936 | 19.0% |
| 55 to 64 Years | 5,721 | 22.0% |
| 65 to 74 Years | 4,382 | 16.9% |
| 75 to 84 Years | 2,254 | 8.7% |
| 85 Years and Over | 843 | 3.2% |
| Total | 26,011 | 100.0% |
Housing Finances in Fauquier County
Median Income by Occupancy in Fauquier County

| Occupancy Type | # Households | Median Income |
| Owner-Occupied | 20,158 (77.5%) | $141,079 |
| Renter-Occupied | 5,853 (22.5%) | $74,837 |
| Average | 26,011 (100.0%) | $122,785 |
Occupancy by Householder Income Bracket in Fauquier County
| Income Bracket | Owner-occupied | Renter-occupied |
| Less than $5,000 | 186 (0.9%) | 40 (0.7%) |
| $5,000 to $9,999 | 168 (0.8%) | 82 (1.4%) |
| $10,000 to $14,999 | 146 (0.7%) | 338 (5.8%) |
| $15,000 to $19,999 | 206 (1.0%) | 243 (4.2%) |
| $20,000 to $24,999 | 365 (1.8%) | 222 (3.8%) |
| $25,000 to $34,999 | 466 (2.3%) | 374 (6.4%) |
| $35,000 to $49,999 | 962 (4.8%) | 560 (9.6%) |
| $50,000 to $74,999 | 2,041 (10.1%) | 1,072 (18.3%) |
| $75,000 to $99,999 | 2,125 (10.5%) | 971 (16.6%) |
| $100,000 to $149,999 | 4,342 (21.5%) | 1,001 (17.1%) |
| $150,000 or more | 9,151 (45.4%) | 950 (16.2%) |
| Total | 20,158 (100.0%) | 5,853 (100.0%) |
Monthly Housing Cost Tiers in Fauquier County
| Monthly Cost | Owner-occupied | Renter-occupied |
| Less than $300 | 310 (1.5%) | 2 (0.0%) |
| $300 to $499 | 942 (4.7%) | 40 (0.7%) |
| $500 to $799 | 2,118 (10.5%) | 334 (5.7%) |
| $800 to $999 | 1,144 (5.7%) | 334 (5.7%) |
| $1,000 to $1,499 | 2,138 (10.6%) | 2,010 (34.3%) |
| $1,500 to $1,999 | 2,713 (13.5%) | 1,270 (21.7%) |
| $2,000 to $2,499 | 3,062 (15.2%) | 789 (13.5%) |
| $2,500 to $2,999 | 3,074 (15.2%) | 117 (2.0%) |
| $3,000 or more | 4,657 (23.1%) | 252 (4.3%) |
| Total | 20,158 (100.0%) | 5,853 (100.0%) |
Physical Housing Characteristics in Fauquier County
Housing Structures in Fauquier County
| Structure Type | # Housing Units | % Housing Units |
| Single Unit, Detached | 22,138 | 85.1% |
| Single Unit, Attached | 1,399 | 5.4% |
| 2 Unit Apartments | 281 | 1.1% |
| 3 or 4 Unit Apartments | 412 | 1.6% |
| 5 to 9 Unit Apartments | 153 | 0.6% |
| 10 or more Apartments | 1,117 | 4.3% |
| Mobile Home / Other | 511 | 2.0% |
| Total | 26,011 | 100.0% |
Housing Structures by Occupancy in Fauquier County
| Structure Type | Owner-occupied | Renter-occupied |
| Single Unit, Detached | 18,739 (84.7%) | 3,399 (15.3%) |
| Single Unit, Attached | 797 (57.0%) | 602 (43.0%) |
| 2 Unit Apartments | 0 (0.0%) | 281 (100.0%) |
| 3 or 4 Unit Apartments | 13 (3.2%) | 399 (96.8%) |
| 5 to 9 Unit Apartments | 35 (22.9%) | 118 (77.1%) |
| 10 or more Apartments | 172 (15.4%) | 945 (84.6%) |
| Mobile Home / Other | 402 (78.7%) | 109 (21.3%) |
| Total | 20,158 (77.5%) | 5,853 (22.5%) |
Housing Structures by Number of Rooms in Fauquier County
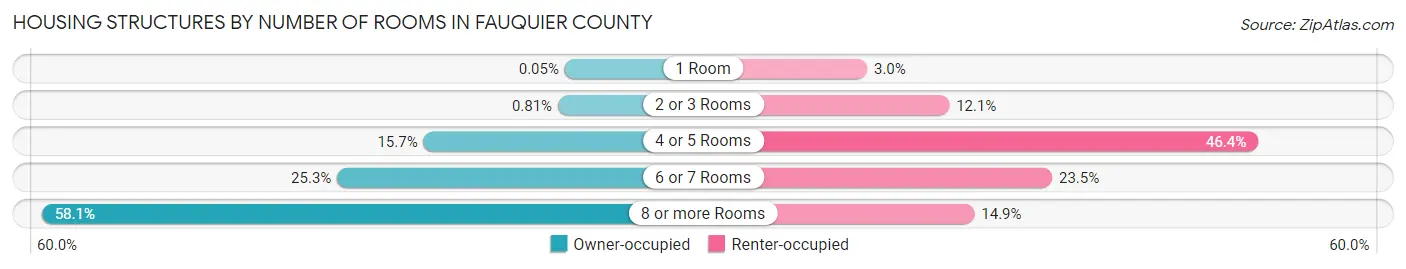
| Number of Rooms | Owner-occupied | Renter-occupied |
| 1 Room | 10 (0.1%) | 176 (3.0%) |
| 2 or 3 Rooms | 164 (0.8%) | 710 (12.1%) |
| 4 or 5 Rooms | 3,170 (15.7%) | 2,716 (46.4%) |
| 6 or 7 Rooms | 5,102 (25.3%) | 1,378 (23.5%) |
| 8 or more Rooms | 11,712 (58.1%) | 873 (14.9%) |
| Total | 20,158 (100.0%) | 5,853 (100.0%) |
Housing Structure by Heating Type in Fauquier County
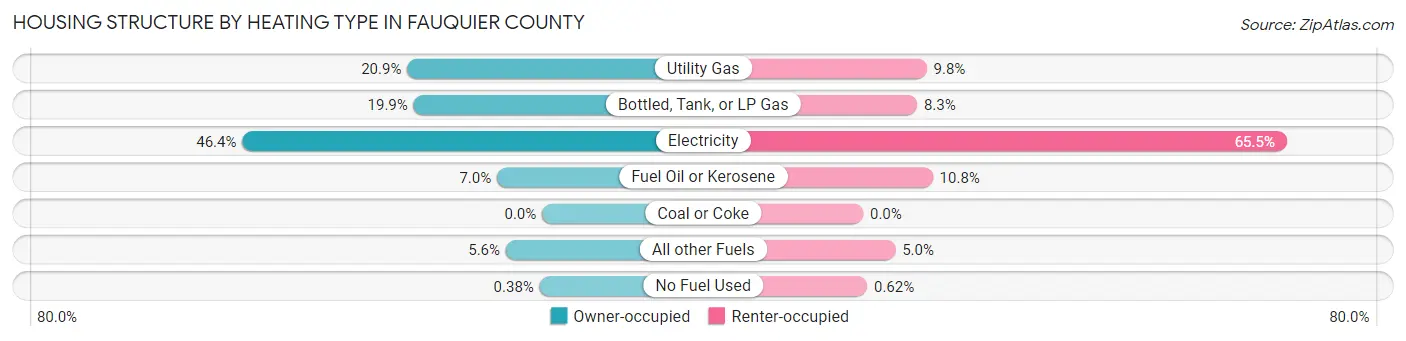
| Heating Type | Owner-occupied | Renter-occupied |
| Utility Gas | 4,203 (20.8%) | 575 (9.8%) |
| Bottled, Tank, or LP Gas | 4,004 (19.9%) | 488 (8.3%) |
| Electricity | 9,343 (46.4%) | 3,833 (65.5%) |
| Fuel Oil or Kerosene | 1,402 (7.0%) | 630 (10.8%) |
| Coal or Coke | 0 (0.0%) | 0 (0.0%) |
| All other Fuels | 1,129 (5.6%) | 291 (5.0%) |
| No Fuel Used | 77 (0.4%) | 36 (0.6%) |
| Total | 20,158 (100.0%) | 5,853 (100.0%) |
Household Vehicle Usage in Fauquier County
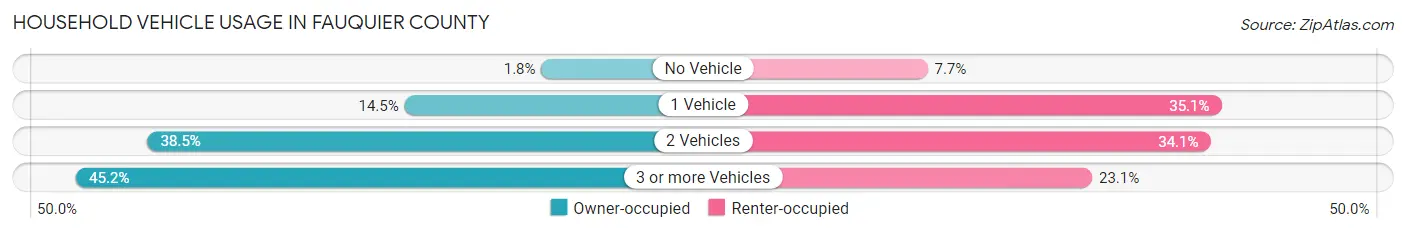
| Vehicles per Household | Owner-occupied | Renter-occupied |
| No Vehicle | 354 (1.8%) | 451 (7.7%) |
| 1 Vehicle | 2,928 (14.5%) | 2,056 (35.1%) |
| 2 Vehicles | 7,767 (38.5%) | 1,996 (34.1%) |
| 3 or more Vehicles | 9,109 (45.2%) | 1,350 (23.1%) |
| Total | 20,158 (100.0%) | 5,853 (100.0%) |
Real Estate & Mortgages in Fauquier County
Real Estate and Mortgage Overview in Fauquier County
| Characteristic | Without Mortgage | With Mortgage |
| Housing Units | 5,579 | 14,579 |
| Median Property Value | $480,500 | $510,500 |
| Median Household Income | $96,205 | $7,644 |
| Monthly Housing Costs | $754 | $4,568 |
| Real Estate Taxes | $4,116 | $368 |
Property Value by Mortgage Status in Fauquier County
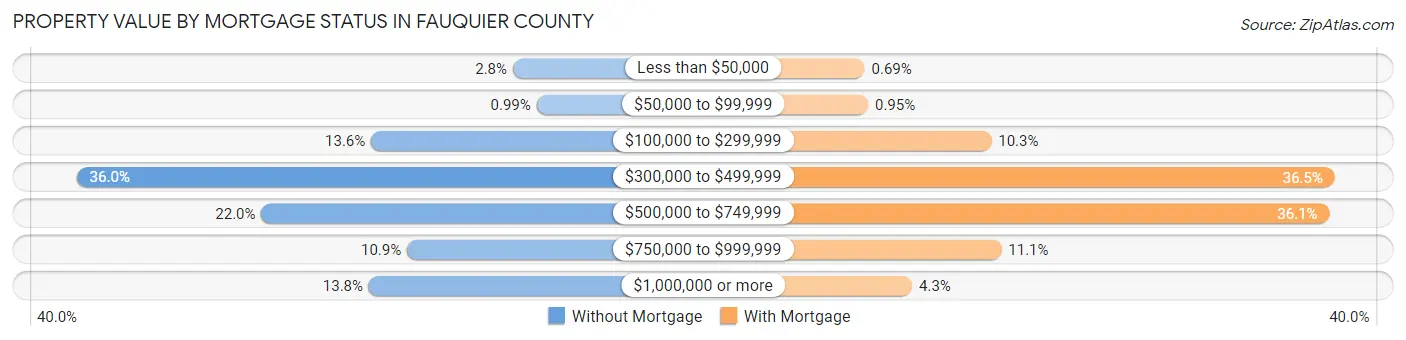
| Property Value | Without Mortgage | With Mortgage |
| Less than $50,000 | 156 (2.8%) | 100 (0.7%) |
| $50,000 to $99,999 | 55 (1.0%) | 139 (0.9%) |
| $100,000 to $299,999 | 759 (13.6%) | 1,507 (10.3%) |
| $300,000 to $499,999 | 2,010 (36.0%) | 5,323 (36.5%) |
| $500,000 to $749,999 | 1,225 (22.0%) | 5,263 (36.1%) |
| $750,000 to $999,999 | 606 (10.9%) | 1,619 (11.1%) |
| $1,000,000 or more | 768 (13.8%) | 628 (4.3%) |
| Total | 5,579 (100.0%) | 14,579 (100.0%) |
Household Income by Mortgage Status in Fauquier County
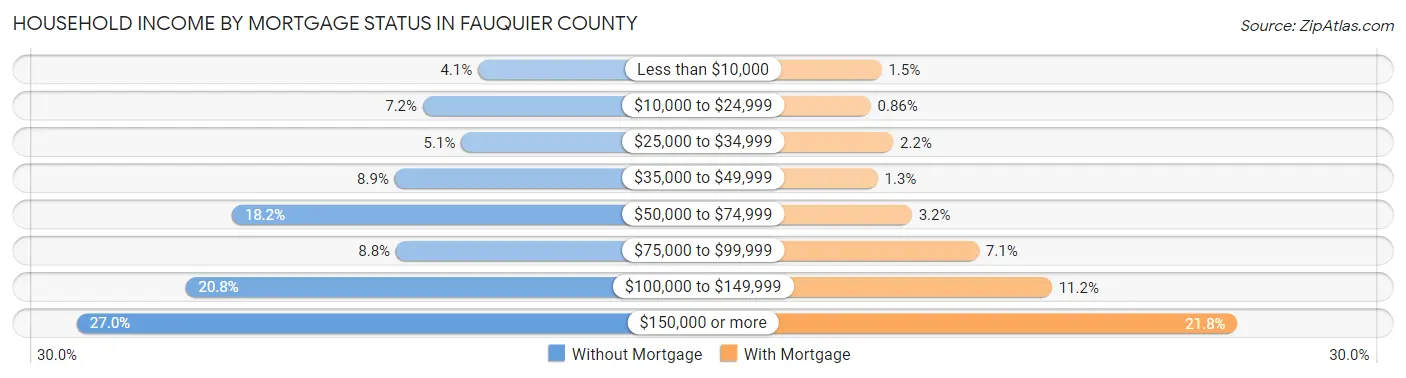
| Household Income | Without Mortgage | With Mortgage |
| Less than $10,000 | 228 (4.1%) | 216 (1.5%) |
| $10,000 to $24,999 | 404 (7.2%) | 126 (0.9%) |
| $25,000 to $34,999 | 282 (5.1%) | 313 (2.1%) |
| $35,000 to $49,999 | 494 (8.8%) | 184 (1.3%) |
| $50,000 to $74,999 | 1,013 (18.2%) | 468 (3.2%) |
| $75,000 to $99,999 | 490 (8.8%) | 1,028 (7.0%) |
| $100,000 to $149,999 | 1,161 (20.8%) | 1,635 (11.2%) |
| $150,000 or more | 1,507 (27.0%) | 3,181 (21.8%) |
| Total | 5,579 (100.0%) | 14,579 (100.0%) |
Property Value to Household Income Ratio in Fauquier County
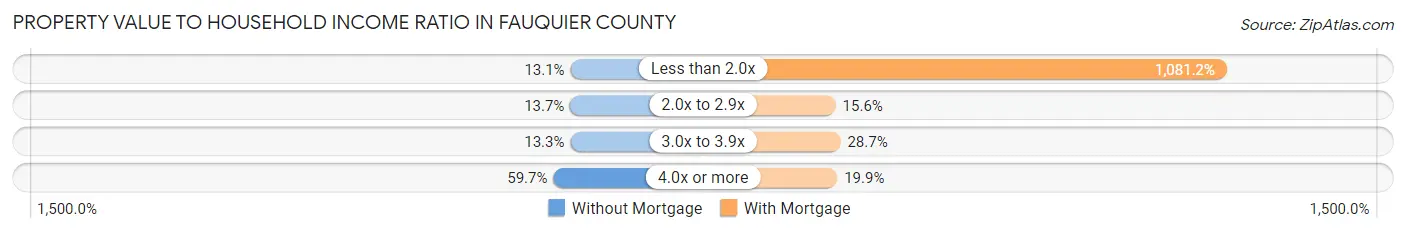
| Value-to-Income Ratio | Without Mortgage | With Mortgage |
| Less than 2.0x | 729 (13.1%) | 157,626 (1,081.2%) |
| 2.0x to 2.9x | 765 (13.7%) | 2,278 (15.6%) |
| 3.0x to 3.9x | 744 (13.3%) | 4,190 (28.7%) |
| 4.0x or more | 3,328 (59.7%) | 2,907 (19.9%) |
| Total | 5,579 (100.0%) | 14,579 (100.0%) |
Real Estate Taxes by Mortgage Status in Fauquier County
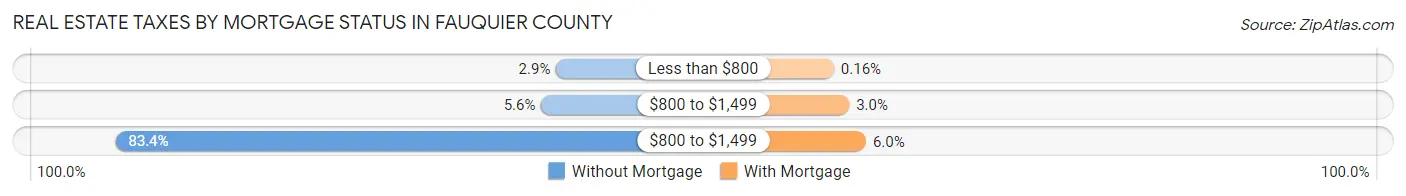
| Property Taxes | Without Mortgage | With Mortgage |
| Less than $800 | 162 (2.9%) | 23 (0.2%) |
| $800 to $1,499 | 314 (5.6%) | 432 (3.0%) |
| $800 to $1,499 | 4,654 (83.4%) | 878 (6.0%) |
| Total | 5,579 (100.0%) | 14,579 (100.0%) |
Health & Disability in Fauquier County
Health Insurance Coverage by Age in Fauquier County
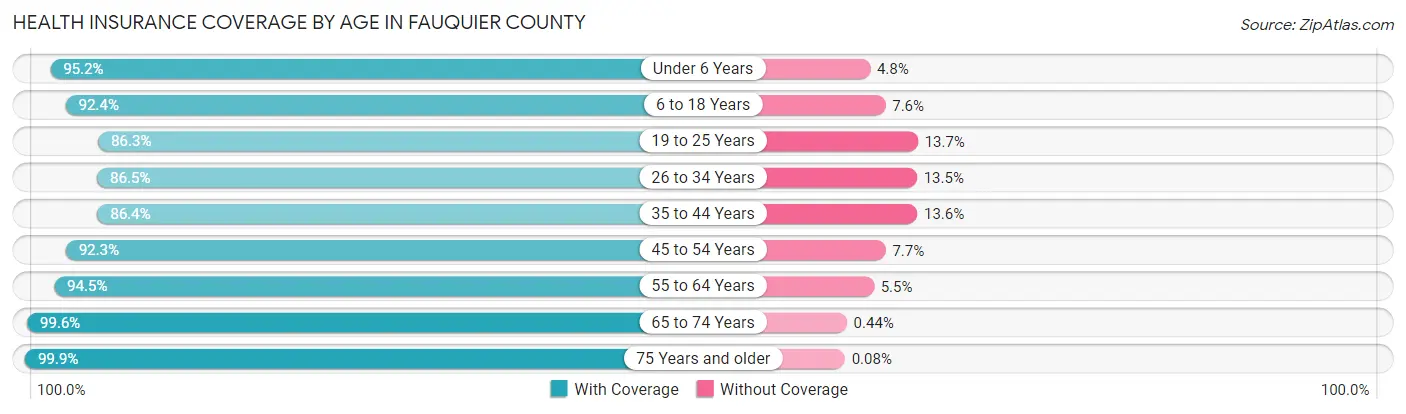
| Age Bracket | With Coverage | Without Coverage |
| Under 6 Years | 4,558 (95.2%) | 229 (4.8%) |
| 6 to 18 Years | 12,053 (92.4%) | 997 (7.6%) |
| 19 to 25 Years | 4,831 (86.3%) | 766 (13.7%) |
| 26 to 34 Years | 6,165 (86.5%) | 963 (13.5%) |
| 35 to 44 Years | 8,156 (86.4%) | 1,281 (13.6%) |
| 45 to 54 Years | 9,081 (92.3%) | 755 (7.7%) |
| 55 to 64 Years | 10,477 (94.5%) | 609 (5.5%) |
| 65 to 74 Years | 7,166 (99.6%) | 32 (0.4%) |
| 75 Years and older | 4,853 (99.9%) | 4 (0.1%) |
| Total | 67,340 (92.3%) | 5,636 (7.7%) |
Health Insurance Coverage by Citizenship Status in Fauquier County
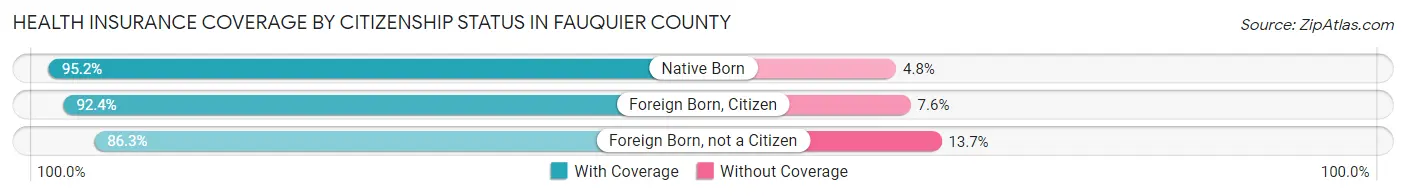
| Citizenship Status | With Coverage | Without Coverage |
| Native Born | 4,558 (95.2%) | 229 (4.8%) |
| Foreign Born, Citizen | 12,053 (92.4%) | 997 (7.6%) |
| Foreign Born, not a Citizen | 4,831 (86.3%) | 766 (13.7%) |
Health Insurance Coverage by Household Income in Fauquier County
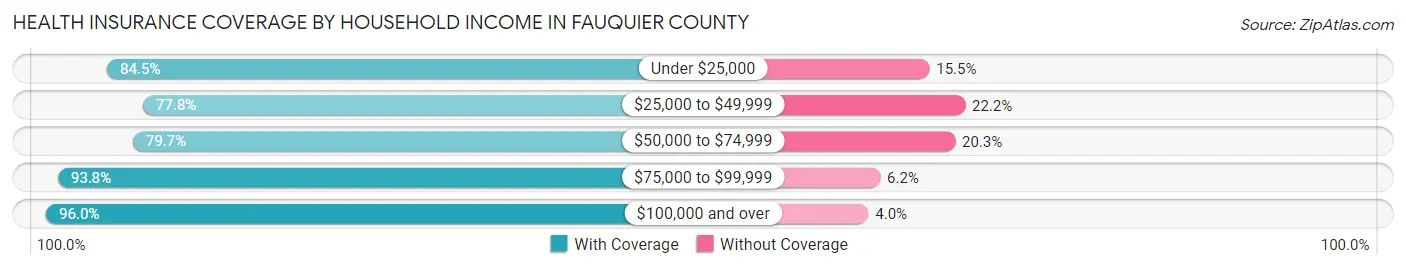
| Household Income | With Coverage | Without Coverage |
| Under $25,000 | 2,695 (84.5%) | 493 (15.5%) |
| $25,000 to $49,999 | 4,298 (77.8%) | 1,224 (22.2%) |
| $50,000 to $74,999 | 5,567 (79.7%) | 1,416 (20.3%) |
| $75,000 to $99,999 | 7,353 (93.8%) | 489 (6.2%) |
| $100,000 and over | 47,344 (96.0%) | 1,991 (4.0%) |
Public vs Private Health Insurance Coverage by Age in Fauquier County
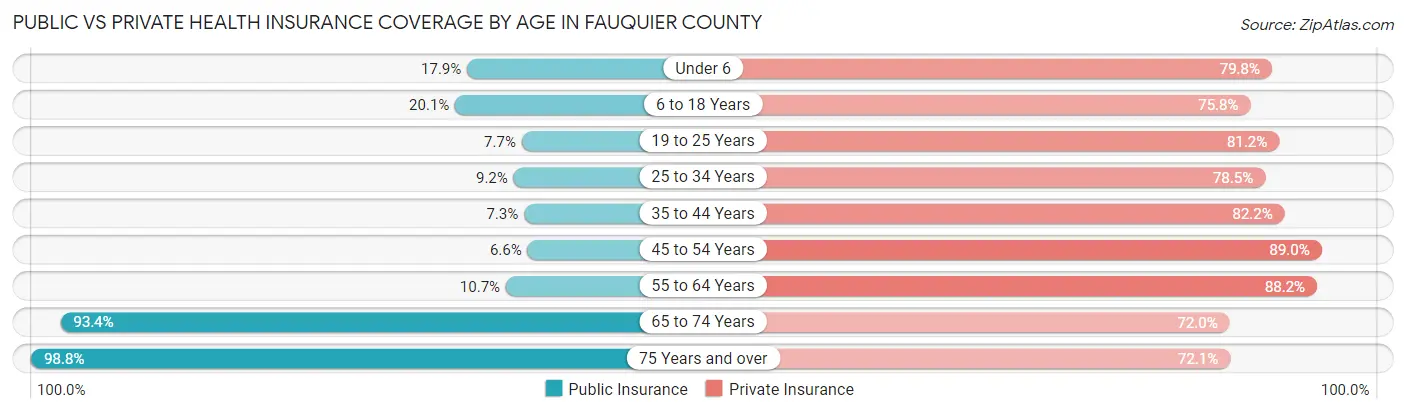
| Age Bracket | Public Insurance | Private Insurance |
| Under 6 | 855 (17.9%) | 3,820 (79.8%) |
| 6 to 18 Years | 2,621 (20.1%) | 9,893 (75.8%) |
| 19 to 25 Years | 432 (7.7%) | 4,543 (81.2%) |
| 25 to 34 Years | 658 (9.2%) | 5,598 (78.5%) |
| 35 to 44 Years | 689 (7.3%) | 7,755 (82.2%) |
| 45 to 54 Years | 653 (6.6%) | 8,758 (89.0%) |
| 55 to 64 Years | 1,182 (10.7%) | 9,777 (88.2%) |
| 65 to 74 Years | 6,720 (93.4%) | 5,180 (72.0%) |
| 75 Years and over | 4,799 (98.8%) | 3,500 (72.1%) |
| Total | 18,609 (25.5%) | 58,824 (80.6%) |
Disability Status by Sex by Age in Fauquier County
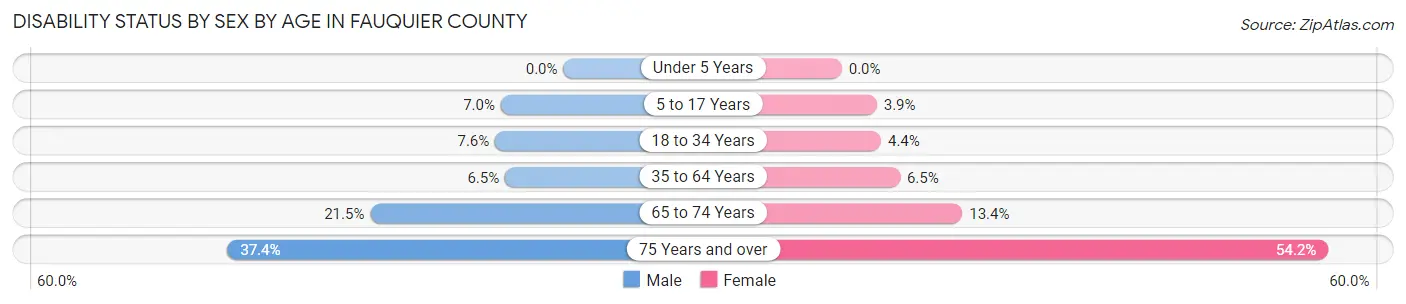
| Age Bracket | Male | Female |
| Under 5 Years | 0 (0.0%) | 0 (0.0%) |
| 5 to 17 Years | 463 (7.0%) | 242 (3.9%) |
| 18 to 34 Years | 522 (7.6%) | 295 (4.4%) |
| 35 to 64 Years | 993 (6.5%) | 975 (6.5%) |
| 65 to 74 Years | 750 (21.5%) | 498 (13.4%) |
| 75 Years and over | 797 (37.4%) | 1,477 (54.2%) |
Disability Class by Sex by Age in Fauquier County
Disability Class: Hearing Difficulty
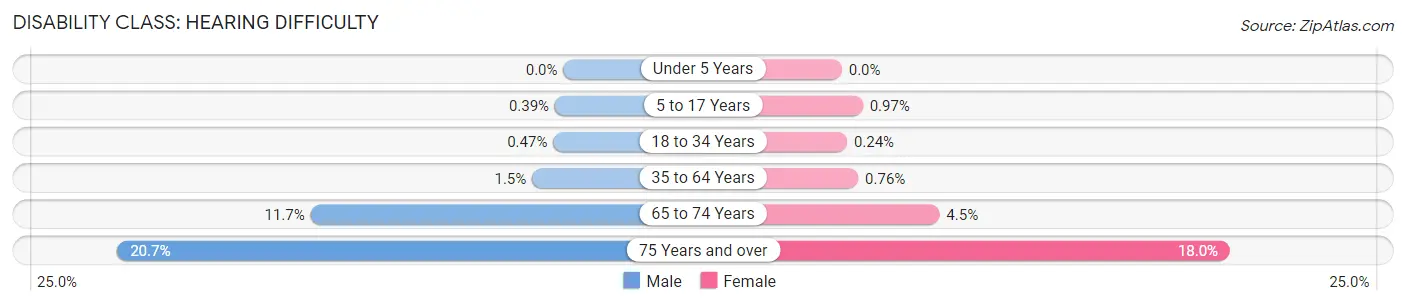
| Age Bracket | Male | Female |
| Under 5 Years | 0 (0.0%) | 0 (0.0%) |
| 5 to 17 Years | 26 (0.4%) | 60 (1.0%) |
| 18 to 34 Years | 32 (0.5%) | 16 (0.2%) |
| 35 to 64 Years | 222 (1.5%) | 114 (0.8%) |
| 65 to 74 Years | 409 (11.7%) | 168 (4.5%) |
| 75 Years and over | 441 (20.7%) | 491 (18.0%) |
Disability Class: Vision Difficulty
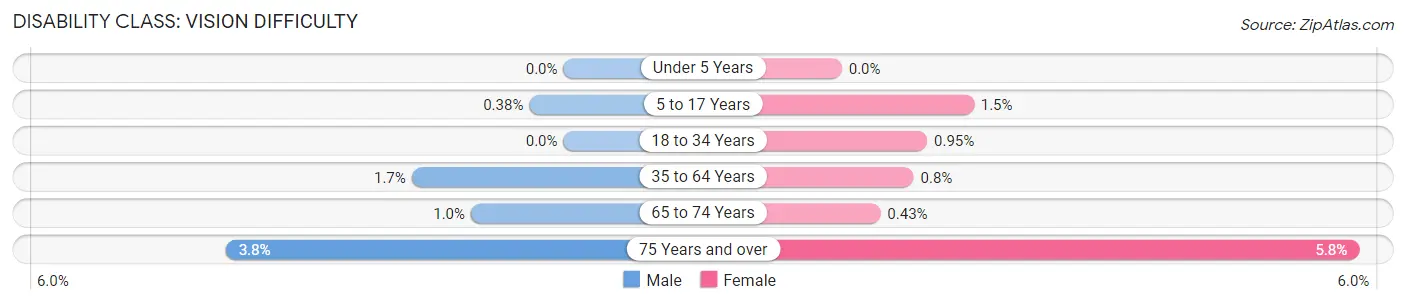
| Age Bracket | Male | Female |
| Under 5 Years | 0 (0.0%) | 0 (0.0%) |
| 5 to 17 Years | 25 (0.4%) | 91 (1.5%) |
| 18 to 34 Years | 0 (0.0%) | 64 (0.9%) |
| 35 to 64 Years | 259 (1.7%) | 121 (0.8%) |
| 65 to 74 Years | 36 (1.0%) | 16 (0.4%) |
| 75 Years and over | 80 (3.8%) | 157 (5.8%) |
Disability Class: Cognitive Difficulty
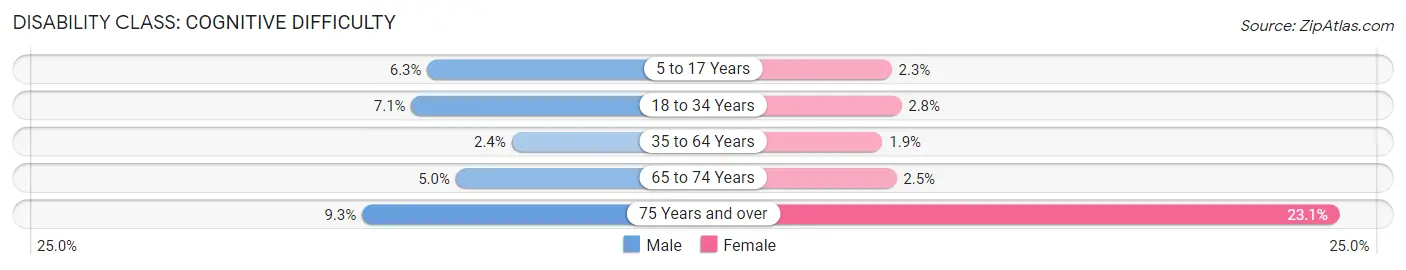
| Age Bracket | Male | Female |
| 5 to 17 Years | 419 (6.3%) | 143 (2.3%) |
| 18 to 34 Years | 484 (7.0%) | 186 (2.8%) |
| 35 to 64 Years | 368 (2.4%) | 283 (1.9%) |
| 65 to 74 Years | 174 (5.0%) | 94 (2.5%) |
| 75 Years and over | 199 (9.3%) | 630 (23.1%) |
Disability Class: Ambulatory Difficulty
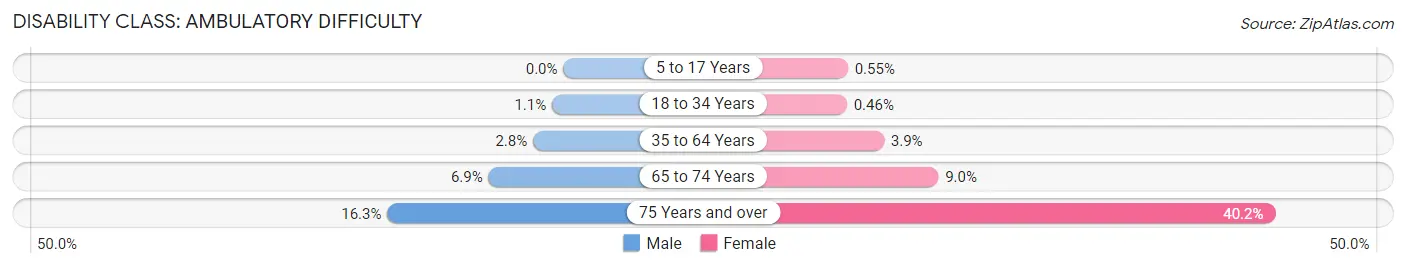
| Age Bracket | Male | Female |
| 5 to 17 Years | 0 (0.0%) | 34 (0.5%) |
| 18 to 34 Years | 72 (1.1%) | 31 (0.5%) |
| 35 to 64 Years | 430 (2.8%) | 587 (3.9%) |
| 65 to 74 Years | 242 (6.9%) | 332 (8.9%) |
| 75 Years and over | 348 (16.3%) | 1,097 (40.2%) |
Disability Class: Self-Care Difficulty
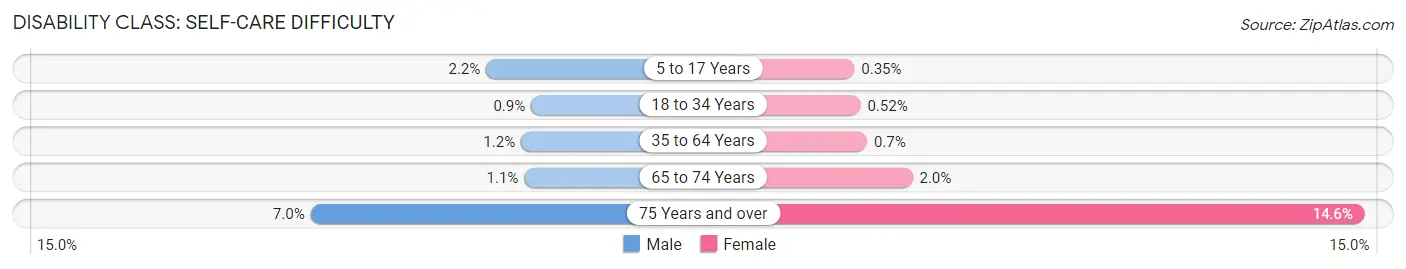
| Age Bracket | Male | Female |
| 5 to 17 Years | 143 (2.1%) | 22 (0.4%) |
| 18 to 34 Years | 62 (0.9%) | 35 (0.5%) |
| 35 to 64 Years | 180 (1.2%) | 106 (0.7%) |
| 65 to 74 Years | 38 (1.1%) | 73 (2.0%) |
| 75 Years and over | 150 (7.0%) | 397 (14.6%) |
Technology Access in Fauquier County
Computing Device Access in Fauquier County
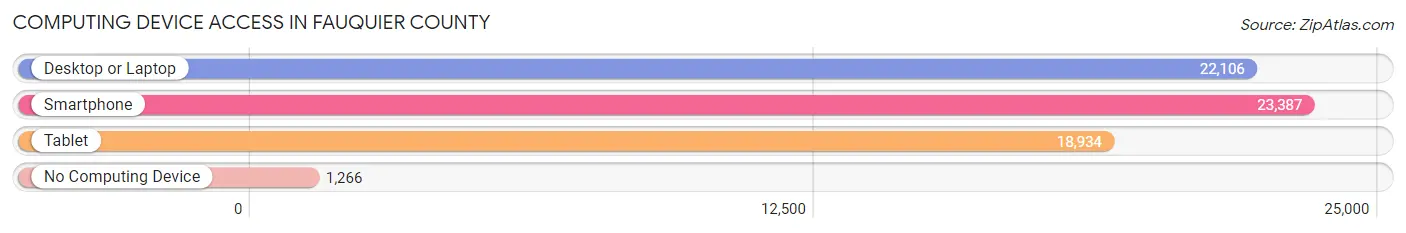
| Device Type | # Households | % Households |
| Desktop or Laptop | 22,106 | 85.0% |
| Smartphone | 23,387 | 89.9% |
| Tablet | 18,934 | 72.8% |
| No Computing Device | 1,266 | 4.9% |
| Total | 26,011 | 100.0% |
Internet Access in Fauquier County
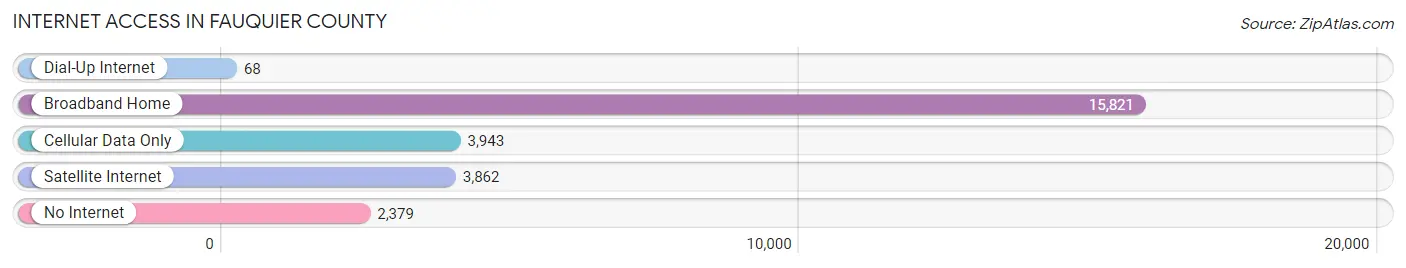
| Internet Type | # Households | % Households |
| Dial-Up Internet | 68 | 0.3% |
| Broadband Home | 15,821 | 60.8% |
| Cellular Data Only | 3,943 | 15.2% |
| Satellite Internet | 3,862 | 14.8% |
| No Internet | 2,379 | 9.1% |
| Total | 26,011 | 100.0% |
Fauquier County Summary
Fauquier County, Virginia is located in the northern part of the state, approximately 50 miles west of Washington, D.C. It is part of the Washington-Arlington-Alexandria metropolitan area and is bordered by Loudoun County to the north, Prince William County to the east, Culpeper County to the south, and Clarke and Warren Counties to the west. The county seat is Warrenton, and the county is home to a population of approximately 65,000 people.
History
Fauquier County was established in 1759 from Prince William County. It was named for Francis Fauquier, the Lieutenant Governor of Virginia from 1758 to 1768. The county was largely rural and agricultural until the late 19th century, when the railroad arrived and the county began to develop. The county was the site of several Civil War battles, including the Battle of Thoroughfare Gap and the Battle of Brandy Station.
Geography
Fauquier County covers an area of 517 square miles, with the majority of the land being rural and agricultural. The terrain is mostly rolling hills, with the highest point being Catlett Mountain at 1,068 feet. The county is drained by the Rappahannock River and its tributaries, including the Catoctin Creek, Cedar Run, and Broad Run.
Economy
Fauquier County’s economy is largely based on agriculture, with the county’s top crops being hay, corn, wheat, and soybeans. The county is also home to several wineries, and tourism is an important part of the local economy. The county is home to several large employers, including the Fauquier Health System, the Fauquier County Public Schools, and the Fauquier County Government.
Demographics
As of the 2010 census, Fauquier County had a population of 65,203 people. The racial makeup of the county was 87.3% White, 8.2% African American, 0.5% Native American, 1.3% Asian, 0.1% Pacific Islander, 1.2% from other races, and 1.4% from two or more races. Hispanic or Latino of any race were 4.2% of the population.
The median household income in Fauquier County was $87,945, and the median family income was $103,945. The per capita income was $41,945. About 5.2% of families and 7.3% of the population were below the poverty line, including 8.7% of those under age 18 and 5.2% of those age 65 or over.
Fauquier County is a largely rural county with a rich history and a diverse economy. The county is home to a variety of industries, from agriculture to tourism, and its population is diverse and growing. With its close proximity to Washington, D.C., Fauquier County is an attractive place to live and work.
Common Questions
What is Per Capita Income in Fauquier County?
Per Capita income in Fauquier County is $54,878.
What is the Median Family Income in Fauquier County?
Median Family Income in Fauquier County is $141,358.
What is the Median Household income in Fauquier County?
Median Household Income in Fauquier County is $122,785.
What is Income or Wage Gap in Fauquier County?
Income or Wage Gap in Fauquier County is 37.1%.
Women in Fauquier County earn 62.9 cents for every dollar earned by a man.
What is Family Income Deficit in Fauquier County?
Family Income Deficit in Fauquier County is $8,537.
Families that are below poverty line in Fauquier County earn $8,537 less on average than the poverty threshold level.
What is Inequality or Gini Index in Fauquier County?
Inequality or Gini Index in Fauquier County is 0.42.
What is the Total Population of Fauquier County?
Total Population of Fauquier County is 73,290.
What is the Total Male Population of Fauquier County?
Total Male Population of Fauquier County is 36,589.
What is the Total Female Population of Fauquier County?
Total Female Population of Fauquier County is 36,701.
What is the Ratio of Males per 100 Females in Fauquier County?
There are 99.69 Males per 100 Females in Fauquier County.
What is the Ratio of Females per 100 Males in Fauquier County?
There are 100.31 Females per 100 Males in Fauquier County.
What is the Median Population Age in Fauquier County?
Median Population Age in Fauquier County is 40.8 Years.
What is the Average Family Size in Fauquier County
Average Family Size in Fauquier County is 3.3 People.
What is the Average Household Size in Fauquier County
Average Household Size in Fauquier County is 2.8 People.
How Large is the Labor Force in Fauquier County?
There are 39,614 People in the Labor Forcein in Fauquier County.
What is the Percentage of People in the Labor Force in Fauquier County?
67.7% of People are in the Labor Force in Fauquier County.
What is the Unemployment Rate in Fauquier County?
Unemployment Rate in Fauquier County is 2.3%.