Clarke County, VA Map & Demographics
Clarke County Map
Clarke County Overview
$50,751
PER CAPITA INCOME
$133,352
AVG FAMILY INCOME
$107,475
AVG HOUSEHOLD INCOME
26.6%
WAGE / INCOME GAP [ % ]
73.4¢/ $1
WAGE / INCOME GAP [ $ ]
0.41
INEQUALITY / GINI INDEX
14,882
TOTAL POPULATION
7,353
MALE POPULATION
7,529
FEMALE POPULATION
97.66
MALES / 100 FEMALES
102.39
FEMALES / 100 MALES
48.4
MEDIAN AGE
3.1
AVG FAMILY SIZE
2.6
AVG HOUSEHOLD SIZE
7,727
LABOR FORCE [ PEOPLE ]
61.7%
PERCENT IN LABOR FORCE
3.5%
UNEMPLOYMENT RATE
Income in Clarke County
Income Overview in Clarke County
Per Capita Income in Clarke County is $50,751, while median incomes of families and households are $133,352 and $107,475 respectively.
| Characteristic | Number | Measure |
| Per Capita Income | 14,882 | $50,751 |
| Median Family Income | 3,899 | $133,352 |
| Mean Family Income | 3,899 | $150,269 |
| Median Household Income | 5,617 | $107,475 |
| Mean Household Income | 5,617 | $125,848 |
| Income Deficit | 3,899 | $0 |
| Wage / Income Gap (%) | 14,882 | 26.58% |
| Wage / Income Gap ($) | 14,882 | 73.42¢ per $1 |
| Gini / Inequality Index | 14,882 | 0.41 |
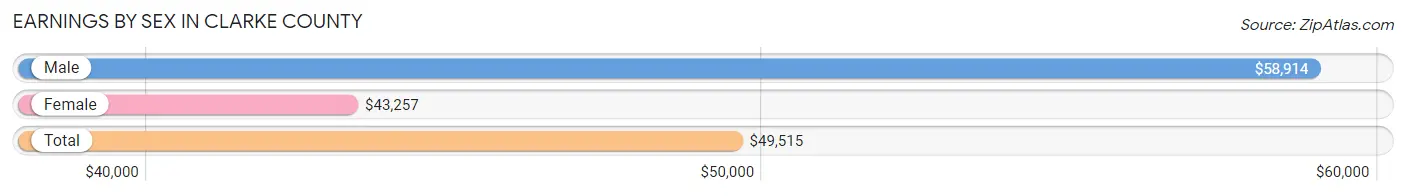
Earnings by Sex in Clarke County
Average Earnings in Clarke County are $49,515, $58,914 for men and $43,257 for women, a difference of 26.6%.
| Sex | Number | Average Earnings |
| Male | 4,226 (53.2%) | $58,914 |
| Female | 3,716 (46.8%) | $43,257 |
| Total | 7,942 (100.0%) | $49,515 |
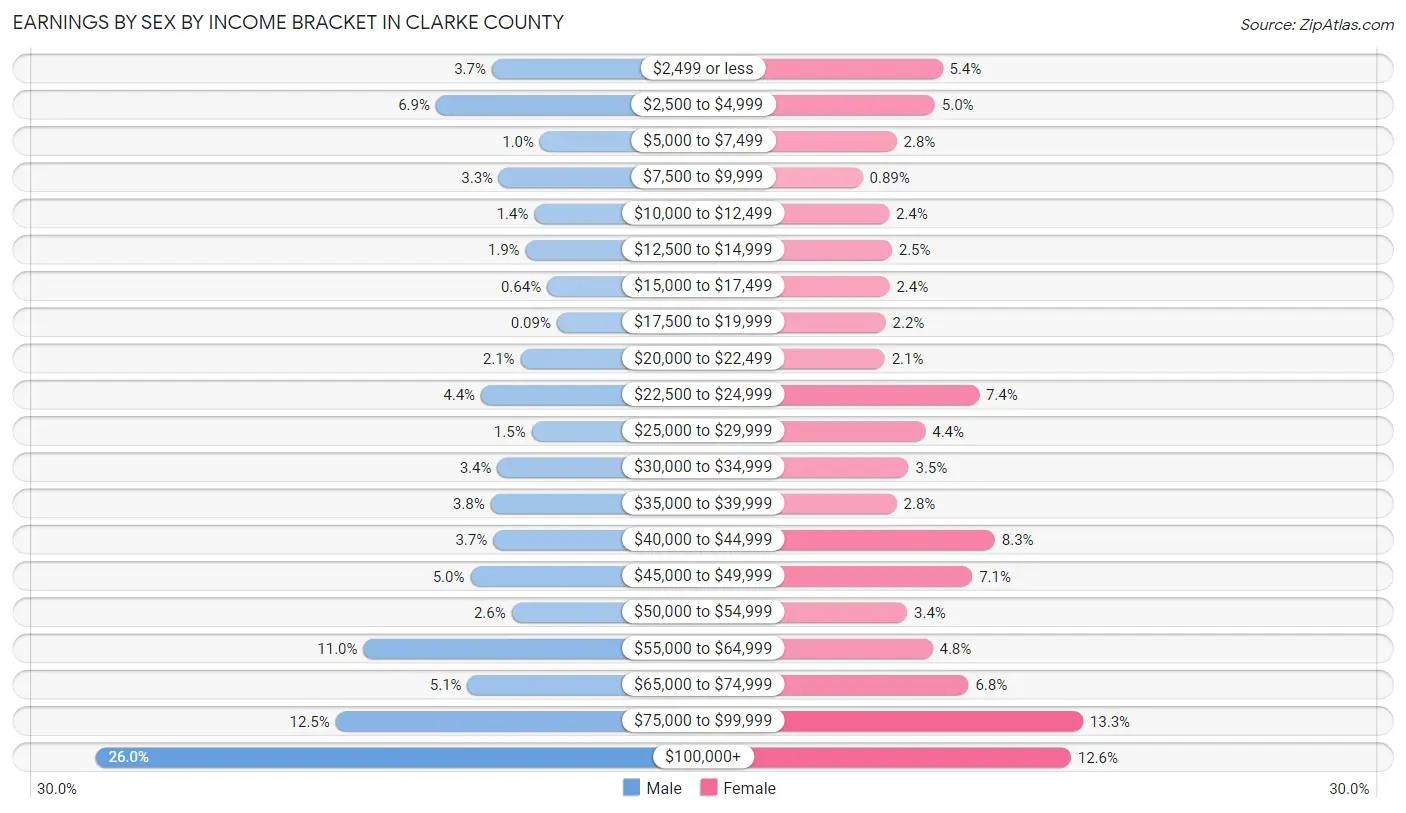
Earnings by Sex by Income Bracket in Clarke County
The most common earnings brackets in Clarke County are $100,000+ for men (1,099 | 26.0%) and $75,000 to $99,999 for women (493 | 13.3%).
| Income | Male | Female |
| $2,499 or less | 158 (3.7%) | 200 (5.4%) |
| $2,500 to $4,999 | 291 (6.9%) | 184 (5.0%) |
| $5,000 to $7,499 | 44 (1.0%) | 104 (2.8%) |
| $7,500 to $9,999 | 141 (3.3%) | 33 (0.9%) |
| $10,000 to $12,499 | 57 (1.3%) | 88 (2.4%) |
| $12,500 to $14,999 | 78 (1.8%) | 94 (2.5%) |
| $15,000 to $17,499 | 27 (0.6%) | 89 (2.4%) |
| $17,500 to $19,999 | 4 (0.1%) | 81 (2.2%) |
| $20,000 to $22,499 | 90 (2.1%) | 79 (2.1%) |
| $22,500 to $24,999 | 184 (4.3%) | 276 (7.4%) |
| $25,000 to $29,999 | 64 (1.5%) | 164 (4.4%) |
| $30,000 to $34,999 | 145 (3.4%) | 129 (3.5%) |
| $35,000 to $39,999 | 161 (3.8%) | 104 (2.8%) |
| $40,000 to $44,999 | 155 (3.7%) | 309 (8.3%) |
| $45,000 to $49,999 | 209 (5.0%) | 262 (7.0%) |
| $50,000 to $54,999 | 111 (2.6%) | 126 (3.4%) |
| $55,000 to $64,999 | 463 (11.0%) | 179 (4.8%) |
| $65,000 to $74,999 | 216 (5.1%) | 254 (6.8%) |
| $75,000 to $99,999 | 529 (12.5%) | 493 (13.3%) |
| $100,000+ | 1,099 (26.0%) | 468 (12.6%) |
| Total | 4,226 (100.0%) | 3,716 (100.0%) |
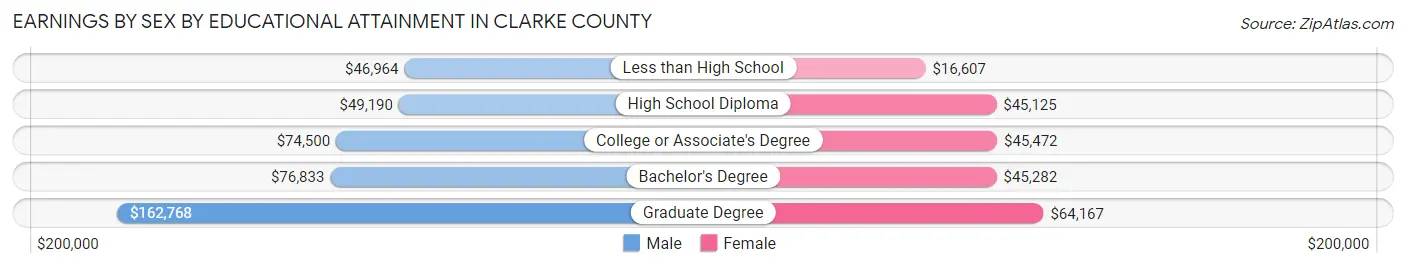
Earnings by Sex by Educational Attainment in Clarke County
Average earnings in Clarke County are $66,800 for men and $46,443 for women, a difference of 30.5%. Men with an educational attainment of graduate degree enjoy the highest average annual earnings of $162,768, while those with less than high school education earn the least with $46,964. Women with an educational attainment of graduate degree earn the most with the average annual earnings of $64,167, while those with less than high school education have the smallest earnings of $16,607.
| Educational Attainment | Male Income | Female Income |
| Less than High School | $46,964 | $16,607 |
| High School Diploma | $49,190 | $45,125 |
| College or Associate's Degree | $74,500 | $45,472 |
| Bachelor's Degree | $76,833 | $45,282 |
| Graduate Degree | $162,768 | $64,167 |
| Total | $66,800 | $46,443 |
Family Income in Clarke County
Family Income Brackets in Clarke County
According to the Clarke County family income data, there are 932 families falling into the $100,000 to $149,999 income range, which is the most common income bracket and makes up 23.9% of all families. Conversely, the less than $10,000 income bracket is the least frequent group with only 12 families (0.3%) belonging to this category.
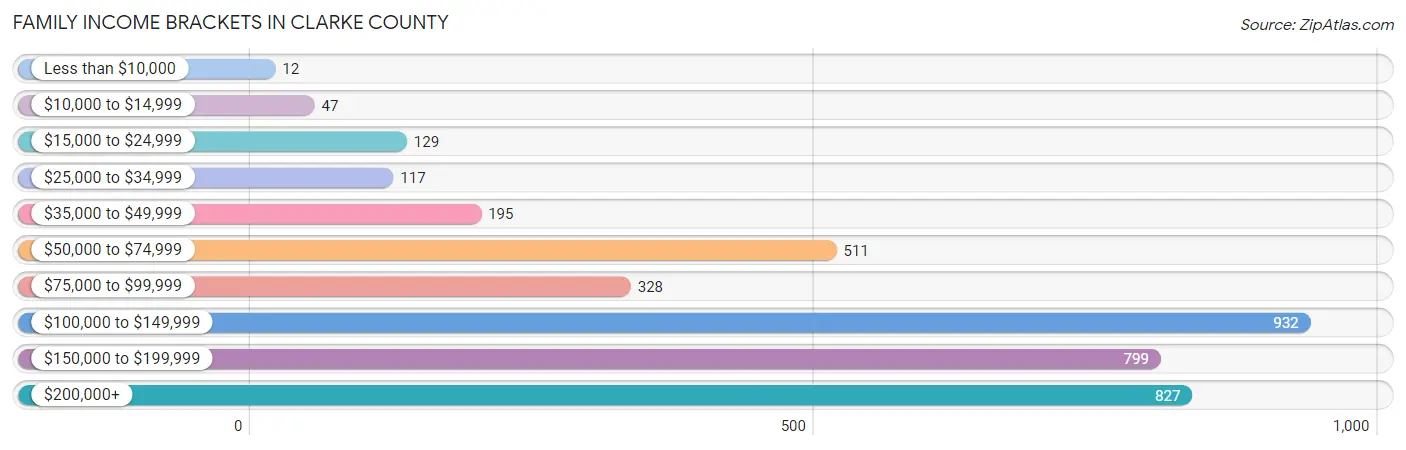
| Income Bracket | # Families | % Families |
| Less than $10,000 | 12 | 0.3% |
| $10,000 to $14,999 | 47 | 1.2% |
| $15,000 to $24,999 | 129 | 3.3% |
| $25,000 to $34,999 | 117 | 3.0% |
| $35,000 to $49,999 | 195 | 5.0% |
| $50,000 to $74,999 | 511 | 13.1% |
| $75,000 to $99,999 | 328 | 8.4% |
| $100,000 to $149,999 | 932 | 23.9% |
| $150,000 to $199,999 | 799 | 20.5% |
| $200,000+ | 827 | 21.2% |
Family Income by Famaliy Size in Clarke County
7+ person families (67 | 1.7%) account for the highest median family income in Clarke County with $215,917 per family, while 2-person families (2,039 | 52.3%) have the highest median income of $54,452 per family member.
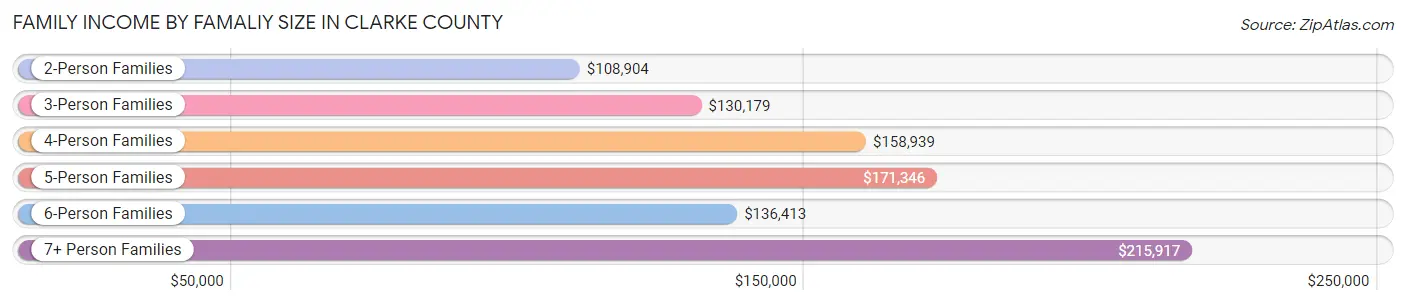
| Income Bracket | # Families | Median Income |
| 2-Person Families | 2,039 (52.3%) | $108,904 |
| 3-Person Families | 780 (20.0%) | $130,179 |
| 4-Person Families | 655 (16.8%) | $158,939 |
| 5-Person Families | 238 (6.1%) | $171,346 |
| 6-Person Families | 120 (3.1%) | $136,413 |
| 7+ Person Families | 67 (1.7%) | $215,917 |
| Total | 3,899 (100.0%) | $133,352 |
Family Income by Number of Earners in Clarke County
The median family income in Clarke County is $133,352, with families comprising 2 earners (1,500) having the highest median family income of $159,291, while families with no earners (897) have the lowest median family income of $67,040, accounting for 38.5% and 23.0% of families, respectively.
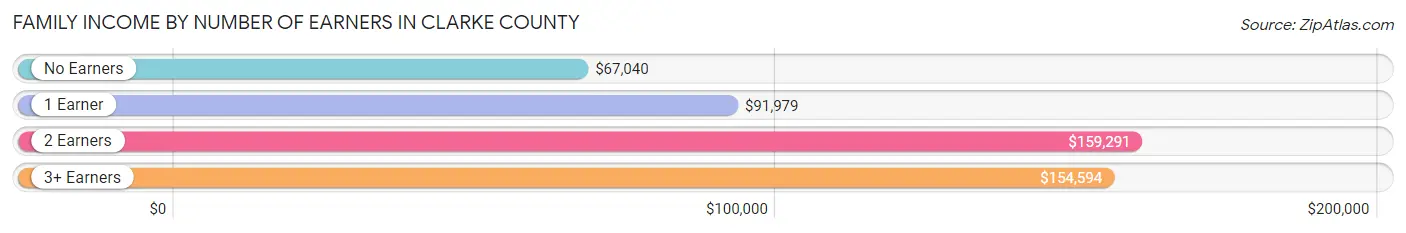
| Number of Earners | # Families | Median Income |
| No Earners | 897 (23.0%) | $67,040 |
| 1 Earner | 849 (21.8%) | $91,979 |
| 2 Earners | 1,500 (38.5%) | $159,291 |
| 3+ Earners | 653 (16.8%) | $154,594 |
| Total | 3,899 (100.0%) | $133,352 |
Household Income in Clarke County
Household Income Brackets in Clarke County
With 1,185 households falling in the category, the $100,000 to $149,999 income range is the most frequent in Clarke County, accounting for 21.1% of all households. In contrast, only 90 households (1.6%) fall into the less than $10,000 income bracket, making it the least populous group.
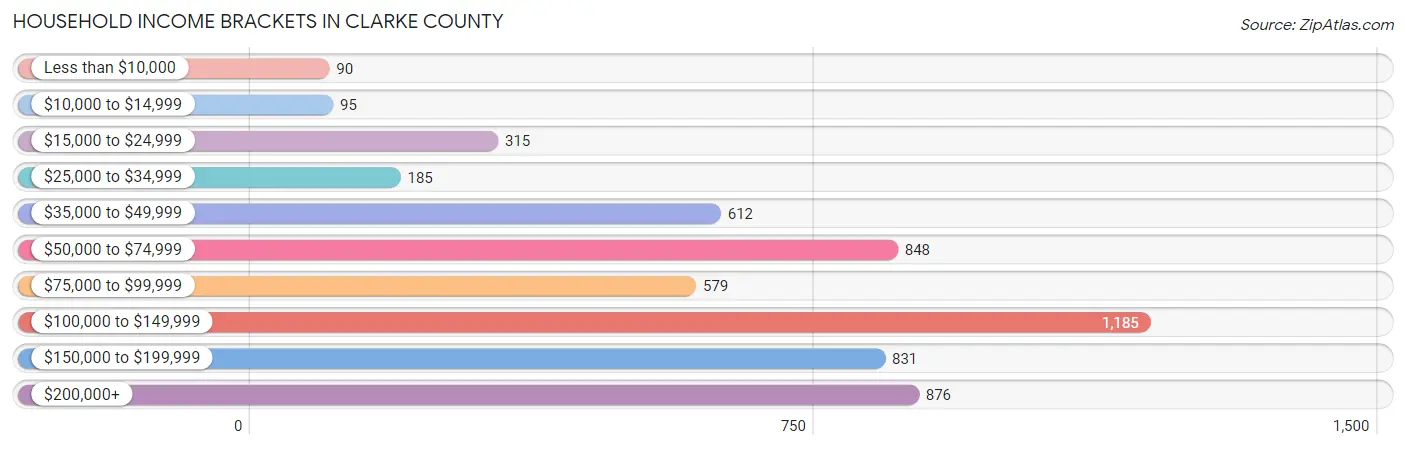
| Income Bracket | # Households | % Households |
| Less than $10,000 | 90 | 1.6% |
| $10,000 to $14,999 | 95 | 1.7% |
| $15,000 to $24,999 | 315 | 5.6% |
| $25,000 to $34,999 | 185 | 3.3% |
| $35,000 to $49,999 | 612 | 10.9% |
| $50,000 to $74,999 | 848 | 15.1% |
| $75,000 to $99,999 | 579 | 10.3% |
| $100,000 to $149,999 | 1,185 | 21.1% |
| $150,000 to $199,999 | 831 | 14.8% |
| $200,000+ | 876 | 15.6% |
Household Income by Householder Age in Clarke County
The median household income in Clarke County is $107,475, with the highest median household income of $132,165 found in the 45 to 64 years age bracket for the primary householder. A total of 2,723 households (48.5%) fall into this category. Meanwhile, the 15 to 24 years age bracket for the primary householder has the lowest median household income of $48,029, with 93 households (1.7%) in this group.
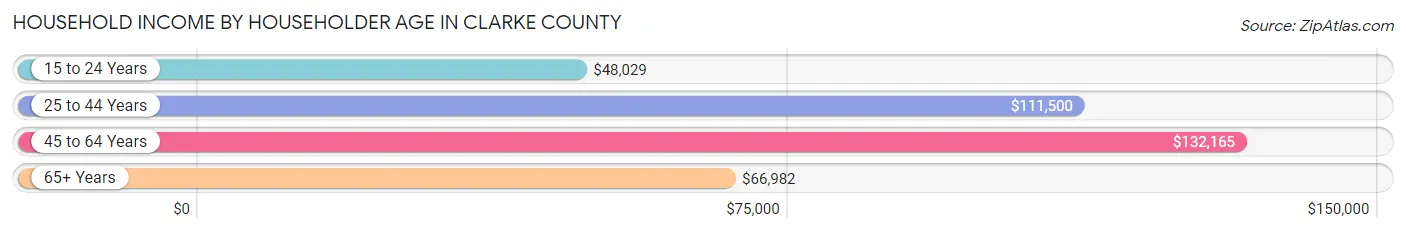
| Income Bracket | # Households | Median Income |
| 15 to 24 Years | 93 (1.7%) | $48,029 |
| 25 to 44 Years | 1,100 (19.6%) | $111,500 |
| 45 to 64 Years | 2,723 (48.5%) | $132,165 |
| 65+ Years | 1,701 (30.3%) | $66,982 |
| Total | 5,617 (100.0%) | $107,475 |
Poverty in Clarke County
Income Below Poverty by Sex and Age in Clarke County
With 5.1% poverty level for males and 5.7% for females among the residents of Clarke County, 18 to 24 year old males and 5 year old females are the most vulnerable to poverty, with 107 males (18.7%) and 29 females (100.0%) in their respective age groups living below the poverty level.
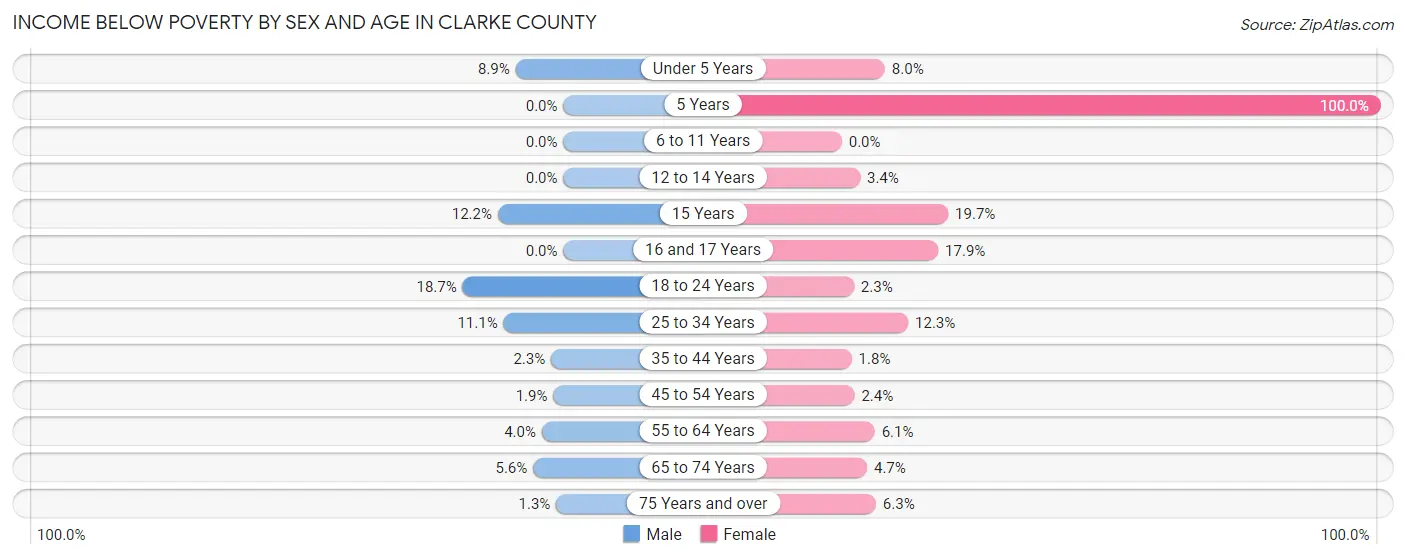
| Age Bracket | Male | Female |
| Under 5 Years | 25 (8.9%) | 20 (8.0%) |
| 5 Years | 0 (0.0%) | 29 (100.0%) |
| 6 to 11 Years | 0 (0.0%) | 0 (0.0%) |
| 12 to 14 Years | 0 (0.0%) | 11 (3.4%) |
| 15 Years | 14 (12.2%) | 15 (19.7%) |
| 16 and 17 Years | 0 (0.0%) | 44 (17.9%) |
| 18 to 24 Years | 107 (18.7%) | 13 (2.2%) |
| 25 to 34 Years | 75 (11.1%) | 79 (12.3%) |
| 35 to 44 Years | 17 (2.3%) | 14 (1.8%) |
| 45 to 54 Years | 21 (1.9%) | 25 (2.4%) |
| 55 to 64 Years | 51 (4.0%) | 81 (6.1%) |
| 65 to 74 Years | 51 (5.6%) | 43 (4.7%) |
| 75 Years and over | 7 (1.3%) | 47 (6.3%) |
| Total | 368 (5.1%) | 421 (5.7%) |
Income Above Poverty by Sex and Age in Clarke County
According to the poverty statistics in Clarke County, males aged 5 years and females aged 6 to 11 years are the age groups that are most secure financially, with 100.0% of males and 100.0% of females in these age groups living above the poverty line.
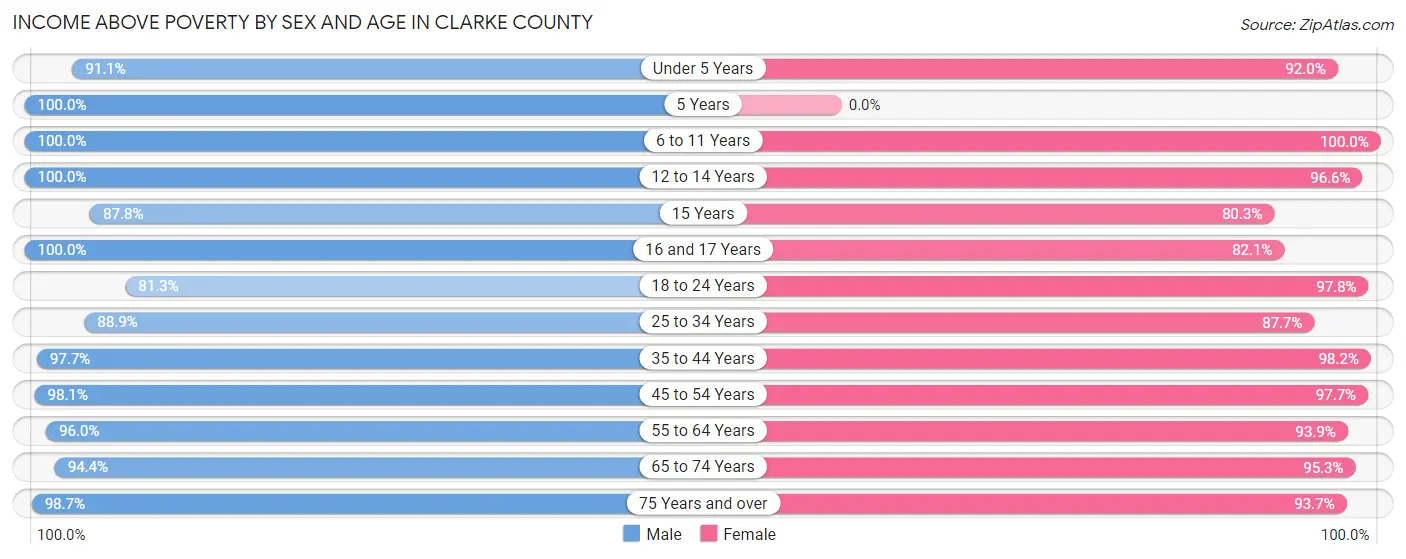
| Age Bracket | Male | Female |
| Under 5 Years | 257 (91.1%) | 230 (92.0%) |
| 5 Years | 73 (100.0%) | 0 (0.0%) |
| 6 to 11 Years | 463 (100.0%) | 493 (100.0%) |
| 12 to 14 Years | 189 (100.0%) | 314 (96.6%) |
| 15 Years | 101 (87.8%) | 61 (80.3%) |
| 16 and 17 Years | 207 (100.0%) | 202 (82.1%) |
| 18 to 24 Years | 465 (81.3%) | 564 (97.8%) |
| 25 to 34 Years | 600 (88.9%) | 563 (87.7%) |
| 35 to 44 Years | 726 (97.7%) | 751 (98.2%) |
| 45 to 54 Years | 1,110 (98.1%) | 1,041 (97.7%) |
| 55 to 64 Years | 1,225 (96.0%) | 1,244 (93.9%) |
| 65 to 74 Years | 858 (94.4%) | 873 (95.3%) |
| 75 Years and over | 521 (98.7%) | 695 (93.7%) |
| Total | 6,795 (94.9%) | 7,031 (94.4%) |
Income Below Poverty Among Married-Couple Families in Clarke County
The poverty statistics for married-couple families in Clarke County show that 0.9% or 28 of the total 3,258 families live below the poverty line. Families with 1 or 2 children have the highest poverty rate of 2.2%, comprising of 18 families. On the other hand, families with 3 or 4 children have the lowest poverty rate of 0.0%, which includes 0 families.
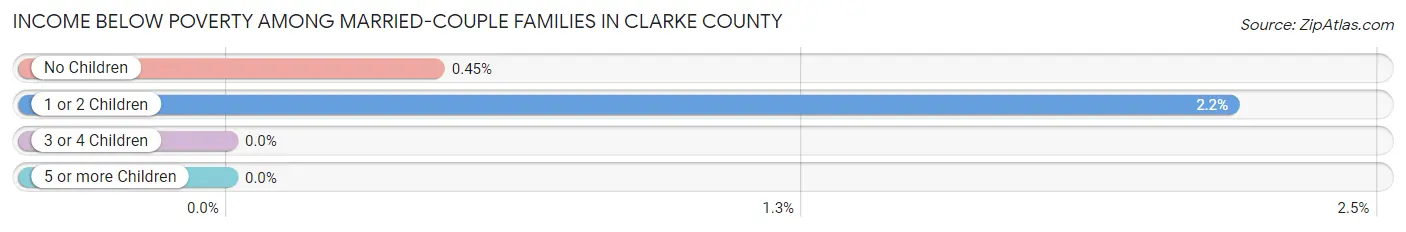
| Children | Above Poverty | Below Poverty |
| No Children | 2,196 (99.6%) | 10 (0.4%) |
| 1 or 2 Children | 808 (97.8%) | 18 (2.2%) |
| 3 or 4 Children | 210 (100.0%) | 0 (0.0%) |
| 5 or more Children | 16 (100.0%) | 0 (0.0%) |
| Total | 3,230 (99.1%) | 28 (0.9%) |
Income Below Poverty Among Single-Parent Households in Clarke County
According to the poverty data in Clarke County, 12.4% or 28 single-father households and 11.1% or 46 single-mother households are living below the poverty line. Among single-father households, those with 1 or 2 children have the highest poverty rate, with 28 households (24.8%) experiencing poverty. Likewise, among single-mother households, those with no children have the highest poverty rate, with 33 households (15.5%) falling below the poverty line.
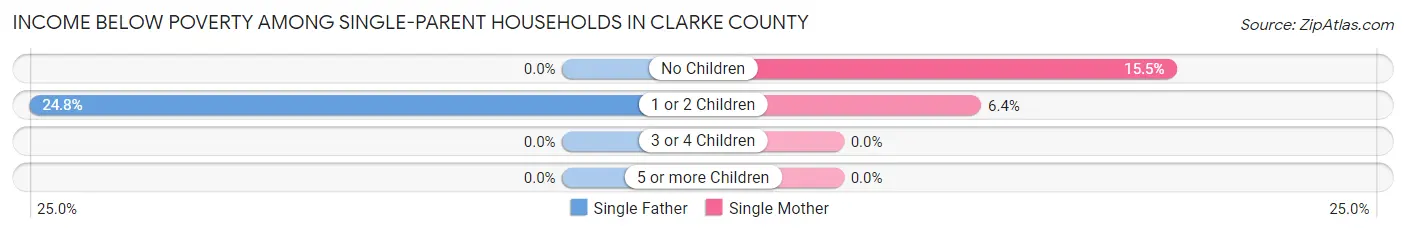
| Children | Single Father | Single Mother |
| No Children | 0 (0.0%) | 33 (15.5%) |
| 1 or 2 Children | 28 (24.8%) | 13 (6.4%) |
| 3 or 4 Children | 0 (0.0%) | 0 (0.0%) |
| 5 or more Children | 0 (0.0%) | 0 (0.0%) |
| Total | 28 (12.4%) | 46 (11.1%) |
Income Below Poverty Among Married-Couple vs Single-Parent Households in Clarke County
The poverty data for Clarke County shows that 28 of the married-couple family households (0.9%) and 74 of the single-parent households (11.5%) are living below the poverty level. Within the married-couple family households, those with 1 or 2 children have the highest poverty rate, with 18 households (2.2%) falling below the poverty line. Among the single-parent households, those with 1 or 2 children have the highest poverty rate, with 41 household (13.0%) living below poverty.
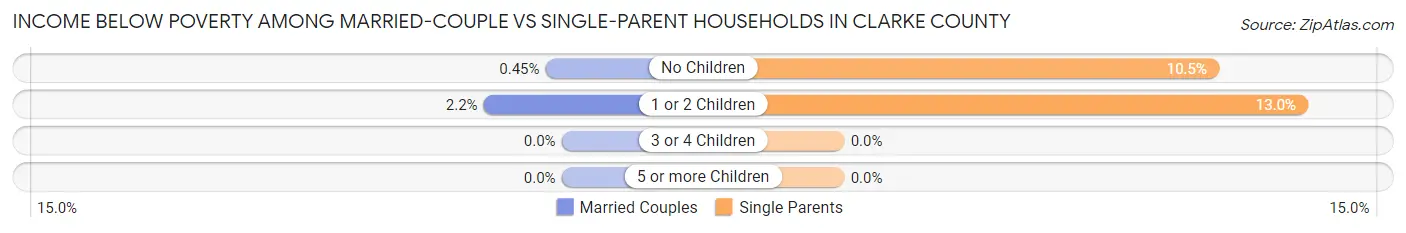
| Children | Married-Couple Families | Single-Parent Households |
| No Children | 10 (0.4%) | 33 (10.5%) |
| 1 or 2 Children | 18 (2.2%) | 41 (13.0%) |
| 3 or 4 Children | 0 (0.0%) | 0 (0.0%) |
| 5 or more Children | 0 (0.0%) | 0 (0.0%) |
| Total | 28 (0.9%) | 74 (11.5%) |
Race in Clarke County
The most populous races in Clarke County are White / Caucasian (13,120 | 88.2%), Hispanic or Latino (985 | 6.6%), and Black / African American (680 | 4.6%).
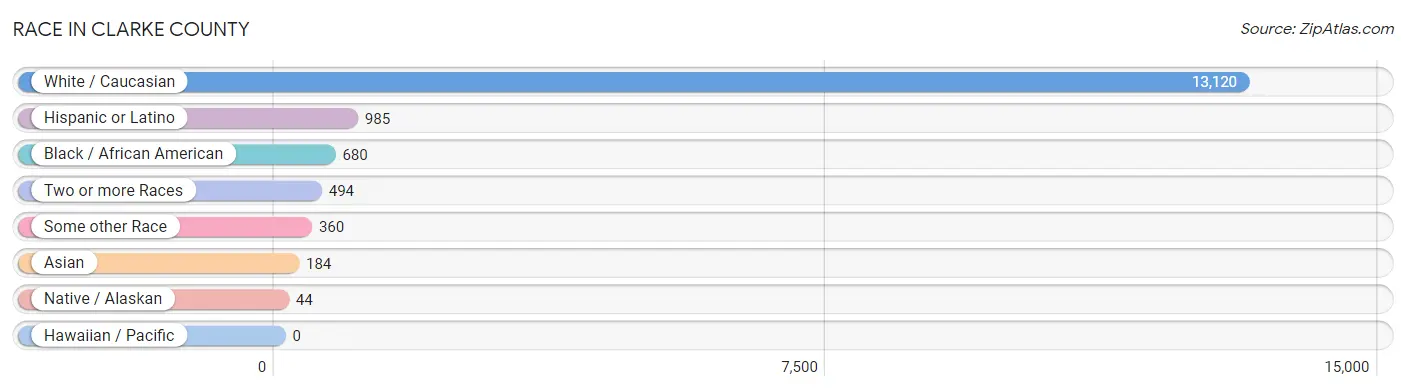
| Race | # Population | % Population |
| Asian | 184 | 1.2% |
| Black / African American | 680 | 4.6% |
| Hawaiian / Pacific | 0 | 0.0% |
| Hispanic or Latino | 985 | 6.6% |
| Native / Alaskan | 44 | 0.3% |
| White / Caucasian | 13,120 | 88.2% |
| Two or more Races | 494 | 3.3% |
| Some other Race | 360 | 2.4% |
| Total | 14,882 | 100.0% |
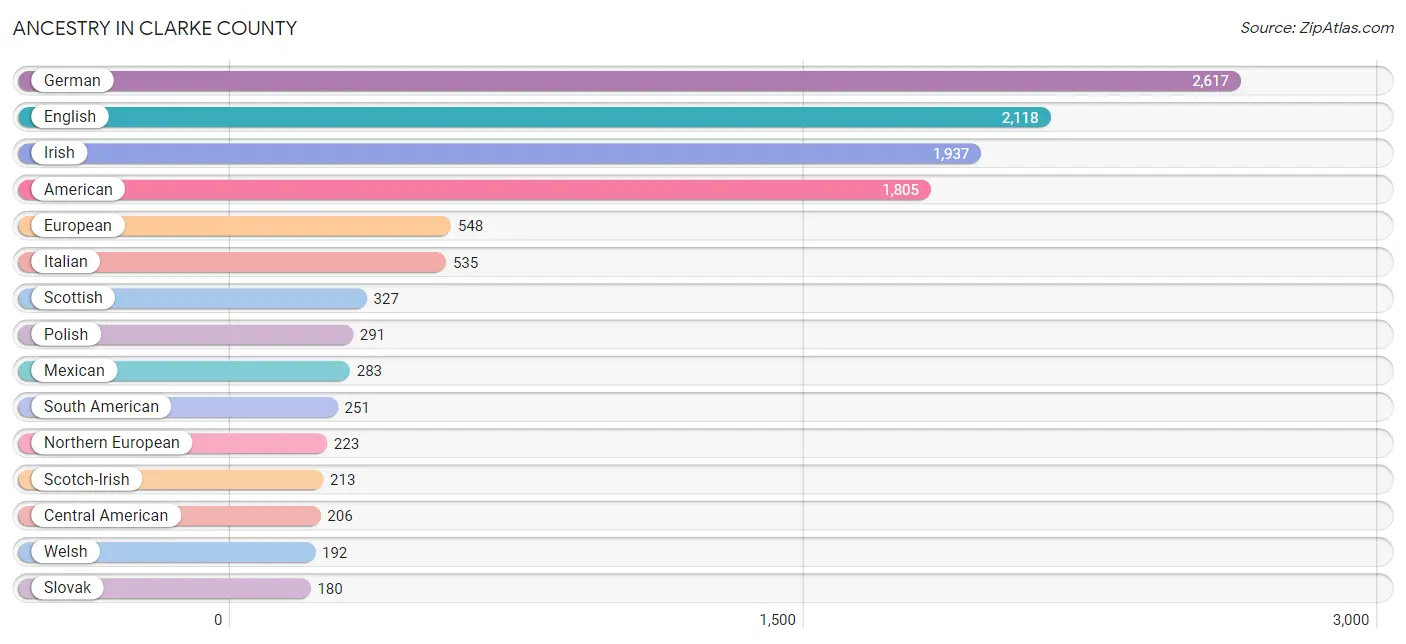
Ancestry in Clarke County
The most populous ancestries reported in Clarke County are German (2,617 | 17.6%), English (2,118 | 14.2%), Irish (1,937 | 13.0%), American (1,805 | 12.1%), and European (548 | 3.7%), together accounting for 60.7% of all Clarke County residents.
| Ancestry | # Population | % Population |
| African | 20 | 0.1% |
| American | 1,805 | 12.1% |
| Apache | 49 | 0.3% |
| Arab | 75 | 0.5% |
| Armenian | 50 | 0.3% |
| Austrian | 52 | 0.4% |
| Belgian | 15 | 0.1% |
| Bhutanese | 41 | 0.3% |
| Blackfeet | 26 | 0.2% |
| Bolivian | 83 | 0.6% |
| British | 166 | 1.1% |
| British West Indian | 1 | 0.0% |
| Burmese | 38 | 0.3% |
| Canadian | 29 | 0.2% |
| Central American | 206 | 1.4% |
| Cherokee | 32 | 0.2% |
| Chilean | 3 | 0.0% |
| Colombian | 4 | 0.0% |
| Cree | 14 | 0.1% |
| Croatian | 10 | 0.1% |
| Cuban | 98 | 0.7% |
| Czech | 26 | 0.2% |
| Czechoslovakian | 12 | 0.1% |
| Danish | 45 | 0.3% |
| Dominican | 2 | 0.0% |
| Dutch | 137 | 0.9% |
| Eastern European | 51 | 0.3% |
| Ecuadorian | 8 | 0.1% |
| English | 2,118 | 14.2% |
| European | 548 | 3.7% |
| Finnish | 10 | 0.1% |
| French | 96 | 0.6% |
| French Canadian | 57 | 0.4% |
| German | 2,617 | 17.6% |
| Greek | 37 | 0.3% |
| Guatemalan | 48 | 0.3% |
| Hungarian | 75 | 0.5% |
| Indian (Asian) | 29 | 0.2% |
| Irish | 1,937 | 13.0% |
| Italian | 535 | 3.6% |
| Korean | 99 | 0.7% |
| Mexican | 283 | 1.9% |
| Native Hawaiian | 19 | 0.1% |
| Northern European | 223 | 1.5% |
| Norwegian | 28 | 0.2% |
| Peruvian | 143 | 1.0% |
| Polish | 291 | 2.0% |
| Portuguese | 53 | 0.4% |
| Puerto Rican | 83 | 0.6% |
| Russian | 28 | 0.2% |
| Salvadoran | 158 | 1.1% |
| Scandinavian | 10 | 0.1% |
| Scotch-Irish | 213 | 1.4% |
| Scottish | 327 | 2.2% |
| Sioux | 24 | 0.2% |
| Slavic | 12 | 0.1% |
| Slovak | 180 | 1.2% |
| South American | 251 | 1.7% |
| Spanish | 21 | 0.1% |
| Subsaharan African | 20 | 0.1% |
| Swedish | 58 | 0.4% |
| Swiss | 46 | 0.3% |
| Thai | 49 | 0.3% |
| Turkish | 9 | 0.1% |
| Venezuelan | 10 | 0.1% |
| Welsh | 192 | 1.3% | View All 66 Rows |
Immigrants in Clarke County
The most numerous immigrant groups reported in Clarke County came from Latin America (361 | 2.4%), Central America (231 | 1.5%), Europe (194 | 1.3%), Asia (142 | 0.9%), and El Salvador (102 | 0.7%), together accounting for 6.9% of all Clarke County residents.
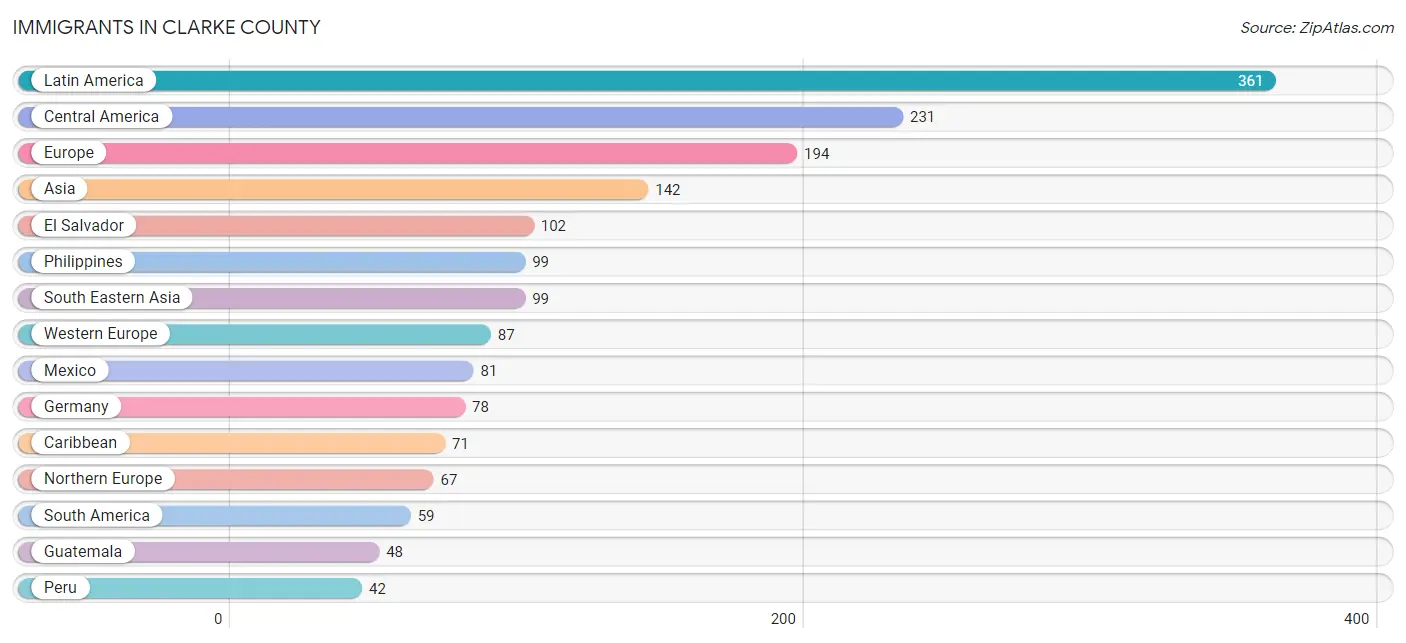
| Immigration Origin | # Population | % Population |
| Asia | 142 | 0.9% |
| Canada | 16 | 0.1% |
| Caribbean | 71 | 0.5% |
| Central America | 231 | 1.5% |
| Chile | 3 | 0.0% |
| China | 5 | 0.0% |
| Colombia | 4 | 0.0% |
| Cuba | 29 | 0.2% |
| Eastern Asia | 27 | 0.2% |
| Eastern Europe | 40 | 0.3% |
| El Salvador | 102 | 0.7% |
| England | 36 | 0.2% |
| Europe | 194 | 1.3% |
| Germany | 78 | 0.5% |
| Guatemala | 48 | 0.3% |
| India | 7 | 0.1% |
| Ireland | 22 | 0.2% |
| Korea | 22 | 0.2% |
| Latin America | 361 | 2.4% |
| Mexico | 81 | 0.5% |
| Netherlands | 9 | 0.1% |
| Northern Europe | 67 | 0.4% |
| Peru | 42 | 0.3% |
| Philippines | 99 | 0.7% |
| Poland | 40 | 0.3% |
| South America | 59 | 0.4% |
| South Central Asia | 7 | 0.1% |
| South Eastern Asia | 99 | 0.7% |
| Trinidad and Tobago | 42 | 0.3% |
| Turkey | 9 | 0.1% |
| Venezuela | 10 | 0.1% |
| Western Asia | 9 | 0.1% |
| Western Europe | 87 | 0.6% | View All 33 Rows |
Sex and Age in Clarke County
Sex and Age in Clarke County
The most populous age groups in Clarke County are 50 to 54 Years (668 | 9.1%) for men and 55 to 59 Years (692 | 9.2%) for women.
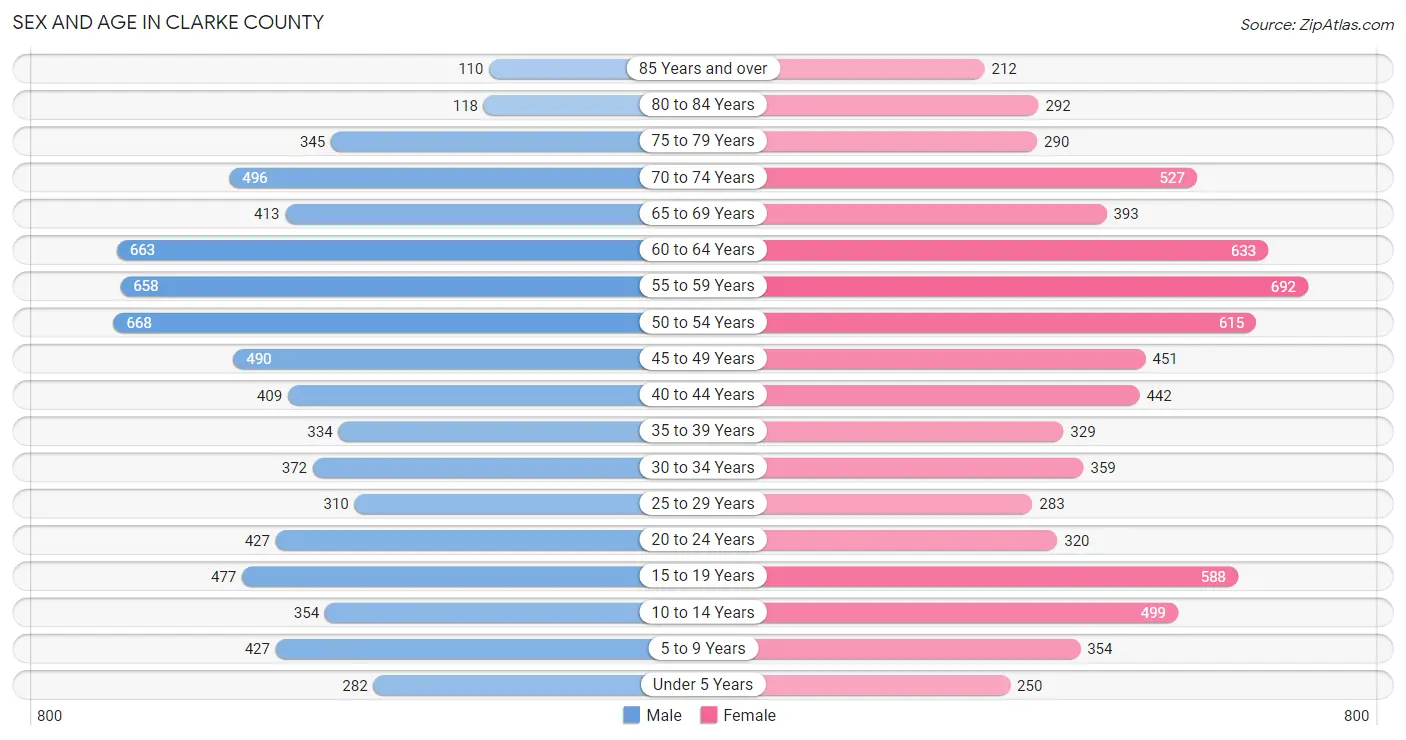
| Age Bracket | Male | Female |
| Under 5 Years | 282 (3.8%) | 250 (3.3%) |
| 5 to 9 Years | 427 (5.8%) | 354 (4.7%) |
| 10 to 14 Years | 354 (4.8%) | 499 (6.6%) |
| 15 to 19 Years | 477 (6.5%) | 588 (7.8%) |
| 20 to 24 Years | 427 (5.8%) | 320 (4.3%) |
| 25 to 29 Years | 310 (4.2%) | 283 (3.8%) |
| 30 to 34 Years | 372 (5.1%) | 359 (4.8%) |
| 35 to 39 Years | 334 (4.5%) | 329 (4.4%) |
| 40 to 44 Years | 409 (5.6%) | 442 (5.9%) |
| 45 to 49 Years | 490 (6.7%) | 451 (6.0%) |
| 50 to 54 Years | 668 (9.1%) | 615 (8.2%) |
| 55 to 59 Years | 658 (8.9%) | 692 (9.2%) |
| 60 to 64 Years | 663 (9.0%) | 633 (8.4%) |
| 65 to 69 Years | 413 (5.6%) | 393 (5.2%) |
| 70 to 74 Years | 496 (6.8%) | 527 (7.0%) |
| 75 to 79 Years | 345 (4.7%) | 290 (3.8%) |
| 80 to 84 Years | 118 (1.6%) | 292 (3.9%) |
| 85 Years and over | 110 (1.5%) | 212 (2.8%) |
| Total | 7,353 (100.0%) | 7,529 (100.0%) |
Families and Households in Clarke County
Median Family Size in Clarke County
The median family size in Clarke County is 3.10 persons per family, with single male/father families (225 | 5.8%) accounting for the largest median family size of 4.42 persons per family. On the other hand, single female/mother families (416 | 10.7%) represent the smallest median family size with 2.75 persons per family.
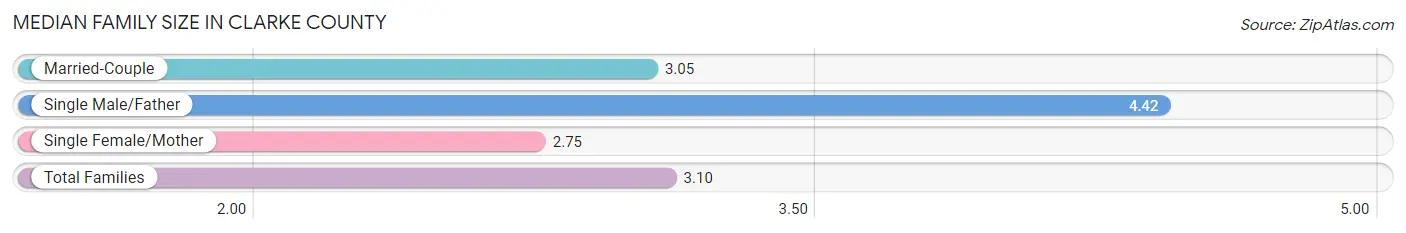
| Family Type | # Families | Family Size |
| Married-Couple | 3,258 (83.6%) | 3.05 |
| Single Male/Father | 225 (5.8%) | 4.42 |
| Single Female/Mother | 416 (10.7%) | 2.75 |
| Total Families | 3,899 (100.0%) | 3.10 |
Median Household Size in Clarke County
The median household size in Clarke County is 2.61 persons per household, with single male/father households (225 | 4.0%) accounting for the largest median household size of 4.84 persons per household. non-family households (1,718 | 30.6%) represent the smallest median household size with 1.29 persons per household.
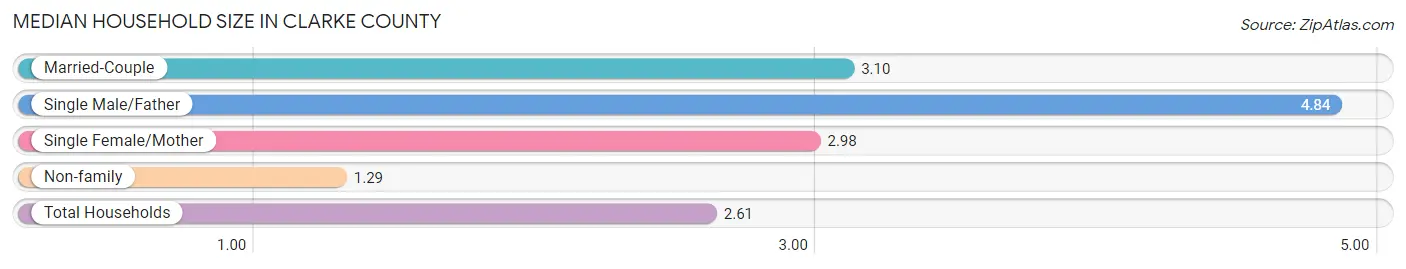
| Household Type | # Households | Household Size |
| Married-Couple | 3,258 (58.0%) | 3.10 |
| Single Male/Father | 225 (4.0%) | 4.84 |
| Single Female/Mother | 416 (7.4%) | 2.98 |
| Non-family | 1,718 (30.6%) | 1.29 |
| Total Households | 5,617 (100.0%) | 2.61 |
Household Size by Marriage Status in Clarke County
Out of a total of 5,617 households in Clarke County, 3,899 (69.4%) are family households, while 1,718 (30.6%) are nonfamily households. The most numerous type of family households are 2-person households, comprising 1,973, and the most common type of nonfamily households are 1-person households, comprising 1,476.
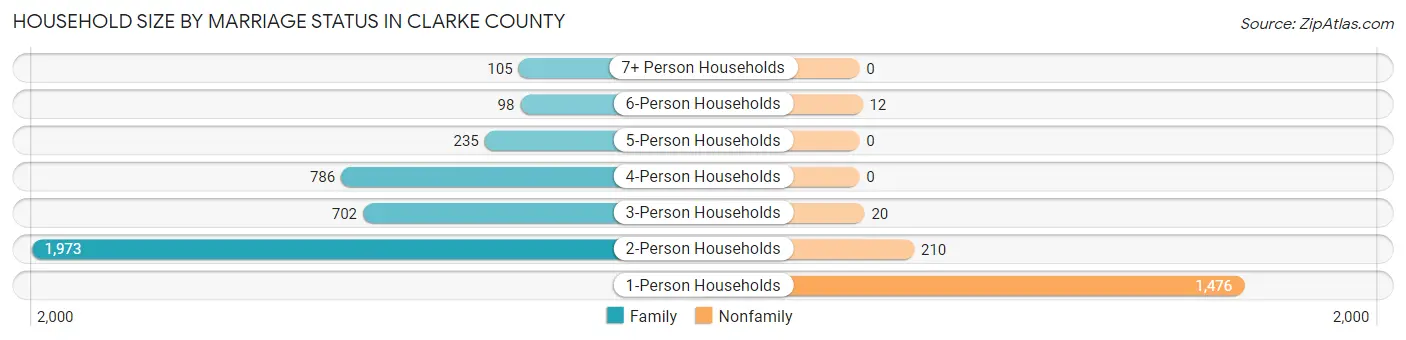
| Household Size | Family Households | Nonfamily Households |
| 1-Person Households | - | 1,476 (26.3%) |
| 2-Person Households | 1,973 (35.1%) | 210 (3.7%) |
| 3-Person Households | 702 (12.5%) | 20 (0.4%) |
| 4-Person Households | 786 (14.0%) | 0 (0.0%) |
| 5-Person Households | 235 (4.2%) | 0 (0.0%) |
| 6-Person Households | 98 (1.7%) | 12 (0.2%) |
| 7+ Person Households | 105 (1.9%) | 0 (0.0%) |
| Total | 3,899 (69.4%) | 1,718 (30.6%) |
Female Fertility in Clarke County
Fertility by Age in Clarke County
Average fertility rate in Clarke County is 40.0 births per 1,000 women. Women in the age bracket of 20 to 34 years have the highest fertility rate with 120.0 births per 1,000 women. Women in the age bracket of 20 to 34 years acount for 99.1% of all women with births.
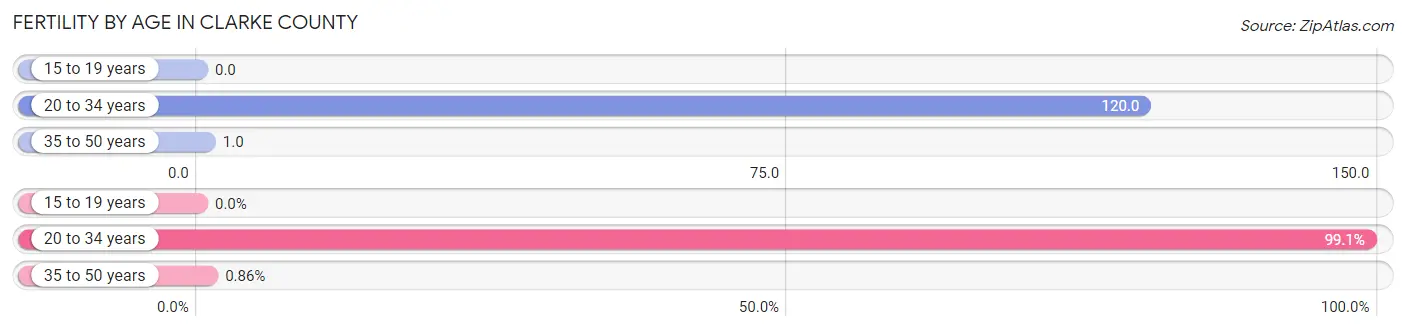
| Age Bracket | Women with Births | Births / 1,000 Women |
| 15 to 19 years | 0 (0.0%) | 0.0 |
| 20 to 34 years | 115 (99.1%) | 120.0 |
| 35 to 50 years | 1 (0.9%) | 1.0 |
| Total | 116 (100.0%) | 40.0 |
Fertility by Age by Marriage Status in Clarke County
80.2% of women with births (116) in Clarke County are married. The highest percentage of unmarried women with births falls into 20 to 34 years age bracket with 20.0% of them unmarried at the time of birth, while the lowest percentage of unmarried women with births belong to 35 to 50 years age bracket with 0.0% of them unmarried.
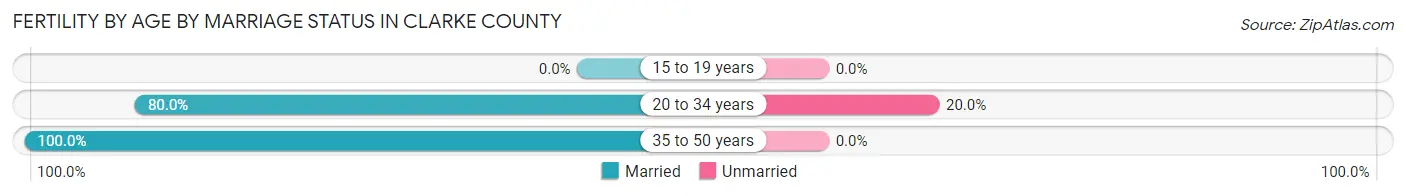
| Age Bracket | Married | Unmarried |
| 15 to 19 years | 0 (0.0%) | 0 (0.0%) |
| 20 to 34 years | 92 (80.0%) | 23 (20.0%) |
| 35 to 50 years | 1 (100.0%) | 0 (0.0%) |
| Total | 93 (80.2%) | 23 (19.8%) |
Fertility by Education in Clarke County
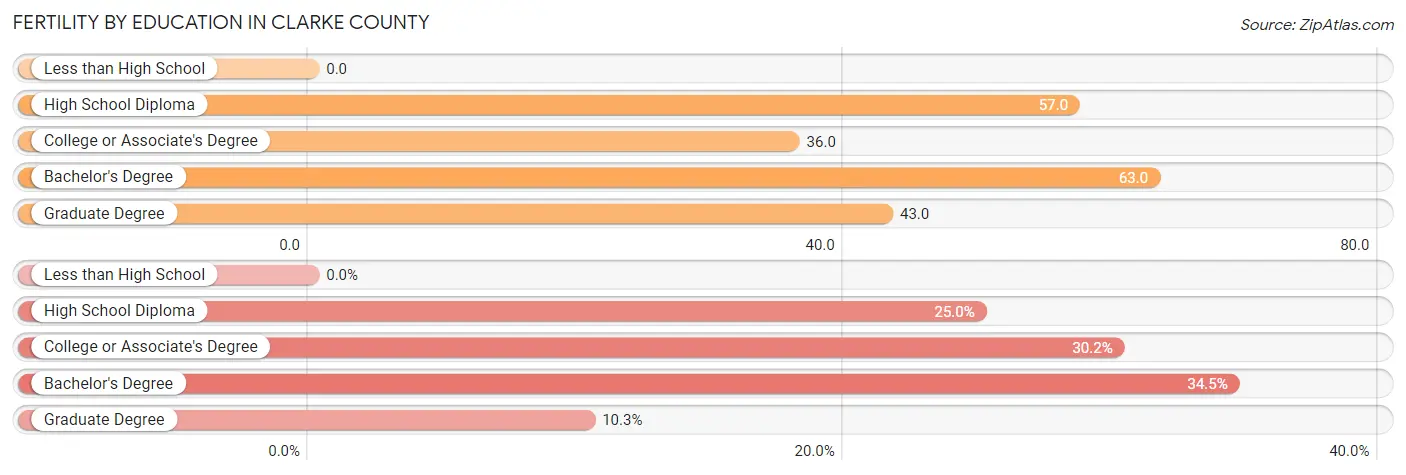
| Educational Attainment | Women with Births | Births / 1,000 Women |
| Less than High School | 0 (0.0%) | 0.0 |
| High School Diploma | 29 (25.0%) | 57.0 |
| College or Associate's Degree | 35 (30.2%) | 36.0 |
| Bachelor's Degree | 40 (34.5%) | 63.0 |
| Graduate Degree | 12 (10.3%) | 43.0 |
| Total | 116 (100.0%) | 40.0 |
Fertility by Education by Marriage Status in Clarke County
19.8% of women with births in Clarke County are unmarried. Women with the educational attainment of college or associate's degree are most likely to be married with 100.0% of them married at childbirth, while women with the educational attainment of high school diploma are least likely to be married with 79.3% of them unmarried at childbirth.
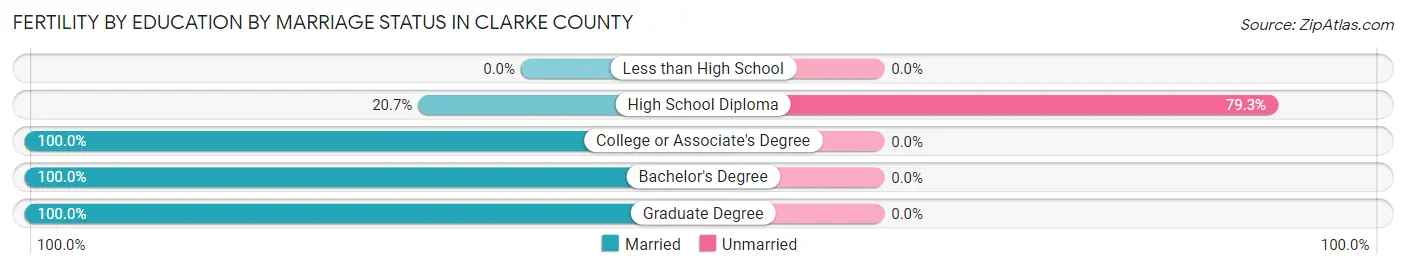
| Educational Attainment | Married | Unmarried |
| Less than High School | 0 (0.0%) | 0 (0.0%) |
| High School Diploma | 6 (20.7%) | 23 (79.3%) |
| College or Associate's Degree | 35 (100.0%) | 0 (0.0%) |
| Bachelor's Degree | 40 (100.0%) | 0 (0.0%) |
| Graduate Degree | 12 (100.0%) | 0 (0.0%) |
| Total | 93 (80.2%) | 23 (19.8%) |
Employment Characteristics in Clarke County
Employment by Class of Employer in Clarke County
Among the 7,421 employed individuals in Clarke County, private company employees (4,299 | 57.9%), local government employees (1,029 | 13.9%), and self-employed (not incorporated) (615 | 8.3%) make up the most common classes of employment.
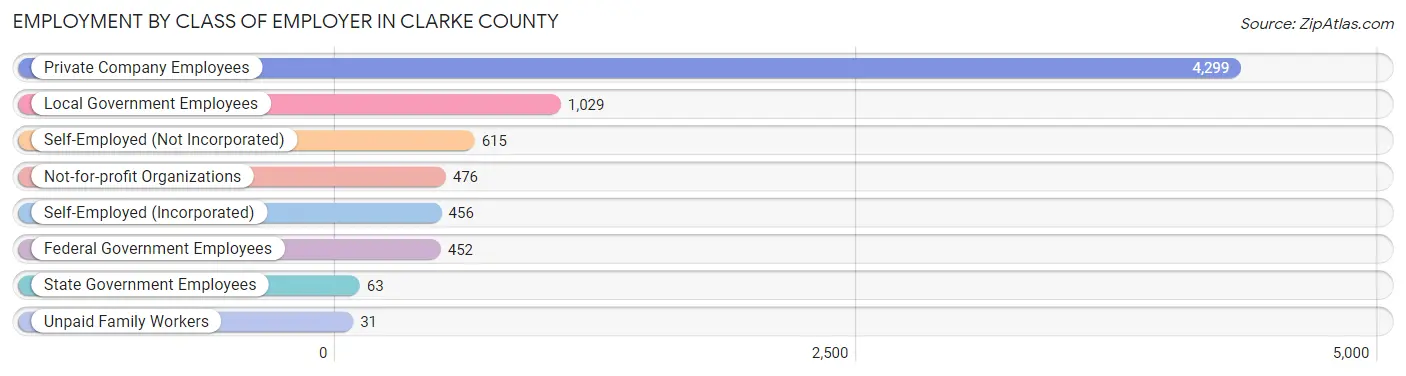
| Employer Class | # Employees | % Employees |
| Private Company Employees | 4,299 | 57.9% |
| Self-Employed (Incorporated) | 456 | 6.1% |
| Self-Employed (Not Incorporated) | 615 | 8.3% |
| Not-for-profit Organizations | 476 | 6.4% |
| Local Government Employees | 1,029 | 13.9% |
| State Government Employees | 63 | 0.9% |
| Federal Government Employees | 452 | 6.1% |
| Unpaid Family Workers | 31 | 0.4% |
| Total | 7,421 | 100.0% |
Employment Status by Age in Clarke County
According to the labor force statistics for Clarke County, out of the total population over 16 years of age (12,523), 61.7% or 7,727 individuals are in the labor force, with 3.5% or 270 of them unemployed. The age group with the highest labor force participation rate is 45 to 54 years, with 92.2% or 2,051 individuals in the labor force. Within the labor force, the 30 to 34 years age range has the highest percentage of unemployed individuals, with 14.5% or 81 of them being unemployed.
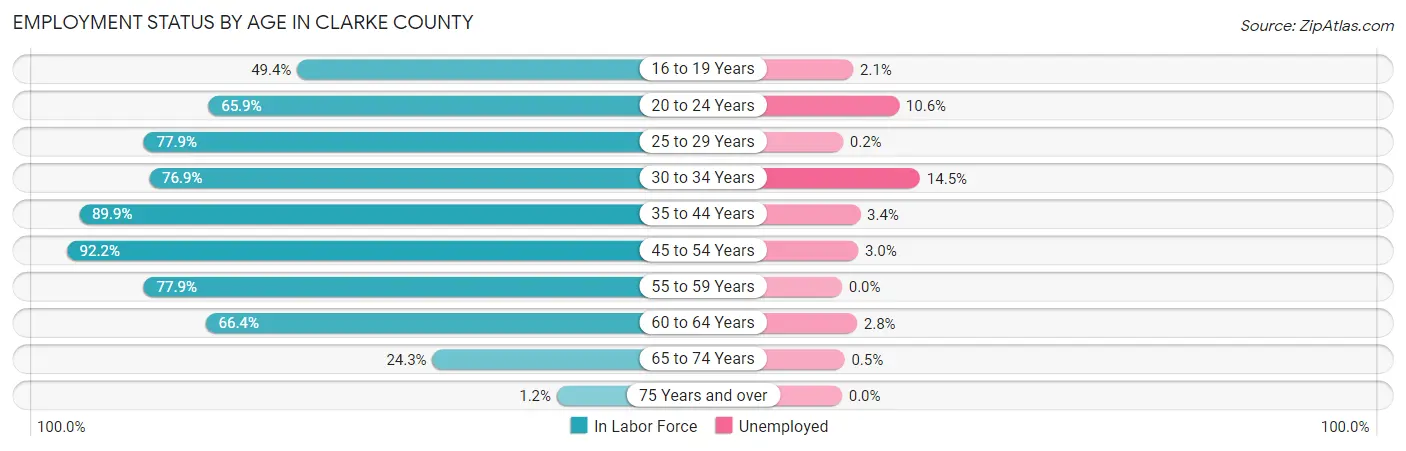
| Age Bracket | In Labor Force | Unemployed |
| 16 to 19 Years | 431 (49.4%) | 9 (2.1%) |
| 20 to 24 Years | 492 (65.9%) | 52 (10.6%) |
| 25 to 29 Years | 462 (77.9%) | 1 (0.2%) |
| 30 to 34 Years | 562 (76.9%) | 81 (14.5%) |
| 35 to 44 Years | 1,361 (89.9%) | 46 (3.4%) |
| 45 to 54 Years | 2,051 (92.2%) | 62 (3.0%) |
| 55 to 59 Years | 1,052 (77.9%) | 0 (0.0%) |
| 60 to 64 Years | 861 (66.4%) | 24 (2.8%) |
| 65 to 74 Years | 444 (24.3%) | 2 (0.5%) |
| 75 Years and over | 16 (1.2%) | 0 (0.0%) |
| Total | 7,727 (61.7%) | 270 (3.5%) |
Employment Status by Educational Attainment in Clarke County
According to labor force statistics for Clarke County, 82.3% of individuals (6,344) out of the total population between 25 and 64 years of age (7,708) are in the labor force, with 3.3% or 209 of them being unemployed. The group with the highest labor force participation rate are those with the educational attainment of college / associate degree, with 88.6% or 2,161 individuals in the labor force. Within the labor force, individuals with college / associate degree education have the highest percentage of unemployment, with 6.1% or 132 of them being unemployed.
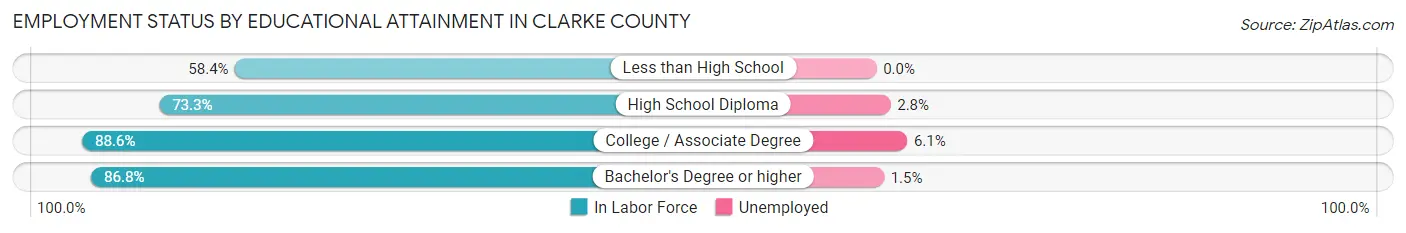
| Educational Attainment | In Labor Force | Unemployed |
| Less than High School | 239 (58.4%) | 0 (0.0%) |
| High School Diploma | 1,467 (73.3%) | 56 (2.8%) |
| College / Associate Degree | 2,161 (88.6%) | 149 (6.1%) |
| Bachelor's Degree or higher | 2,481 (86.8%) | 43 (1.5%) |
| Total | 6,344 (82.3%) | 254 (3.3%) |
Employment Occupations by Sex in Clarke County
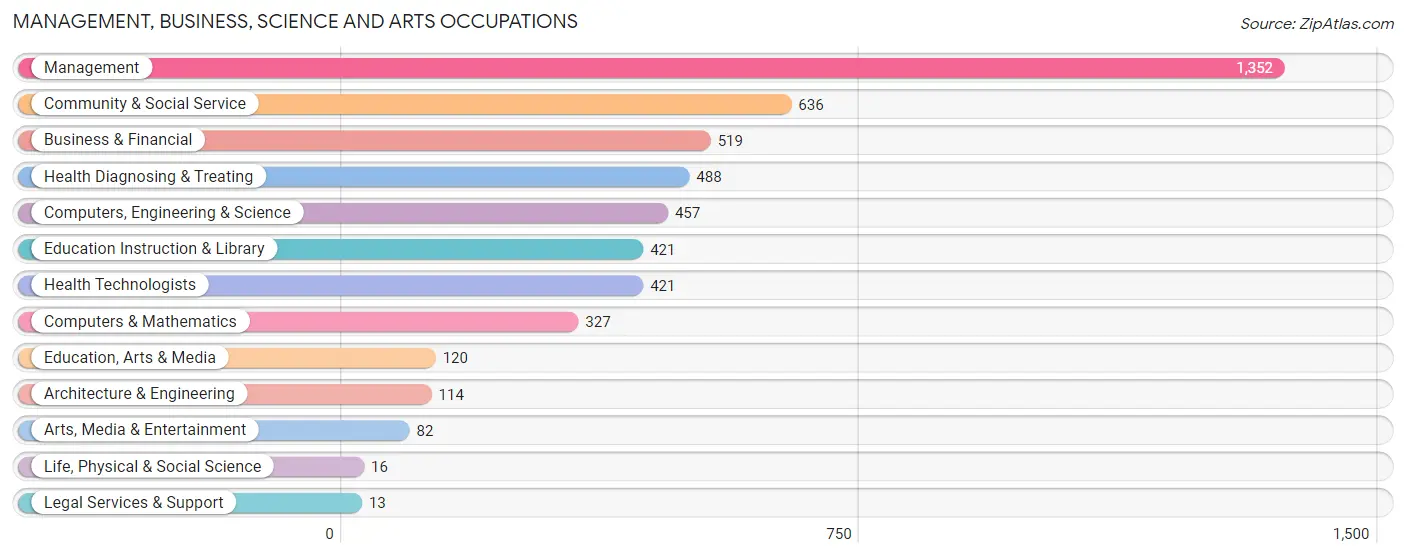
Management, Business, Science and Arts Occupations
The most common Management, Business, Science and Arts occupations in Clarke County are Management (1,352 | 18.3%), Community & Social Service (636 | 8.6%), Business & Financial (519 | 7.0%), Health Diagnosing & Treating (488 | 6.6%), and Computers, Engineering & Science (457 | 6.2%).
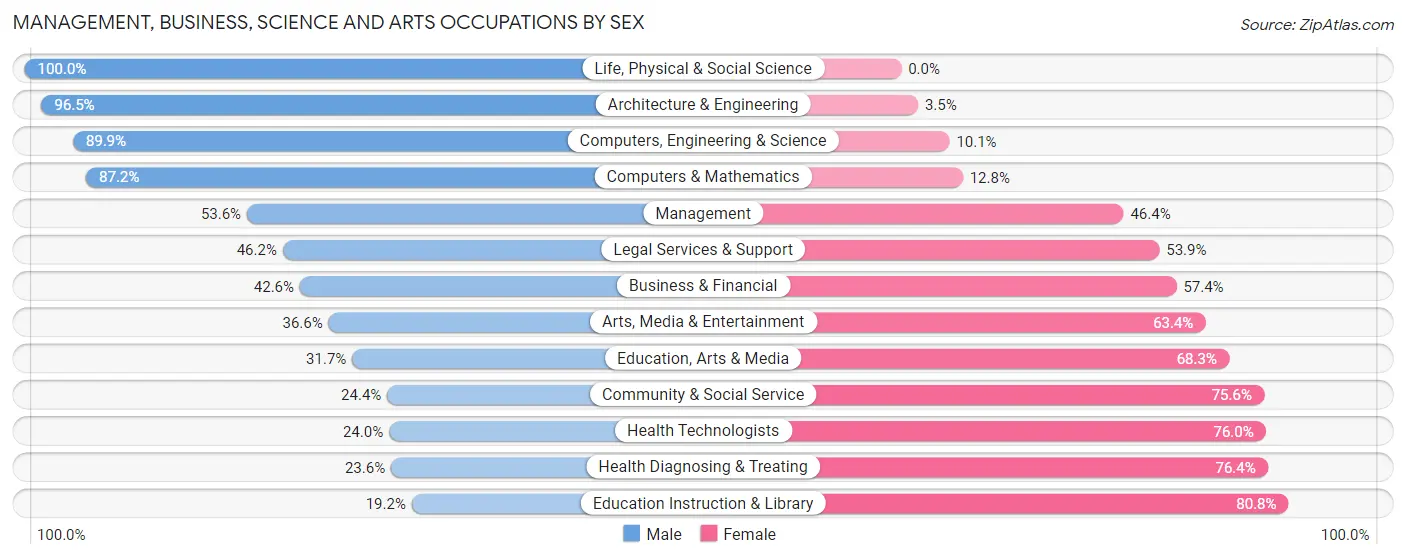
Management, Business, Science and Arts Occupations by Sex
Within the Management, Business, Science and Arts occupations in Clarke County, the most male-oriented occupations are Life, Physical & Social Science (100.0%), Architecture & Engineering (96.5%), and Computers, Engineering & Science (89.9%), while the most female-oriented occupations are Education Instruction & Library (80.8%), Health Diagnosing & Treating (76.4%), and Health Technologists (76.0%).
| Occupation | Male | Female |
| Management | 725 (53.6%) | 627 (46.4%) |
| Business & Financial | 221 (42.6%) | 298 (57.4%) |
| Computers, Engineering & Science | 411 (89.9%) | 46 (10.1%) |
| Computers & Mathematics | 285 (87.2%) | 42 (12.8%) |
| Architecture & Engineering | 110 (96.5%) | 4 (3.5%) |
| Life, Physical & Social Science | 16 (100.0%) | 0 (0.0%) |
| Community & Social Service | 155 (24.4%) | 481 (75.6%) |
| Education, Arts & Media | 38 (31.7%) | 82 (68.3%) |
| Legal Services & Support | 6 (46.2%) | 7 (53.8%) |
| Education Instruction & Library | 81 (19.2%) | 340 (80.8%) |
| Arts, Media & Entertainment | 30 (36.6%) | 52 (63.4%) |
| Health Diagnosing & Treating | 115 (23.6%) | 373 (76.4%) |
| Health Technologists | 101 (24.0%) | 320 (76.0%) |
| Total (Category) | 1,627 (47.1%) | 1,825 (52.9%) |
| Total (Overall) | 3,880 (52.5%) | 3,516 (47.5%) |
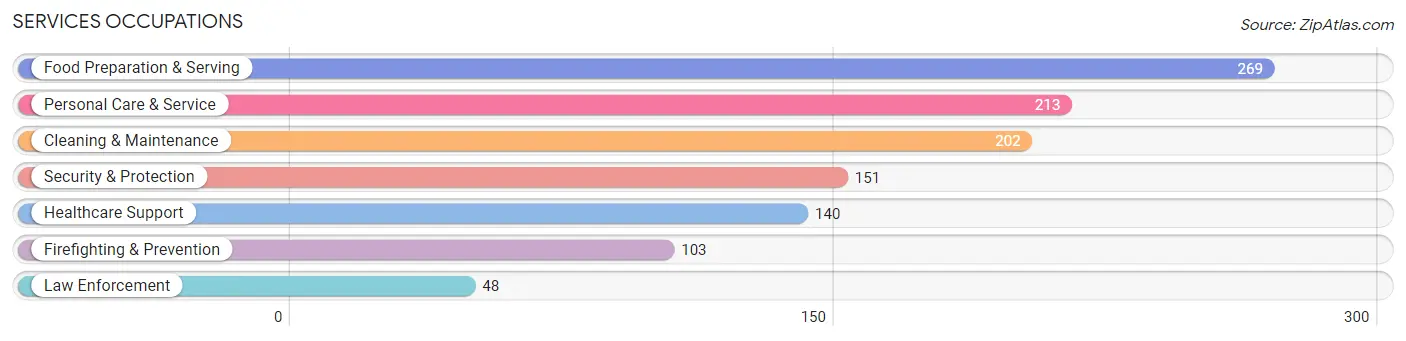
Services Occupations
The most common Services occupations in Clarke County are Food Preparation & Serving (269 | 3.6%), Personal Care & Service (213 | 2.9%), Cleaning & Maintenance (202 | 2.7%), Security & Protection (151 | 2.0%), and Healthcare Support (140 | 1.9%).
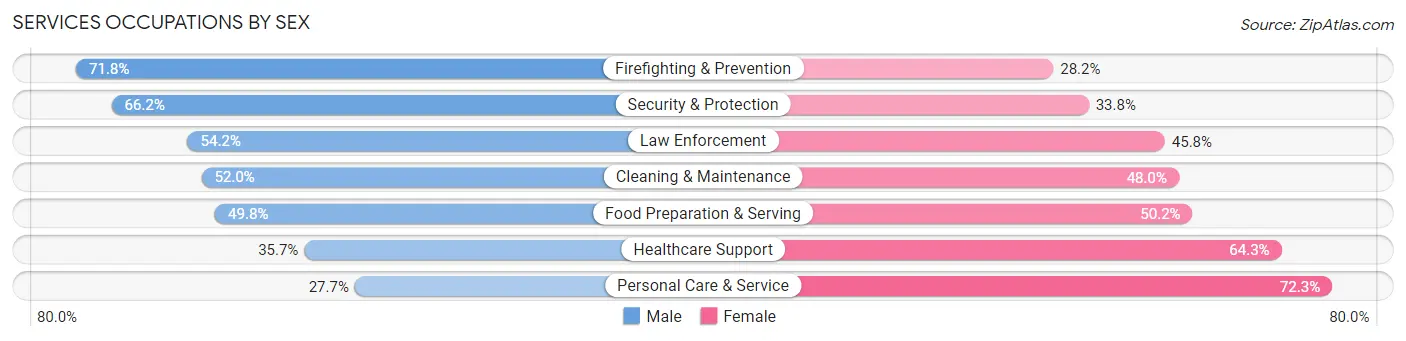
Services Occupations by Sex
Within the Services occupations in Clarke County, the most male-oriented occupations are Firefighting & Prevention (71.8%), Security & Protection (66.2%), and Law Enforcement (54.2%), while the most female-oriented occupations are Personal Care & Service (72.3%), Healthcare Support (64.3%), and Food Preparation & Serving (50.2%).
| Occupation | Male | Female |
| Healthcare Support | 50 (35.7%) | 90 (64.3%) |
| Security & Protection | 100 (66.2%) | 51 (33.8%) |
| Firefighting & Prevention | 74 (71.8%) | 29 (28.2%) |
| Law Enforcement | 26 (54.2%) | 22 (45.8%) |
| Food Preparation & Serving | 134 (49.8%) | 135 (50.2%) |
| Cleaning & Maintenance | 105 (52.0%) | 97 (48.0%) |
| Personal Care & Service | 59 (27.7%) | 154 (72.3%) |
| Total (Category) | 448 (46.0%) | 527 (54.0%) |
| Total (Overall) | 3,880 (52.5%) | 3,516 (47.5%) |
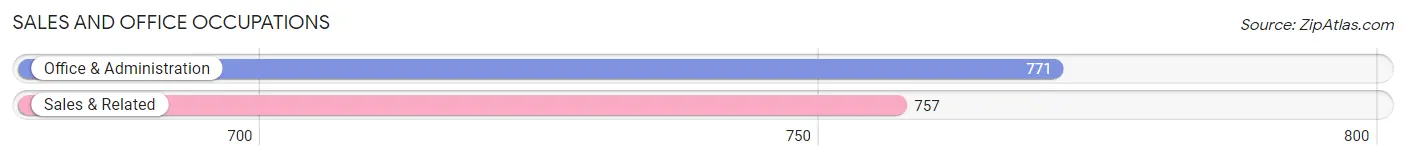
Sales and Office Occupations
The most common Sales and Office occupations in Clarke County are Office & Administration (771 | 10.4%), and Sales & Related (757 | 10.2%).
Sales and Office Occupations by Sex
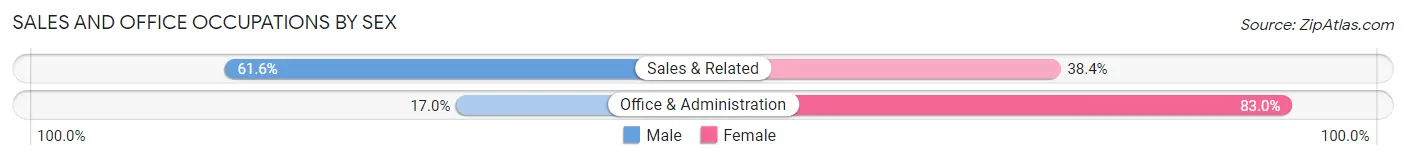
| Occupation | Male | Female |
| Sales & Related | 466 (61.6%) | 291 (38.4%) |
| Office & Administration | 131 (17.0%) | 640 (83.0%) |
| Total (Category) | 597 (39.1%) | 931 (60.9%) |
| Total (Overall) | 3,880 (52.5%) | 3,516 (47.5%) |
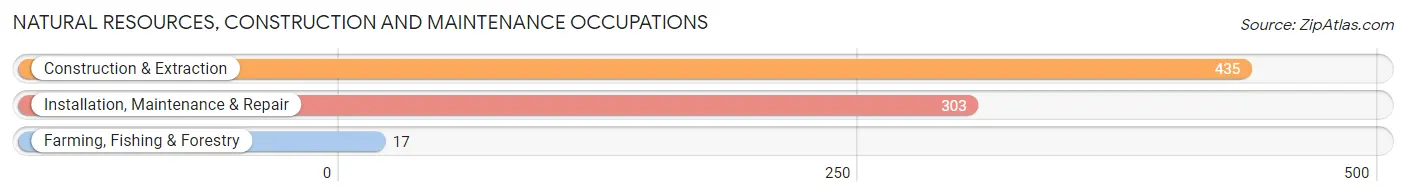
Natural Resources, Construction and Maintenance Occupations
The most common Natural Resources, Construction and Maintenance occupations in Clarke County are Construction & Extraction (435 | 5.9%), Installation, Maintenance & Repair (303 | 4.1%), and Farming, Fishing & Forestry (17 | 0.2%).
Natural Resources, Construction and Maintenance Occupations by Sex
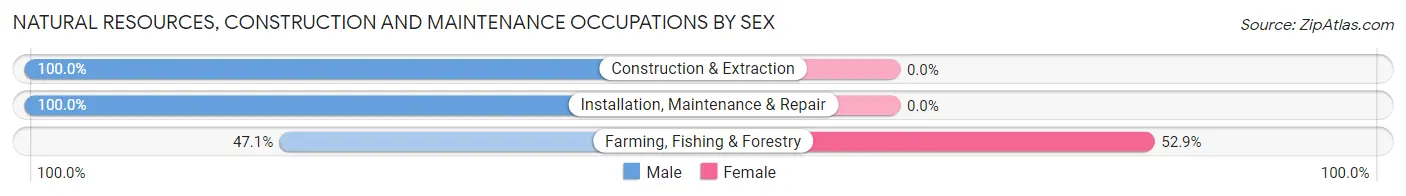
| Occupation | Male | Female |
| Farming, Fishing & Forestry | 8 (47.1%) | 9 (52.9%) |
| Construction & Extraction | 435 (100.0%) | 0 (0.0%) |
| Installation, Maintenance & Repair | 303 (100.0%) | 0 (0.0%) |
| Total (Category) | 746 (98.8%) | 9 (1.2%) |
| Total (Overall) | 3,880 (52.5%) | 3,516 (47.5%) |
Production, Transportation and Moving Occupations
The most common Production, Transportation and Moving occupations in Clarke County are Material Moving (303 | 4.1%), Transportation (214 | 2.9%), and Production (169 | 2.3%).
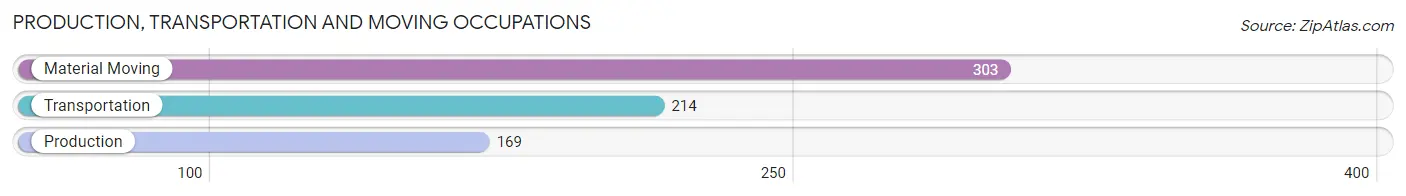
Production, Transportation and Moving Occupations by Sex
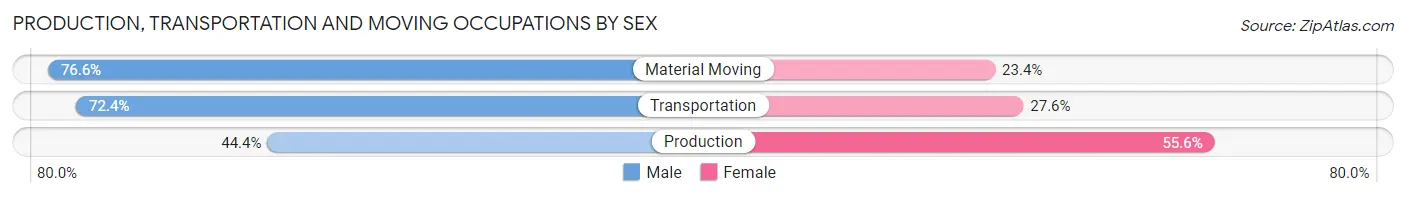
| Occupation | Male | Female |
| Production | 75 (44.4%) | 94 (55.6%) |
| Transportation | 155 (72.4%) | 59 (27.6%) |
| Material Moving | 232 (76.6%) | 71 (23.4%) |
| Total (Category) | 462 (67.3%) | 224 (32.7%) |
| Total (Overall) | 3,880 (52.5%) | 3,516 (47.5%) |
Employment Industries by Sex in Clarke County
Employment Industries in Clarke County
The major employment industries in Clarke County include Retail Trade (907 | 12.3%), Construction (835 | 11.3%), Health Care & Social Assistance (818 | 11.1%), Professional & Scientific (801 | 10.8%), and Educational Services (700 | 9.5%).

Employment Industries by Sex in Clarke County
The Clarke County industries that see more men than women are Mining, Quarrying, & Extraction (100.0%), Arts, Entertainment & Recreation (89.9%), and Construction (86.0%), whereas the industries that tend to have a higher number of women are Utilities (100.0%), Educational Services (82.4%), and Health Care & Social Assistance (78.6%).
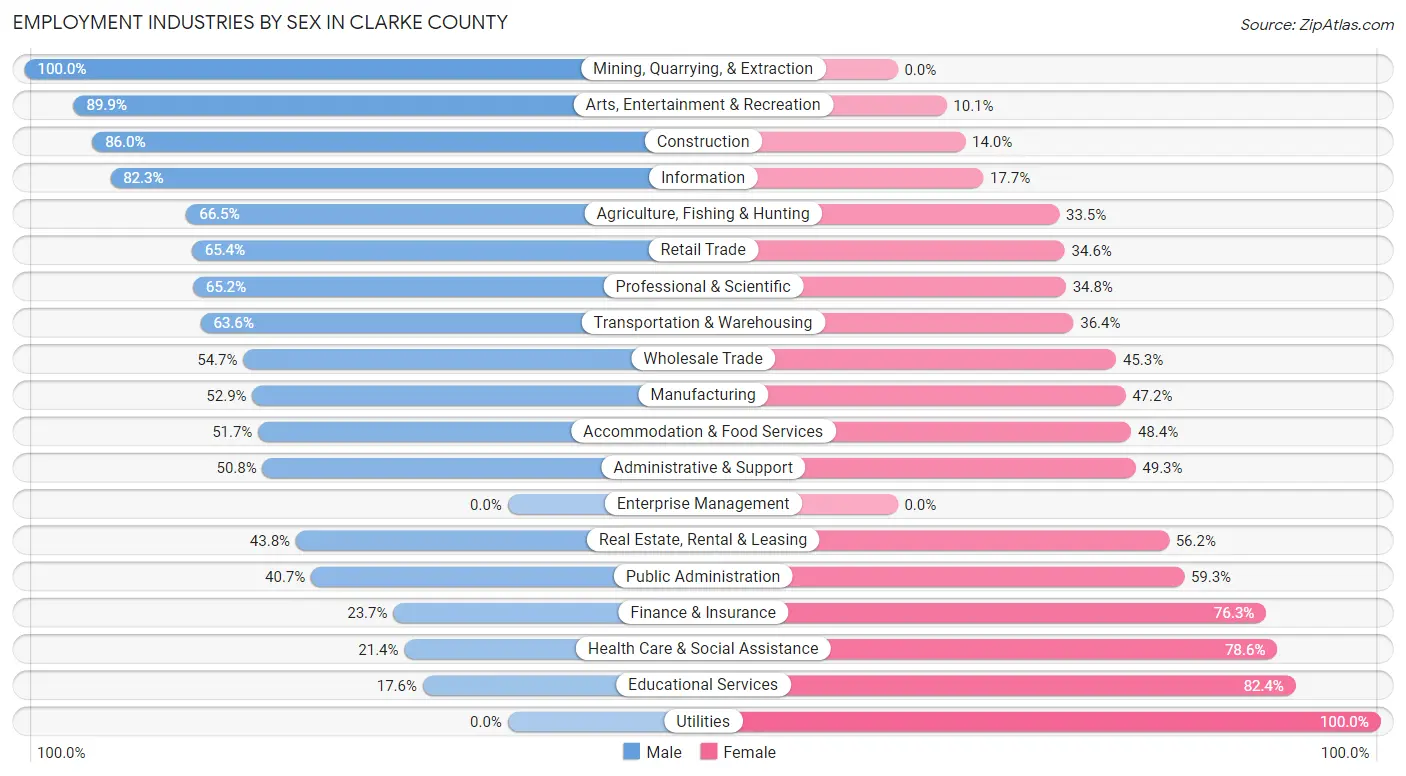
| Industry | Male | Female |
| Agriculture, Fishing & Hunting | 157 (66.5%) | 79 (33.5%) |
| Mining, Quarrying, & Extraction | 21 (100.0%) | 0 (0.0%) |
| Construction | 718 (86.0%) | 117 (14.0%) |
| Manufacturing | 167 (52.8%) | 149 (47.1%) |
| Wholesale Trade | 75 (54.7%) | 62 (45.3%) |
| Retail Trade | 593 (65.4%) | 314 (34.6%) |
| Transportation & Warehousing | 117 (63.6%) | 67 (36.4%) |
| Utilities | 0 (0.0%) | 53 (100.0%) |
| Information | 167 (82.3%) | 36 (17.7%) |
| Finance & Insurance | 45 (23.7%) | 145 (76.3%) |
| Real Estate, Rental & Leasing | 32 (43.8%) | 41 (56.2%) |
| Professional & Scientific | 522 (65.2%) | 279 (34.8%) |
| Enterprise Management | 0 (0.0%) | 0 (0.0%) |
| Administrative & Support | 170 (50.7%) | 165 (49.2%) |
| Educational Services | 123 (17.6%) | 577 (82.4%) |
| Health Care & Social Assistance | 175 (21.4%) | 643 (78.6%) |
| Arts, Entertainment & Recreation | 213 (89.9%) | 24 (10.1%) |
| Accommodation & Food Services | 203 (51.6%) | 190 (48.3%) |
| Public Administration | 282 (40.7%) | 411 (59.3%) |
| Total | 3,880 (52.5%) | 3,516 (47.5%) |
Education in Clarke County
School Enrollment in Clarke County
The most common levels of schooling among the 3,067 students in Clarke County are high school (892 | 29.1%), elementary school (725 | 23.6%), and middle school (575 | 18.8%).
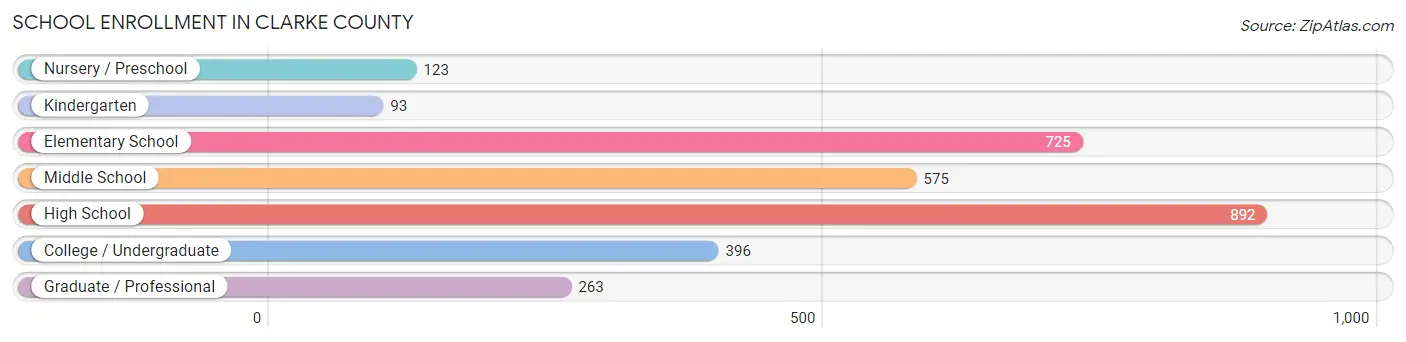
| School Level | # Students | % Students |
| Nursery / Preschool | 123 | 4.0% |
| Kindergarten | 93 | 3.0% |
| Elementary School | 725 | 23.6% |
| Middle School | 575 | 18.8% |
| High School | 892 | 29.1% |
| College / Undergraduate | 396 | 12.9% |
| Graduate / Professional | 263 | 8.6% |
| Total | 3,067 | 100.0% |
School Enrollment by Age by Funding Source in Clarke County
Out of a total of 3,067 students who are enrolled in schools in Clarke County, 540 (17.6%) attend a private institution, while the remaining 2,527 (82.4%) are enrolled in public schools. The age group of 35 years and over has the highest likelihood of being enrolled in private schools, with 110 (80.9% in the age bracket) enrolled. Conversely, the age group of 25 to 34 year olds has the lowest likelihood of being enrolled in a private school, with 151 (100.0% in the age bracket) attending a public institution.
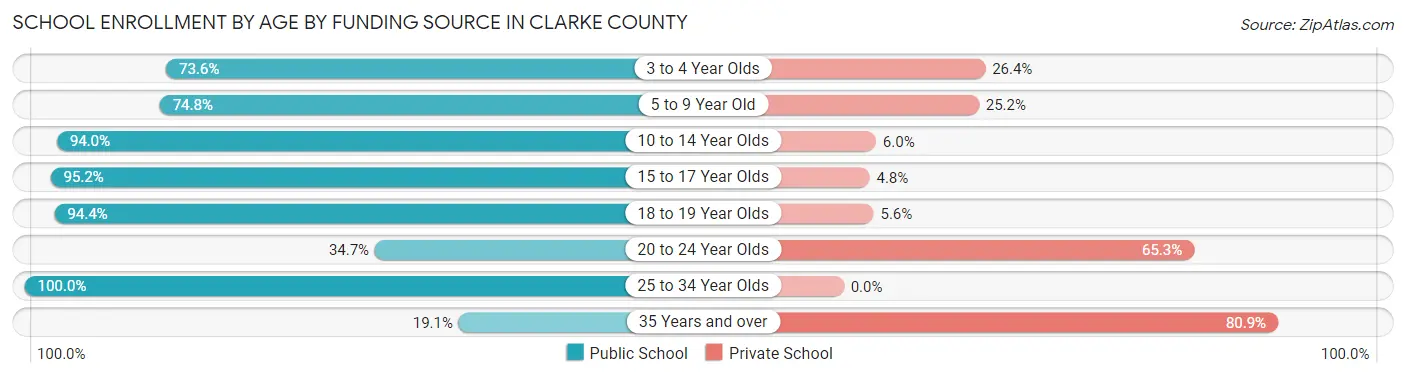
| Age Bracket | Public School | Private School |
| 3 to 4 Year Olds | 81 (73.6%) | 29 (26.4%) |
| 5 to 9 Year Old | 535 (74.8%) | 180 (25.2%) |
| 10 to 14 Year Olds | 784 (94.0%) | 50 (6.0%) |
| 15 to 17 Year Olds | 612 (95.2%) | 31 (4.8%) |
| 18 to 19 Year Olds | 272 (94.4%) | 16 (5.6%) |
| 20 to 24 Year Olds | 66 (34.7%) | 124 (65.3%) |
| 25 to 34 Year Olds | 151 (100.0%) | 0 (0.0%) |
| 35 Years and over | 26 (19.1%) | 110 (80.9%) |
| Total | 2,527 (82.4%) | 540 (17.6%) |
Educational Attainment by Field of Study in Clarke County
Business (781 | 19.3%), education (518 | 12.8%), engineering (462 | 11.4%), science & technology (409 | 10.1%), and bio, nature & agricultural (394 | 9.7%) are the most common fields of study among 4,047 individuals in Clarke County who have obtained a bachelor's degree or higher.
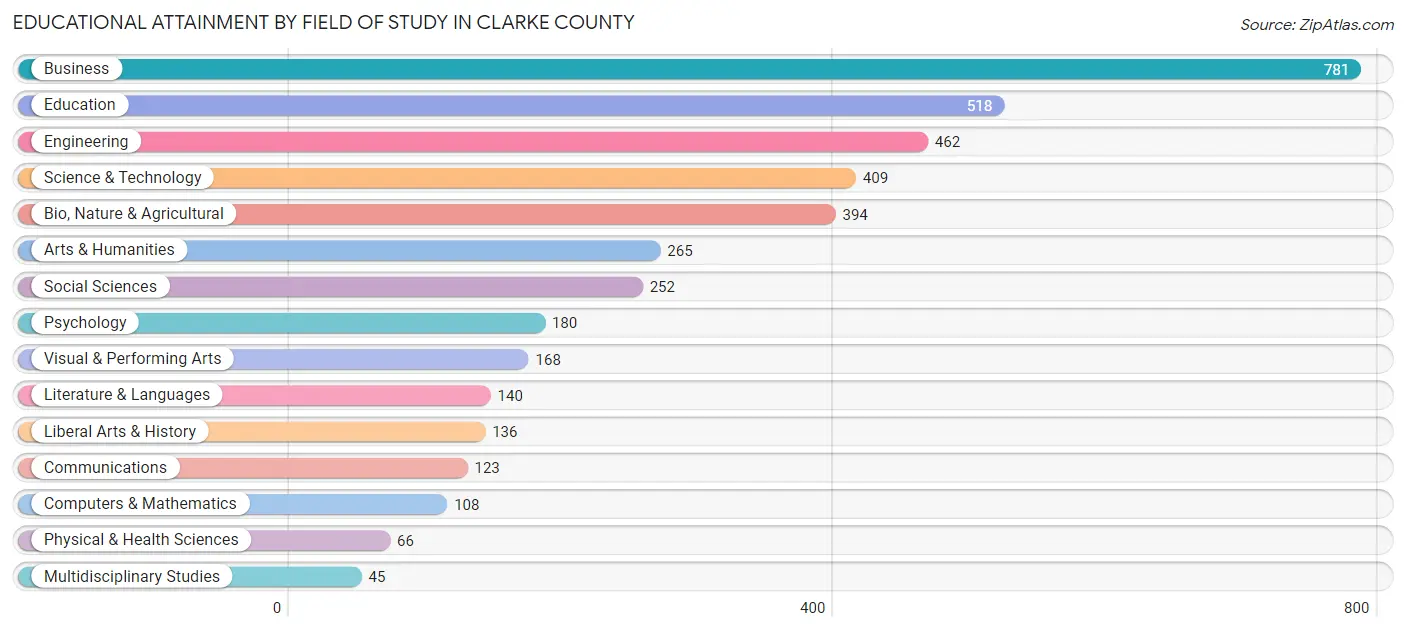
| Field of Study | # Graduates | % Graduates |
| Computers & Mathematics | 108 | 2.7% |
| Bio, Nature & Agricultural | 394 | 9.7% |
| Physical & Health Sciences | 66 | 1.6% |
| Psychology | 180 | 4.4% |
| Social Sciences | 252 | 6.2% |
| Engineering | 462 | 11.4% |
| Multidisciplinary Studies | 45 | 1.1% |
| Science & Technology | 409 | 10.1% |
| Business | 781 | 19.3% |
| Education | 518 | 12.8% |
| Literature & Languages | 140 | 3.5% |
| Liberal Arts & History | 136 | 3.4% |
| Visual & Performing Arts | 168 | 4.2% |
| Communications | 123 | 3.0% |
| Arts & Humanities | 265 | 6.6% |
| Total | 4,047 | 100.0% |
Transportation & Commute in Clarke County
Vehicle Availability by Sex in Clarke County
The most prevalent vehicle ownership categories in Clarke County are males with 2 vehicles (1,349, accounting for 34.3%) and females with 2 vehicles (1,243, making up 38.8%).
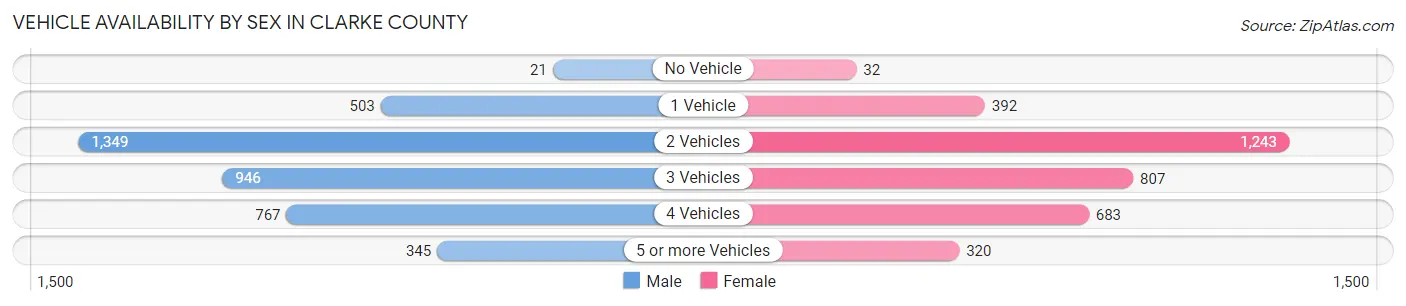
| Vehicles Available | Male | Female |
| No Vehicle | 21 (0.5%) | 32 (0.9%) |
| 1 Vehicle | 503 (12.8%) | 392 (11.3%) |
| 2 Vehicles | 1,349 (34.3%) | 1,243 (35.7%) |
| 3 Vehicles | 946 (24.1%) | 807 (23.2%) |
| 4 Vehicles | 767 (19.5%) | 683 (19.6%) |
| 5 or more Vehicles | 345 (8.8%) | 320 (9.2%) |
| Total | 3,931 (100.0%) | 3,477 (100.0%) |
Commute Time in Clarke County
The most frequently occuring commute durations in Clarke County are 60 to 89 minutes (972 commuters, 15.3%), 45 to 59 minutes (924 commuters, 14.6%), and 30 to 34 minutes (923 commuters, 14.5%).
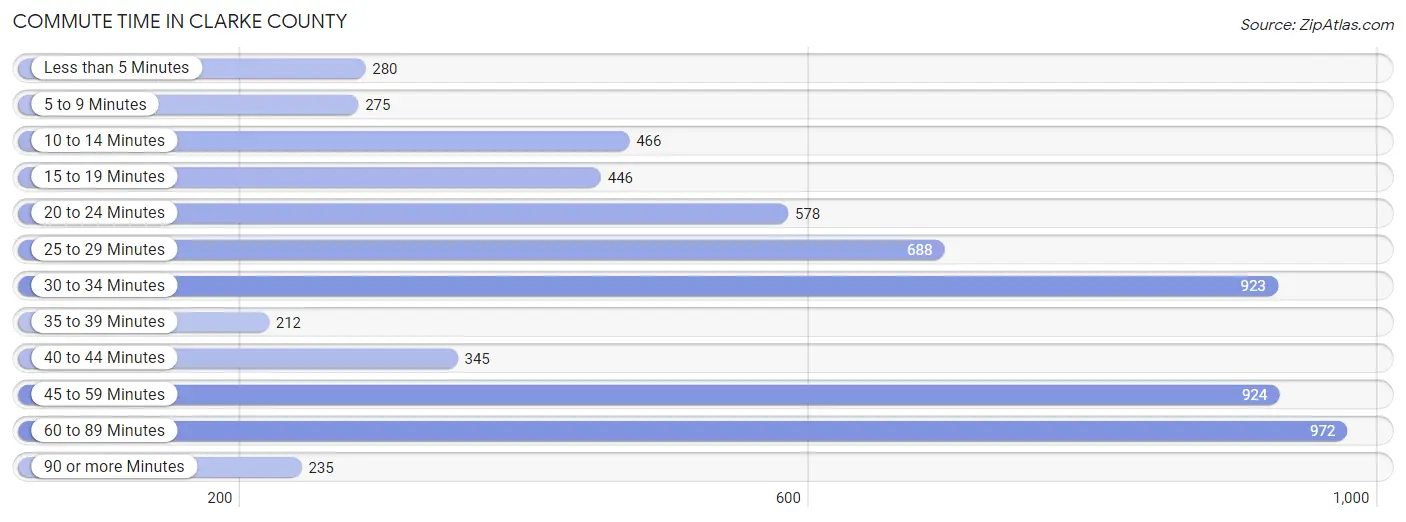
| Commute Time | # Commuters | % Commuters |
| Less than 5 Minutes | 280 | 4.4% |
| 5 to 9 Minutes | 275 | 4.3% |
| 10 to 14 Minutes | 466 | 7.3% |
| 15 to 19 Minutes | 446 | 7.0% |
| 20 to 24 Minutes | 578 | 9.1% |
| 25 to 29 Minutes | 688 | 10.8% |
| 30 to 34 Minutes | 923 | 14.5% |
| 35 to 39 Minutes | 212 | 3.3% |
| 40 to 44 Minutes | 345 | 5.4% |
| 45 to 59 Minutes | 924 | 14.6% |
| 60 to 89 Minutes | 972 | 15.3% |
| 90 or more Minutes | 235 | 3.7% |
Commute Time by Sex in Clarke County
The most common commute times in Clarke County are 60 to 89 minutes (641 commuters, 19.3%) for males and 45 to 59 minutes (432 commuters, 14.3%) for females.
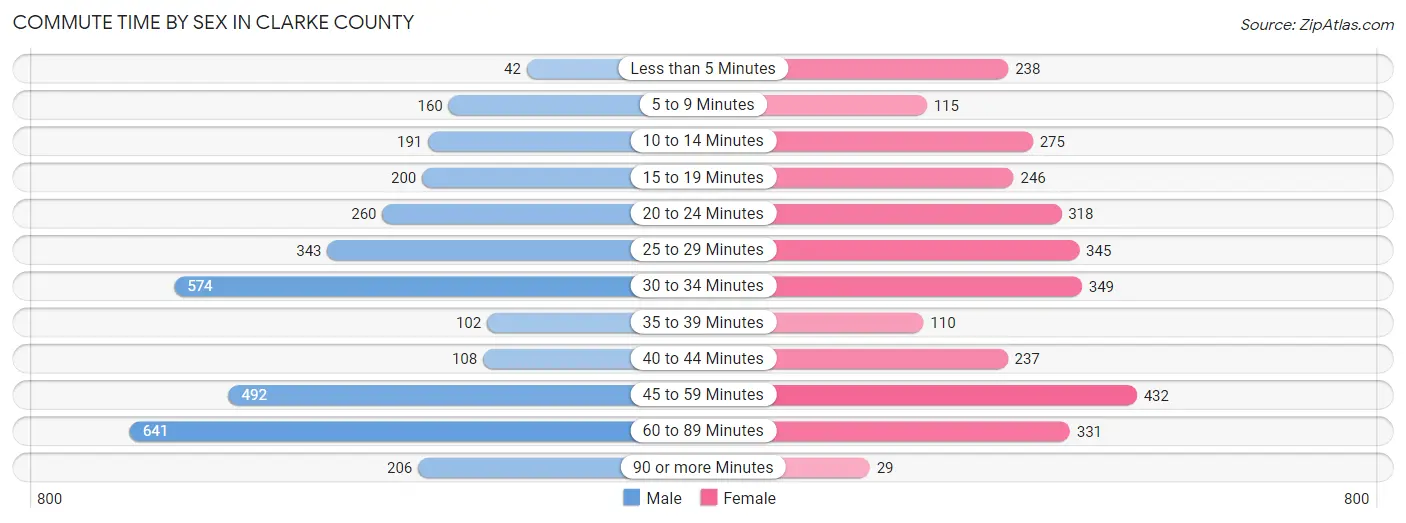
| Commute Time | Male | Female |
| Less than 5 Minutes | 42 (1.3%) | 238 (7.9%) |
| 5 to 9 Minutes | 160 (4.8%) | 115 (3.8%) |
| 10 to 14 Minutes | 191 (5.8%) | 275 (9.1%) |
| 15 to 19 Minutes | 200 (6.0%) | 246 (8.1%) |
| 20 to 24 Minutes | 260 (7.8%) | 318 (10.5%) |
| 25 to 29 Minutes | 343 (10.3%) | 345 (11.4%) |
| 30 to 34 Minutes | 574 (17.3%) | 349 (11.5%) |
| 35 to 39 Minutes | 102 (3.1%) | 110 (3.6%) |
| 40 to 44 Minutes | 108 (3.3%) | 237 (7.8%) |
| 45 to 59 Minutes | 492 (14.8%) | 432 (14.3%) |
| 60 to 89 Minutes | 641 (19.3%) | 331 (10.9%) |
| 90 or more Minutes | 206 (6.2%) | 29 (1.0%) |
Time of Departure to Work by Sex in Clarke County
The most frequent times of departure to work in Clarke County are 7:00 AM to 7:29 AM (429, 12.9%) for males and 6:30 AM to 6:59 AM (581, 19.2%) for females.
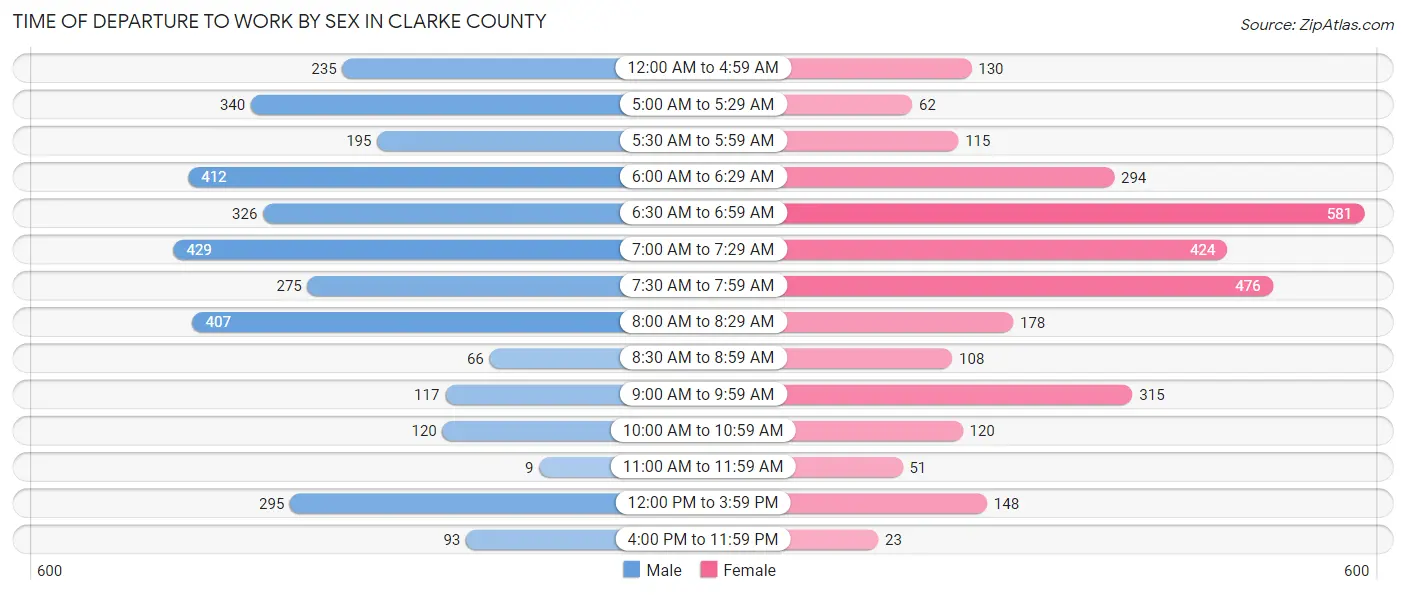
| Time of Departure | Male | Female |
| 12:00 AM to 4:59 AM | 235 (7.1%) | 130 (4.3%) |
| 5:00 AM to 5:29 AM | 340 (10.2%) | 62 (2.1%) |
| 5:30 AM to 5:59 AM | 195 (5.9%) | 115 (3.8%) |
| 6:00 AM to 6:29 AM | 412 (12.4%) | 294 (9.7%) |
| 6:30 AM to 6:59 AM | 326 (9.8%) | 581 (19.2%) |
| 7:00 AM to 7:29 AM | 429 (12.9%) | 424 (14.0%) |
| 7:30 AM to 7:59 AM | 275 (8.3%) | 476 (15.7%) |
| 8:00 AM to 8:29 AM | 407 (12.3%) | 178 (5.9%) |
| 8:30 AM to 8:59 AM | 66 (2.0%) | 108 (3.6%) |
| 9:00 AM to 9:59 AM | 117 (3.5%) | 315 (10.4%) |
| 10:00 AM to 10:59 AM | 120 (3.6%) | 120 (4.0%) |
| 11:00 AM to 11:59 AM | 9 (0.3%) | 51 (1.7%) |
| 12:00 PM to 3:59 PM | 295 (8.9%) | 148 (4.9%) |
| 4:00 PM to 11:59 PM | 93 (2.8%) | 23 (0.8%) |
| Total | 3,319 (100.0%) | 3,025 (100.0%) |
Housing Occupancy in Clarke County
Occupancy by Ownership in Clarke County
Of the total 5,617 dwellings in Clarke County, owner-occupied units account for 4,376 (77.9%), while renter-occupied units make up 1,241 (22.1%).
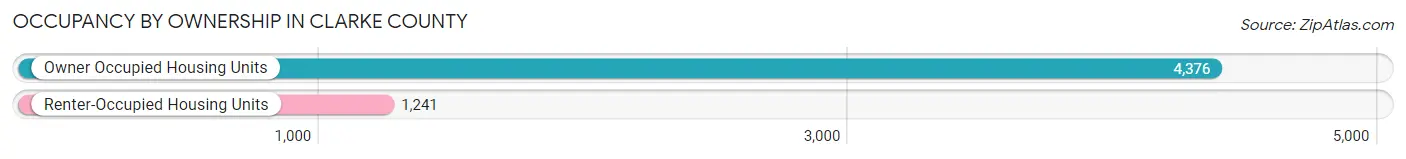
| Occupancy | # Housing Units | % Housing Units |
| Owner Occupied Housing Units | 4,376 | 77.9% |
| Renter-Occupied Housing Units | 1,241 | 22.1% |
| Total Occupied Housing Units | 5,617 | 100.0% |
Occupancy by Household Size in Clarke County
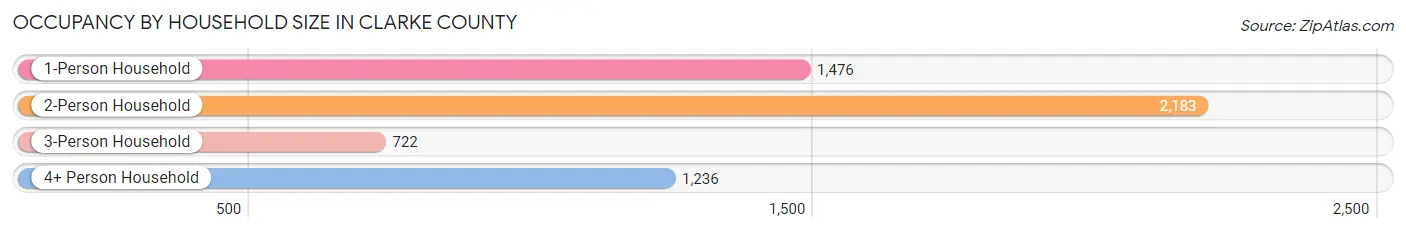
| Household Size | # Housing Units | % Housing Units |
| 1-Person Household | 1,476 | 26.3% |
| 2-Person Household | 2,183 | 38.9% |
| 3-Person Household | 722 | 12.9% |
| 4+ Person Household | 1,236 | 22.0% |
| Total Housing Units | 5,617 | 100.0% |
Occupancy by Ownership by Household Size in Clarke County
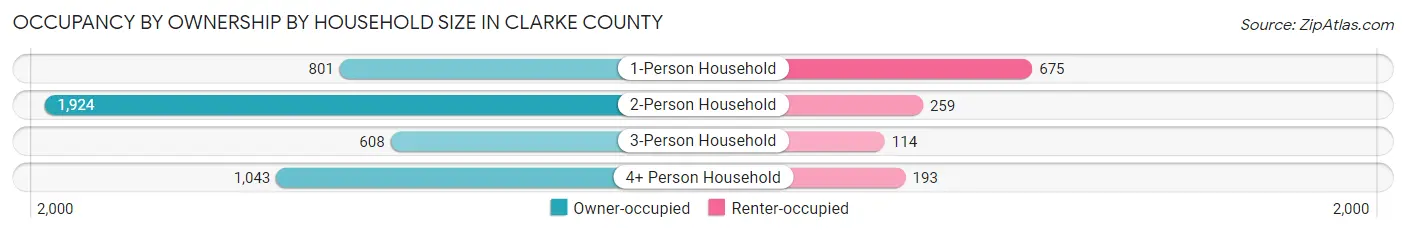
| Household Size | Owner-occupied | Renter-occupied |
| 1-Person Household | 801 (54.3%) | 675 (45.7%) |
| 2-Person Household | 1,924 (88.1%) | 259 (11.9%) |
| 3-Person Household | 608 (84.2%) | 114 (15.8%) |
| 4+ Person Household | 1,043 (84.4%) | 193 (15.6%) |
| Total Housing Units | 4,376 (77.9%) | 1,241 (22.1%) |
Occupancy by Educational Attainment in Clarke County
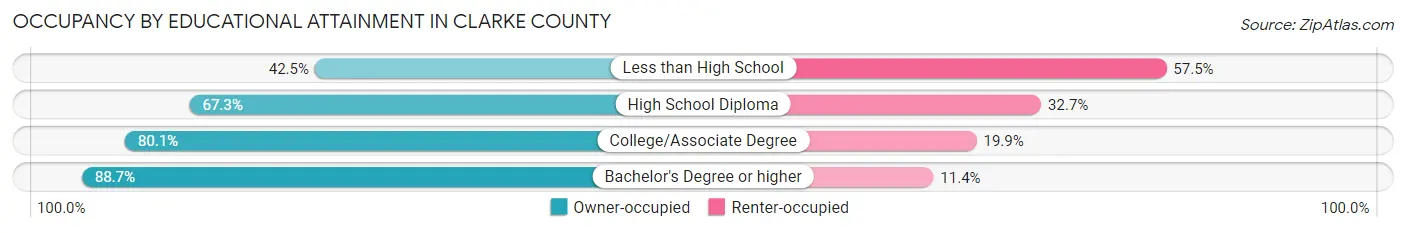
| Household Size | Owner-occupied | Renter-occupied |
| Less than High School | 138 (42.5%) | 187 (57.5%) |
| High School Diploma | 930 (67.3%) | 452 (32.7%) |
| College/Associate Degree | 1,481 (80.1%) | 368 (19.9%) |
| Bachelor's Degree or higher | 1,827 (88.6%) | 234 (11.4%) |
Occupancy by Age of Householder in Clarke County
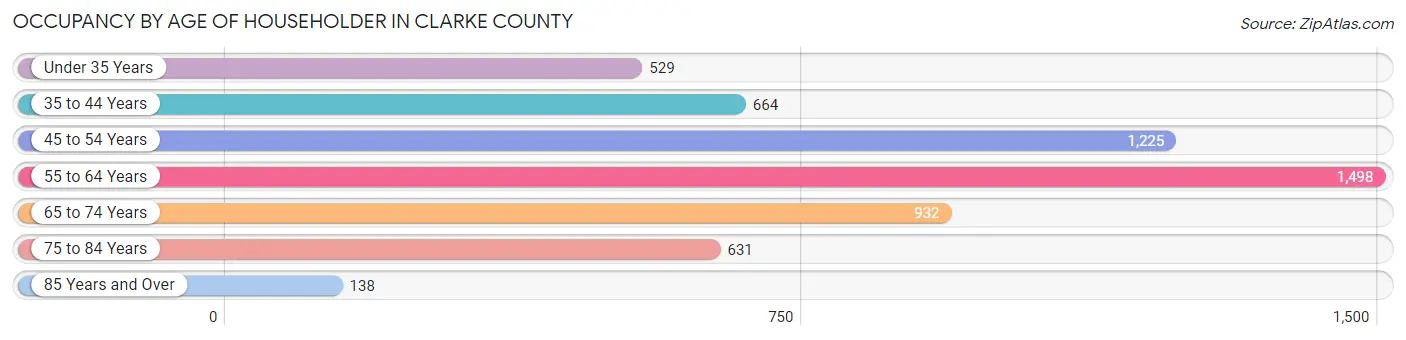
| Age Bracket | # Households | % Households |
| Under 35 Years | 529 | 9.4% |
| 35 to 44 Years | 664 | 11.8% |
| 45 to 54 Years | 1,225 | 21.8% |
| 55 to 64 Years | 1,498 | 26.7% |
| 65 to 74 Years | 932 | 16.6% |
| 75 to 84 Years | 631 | 11.2% |
| 85 Years and Over | 138 | 2.5% |
| Total | 5,617 | 100.0% |
Housing Finances in Clarke County
Median Income by Occupancy in Clarke County
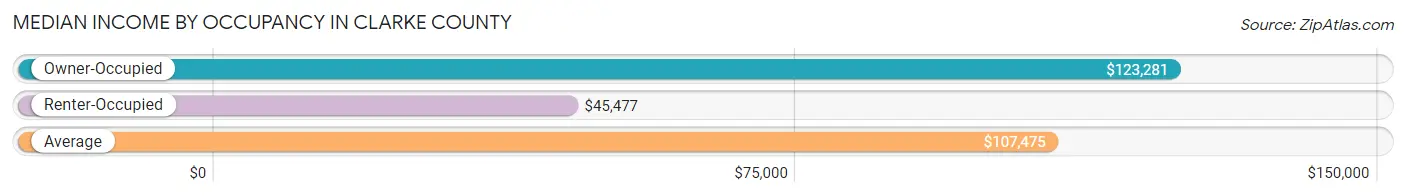
| Occupancy Type | # Households | Median Income |
| Owner-Occupied | 4,376 (77.9%) | $123,281 |
| Renter-Occupied | 1,241 (22.1%) | $45,477 |
| Average | 5,617 (100.0%) | $107,475 |
Occupancy by Householder Income Bracket in Clarke County
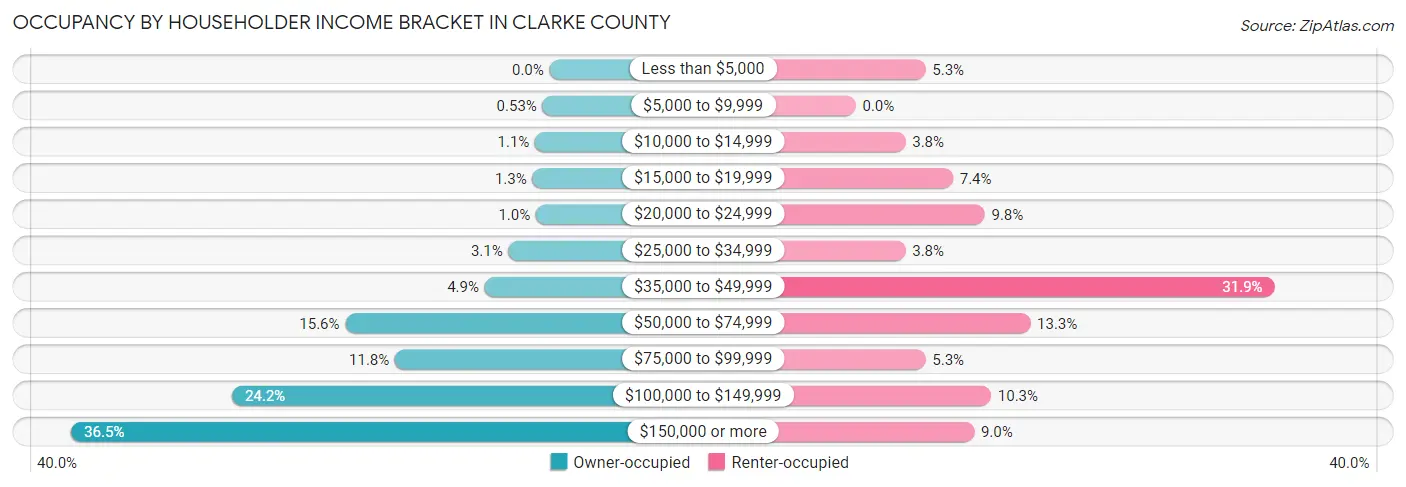
| Income Bracket | Owner-occupied | Renter-occupied |
| Less than $5,000 | 0 (0.0%) | 66 (5.3%) |
| $5,000 to $9,999 | 23 (0.5%) | 0 (0.0%) |
| $10,000 to $14,999 | 48 (1.1%) | 47 (3.8%) |
| $15,000 to $19,999 | 57 (1.3%) | 92 (7.4%) |
| $20,000 to $24,999 | 45 (1.0%) | 122 (9.8%) |
| $25,000 to $34,999 | 137 (3.1%) | 47 (3.8%) |
| $35,000 to $49,999 | 216 (4.9%) | 396 (31.9%) |
| $50,000 to $74,999 | 681 (15.6%) | 165 (13.3%) |
| $75,000 to $99,999 | 515 (11.8%) | 66 (5.3%) |
| $100,000 to $149,999 | 1,059 (24.2%) | 128 (10.3%) |
| $150,000 or more | 1,595 (36.4%) | 112 (9.0%) |
| Total | 4,376 (100.0%) | 1,241 (100.0%) |
Monthly Housing Cost Tiers in Clarke County
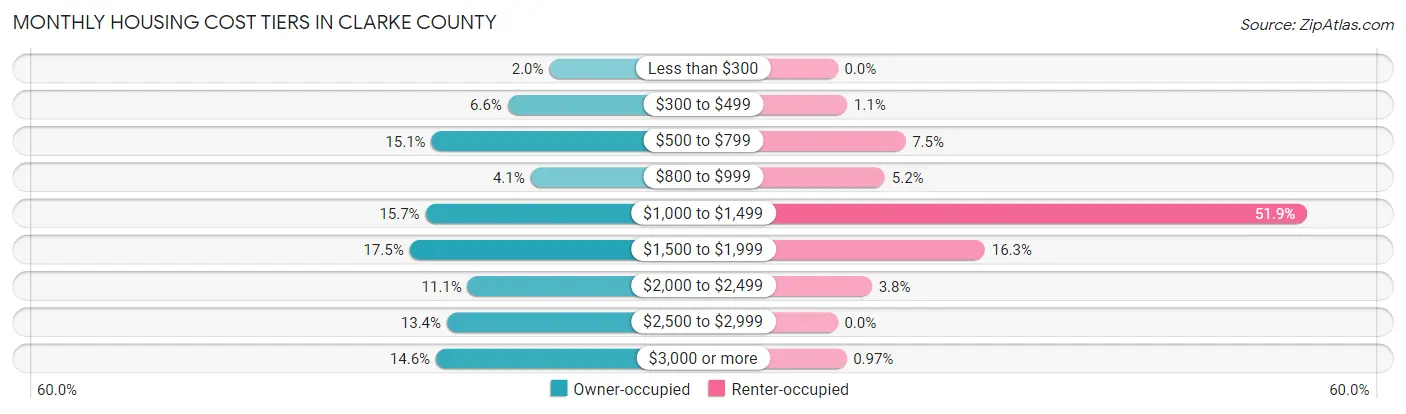
| Monthly Cost | Owner-occupied | Renter-occupied |
| Less than $300 | 89 (2.0%) | 0 (0.0%) |
| $300 to $499 | 290 (6.6%) | 13 (1.1%) |
| $500 to $799 | 659 (15.1%) | 93 (7.5%) |
| $800 to $999 | 180 (4.1%) | 65 (5.2%) |
| $1,000 to $1,499 | 688 (15.7%) | 644 (51.9%) |
| $1,500 to $1,999 | 765 (17.5%) | 202 (16.3%) |
| $2,000 to $2,499 | 484 (11.1%) | 47 (3.8%) |
| $2,500 to $2,999 | 584 (13.4%) | 0 (0.0%) |
| $3,000 or more | 637 (14.6%) | 12 (1.0%) |
| Total | 4,376 (100.0%) | 1,241 (100.0%) |
Physical Housing Characteristics in Clarke County
Housing Structures in Clarke County
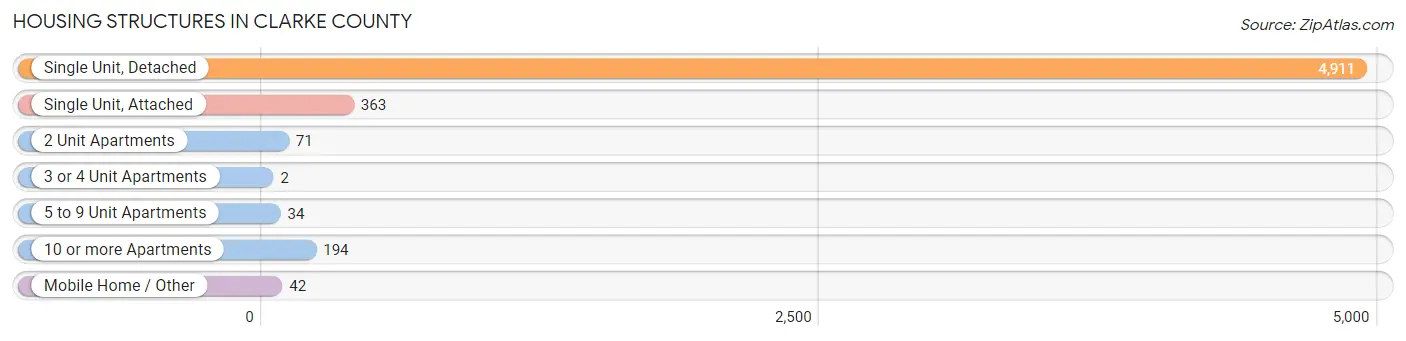
| Structure Type | # Housing Units | % Housing Units |
| Single Unit, Detached | 4,911 | 87.4% |
| Single Unit, Attached | 363 | 6.5% |
| 2 Unit Apartments | 71 | 1.3% |
| 3 or 4 Unit Apartments | 2 | 0.0% |
| 5 to 9 Unit Apartments | 34 | 0.6% |
| 10 or more Apartments | 194 | 3.5% |
| Mobile Home / Other | 42 | 0.7% |
| Total | 5,617 | 100.0% |
Housing Structures by Occupancy in Clarke County
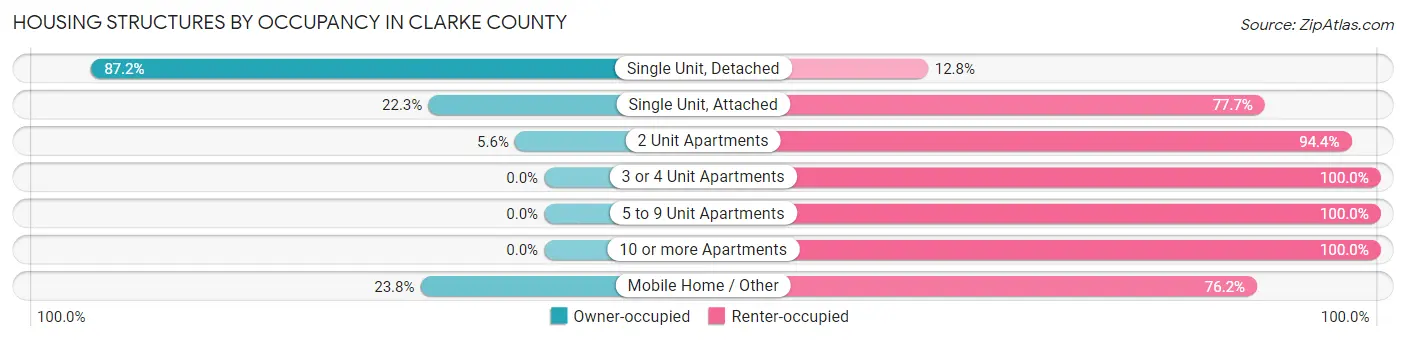
| Structure Type | Owner-occupied | Renter-occupied |
| Single Unit, Detached | 4,281 (87.2%) | 630 (12.8%) |
| Single Unit, Attached | 81 (22.3%) | 282 (77.7%) |
| 2 Unit Apartments | 4 (5.6%) | 67 (94.4%) |
| 3 or 4 Unit Apartments | 0 (0.0%) | 2 (100.0%) |
| 5 to 9 Unit Apartments | 0 (0.0%) | 34 (100.0%) |
| 10 or more Apartments | 0 (0.0%) | 194 (100.0%) |
| Mobile Home / Other | 10 (23.8%) | 32 (76.2%) |
| Total | 4,376 (77.9%) | 1,241 (22.1%) |
Housing Structures by Number of Rooms in Clarke County
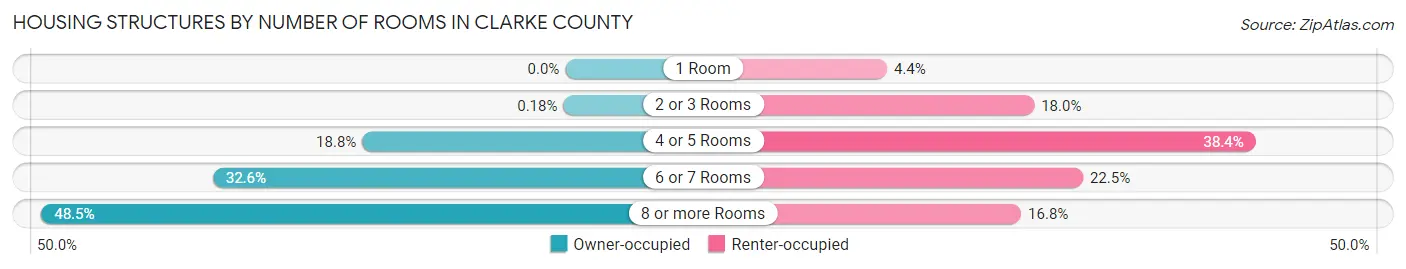
| Number of Rooms | Owner-occupied | Renter-occupied |
| 1 Room | 0 (0.0%) | 54 (4.3%) |
| 2 or 3 Rooms | 8 (0.2%) | 223 (18.0%) |
| 4 or 5 Rooms | 822 (18.8%) | 477 (38.4%) |
| 6 or 7 Rooms | 1,426 (32.6%) | 279 (22.5%) |
| 8 or more Rooms | 2,120 (48.4%) | 208 (16.8%) |
| Total | 4,376 (100.0%) | 1,241 (100.0%) |
Housing Structure by Heating Type in Clarke County
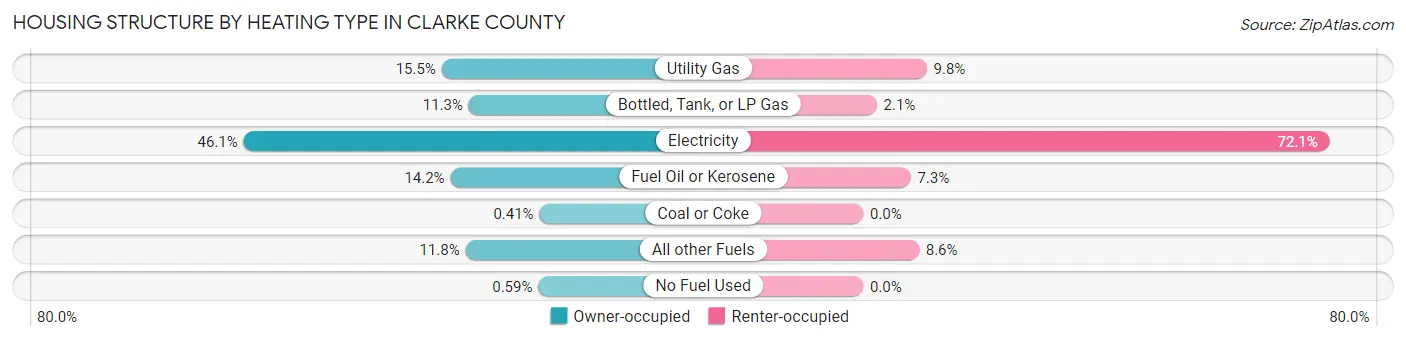
| Heating Type | Owner-occupied | Renter-occupied |
| Utility Gas | 679 (15.5%) | 122 (9.8%) |
| Bottled, Tank, or LP Gas | 496 (11.3%) | 26 (2.1%) |
| Electricity | 2,019 (46.1%) | 895 (72.1%) |
| Fuel Oil or Kerosene | 620 (14.2%) | 91 (7.3%) |
| Coal or Coke | 18 (0.4%) | 0 (0.0%) |
| All other Fuels | 518 (11.8%) | 107 (8.6%) |
| No Fuel Used | 26 (0.6%) | 0 (0.0%) |
| Total | 4,376 (100.0%) | 1,241 (100.0%) |
Household Vehicle Usage in Clarke County
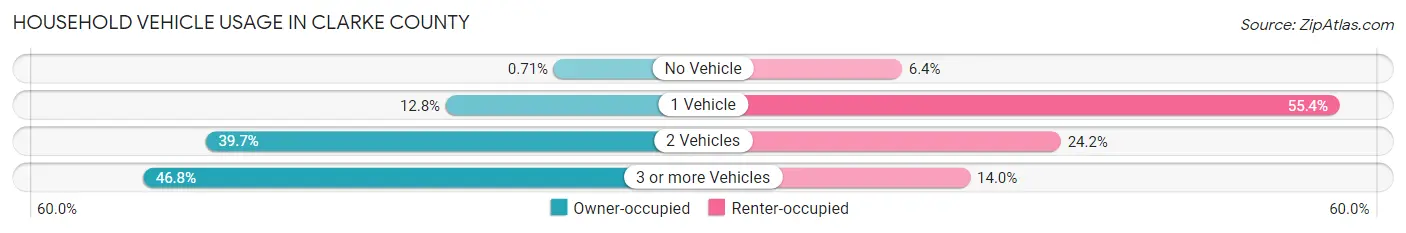
| Vehicles per Household | Owner-occupied | Renter-occupied |
| No Vehicle | 31 (0.7%) | 79 (6.4%) |
| 1 Vehicle | 560 (12.8%) | 688 (55.4%) |
| 2 Vehicles | 1,739 (39.7%) | 300 (24.2%) |
| 3 or more Vehicles | 2,046 (46.8%) | 174 (14.0%) |
| Total | 4,376 (100.0%) | 1,241 (100.0%) |
Real Estate & Mortgages in Clarke County
Real Estate and Mortgage Overview in Clarke County
| Characteristic | Without Mortgage | With Mortgage |
| Housing Units | 1,216 | 3,160 |
| Median Property Value | $441,000 | $515,000 |
| Median Household Income | $77,778 | $1,287 |
| Monthly Housing Costs | $589 | $637 |
| Real Estate Taxes | $2,585 | $15 |
Property Value by Mortgage Status in Clarke County
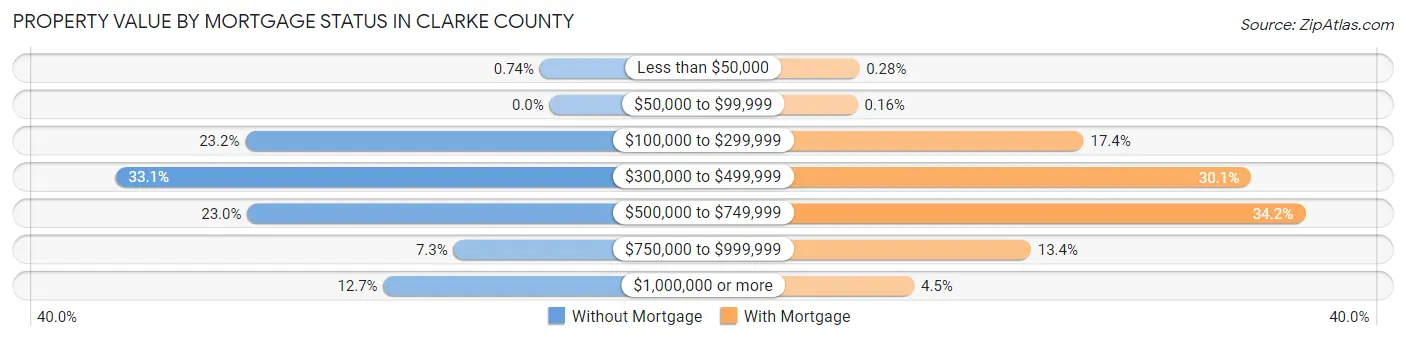
| Property Value | Without Mortgage | With Mortgage |
| Less than $50,000 | 9 (0.7%) | 9 (0.3%) |
| $50,000 to $99,999 | 0 (0.0%) | 5 (0.2%) |
| $100,000 to $299,999 | 282 (23.2%) | 549 (17.4%) |
| $300,000 to $499,999 | 402 (33.1%) | 952 (30.1%) |
| $500,000 to $749,999 | 280 (23.0%) | 1,082 (34.2%) |
| $750,000 to $999,999 | 89 (7.3%) | 422 (13.4%) |
| $1,000,000 or more | 154 (12.7%) | 141 (4.5%) |
| Total | 1,216 (100.0%) | 3,160 (100.0%) |
Household Income by Mortgage Status in Clarke County
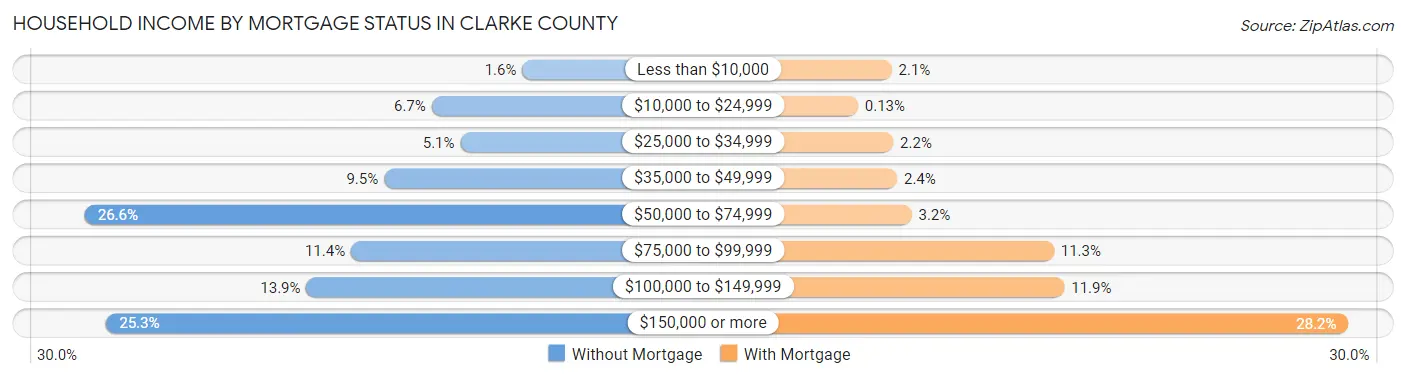
| Household Income | Without Mortgage | With Mortgage |
| Less than $10,000 | 19 (1.6%) | 65 (2.1%) |
| $10,000 to $24,999 | 82 (6.7%) | 4 (0.1%) |
| $25,000 to $34,999 | 62 (5.1%) | 68 (2.1%) |
| $35,000 to $49,999 | 115 (9.5%) | 75 (2.4%) |
| $50,000 to $74,999 | 323 (26.6%) | 101 (3.2%) |
| $75,000 to $99,999 | 138 (11.4%) | 358 (11.3%) |
| $100,000 to $149,999 | 169 (13.9%) | 377 (11.9%) |
| $150,000 or more | 308 (25.3%) | 890 (28.2%) |
| Total | 1,216 (100.0%) | 3,160 (100.0%) |
Property Value to Household Income Ratio in Clarke County
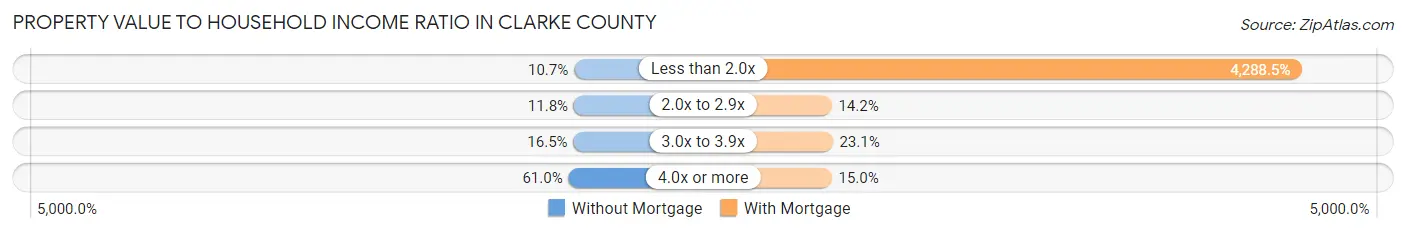
| Value-to-Income Ratio | Without Mortgage | With Mortgage |
| Less than 2.0x | 130 (10.7%) | 135,516 (4,288.5%) |
| 2.0x to 2.9x | 143 (11.8%) | 449 (14.2%) |
| 3.0x to 3.9x | 201 (16.5%) | 731 (23.1%) |
| 4.0x or more | 742 (61.0%) | 475 (15.0%) |
| Total | 1,216 (100.0%) | 3,160 (100.0%) |
Real Estate Taxes by Mortgage Status in Clarke County
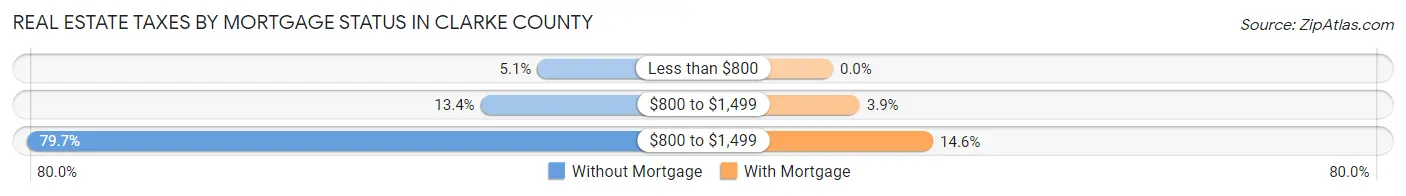
| Property Taxes | Without Mortgage | With Mortgage |
| Less than $800 | 62 (5.1%) | 0 (0.0%) |
| $800 to $1,499 | 163 (13.4%) | 124 (3.9%) |
| $800 to $1,499 | 969 (79.7%) | 462 (14.6%) |
| Total | 1,216 (100.0%) | 3,160 (100.0%) |
Health & Disability in Clarke County
Health Insurance Coverage by Age in Clarke County
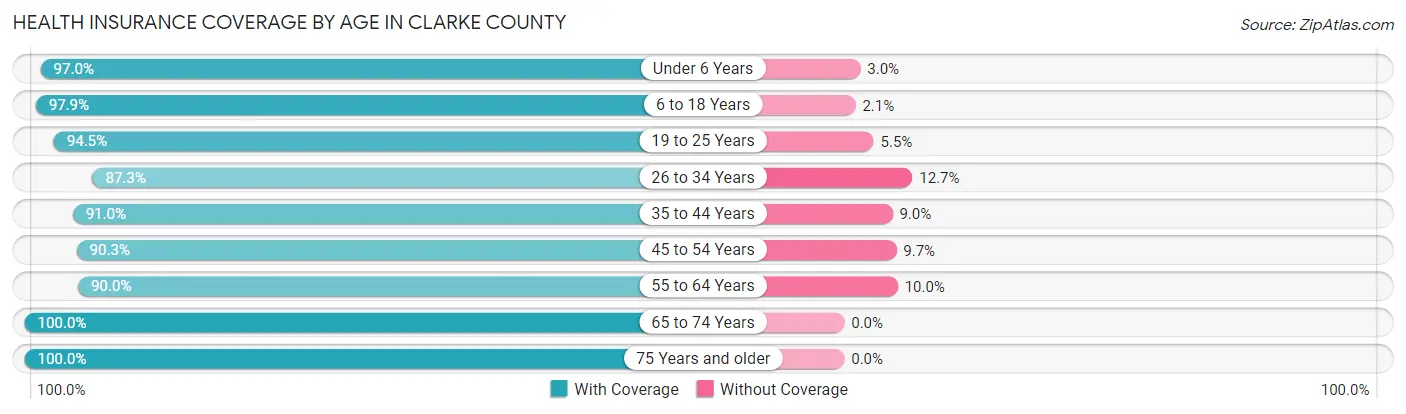
| Age Bracket | With Coverage | Without Coverage |
| Under 6 Years | 615 (97.0%) | 19 (3.0%) |
| 6 to 18 Years | 2,392 (97.9%) | 51 (2.1%) |
| 19 to 25 Years | 969 (94.5%) | 56 (5.5%) |
| 26 to 34 Years | 971 (87.3%) | 141 (12.7%) |
| 35 to 44 Years | 1,359 (91.0%) | 134 (9.0%) |
| 45 to 54 Years | 1,984 (90.3%) | 213 (9.7%) |
| 55 to 64 Years | 2,342 (90.0%) | 259 (10.0%) |
| 65 to 74 Years | 1,825 (100.0%) | 0 (0.0%) |
| 75 Years and older | 1,270 (100.0%) | 0 (0.0%) |
| Total | 13,727 (94.0%) | 873 (6.0%) |
Health Insurance Coverage by Citizenship Status in Clarke County
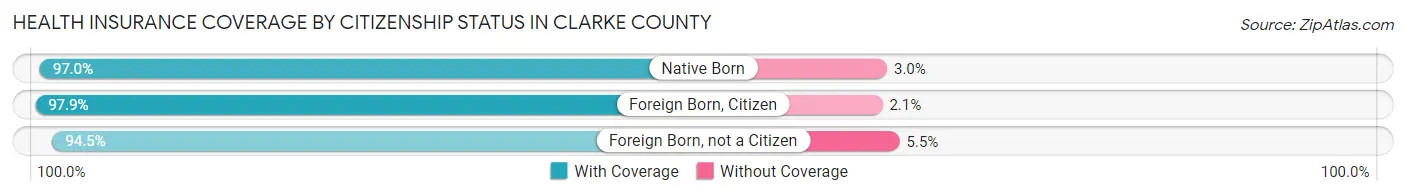
| Citizenship Status | With Coverage | Without Coverage |
| Native Born | 615 (97.0%) | 19 (3.0%) |
| Foreign Born, Citizen | 2,392 (97.9%) | 51 (2.1%) |
| Foreign Born, not a Citizen | 969 (94.5%) | 56 (5.5%) |
Health Insurance Coverage by Household Income in Clarke County
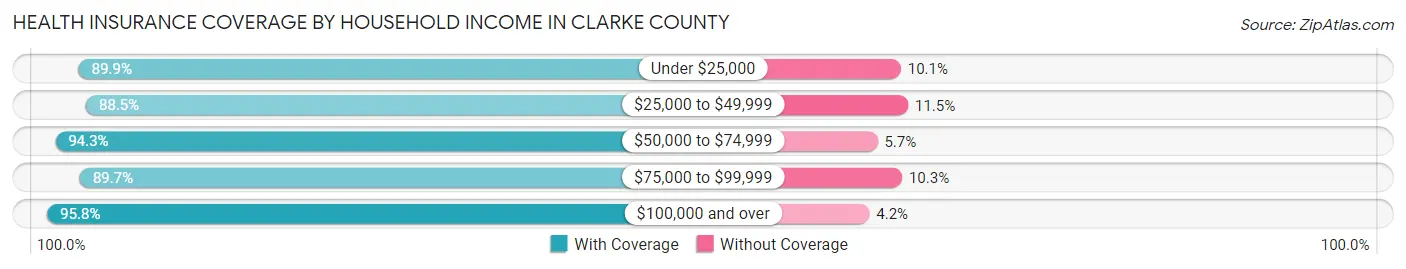
| Household Income | With Coverage | Without Coverage |
| Under $25,000 | 675 (89.9%) | 76 (10.1%) |
| $25,000 to $49,999 | 1,064 (88.5%) | 138 (11.5%) |
| $50,000 to $74,999 | 1,627 (94.3%) | 99 (5.7%) |
| $75,000 to $99,999 | 1,379 (89.7%) | 159 (10.3%) |
| $100,000 and over | 8,963 (95.8%) | 395 (4.2%) |
Public vs Private Health Insurance Coverage by Age in Clarke County
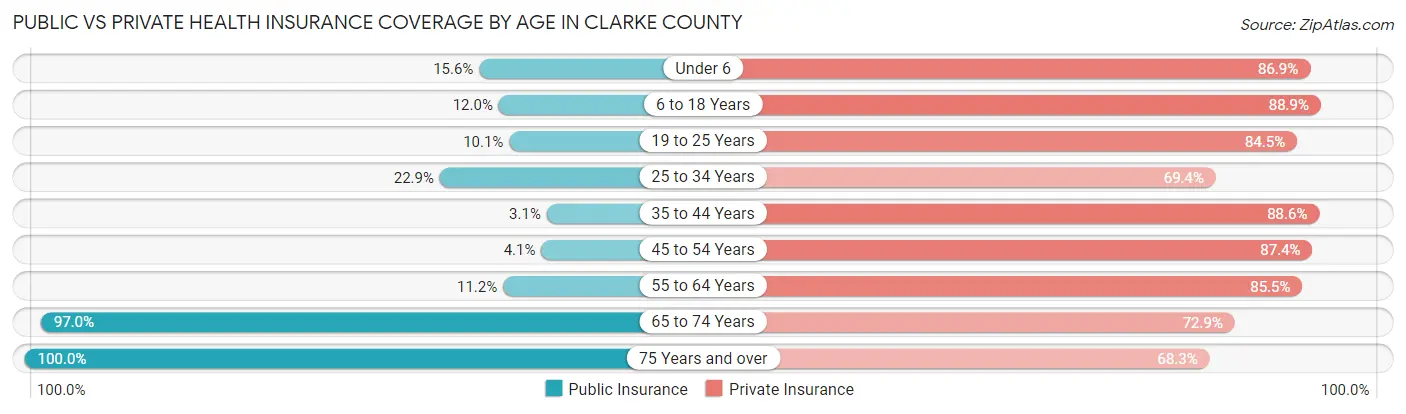
| Age Bracket | Public Insurance | Private Insurance |
| Under 6 | 99 (15.6%) | 551 (86.9%) |
| 6 to 18 Years | 293 (12.0%) | 2,172 (88.9%) |
| 19 to 25 Years | 103 (10.1%) | 866 (84.5%) |
| 25 to 34 Years | 255 (22.9%) | 772 (69.4%) |
| 35 to 44 Years | 46 (3.1%) | 1,323 (88.6%) |
| 45 to 54 Years | 90 (4.1%) | 1,919 (87.4%) |
| 55 to 64 Years | 291 (11.2%) | 2,223 (85.5%) |
| 65 to 74 Years | 1,770 (97.0%) | 1,331 (72.9%) |
| 75 Years and over | 1,270 (100.0%) | 867 (68.3%) |
| Total | 4,217 (28.9%) | 12,024 (82.4%) |
Disability Status by Sex by Age in Clarke County
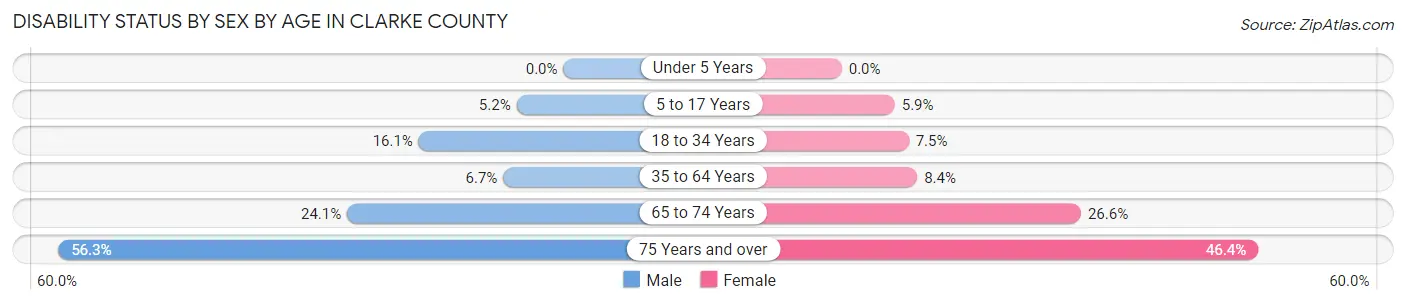
| Age Bracket | Male | Female |
| Under 5 Years | 0 (0.0%) | 0 (0.0%) |
| 5 to 17 Years | 57 (5.2%) | 69 (5.9%) |
| 18 to 34 Years | 193 (16.1%) | 91 (7.4%) |
| 35 to 64 Years | 210 (6.7%) | 265 (8.4%) |
| 65 to 74 Years | 219 (24.1%) | 244 (26.6%) |
| 75 Years and over | 297 (56.2%) | 344 (46.4%) |
Disability Class by Sex by Age in Clarke County
Disability Class: Hearing Difficulty
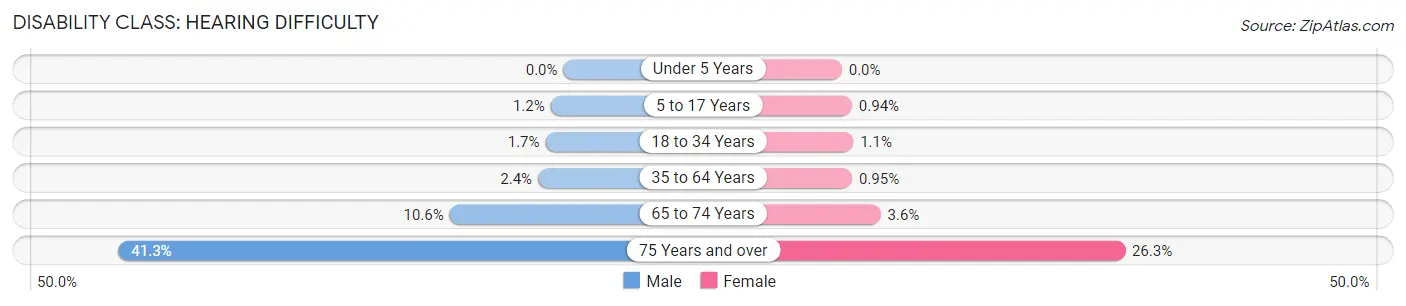
| Age Bracket | Male | Female |
| Under 5 Years | 0 (0.0%) | 0 (0.0%) |
| 5 to 17 Years | 13 (1.2%) | 11 (0.9%) |
| 18 to 34 Years | 20 (1.7%) | 13 (1.1%) |
| 35 to 64 Years | 74 (2.4%) | 30 (0.9%) |
| 65 to 74 Years | 96 (10.6%) | 33 (3.6%) |
| 75 Years and over | 218 (41.3%) | 195 (26.3%) |
Disability Class: Vision Difficulty
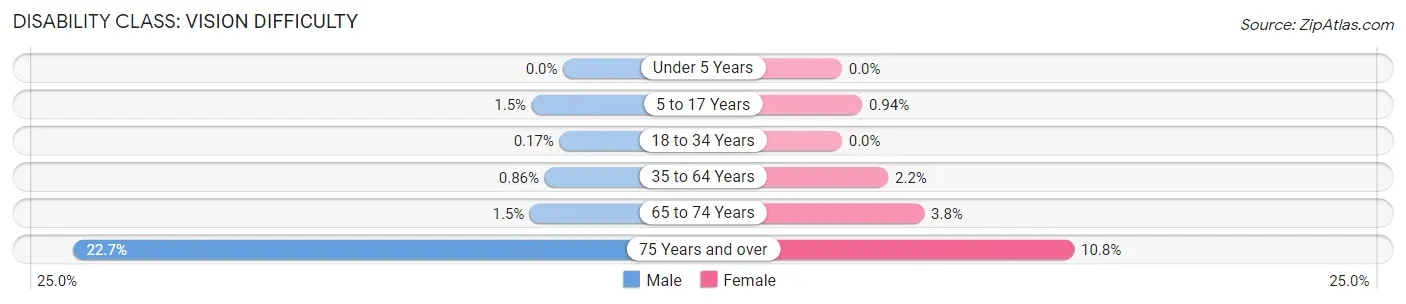
| Age Bracket | Male | Female |
| Under 5 Years | 0 (0.0%) | 0 (0.0%) |
| 5 to 17 Years | 16 (1.5%) | 11 (0.9%) |
| 18 to 34 Years | 2 (0.2%) | 0 (0.0%) |
| 35 to 64 Years | 27 (0.9%) | 68 (2.1%) |
| 65 to 74 Years | 14 (1.5%) | 35 (3.8%) |
| 75 Years and over | 120 (22.7%) | 80 (10.8%) |
Disability Class: Cognitive Difficulty
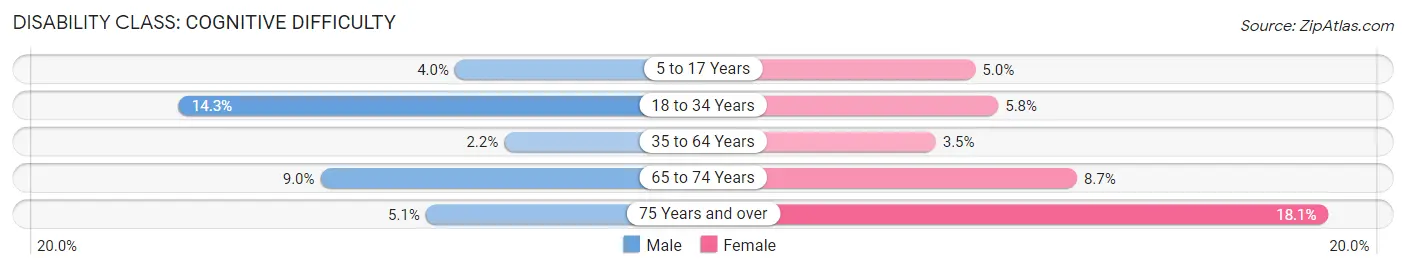
| Age Bracket | Male | Female |
| 5 to 17 Years | 44 (4.0%) | 58 (5.0%) |
| 18 to 34 Years | 171 (14.3%) | 71 (5.8%) |
| 35 to 64 Years | 69 (2.2%) | 110 (3.5%) |
| 65 to 74 Years | 82 (9.0%) | 80 (8.7%) |
| 75 Years and over | 27 (5.1%) | 134 (18.1%) |
Disability Class: Ambulatory Difficulty
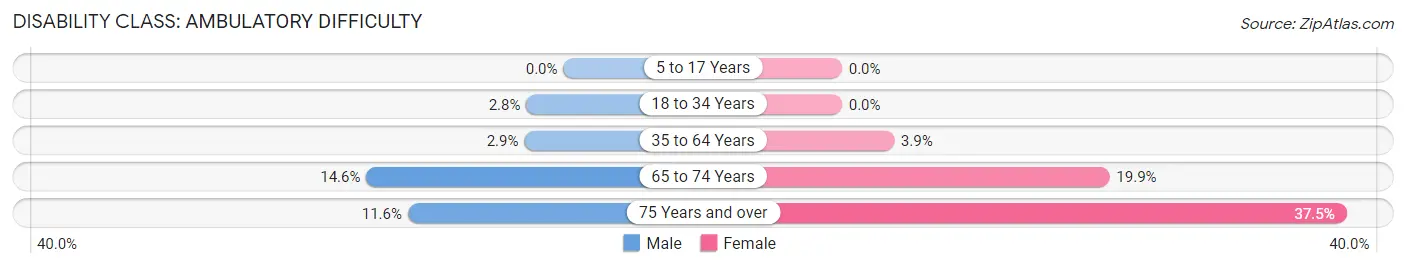
| Age Bracket | Male | Female |
| 5 to 17 Years | 0 (0.0%) | 0 (0.0%) |
| 18 to 34 Years | 33 (2.8%) | 0 (0.0%) |
| 35 to 64 Years | 91 (2.9%) | 122 (3.9%) |
| 65 to 74 Years | 133 (14.6%) | 182 (19.9%) |
| 75 Years and over | 61 (11.6%) | 278 (37.5%) |
Disability Class: Self-Care Difficulty
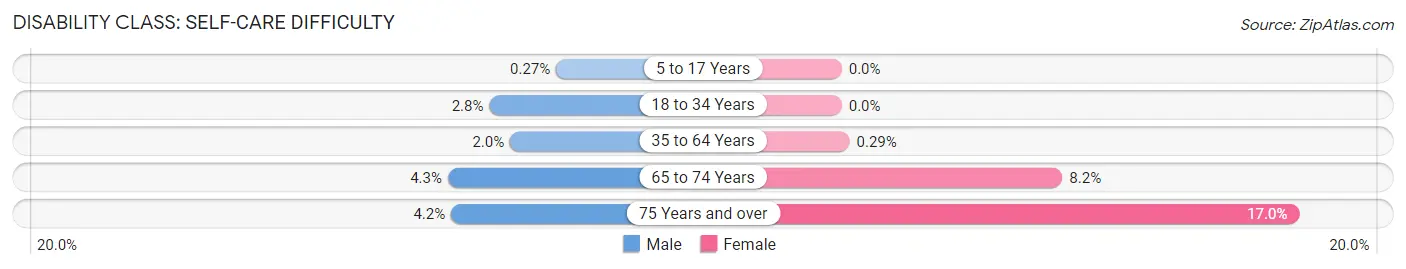
| Age Bracket | Male | Female |
| 5 to 17 Years | 3 (0.3%) | 0 (0.0%) |
| 18 to 34 Years | 33 (2.8%) | 0 (0.0%) |
| 35 to 64 Years | 62 (2.0%) | 9 (0.3%) |
| 65 to 74 Years | 39 (4.3%) | 75 (8.2%) |
| 75 Years and over | 22 (4.2%) | 126 (17.0%) |
Technology Access in Clarke County
Computing Device Access in Clarke County
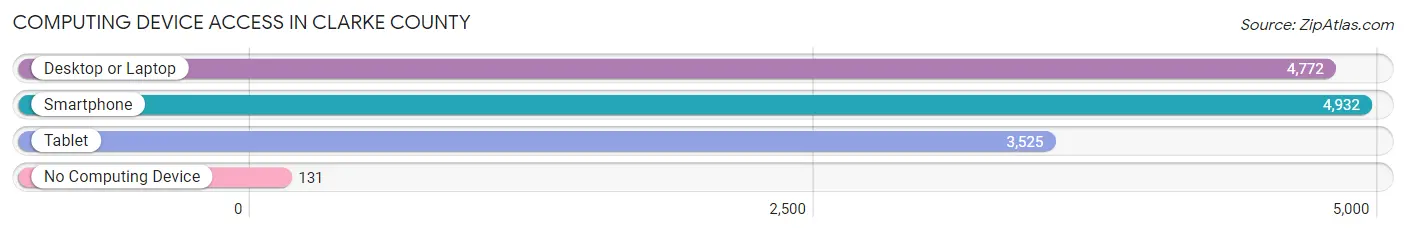
| Device Type | # Households | % Households |
| Desktop or Laptop | 4,772 | 85.0% |
| Smartphone | 4,932 | 87.8% |
| Tablet | 3,525 | 62.8% |
| No Computing Device | 131 | 2.3% |
| Total | 5,617 | 100.0% |
Internet Access in Clarke County
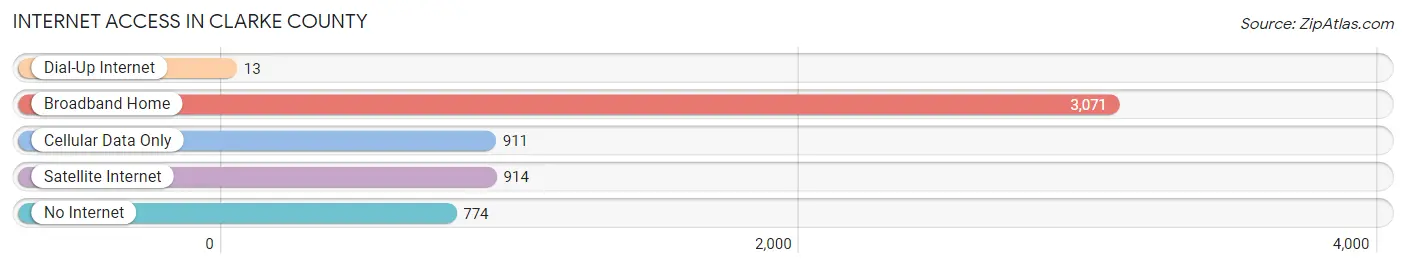
| Internet Type | # Households | % Households |
| Dial-Up Internet | 13 | 0.2% |
| Broadband Home | 3,071 | 54.7% |
| Cellular Data Only | 911 | 16.2% |
| Satellite Internet | 914 | 16.3% |
| No Internet | 774 | 13.8% |
| Total | 5,617 | 100.0% |
Clarke County Summary
Clarke County, Virginia is located in the northern part of the state, in the Shenandoah Valley region. It is bordered by Frederick County to the north, Warren County to the east, Fauquier County to the south, and Loudoun County to the west. The county seat is Berryville, and the county is part of the Winchester, VA-WV Metropolitan Statistical Area.
History
Clarke County was established in 1836 from parts of Frederick and Warren Counties. It was named for General George Rogers Clark, a Revolutionary War hero. The county was home to several Native American tribes, including the Iroquois, Shawnee, and Susquehannock.
The county was home to several prominent families, including the Carters, Lees, and Washingtons. George Washington owned a large estate in the county, which is now preserved as a national monument.
Geography
Clarke County covers an area of 212 square miles, with a population of 14,034 as of the 2010 census. The terrain is mostly rolling hills, with the Blue Ridge Mountains to the east and the Shenandoah River to the west. The county is home to several state parks, including Sky Meadows State Park and Shenandoah River State Park.
Economy
The economy of Clarke County is largely based on agriculture and tourism. The county is home to several wineries, as well as a number of historic sites. The county is also home to several technology companies, including Amazon, Microsoft, and Oracle.
Demographics
As of the 2010 census, the population of Clarke County was 14,034, with a population density of 66 people per square mile. The median household income was $68,945, and the median age was 40.7 years. The racial makeup of the county was 90.2% White, 4.3% African American, 0.7% Native American, 1.3% Asian, and 2.5% from other races.
Conclusion
Clarke County, Virginia is a rural county located in the northern part of the state. It is home to several historic sites, wineries, and technology companies. The population is largely white, with a median household income of $68,945. The county is home to several state parks, and is a popular tourist destination.
Common Questions
What is Per Capita Income in Clarke County?
Per Capita income in Clarke County is $50,751.
What is the Median Family Income in Clarke County?
Median Family Income in Clarke County is $133,352.
What is the Median Household income in Clarke County?
Median Household Income in Clarke County is $107,475.
What is Income or Wage Gap in Clarke County?
Income or Wage Gap in Clarke County is 26.6%.
Women in Clarke County earn 73.4 cents for every dollar earned by a man.
What is Inequality or Gini Index in Clarke County?
Inequality or Gini Index in Clarke County is 0.41.
What is the Total Population of Clarke County?
Total Population of Clarke County is 14,882.
What is the Total Male Population of Clarke County?
Total Male Population of Clarke County is 7,353.
What is the Total Female Population of Clarke County?
Total Female Population of Clarke County is 7,529.
What is the Ratio of Males per 100 Females in Clarke County?
There are 97.66 Males per 100 Females in Clarke County.
What is the Ratio of Females per 100 Males in Clarke County?
There are 102.39 Females per 100 Males in Clarke County.
What is the Median Population Age in Clarke County?
Median Population Age in Clarke County is 48.4 Years.
What is the Average Family Size in Clarke County
Average Family Size in Clarke County is 3.1 People.
What is the Average Household Size in Clarke County
Average Household Size in Clarke County is 2.6 People.
How Large is the Labor Force in Clarke County?
There are 7,727 People in the Labor Forcein in Clarke County.
What is the Percentage of People in the Labor Force in Clarke County?
61.7% of People are in the Labor Force in Clarke County.
What is the Unemployment Rate in Clarke County?
Unemployment Rate in Clarke County is 3.5%.