Charles City County, VA Map & Demographics
Charles City County Map
Charles City County Overview
$38,351
PER CAPITA INCOME
$88,210
AVG FAMILY INCOME
$65,573
AVG HOUSEHOLD INCOME
16.3%
WAGE / INCOME GAP [ % ]
83.7¢/ $1
WAGE / INCOME GAP [ $ ]
0.45
INEQUALITY / GINI INDEX
6,760
TOTAL POPULATION
3,362
MALE POPULATION
3,398
FEMALE POPULATION
98.94
MALES / 100 FEMALES
101.07
FEMALES / 100 MALES
52.0
MEDIAN AGE
3.0
AVG FAMILY SIZE
2.3
AVG HOUSEHOLD SIZE
3,436
LABOR FORCE [ PEOPLE ]
58.2%
PERCENT IN LABOR FORCE
4.1%
UNEMPLOYMENT RATE
Income in Charles City County
Income Overview in Charles City County
Per Capita Income in Charles City County is $38,351, while median incomes of families and households are $88,210 and $65,573 respectively.
| Characteristic | Number | Measure |
| Per Capita Income | 6,760 | $38,351 |
| Median Family Income | 1,745 | $88,210 |
| Mean Family Income | 1,745 | $105,225 |
| Median Household Income | 2,905 | $65,573 |
| Mean Household Income | 2,905 | $85,855 |
| Income Deficit | 1,745 | $0 |
| Wage / Income Gap (%) | 6,760 | 16.27% |
| Wage / Income Gap ($) | 6,760 | 83.73¢ per $1 |
| Gini / Inequality Index | 6,760 | 0.45 |
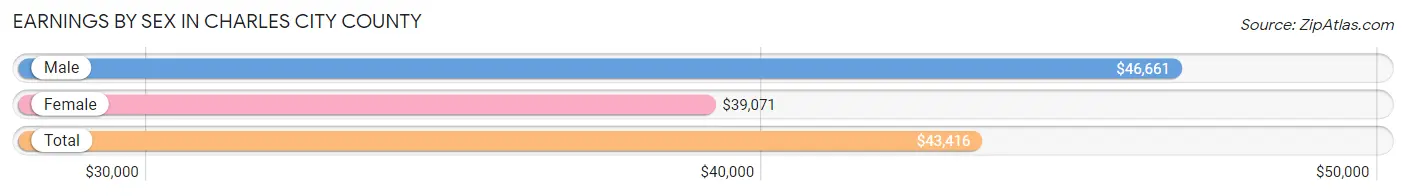
Earnings by Sex in Charles City County
Average Earnings in Charles City County are $43,416, $46,661 for men and $39,071 for women, a difference of 16.3%.
| Sex | Number | Average Earnings |
| Male | 1,887 (52.7%) | $46,661 |
| Female | 1,690 (47.2%) | $39,071 |
| Total | 3,577 (100.0%) | $43,416 |
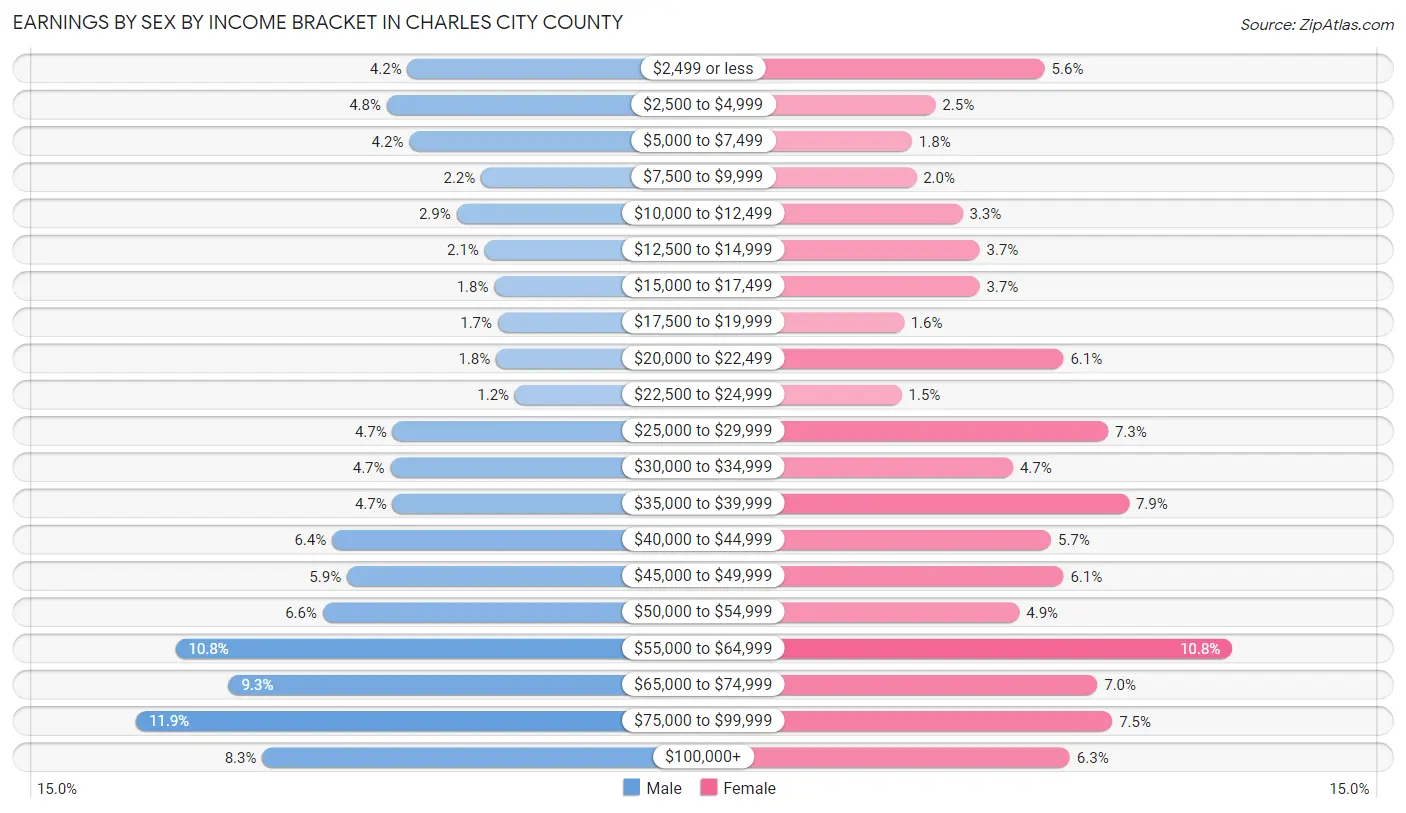
Earnings by Sex by Income Bracket in Charles City County
The most common earnings brackets in Charles City County are $75,000 to $99,999 for men (224 | 11.9%) and $55,000 to $64,999 for women (183 | 10.8%).
| Income | Male | Female |
| $2,499 or less | 80 (4.2%) | 94 (5.6%) |
| $2,500 to $4,999 | 91 (4.8%) | 42 (2.5%) |
| $5,000 to $7,499 | 79 (4.2%) | 31 (1.8%) |
| $7,500 to $9,999 | 41 (2.2%) | 33 (1.9%) |
| $10,000 to $12,499 | 54 (2.9%) | 55 (3.3%) |
| $12,500 to $14,999 | 39 (2.1%) | 63 (3.7%) |
| $15,000 to $17,499 | 34 (1.8%) | 63 (3.7%) |
| $17,500 to $19,999 | 32 (1.7%) | 27 (1.6%) |
| $20,000 to $22,499 | 33 (1.8%) | 103 (6.1%) |
| $22,500 to $24,999 | 23 (1.2%) | 26 (1.5%) |
| $25,000 to $29,999 | 88 (4.7%) | 124 (7.3%) |
| $30,000 to $34,999 | 89 (4.7%) | 79 (4.7%) |
| $35,000 to $39,999 | 88 (4.7%) | 134 (7.9%) |
| $40,000 to $44,999 | 120 (6.4%) | 97 (5.7%) |
| $45,000 to $49,999 | 112 (5.9%) | 103 (6.1%) |
| $50,000 to $54,999 | 125 (6.6%) | 82 (4.9%) |
| $55,000 to $64,999 | 203 (10.8%) | 183 (10.8%) |
| $65,000 to $74,999 | 175 (9.3%) | 119 (7.0%) |
| $75,000 to $99,999 | 224 (11.9%) | 126 (7.5%) |
| $100,000+ | 157 (8.3%) | 106 (6.3%) |
| Total | 1,887 (100.0%) | 1,690 (100.0%) |
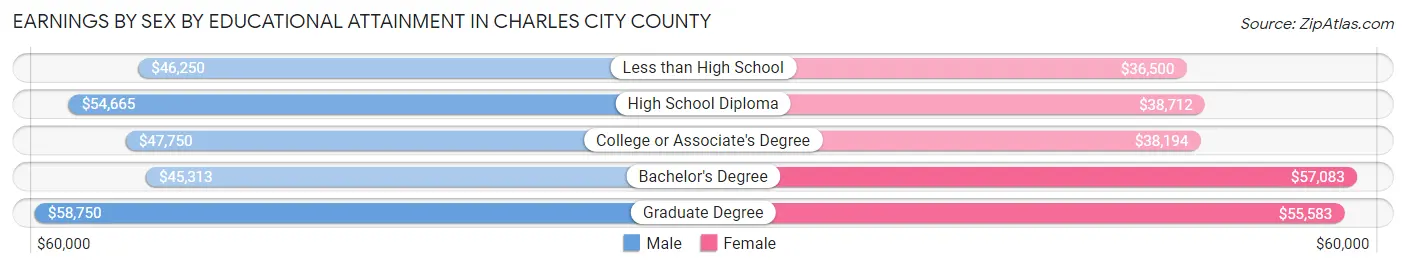
Earnings by Sex by Educational Attainment in Charles City County
Average earnings in Charles City County are $52,461 for men and $43,173 for women, a difference of 17.7%. Men with an educational attainment of graduate degree enjoy the highest average annual earnings of $58,750, while those with bachelor's degree education earn the least with $45,313. Women with an educational attainment of bachelor's degree earn the most with the average annual earnings of $57,083, while those with less than high school education have the smallest earnings of $36,500.
| Educational Attainment | Male Income | Female Income |
| Less than High School | $46,250 | $36,500 |
| High School Diploma | $54,665 | $38,712 |
| College or Associate's Degree | $47,750 | $38,194 |
| Bachelor's Degree | $45,313 | $57,083 |
| Graduate Degree | $58,750 | $55,583 |
| Total | $52,461 | $43,173 |
Family Income in Charles City County
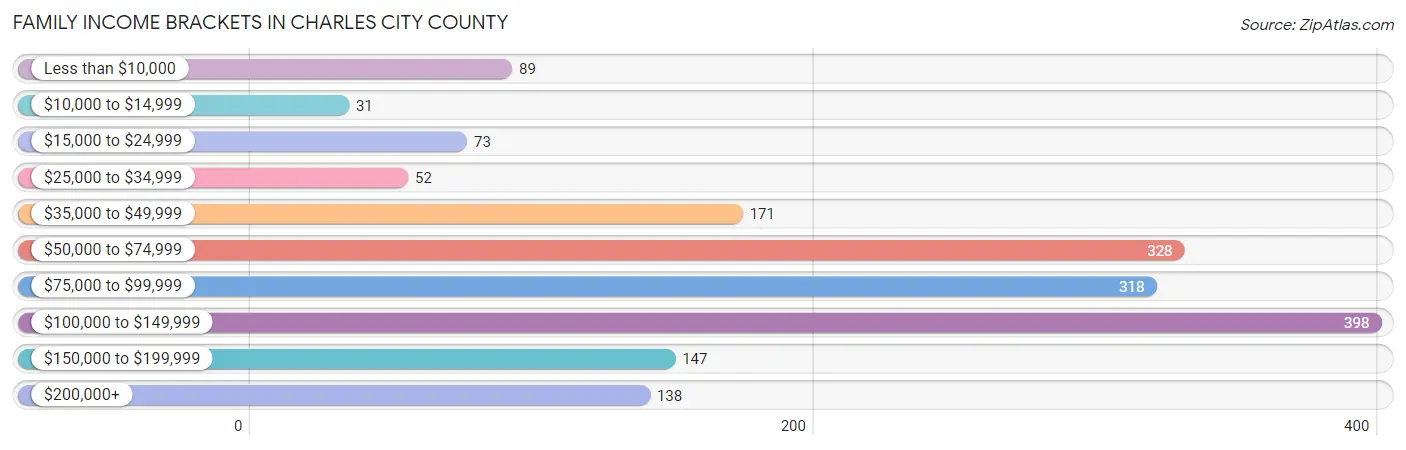
Family Income Brackets in Charles City County
According to the Charles City County family income data, there are 398 families falling into the $100,000 to $149,999 income range, which is the most common income bracket and makes up 22.8% of all families. Conversely, the $10,000 to $14,999 income bracket is the least frequent group with only 31 families (1.8%) belonging to this category.
| Income Bracket | # Families | % Families |
| Less than $10,000 | 89 | 5.1% |
| $10,000 to $14,999 | 31 | 1.8% |
| $15,000 to $24,999 | 73 | 4.2% |
| $25,000 to $34,999 | 52 | 3.0% |
| $35,000 to $49,999 | 171 | 9.8% |
| $50,000 to $74,999 | 328 | 18.8% |
| $75,000 to $99,999 | 318 | 18.2% |
| $100,000 to $149,999 | 398 | 22.8% |
| $150,000 to $199,999 | 147 | 8.4% |
| $200,000+ | 138 | 7.9% |
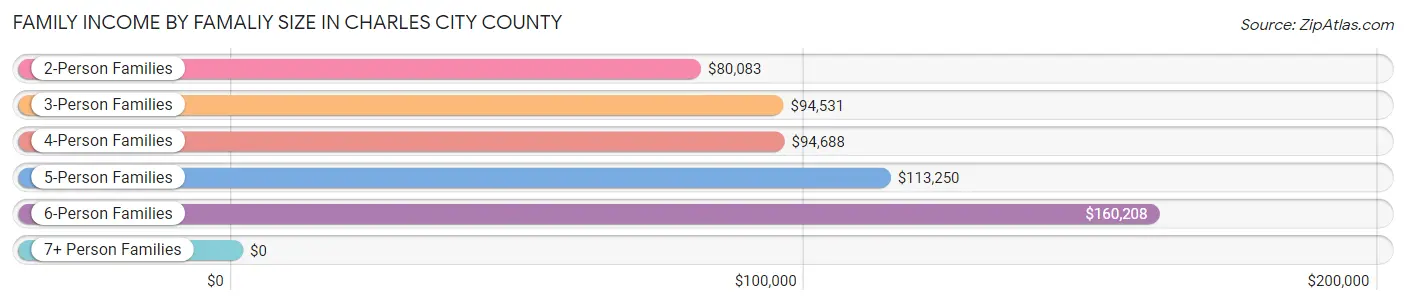
Family Income by Famaliy Size in Charles City County
6-person families (25 | 1.4%) account for the highest median family income in Charles City County with $160,208 per family, while 2-person families (960 | 55.0%) have the highest median income of $40,042 per family member.
| Income Bracket | # Families | Median Income |
| 2-Person Families | 960 (55.0%) | $80,083 |
| 3-Person Families | 449 (25.7%) | $94,531 |
| 4-Person Families | 189 (10.8%) | $94,688 |
| 5-Person Families | 114 (6.5%) | $113,250 |
| 6-Person Families | 25 (1.4%) | $160,208 |
| 7+ Person Families | 8 (0.5%) | $0 |
| Total | 1,745 (100.0%) | $88,210 |
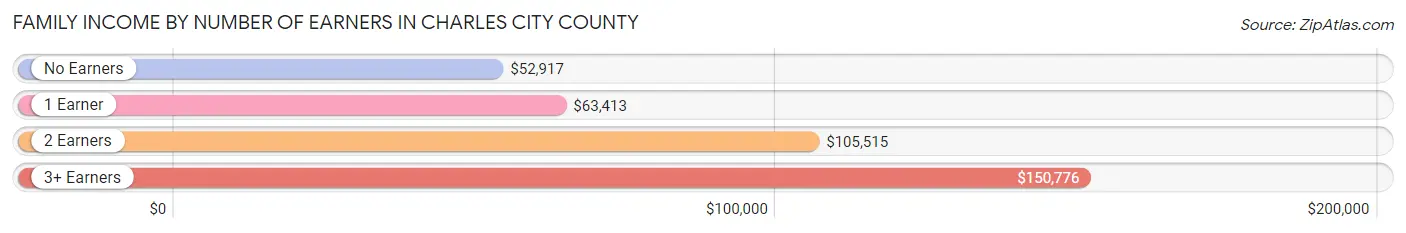
Family Income by Number of Earners in Charles City County
The median family income in Charles City County is $88,210, with families comprising 3+ earners (198) having the highest median family income of $150,776, while families with no earners (319) have the lowest median family income of $52,917, accounting for 11.4% and 18.3% of families, respectively.
| Number of Earners | # Families | Median Income |
| No Earners | 319 (18.3%) | $52,917 |
| 1 Earner | 559 (32.0%) | $63,413 |
| 2 Earners | 669 (38.3%) | $105,515 |
| 3+ Earners | 198 (11.4%) | $150,776 |
| Total | 1,745 (100.0%) | $88,210 |
Household Income in Charles City County
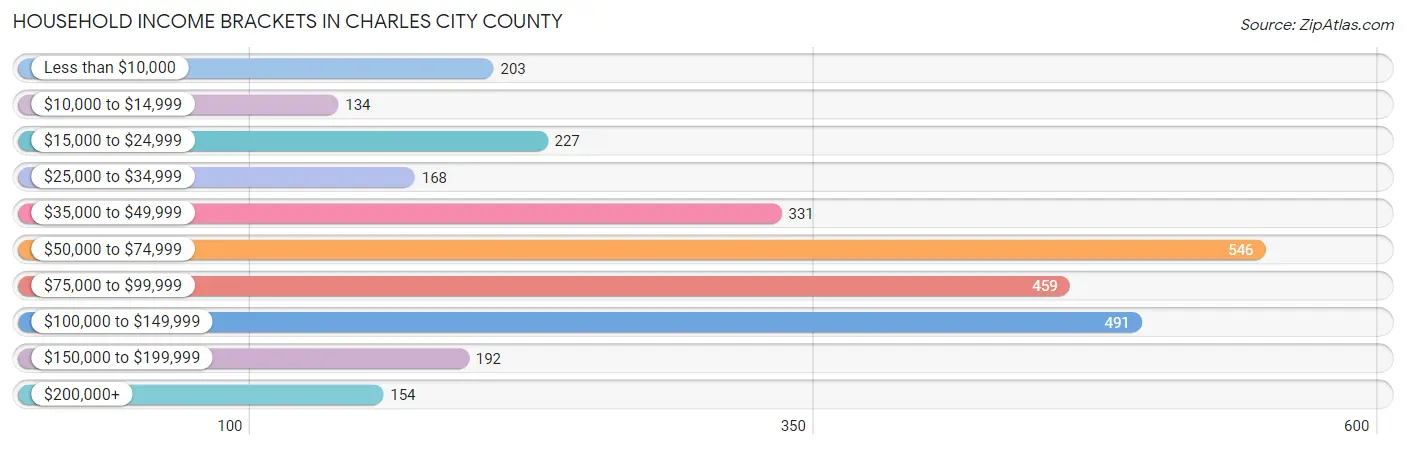
Household Income Brackets in Charles City County
With 546 households falling in the category, the $50,000 to $74,999 income range is the most frequent in Charles City County, accounting for 18.8% of all households. In contrast, only 134 households (4.6%) fall into the $10,000 to $14,999 income bracket, making it the least populous group.
| Income Bracket | # Households | % Households |
| Less than $10,000 | 203 | 7.0% |
| $10,000 to $14,999 | 134 | 4.6% |
| $15,000 to $24,999 | 227 | 7.8% |
| $25,000 to $34,999 | 168 | 5.8% |
| $35,000 to $49,999 | 331 | 11.4% |
| $50,000 to $74,999 | 546 | 18.8% |
| $75,000 to $99,999 | 459 | 15.8% |
| $100,000 to $149,999 | 491 | 16.9% |
| $150,000 to $199,999 | 192 | 6.6% |
| $200,000+ | 154 | 5.3% |
Household Income by Householder Age in Charles City County
The median household income in Charles City County is $65,573, with the highest median household income of $80,764 found in the 45 to 64 years age bracket for the primary householder. A total of 1,219 households (42.0%) fall into this category. Meanwhile, the 15 to 24 years age bracket for the primary householder has the lowest median household income of $13,542, with 23 households (0.8%) in this group.
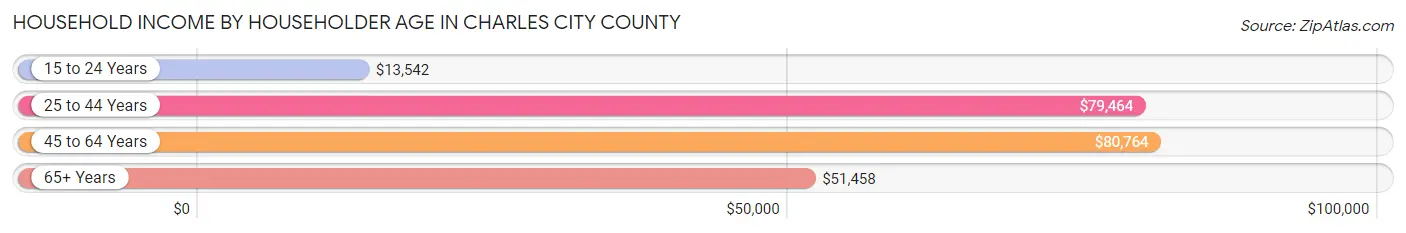
| Income Bracket | # Households | Median Income |
| 15 to 24 Years | 23 (0.8%) | $13,542 |
| 25 to 44 Years | 557 (19.2%) | $79,464 |
| 45 to 64 Years | 1,219 (42.0%) | $80,764 |
| 65+ Years | 1,106 (38.1%) | $51,458 |
| Total | 2,905 (100.0%) | $65,573 |
Poverty in Charles City County
Income Below Poverty by Sex and Age in Charles City County
With 12.9% poverty level for males and 12.1% for females among the residents of Charles City County, under 5 year old males and 15 year old females are the most vulnerable to poverty, with 49 males (38.3%) and 9 females (60.0%) in their respective age groups living below the poverty level.
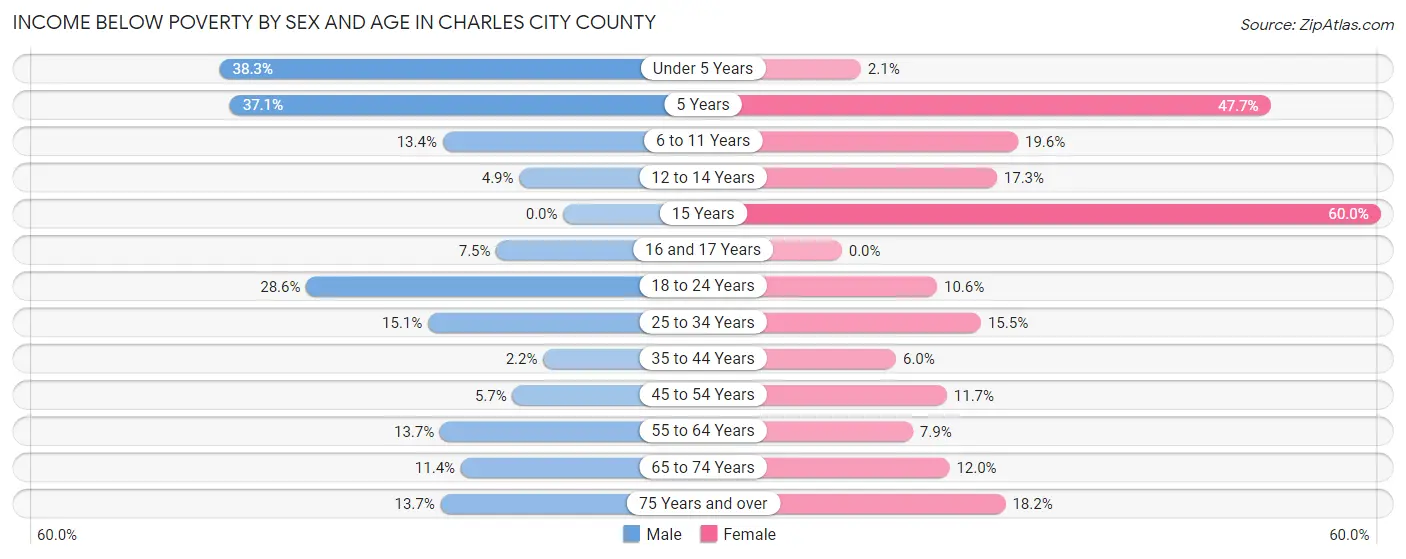
| Age Bracket | Male | Female |
| Under 5 Years | 49 (38.3%) | 2 (2.1%) |
| 5 Years | 13 (37.1%) | 21 (47.7%) |
| 6 to 11 Years | 18 (13.4%) | 21 (19.6%) |
| 12 to 14 Years | 5 (4.9%) | 19 (17.3%) |
| 15 Years | 0 (0.0%) | 9 (60.0%) |
| 16 and 17 Years | 5 (7.5%) | 0 (0.0%) |
| 18 to 24 Years | 67 (28.6%) | 21 (10.6%) |
| 25 to 34 Years | 50 (15.1%) | 51 (15.5%) |
| 35 to 44 Years | 8 (2.2%) | 20 (6.0%) |
| 45 to 54 Years | 25 (5.7%) | 55 (11.7%) |
| 55 to 64 Years | 89 (13.7%) | 54 (7.9%) |
| 65 to 74 Years | 59 (11.4%) | 64 (12.0%) |
| 75 Years and over | 39 (13.7%) | 72 (18.2%) |
| Total | 427 (12.9%) | 409 (12.1%) |
Income Above Poverty by Sex and Age in Charles City County
According to the poverty statistics in Charles City County, males aged 15 years and females aged 16 and 17 years are the age groups that are most secure financially, with 100.0% of males and 100.0% of females in these age groups living above the poverty line.
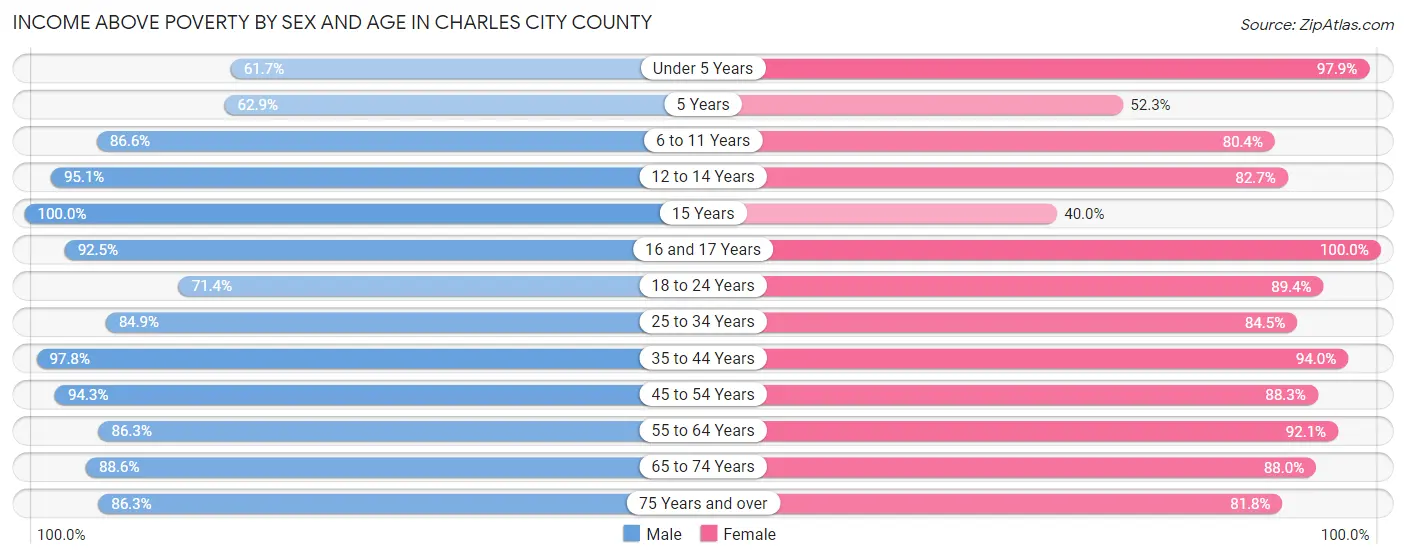
| Age Bracket | Male | Female |
| Under 5 Years | 79 (61.7%) | 92 (97.9%) |
| 5 Years | 22 (62.9%) | 23 (52.3%) |
| 6 to 11 Years | 116 (86.6%) | 86 (80.4%) |
| 12 to 14 Years | 97 (95.1%) | 91 (82.7%) |
| 15 Years | 33 (100.0%) | 6 (40.0%) |
| 16 and 17 Years | 62 (92.5%) | 82 (100.0%) |
| 18 to 24 Years | 167 (71.4%) | 177 (89.4%) |
| 25 to 34 Years | 282 (84.9%) | 278 (84.5%) |
| 35 to 44 Years | 350 (97.8%) | 311 (94.0%) |
| 45 to 54 Years | 417 (94.3%) | 415 (88.3%) |
| 55 to 64 Years | 559 (86.3%) | 628 (92.1%) |
| 65 to 74 Years | 458 (88.6%) | 470 (88.0%) |
| 75 Years and over | 246 (86.3%) | 323 (81.8%) |
| Total | 2,888 (87.1%) | 2,982 (87.9%) |
Income Below Poverty Among Married-Couple Families in Charles City County
The poverty statistics for married-couple families in Charles City County show that 6.9% or 85 of the total 1,237 families live below the poverty line. Families with 3 or 4 children have the highest poverty rate of 18.5%, comprising of 10 families. On the other hand, families with 1 or 2 children have the lowest poverty rate of 0.0%, which includes 0 families.
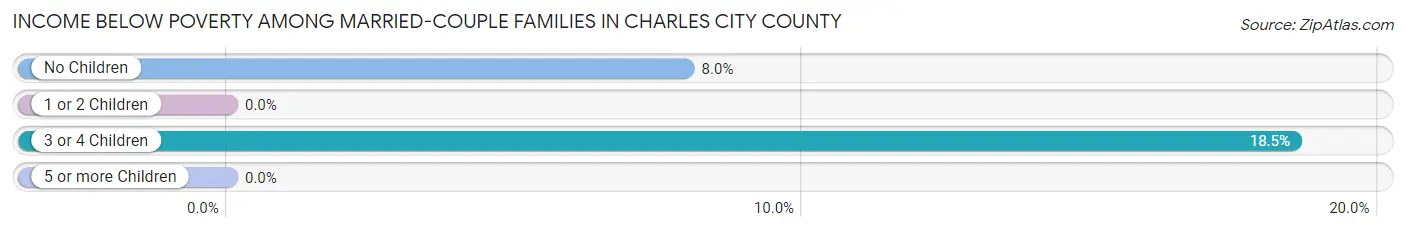
| Children | Above Poverty | Below Poverty |
| No Children | 868 (92.0%) | 75 (8.0%) |
| 1 or 2 Children | 232 (100.0%) | 0 (0.0%) |
| 3 or 4 Children | 44 (81.5%) | 10 (18.5%) |
| 5 or more Children | 8 (100.0%) | 0 (0.0%) |
| Total | 1,152 (93.1%) | 85 (6.9%) |
Income Below Poverty Among Single-Parent Households in Charles City County
According to the poverty data in Charles City County, 0.8% or 1 single-father households and 22.5% or 85 single-mother households are living below the poverty line. Among single-father households, those with 1 or 2 children have the highest poverty rate, with 1 households (2.3%) experiencing poverty. Likewise, among single-mother households, those with 3 or 4 children have the highest poverty rate, with 10 households (71.4%) falling below the poverty line.
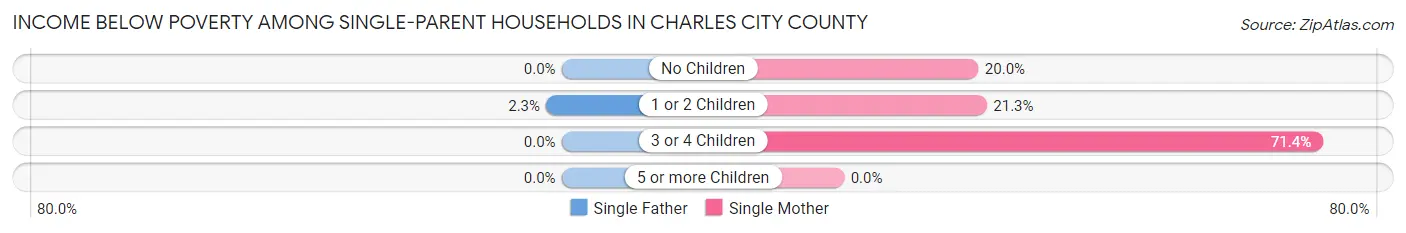
| Children | Single Father | Single Mother |
| No Children | 0 (0.0%) | 38 (20.0%) |
| 1 or 2 Children | 1 (2.3%) | 37 (21.3%) |
| 3 or 4 Children | 0 (0.0%) | 10 (71.4%) |
| 5 or more Children | 0 (0.0%) | 0 (0.0%) |
| Total | 1 (0.8%) | 85 (22.5%) |
Income Below Poverty Among Married-Couple vs Single-Parent Households in Charles City County
The poverty data for Charles City County shows that 85 of the married-couple family households (6.9%) and 86 of the single-parent households (16.9%) are living below the poverty level. Within the married-couple family households, those with 3 or 4 children have the highest poverty rate, with 10 households (18.5%) falling below the poverty line. Among the single-parent households, those with 3 or 4 children have the highest poverty rate, with 10 household (71.4%) living below poverty.
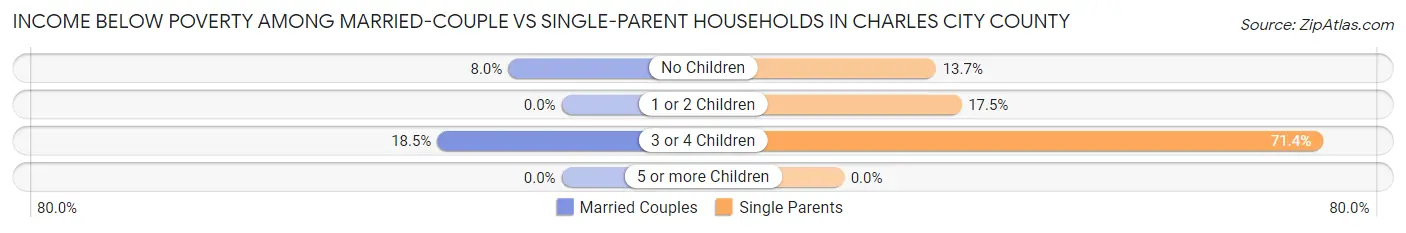
| Children | Married-Couple Families | Single-Parent Households |
| No Children | 75 (8.0%) | 38 (13.7%) |
| 1 or 2 Children | 0 (0.0%) | 38 (17.5%) |
| 3 or 4 Children | 10 (18.5%) | 10 (71.4%) |
| 5 or more Children | 0 (0.0%) | 0 (0.0%) |
| Total | 85 (6.9%) | 86 (16.9%) |
Race in Charles City County
The most populous races in Charles City County are White / Caucasian (2,998 | 44.4%), Black / African American (2,968 | 43.9%), and Native / Alaskan (386 | 5.7%).
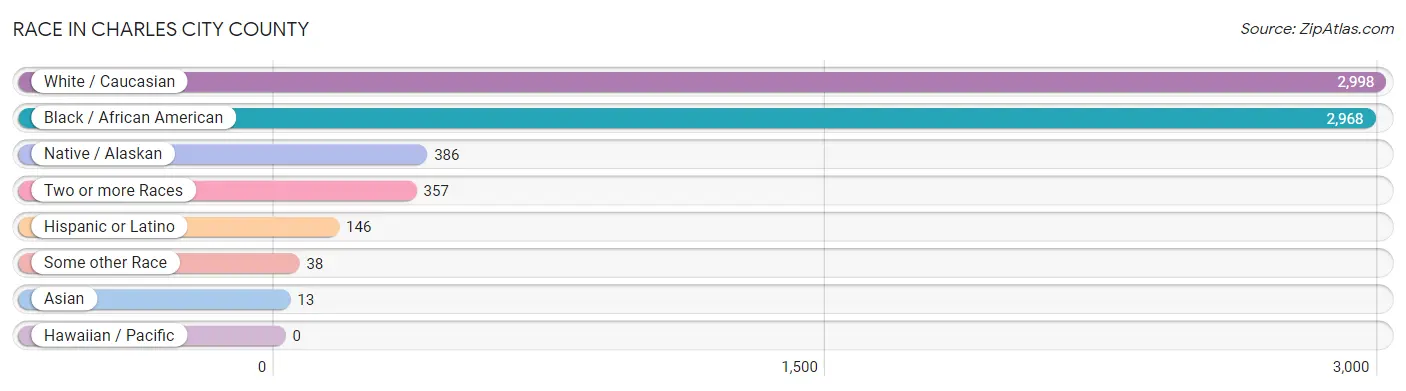
| Race | # Population | % Population |
| Asian | 13 | 0.2% |
| Black / African American | 2,968 | 43.9% |
| Hawaiian / Pacific | 0 | 0.0% |
| Hispanic or Latino | 146 | 2.2% |
| Native / Alaskan | 386 | 5.7% |
| White / Caucasian | 2,998 | 44.4% |
| Two or more Races | 357 | 5.3% |
| Some other Race | 38 | 0.6% |
| Total | 6,760 | 100.0% |
Ancestry in Charles City County
The most populous ancestries reported in Charles City County are American (1,093 | 16.2%), English (481 | 7.1%), Irish (326 | 4.8%), German (292 | 4.3%), and European (132 | 1.9%), together accounting for 34.4% of all Charles City County residents.
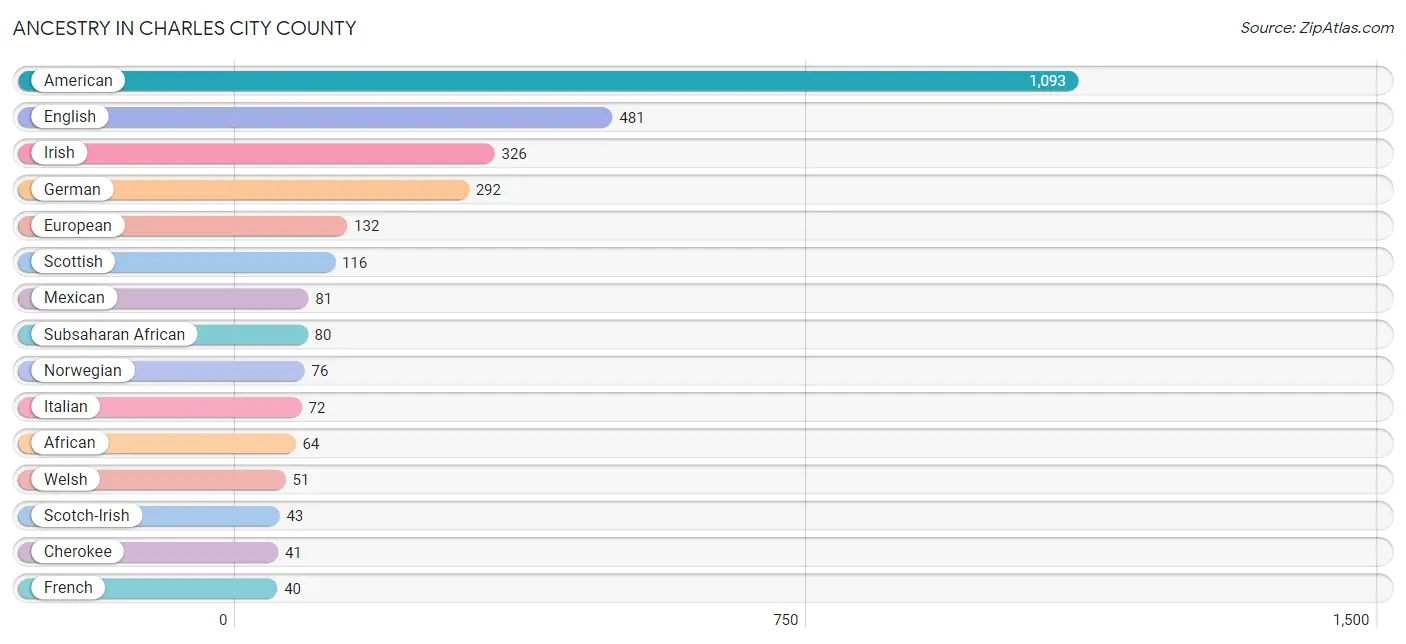
| Ancestry | # Population | % Population |
| African | 64 | 0.9% |
| American | 1,093 | 16.2% |
| Argentinean | 7 | 0.1% |
| Austrian | 25 | 0.4% |
| Belgian | 7 | 0.1% |
| Blackfeet | 8 | 0.1% |
| British | 26 | 0.4% |
| Canadian | 4 | 0.1% |
| Central American | 38 | 0.6% |
| Cherokee | 41 | 0.6% |
| Chippewa | 7 | 0.1% |
| Choctaw | 2 | 0.0% |
| Czech | 18 | 0.3% |
| Czechoslovakian | 7 | 0.1% |
| Danish | 1 | 0.0% |
| Dominican | 7 | 0.1% |
| Dutch | 20 | 0.3% |
| Eastern European | 17 | 0.3% |
| English | 481 | 7.1% |
| European | 132 | 1.9% |
| French | 40 | 0.6% |
| French Canadian | 22 | 0.3% |
| German | 292 | 4.3% |
| Greek | 26 | 0.4% |
| Guyanese | 2 | 0.0% |
| Honduran | 24 | 0.4% |
| Hungarian | 4 | 0.1% |
| Irish | 326 | 4.8% |
| Italian | 72 | 1.1% |
| Jamaican | 2 | 0.0% |
| Korean | 13 | 0.2% |
| Macedonian | 5 | 0.1% |
| Mexican | 81 | 1.2% |
| Navajo | 5 | 0.1% |
| Nigerian | 16 | 0.2% |
| Northern European | 4 | 0.1% |
| Norwegian | 76 | 1.1% |
| Pakistani | 1 | 0.0% |
| Polish | 27 | 0.4% |
| Portuguese | 33 | 0.5% |
| Puerto Rican | 4 | 0.1% |
| Salvadoran | 14 | 0.2% |
| Scandinavian | 3 | 0.0% |
| Scotch-Irish | 43 | 0.6% |
| Scottish | 116 | 1.7% |
| Slavic | 2 | 0.0% |
| Slovak | 9 | 0.1% |
| South American | 7 | 0.1% |
| Spanish | 4 | 0.1% |
| Subsaharan African | 80 | 1.2% |
| Swedish | 6 | 0.1% |
| Swiss | 25 | 0.4% |
| Thai | 3 | 0.0% |
| Turkish | 3 | 0.0% |
| Ukrainian | 3 | 0.0% |
| Welsh | 51 | 0.7% |
| West Indian | 2 | 0.0% | View All 57 Rows |
Immigrants in Charles City County
The most numerous immigrant groups reported in Charles City County came from Latin America (62 | 0.9%), Central America (52 | 0.8%), Europe (30 | 0.4%), Honduras (24 | 0.4%), and Canada (21 | 0.3%), together accounting for 2.8% of all Charles City County residents.
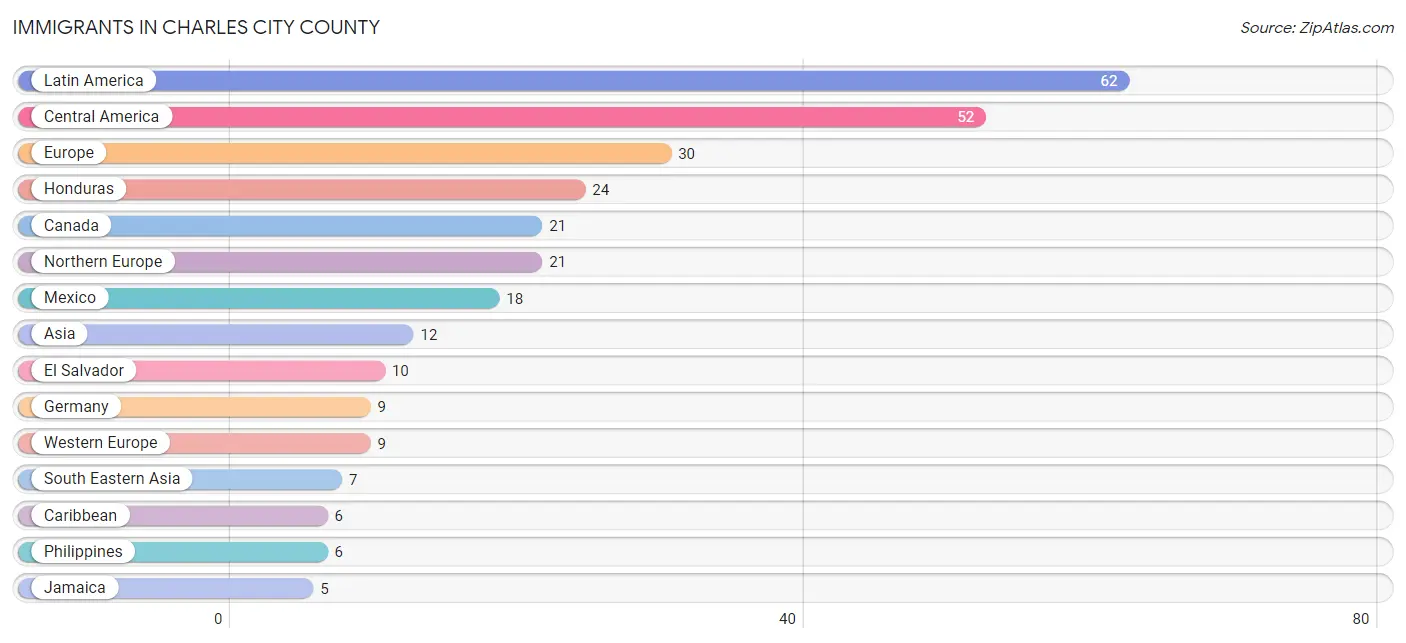
| Immigration Origin | # Population | % Population |
| Asia | 12 | 0.2% |
| Brazil | 2 | 0.0% |
| Canada | 21 | 0.3% |
| Caribbean | 6 | 0.1% |
| Central America | 52 | 0.8% |
| Cuba | 1 | 0.0% |
| Eastern Asia | 2 | 0.0% |
| El Salvador | 10 | 0.2% |
| Europe | 30 | 0.4% |
| Germany | 9 | 0.1% |
| Guyana | 2 | 0.0% |
| Honduras | 24 | 0.4% |
| Jamaica | 5 | 0.1% |
| Korea | 2 | 0.0% |
| Latin America | 62 | 0.9% |
| Mexico | 18 | 0.3% |
| Northern Europe | 21 | 0.3% |
| Philippines | 6 | 0.1% |
| South America | 4 | 0.1% |
| South Eastern Asia | 7 | 0.1% |
| Thailand | 1 | 0.0% |
| Turkey | 3 | 0.0% |
| Western Asia | 3 | 0.0% |
| Western Europe | 9 | 0.1% | View All 24 Rows |
Sex and Age in Charles City County
Sex and Age in Charles City County
The most populous age groups in Charles City County are 55 to 59 Years (389 | 11.6%) for men and 60 to 64 Years (371 | 10.9%) for women.
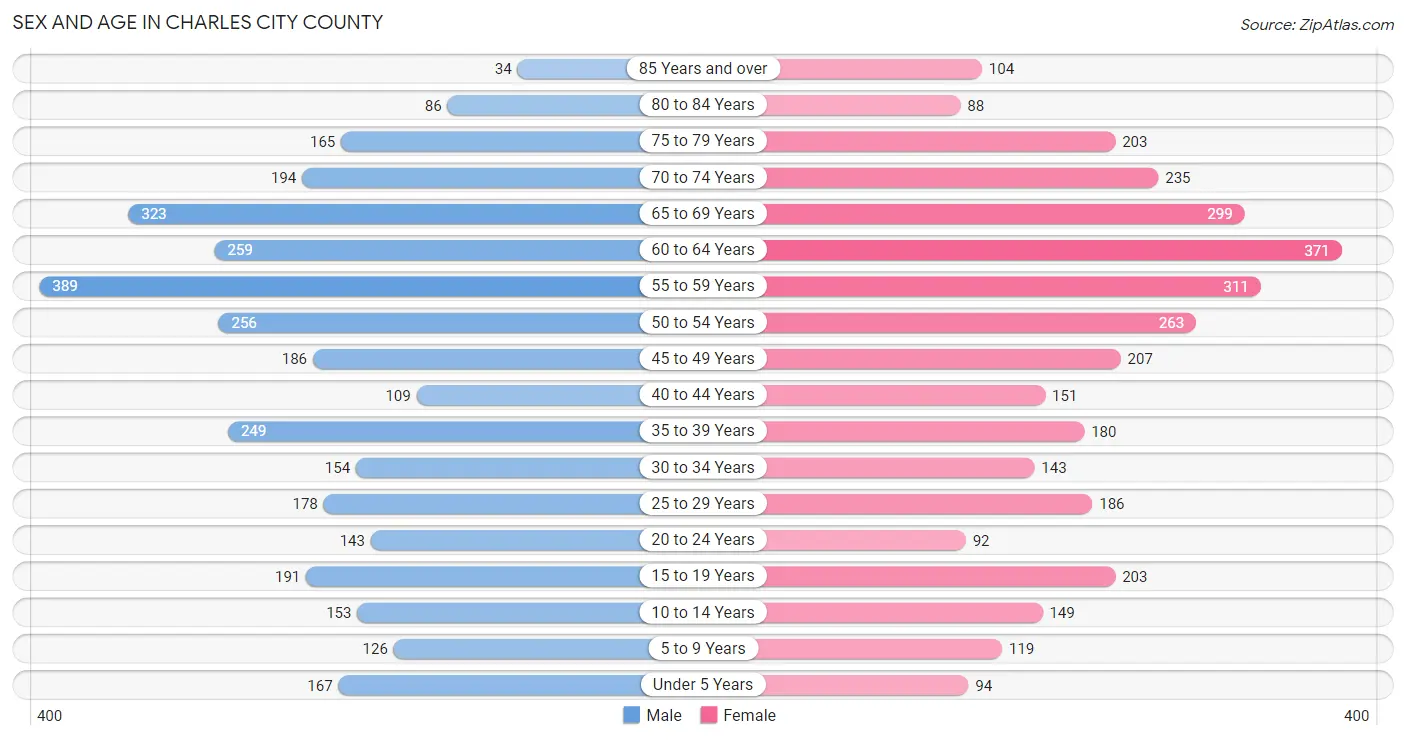
| Age Bracket | Male | Female |
| Under 5 Years | 167 (5.0%) | 94 (2.8%) |
| 5 to 9 Years | 126 (3.7%) | 119 (3.5%) |
| 10 to 14 Years | 153 (4.5%) | 149 (4.4%) |
| 15 to 19 Years | 191 (5.7%) | 203 (6.0%) |
| 20 to 24 Years | 143 (4.3%) | 92 (2.7%) |
| 25 to 29 Years | 178 (5.3%) | 186 (5.5%) |
| 30 to 34 Years | 154 (4.6%) | 143 (4.2%) |
| 35 to 39 Years | 249 (7.4%) | 180 (5.3%) |
| 40 to 44 Years | 109 (3.2%) | 151 (4.4%) |
| 45 to 49 Years | 186 (5.5%) | 207 (6.1%) |
| 50 to 54 Years | 256 (7.6%) | 263 (7.7%) |
| 55 to 59 Years | 389 (11.6%) | 311 (9.1%) |
| 60 to 64 Years | 259 (7.7%) | 371 (10.9%) |
| 65 to 69 Years | 323 (9.6%) | 299 (8.8%) |
| 70 to 74 Years | 194 (5.8%) | 235 (6.9%) |
| 75 to 79 Years | 165 (4.9%) | 203 (6.0%) |
| 80 to 84 Years | 86 (2.6%) | 88 (2.6%) |
| 85 Years and over | 34 (1.0%) | 104 (3.1%) |
| Total | 3,362 (100.0%) | 3,398 (100.0%) |
Families and Households in Charles City County
Median Family Size in Charles City County
The median family size in Charles City County is 3.00 persons per family, with single female/mother families (378 | 21.7%) accounting for the largest median family size of 3.72 persons per family. On the other hand, married-couple families (1,237 | 70.9%) represent the smallest median family size with 2.77 persons per family.
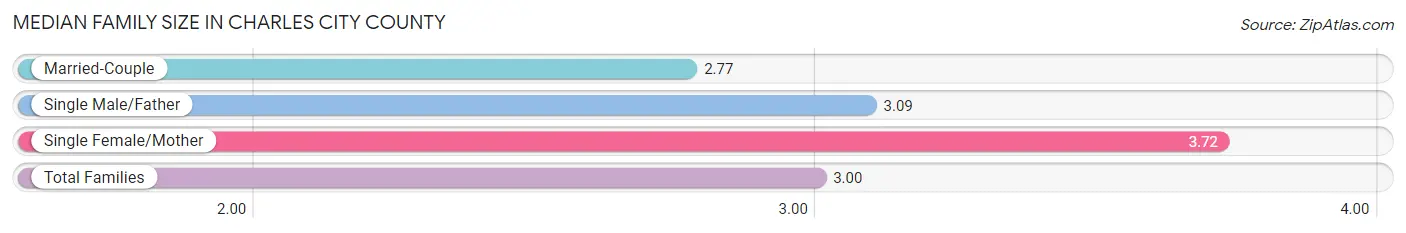
| Family Type | # Families | Family Size |
| Married-Couple | 1,237 (70.9%) | 2.77 |
| Single Male/Father | 130 (7.4%) | 3.09 |
| Single Female/Mother | 378 (21.7%) | 3.72 |
| Total Families | 1,745 (100.0%) | 3.00 |
Median Household Size in Charles City County
The median household size in Charles City County is 2.33 persons per household, with single female/mother households (378 | 13.0%) accounting for the largest median household size of 3.89 persons per household. non-family households (1,160 | 39.9%) represent the smallest median household size with 1.15 persons per household.
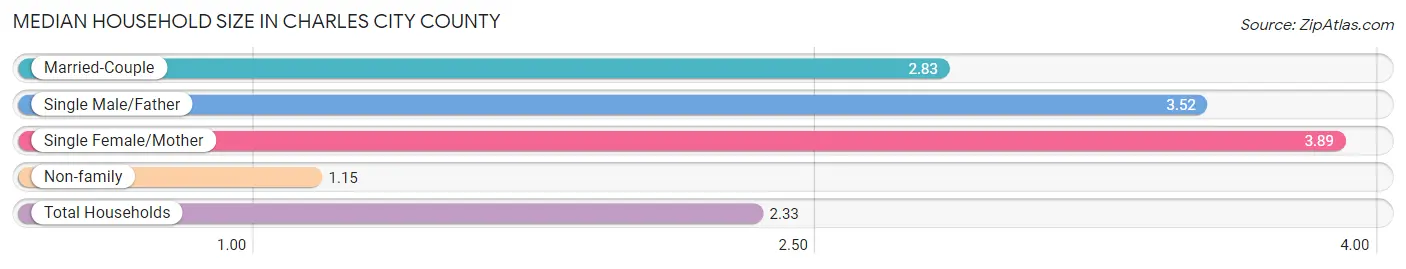
| Household Type | # Households | Household Size |
| Married-Couple | 1,237 (42.6%) | 2.83 |
| Single Male/Father | 130 (4.5%) | 3.52 |
| Single Female/Mother | 378 (13.0%) | 3.89 |
| Non-family | 1,160 (39.9%) | 1.15 |
| Total Households | 2,905 (100.0%) | 2.33 |
Household Size by Marriage Status in Charles City County
Out of a total of 2,905 households in Charles City County, 1,745 (60.1%) are family households, while 1,160 (39.9%) are nonfamily households. The most numerous type of family households are 2-person households, comprising 933, and the most common type of nonfamily households are 1-person households, comprising 1,042.
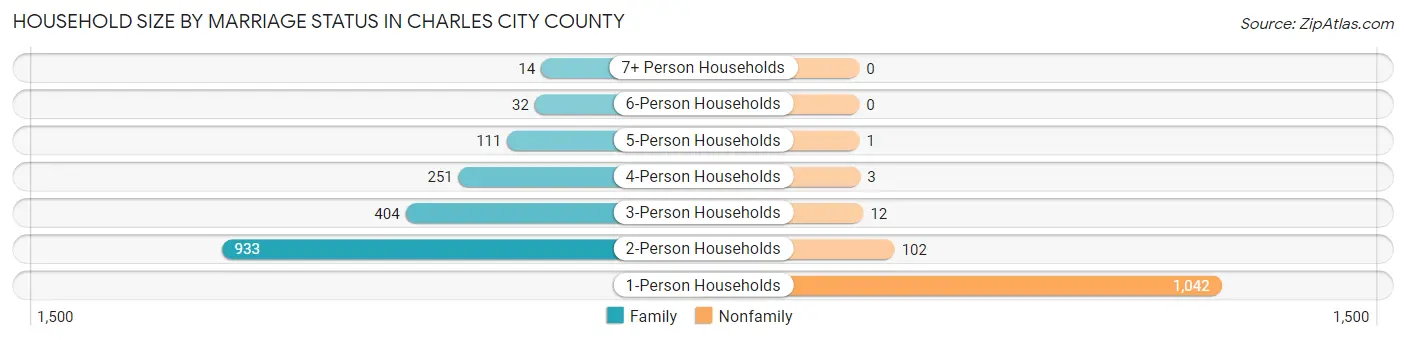
| Household Size | Family Households | Nonfamily Households |
| 1-Person Households | - | 1,042 (35.9%) |
| 2-Person Households | 933 (32.1%) | 102 (3.5%) |
| 3-Person Households | 404 (13.9%) | 12 (0.4%) |
| 4-Person Households | 251 (8.6%) | 3 (0.1%) |
| 5-Person Households | 111 (3.8%) | 1 (0.0%) |
| 6-Person Households | 32 (1.1%) | 0 (0.0%) |
| 7+ Person Households | 14 (0.5%) | 0 (0.0%) |
| Total | 1,745 (60.1%) | 1,160 (39.9%) |
Female Fertility in Charles City County
Fertility by Age in Charles City County
Average fertility rate in Charles City County is 32.0 births per 1,000 women. Women in the age bracket of 20 to 34 years have the highest fertility rate with 76.0 births per 1,000 women. Women in the age bracket of 20 to 34 years acount for 82.1% of all women with births.
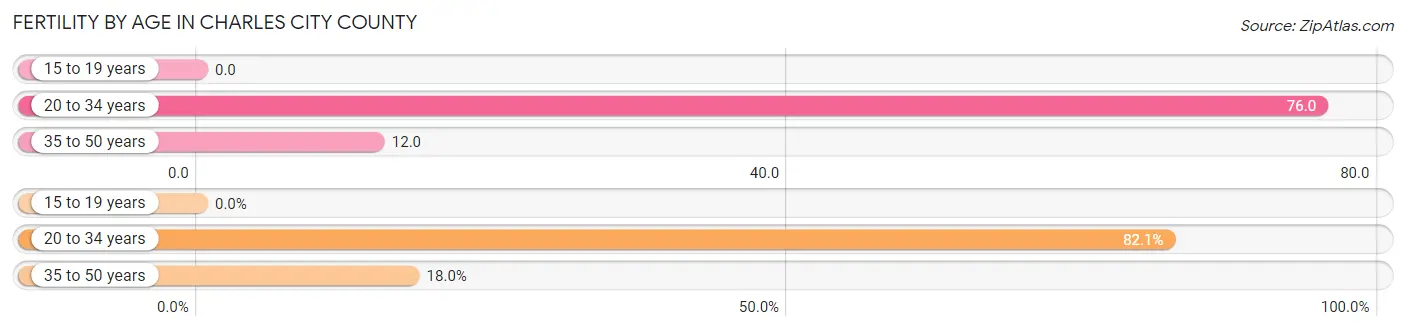
| Age Bracket | Women with Births | Births / 1,000 Women |
| 15 to 19 years | 0 (0.0%) | 0.0 |
| 20 to 34 years | 32 (82.1%) | 76.0 |
| 35 to 50 years | 7 (17.9%) | 12.0 |
| Total | 39 (100.0%) | 32.0 |
Fertility by Age by Marriage Status in Charles City County
66.7% of women with births (39) in Charles City County are married. The highest percentage of unmarried women with births falls into 20 to 34 years age bracket with 34.4% of them unmarried at the time of birth, while the lowest percentage of unmarried women with births belong to 35 to 50 years age bracket with 28.6% of them unmarried.
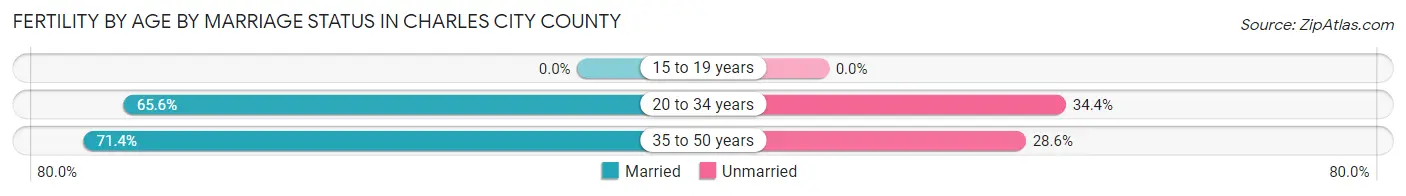
| Age Bracket | Married | Unmarried |
| 15 to 19 years | 0 (0.0%) | 0 (0.0%) |
| 20 to 34 years | 21 (65.6%) | 11 (34.4%) |
| 35 to 50 years | 5 (71.4%) | 2 (28.6%) |
| Total | 26 (66.7%) | 13 (33.3%) |
Fertility by Education in Charles City County
Average fertility rate in Charles City County is 32.0 births per 1,000 women. Women with the education attainment of bachelor's degree have the highest fertility rate of 52.0 births per 1,000 women, while women with the education attainment of less than high school have the lowest fertility at 10.0 births per 1,000 women. Women with the education attainment of high school diploma represent 38.5% of all women with births.
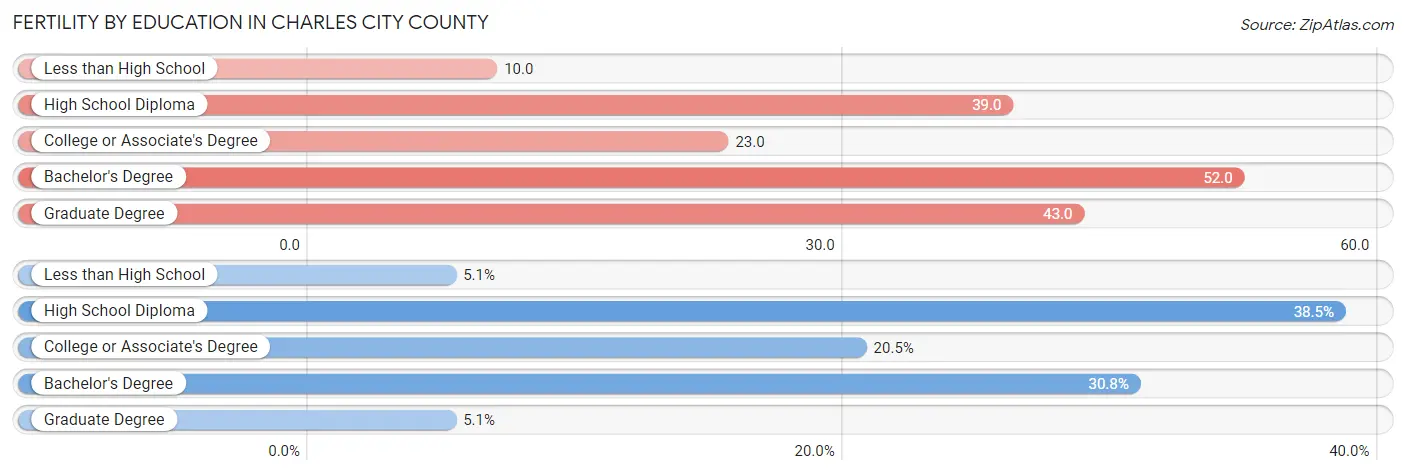
| Educational Attainment | Women with Births | Births / 1,000 Women |
| Less than High School | 2 (5.1%) | 10.0 |
| High School Diploma | 15 (38.5%) | 39.0 |
| College or Associate's Degree | 8 (20.5%) | 23.0 |
| Bachelor's Degree | 12 (30.8%) | 52.0 |
| Graduate Degree | 2 (5.1%) | 43.0 |
| Total | 39 (100.0%) | 32.0 |
Fertility by Education by Marriage Status in Charles City County
33.3% of women with births in Charles City County are unmarried. Women with the educational attainment of less than high school are most likely to be married with 100.0% of them married at childbirth, while women with the educational attainment of graduate degree are least likely to be married with 100.0% of them unmarried at childbirth.
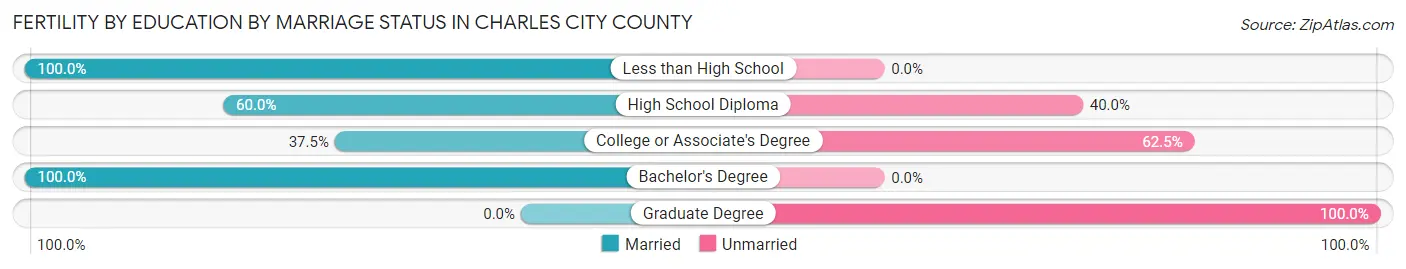
| Educational Attainment | Married | Unmarried |
| Less than High School | 2 (100.0%) | 0 (0.0%) |
| High School Diploma | 9 (60.0%) | 6 (40.0%) |
| College or Associate's Degree | 3 (37.5%) | 5 (62.5%) |
| Bachelor's Degree | 12 (100.0%) | 0 (0.0%) |
| Graduate Degree | 0 (0.0%) | 2 (100.0%) |
| Total | 26 (66.7%) | 13 (33.3%) |
Employment Characteristics in Charles City County
Employment by Class of Employer in Charles City County
Among the 3,222 employed individuals in Charles City County, private company employees (2,179 | 67.6%), local government employees (282 | 8.7%), and not-for-profit organizations (195 | 6.0%) make up the most common classes of employment.
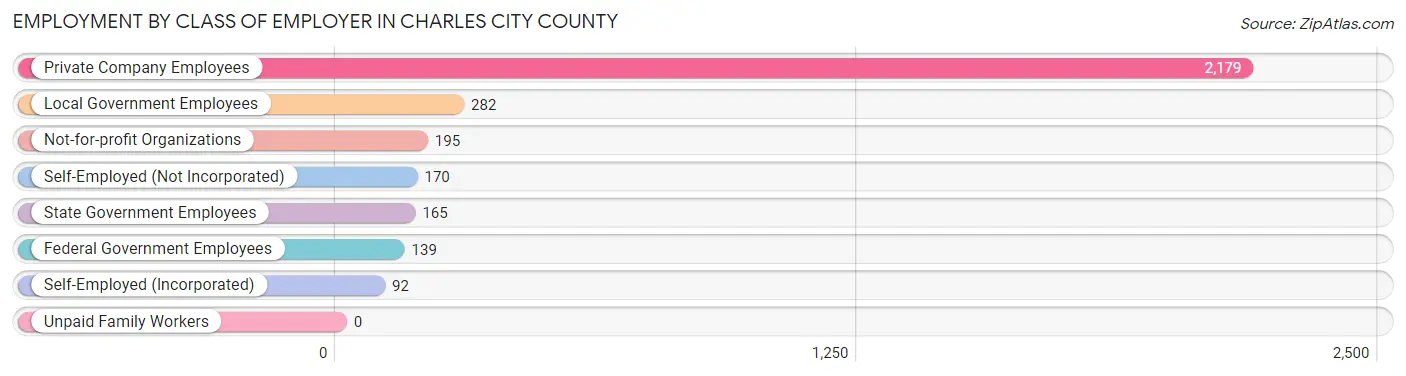
| Employer Class | # Employees | % Employees |
| Private Company Employees | 2,179 | 67.6% |
| Self-Employed (Incorporated) | 92 | 2.9% |
| Self-Employed (Not Incorporated) | 170 | 5.3% |
| Not-for-profit Organizations | 195 | 6.0% |
| Local Government Employees | 282 | 8.7% |
| State Government Employees | 165 | 5.1% |
| Federal Government Employees | 139 | 4.3% |
| Unpaid Family Workers | 0 | 0.0% |
| Total | 3,222 | 100.0% |
Employment Status by Age in Charles City County
According to the labor force statistics for Charles City County, out of the total population over 16 years of age (5,904), 58.2% or 3,436 individuals are in the labor force, with 4.1% or 141 of them unemployed. The age group with the highest labor force participation rate is 35 to 44 years, with 93.3% or 643 individuals in the labor force. Within the labor force, the 16 to 19 years age range has the highest percentage of unemployed individuals, with 12.9% or 20 of them being unemployed.
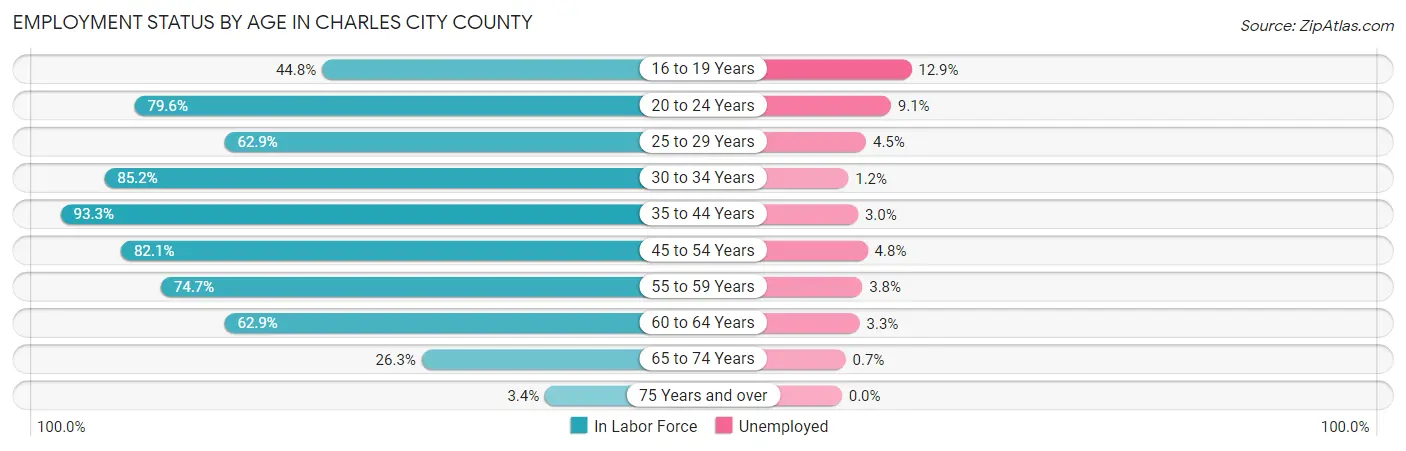
| Age Bracket | In Labor Force | Unemployed |
| 16 to 19 Years | 155 (44.8%) | 20 (12.9%) |
| 20 to 24 Years | 187 (79.6%) | 17 (9.1%) |
| 25 to 29 Years | 229 (62.9%) | 10 (4.5%) |
| 30 to 34 Years | 253 (85.2%) | 3 (1.2%) |
| 35 to 44 Years | 643 (93.3%) | 19 (3.0%) |
| 45 to 54 Years | 749 (82.1%) | 36 (4.8%) |
| 55 to 59 Years | 523 (74.7%) | 20 (3.8%) |
| 60 to 64 Years | 396 (62.9%) | 13 (3.3%) |
| 65 to 74 Years | 276 (26.3%) | 2 (0.7%) |
| 75 Years and over | 23 (3.4%) | 0 (0.0%) |
| Total | 3,436 (58.2%) | 141 (4.1%) |
Employment Status by Educational Attainment in Charles City County
According to labor force statistics for Charles City County, 77.8% of individuals (2,795) out of the total population between 25 and 64 years of age (3,592) are in the labor force, with 3.6% or 101 of them being unemployed. The group with the highest labor force participation rate are those with the educational attainment of bachelor's degree or higher, with 89.5% or 556 individuals in the labor force. Within the labor force, individuals with less than high school education have the highest percentage of unemployment, with 7.0% or 18 of them being unemployed.
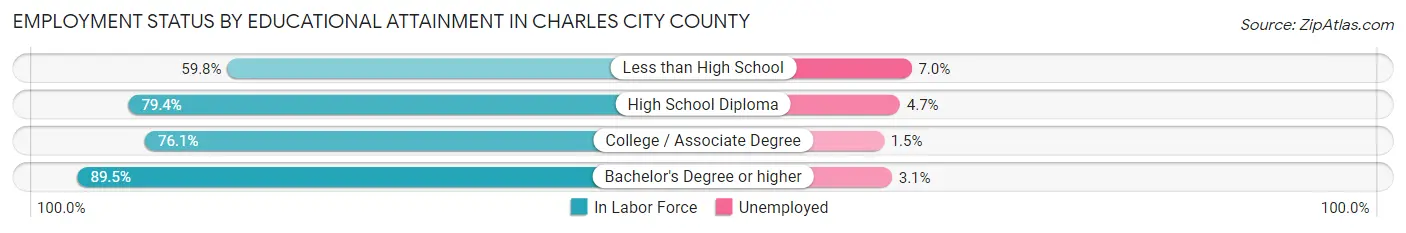
| Educational Attainment | In Labor Force | Unemployed |
| Less than High School | 257 (59.8%) | 30 (7.0%) |
| High School Diploma | 1,118 (79.4%) | 66 (4.7%) |
| College / Associate Degree | 862 (76.1%) | 17 (1.5%) |
| Bachelor's Degree or higher | 556 (89.5%) | 19 (3.1%) |
| Total | 2,795 (77.8%) | 129 (3.6%) |
Employment Occupations by Sex in Charles City County
Management, Business, Science and Arts Occupations
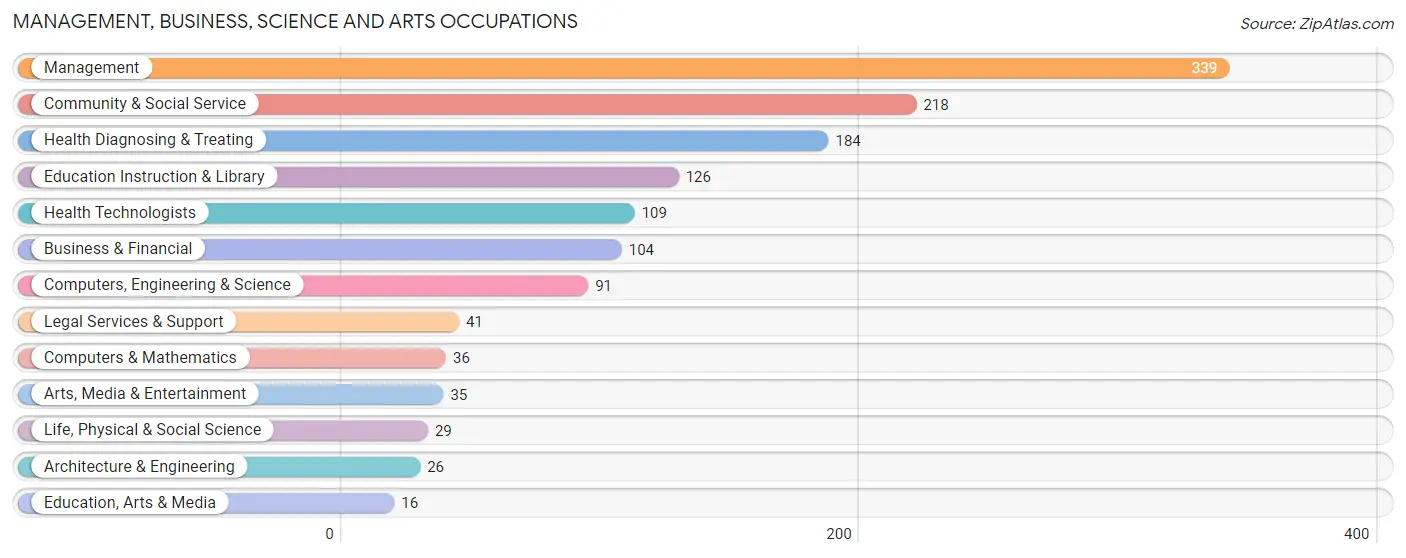
The most common Management, Business, Science and Arts occupations in Charles City County are Management (339 | 10.3%), Community & Social Service (218 | 6.7%), Health Diagnosing & Treating (184 | 5.6%), Education Instruction & Library (126 | 3.8%), and Health Technologists (109 | 3.3%).
Management, Business, Science and Arts Occupations by Sex
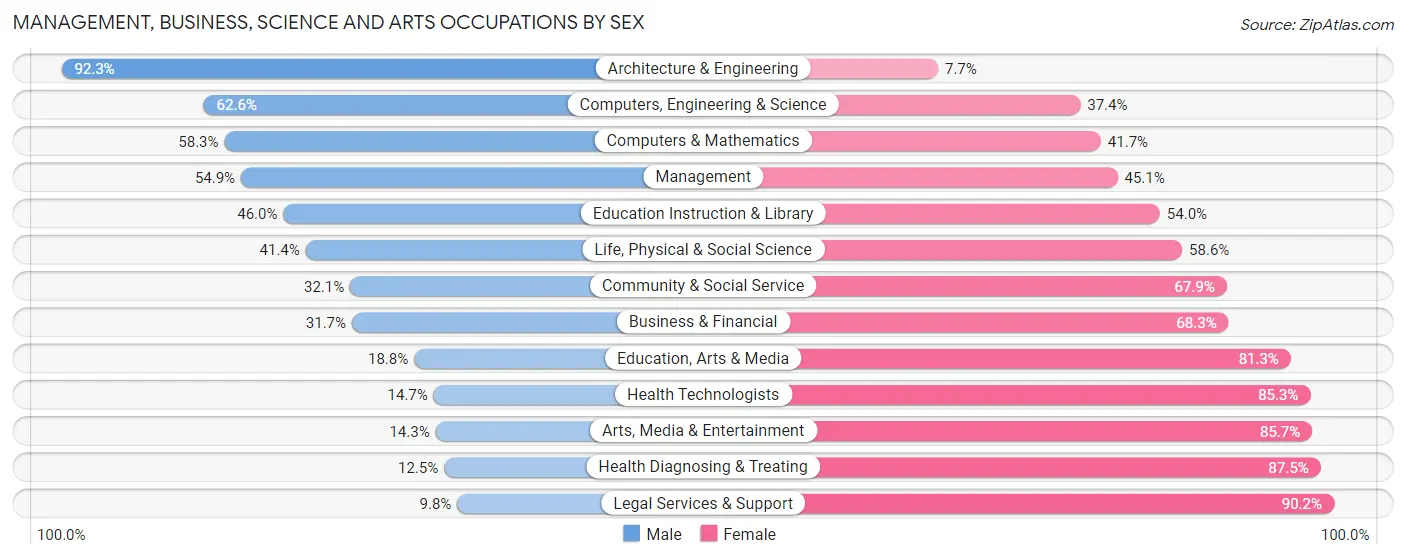
Within the Management, Business, Science and Arts occupations in Charles City County, the most male-oriented occupations are Architecture & Engineering (92.3%), Computers, Engineering & Science (62.6%), and Computers & Mathematics (58.3%), while the most female-oriented occupations are Legal Services & Support (90.2%), Health Diagnosing & Treating (87.5%), and Arts, Media & Entertainment (85.7%).
| Occupation | Male | Female |
| Management | 186 (54.9%) | 153 (45.1%) |
| Business & Financial | 33 (31.7%) | 71 (68.3%) |
| Computers, Engineering & Science | 57 (62.6%) | 34 (37.4%) |
| Computers & Mathematics | 21 (58.3%) | 15 (41.7%) |
| Architecture & Engineering | 24 (92.3%) | 2 (7.7%) |
| Life, Physical & Social Science | 12 (41.4%) | 17 (58.6%) |
| Community & Social Service | 70 (32.1%) | 148 (67.9%) |
| Education, Arts & Media | 3 (18.8%) | 13 (81.2%) |
| Legal Services & Support | 4 (9.8%) | 37 (90.2%) |
| Education Instruction & Library | 58 (46.0%) | 68 (54.0%) |
| Arts, Media & Entertainment | 5 (14.3%) | 30 (85.7%) |
| Health Diagnosing & Treating | 23 (12.5%) | 161 (87.5%) |
| Health Technologists | 16 (14.7%) | 93 (85.3%) |
| Total (Category) | 369 (39.4%) | 567 (60.6%) |
| Total (Overall) | 1,734 (52.9%) | 1,541 (47.0%) |
Services Occupations
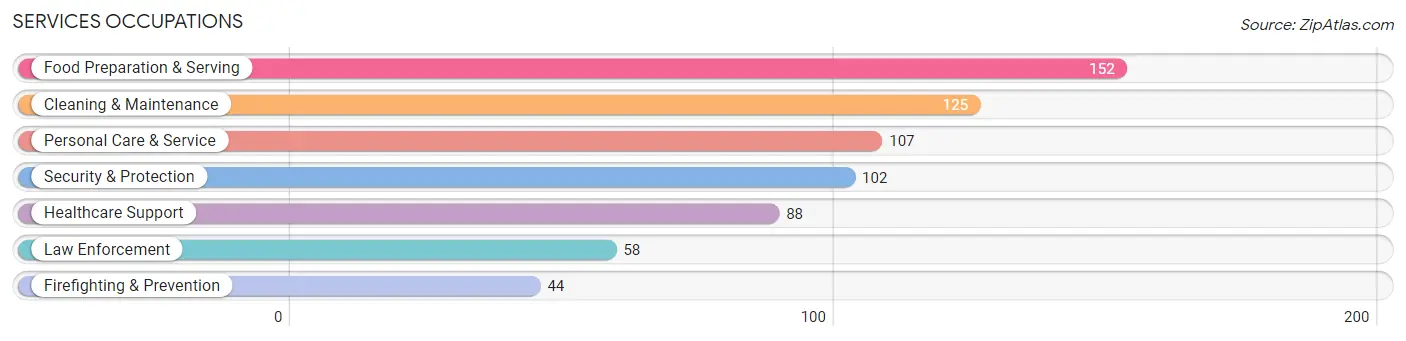
The most common Services occupations in Charles City County are Food Preparation & Serving (152 | 4.6%), Cleaning & Maintenance (125 | 3.8%), Personal Care & Service (107 | 3.3%), Security & Protection (102 | 3.1%), and Healthcare Support (88 | 2.7%).
Services Occupations by Sex
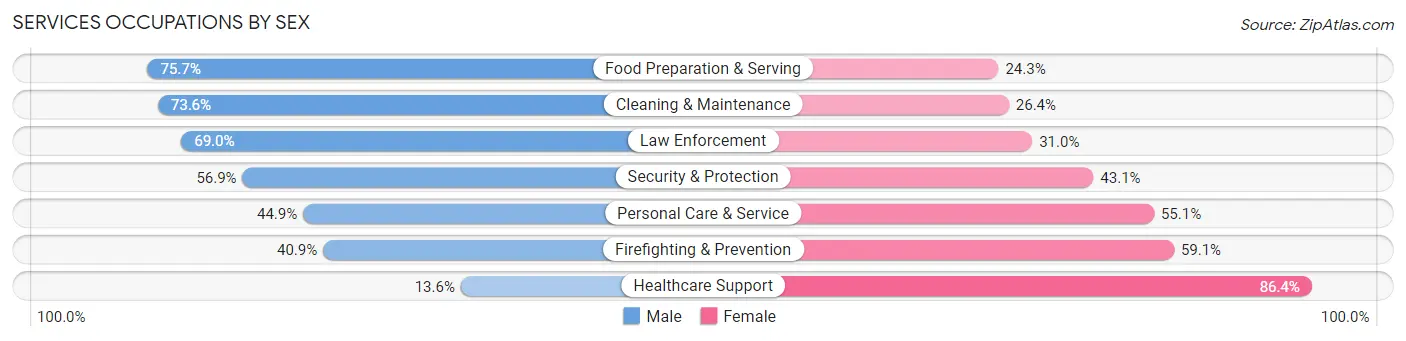
Within the Services occupations in Charles City County, the most male-oriented occupations are Food Preparation & Serving (75.7%), Cleaning & Maintenance (73.6%), and Law Enforcement (69.0%), while the most female-oriented occupations are Healthcare Support (86.4%), Firefighting & Prevention (59.1%), and Personal Care & Service (55.1%).
| Occupation | Male | Female |
| Healthcare Support | 12 (13.6%) | 76 (86.4%) |
| Security & Protection | 58 (56.9%) | 44 (43.1%) |
| Firefighting & Prevention | 18 (40.9%) | 26 (59.1%) |
| Law Enforcement | 40 (69.0%) | 18 (31.0%) |
| Food Preparation & Serving | 115 (75.7%) | 37 (24.3%) |
| Cleaning & Maintenance | 92 (73.6%) | 33 (26.4%) |
| Personal Care & Service | 48 (44.9%) | 59 (55.1%) |
| Total (Category) | 325 (56.6%) | 249 (43.4%) |
| Total (Overall) | 1,734 (52.9%) | 1,541 (47.0%) |
Sales and Office Occupations
The most common Sales and Office occupations in Charles City County are Office & Administration (426 | 13.0%), and Sales & Related (269 | 8.2%).
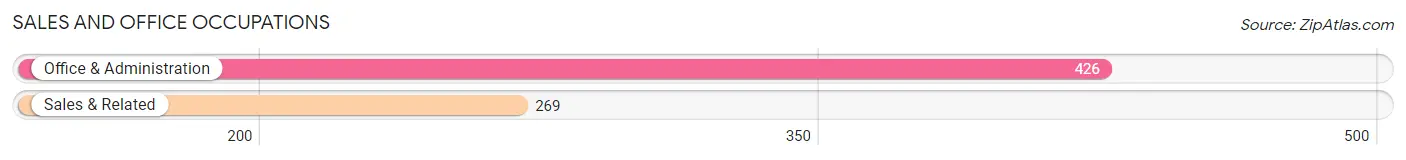
Sales and Office Occupations by Sex
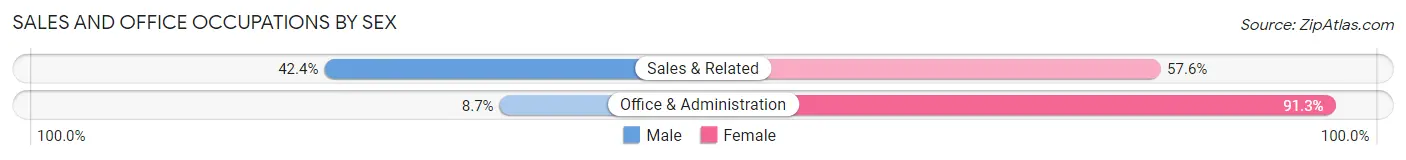
| Occupation | Male | Female |
| Sales & Related | 114 (42.4%) | 155 (57.6%) |
| Office & Administration | 37 (8.7%) | 389 (91.3%) |
| Total (Category) | 151 (21.7%) | 544 (78.3%) |
| Total (Overall) | 1,734 (52.9%) | 1,541 (47.0%) |
Natural Resources, Construction and Maintenance Occupations
The most common Natural Resources, Construction and Maintenance occupations in Charles City County are Installation, Maintenance & Repair (236 | 7.2%), Construction & Extraction (212 | 6.5%), and Farming, Fishing & Forestry (14 | 0.4%).
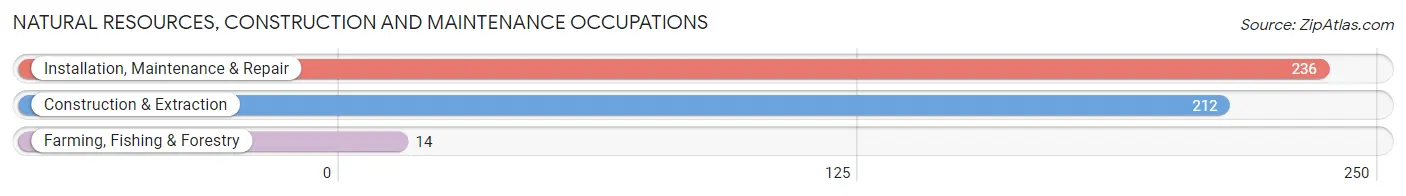
Natural Resources, Construction and Maintenance Occupations by Sex
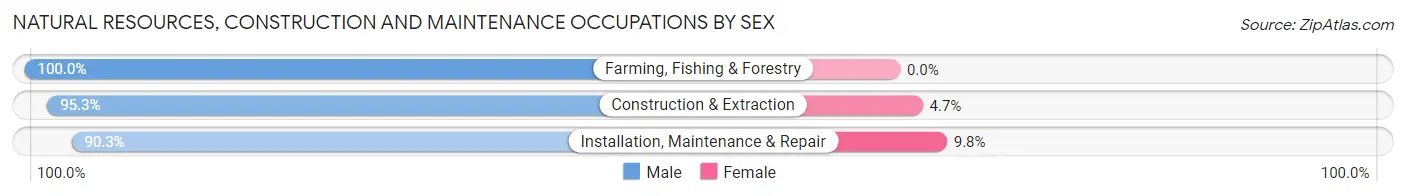
| Occupation | Male | Female |
| Farming, Fishing & Forestry | 14 (100.0%) | 0 (0.0%) |
| Construction & Extraction | 202 (95.3%) | 10 (4.7%) |
| Installation, Maintenance & Repair | 213 (90.2%) | 23 (9.8%) |
| Total (Category) | 429 (92.9%) | 33 (7.1%) |
| Total (Overall) | 1,734 (52.9%) | 1,541 (47.0%) |
Production, Transportation and Moving Occupations
The most common Production, Transportation and Moving occupations in Charles City County are Transportation (240 | 7.3%), Production (234 | 7.1%), and Material Moving (134 | 4.1%).
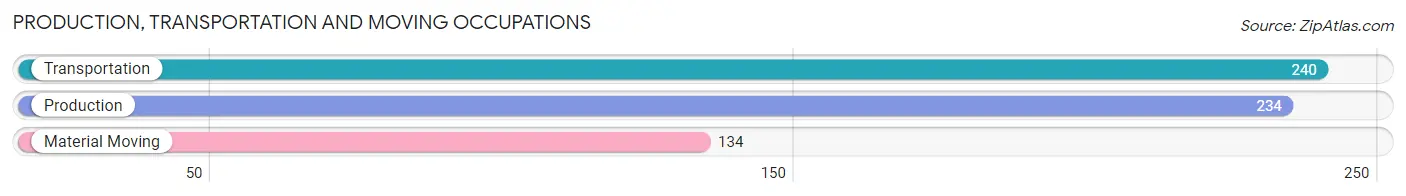
Production, Transportation and Moving Occupations by Sex
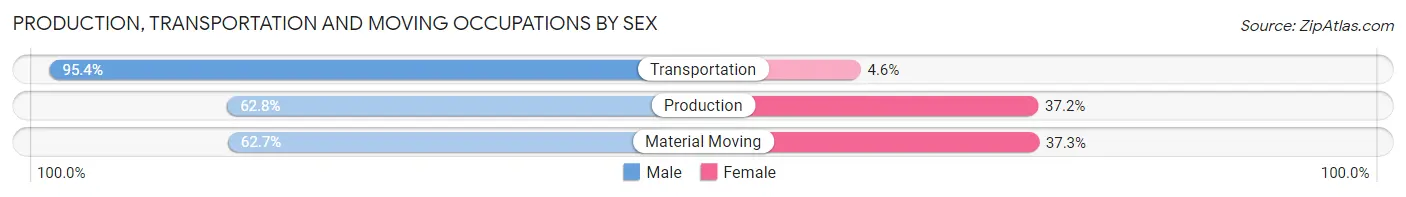
| Occupation | Male | Female |
| Production | 147 (62.8%) | 87 (37.2%) |
| Transportation | 229 (95.4%) | 11 (4.6%) |
| Material Moving | 84 (62.7%) | 50 (37.3%) |
| Total (Category) | 460 (75.7%) | 148 (24.3%) |
| Total (Overall) | 1,734 (52.9%) | 1,541 (47.0%) |
Employment Industries by Sex in Charles City County
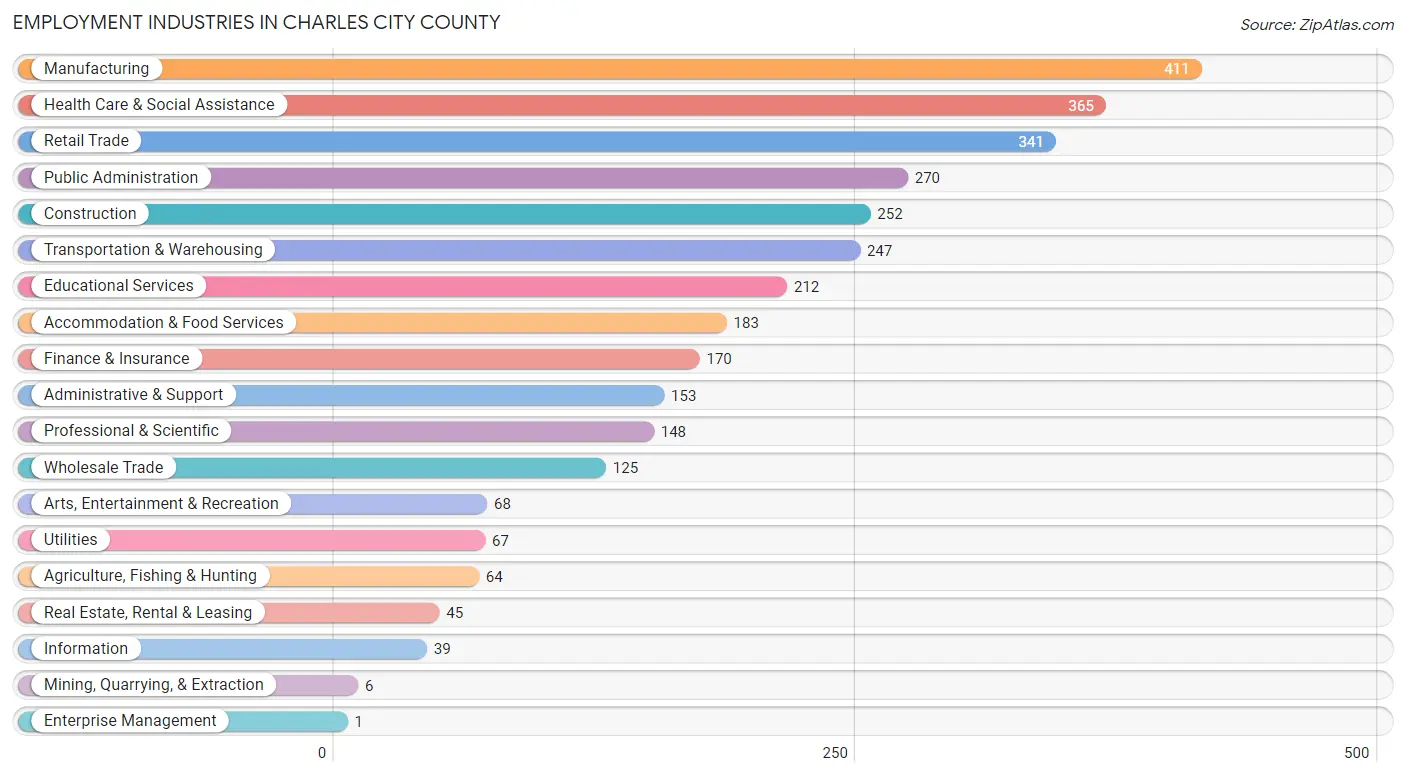
Employment Industries in Charles City County
The major employment industries in Charles City County include Manufacturing (411 | 12.6%), Health Care & Social Assistance (365 | 11.2%), Retail Trade (341 | 10.4%), Public Administration (270 | 8.2%), and Construction (252 | 7.7%).
Employment Industries by Sex in Charles City County
The Charles City County industries that see more men than women are Mining, Quarrying, & Extraction (100.0%), Agriculture, Fishing & Hunting (92.2%), and Construction (84.1%), whereas the industries that tend to have a higher number of women are Enterprise Management (100.0%), Finance & Insurance (92.3%), and Information (82.1%).
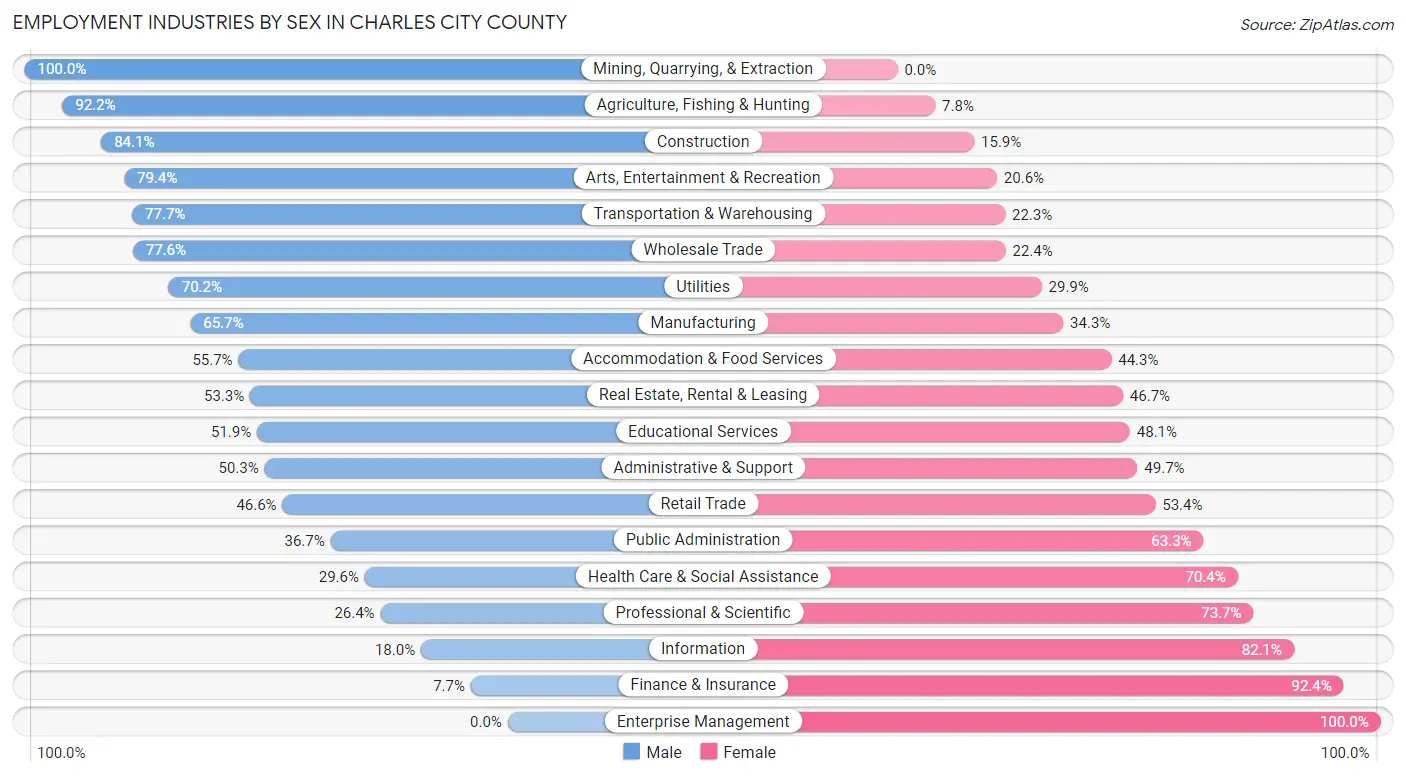
| Industry | Male | Female |
| Agriculture, Fishing & Hunting | 59 (92.2%) | 5 (7.8%) |
| Mining, Quarrying, & Extraction | 6 (100.0%) | 0 (0.0%) |
| Construction | 212 (84.1%) | 40 (15.9%) |
| Manufacturing | 270 (65.7%) | 141 (34.3%) |
| Wholesale Trade | 97 (77.6%) | 28 (22.4%) |
| Retail Trade | 159 (46.6%) | 182 (53.4%) |
| Transportation & Warehousing | 192 (77.7%) | 55 (22.3%) |
| Utilities | 47 (70.2%) | 20 (29.8%) |
| Information | 7 (17.9%) | 32 (82.1%) |
| Finance & Insurance | 13 (7.6%) | 157 (92.3%) |
| Real Estate, Rental & Leasing | 24 (53.3%) | 21 (46.7%) |
| Professional & Scientific | 39 (26.4%) | 109 (73.7%) |
| Enterprise Management | 0 (0.0%) | 1 (100.0%) |
| Administrative & Support | 77 (50.3%) | 76 (49.7%) |
| Educational Services | 110 (51.9%) | 102 (48.1%) |
| Health Care & Social Assistance | 108 (29.6%) | 257 (70.4%) |
| Arts, Entertainment & Recreation | 54 (79.4%) | 14 (20.6%) |
| Accommodation & Food Services | 102 (55.7%) | 81 (44.3%) |
| Public Administration | 99 (36.7%) | 171 (63.3%) |
| Total | 1,734 (52.9%) | 1,541 (47.0%) |
Education in Charles City County
School Enrollment in Charles City County
The most common levels of schooling among the 1,092 students in Charles City County are high school (316 | 28.9%), middle school (254 | 23.3%), and elementary school (168 | 15.4%).
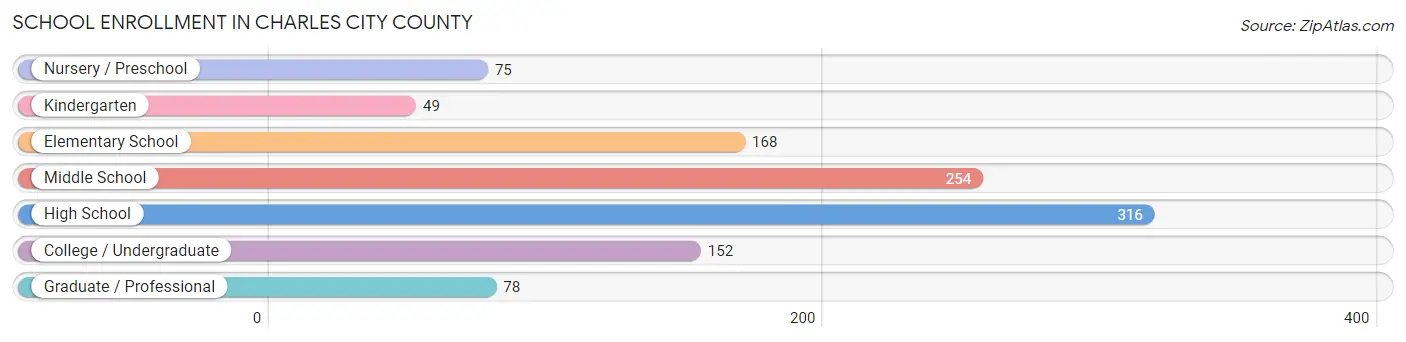
| School Level | # Students | % Students |
| Nursery / Preschool | 75 | 6.9% |
| Kindergarten | 49 | 4.5% |
| Elementary School | 168 | 15.4% |
| Middle School | 254 | 23.3% |
| High School | 316 | 28.9% |
| College / Undergraduate | 152 | 13.9% |
| Graduate / Professional | 78 | 7.1% |
| Total | 1,092 | 100.0% |
School Enrollment by Age by Funding Source in Charles City County
Out of a total of 1,092 students who are enrolled in schools in Charles City County, 217 (19.9%) attend a private institution, while the remaining 875 (80.1%) are enrolled in public schools. The age group of 3 to 4 year olds has the highest likelihood of being enrolled in private schools, with 24 (57.1% in the age bracket) enrolled. Conversely, the age group of 18 to 19 year olds has the lowest likelihood of being enrolled in a private school, with 112 (91.8% in the age bracket) attending a public institution.
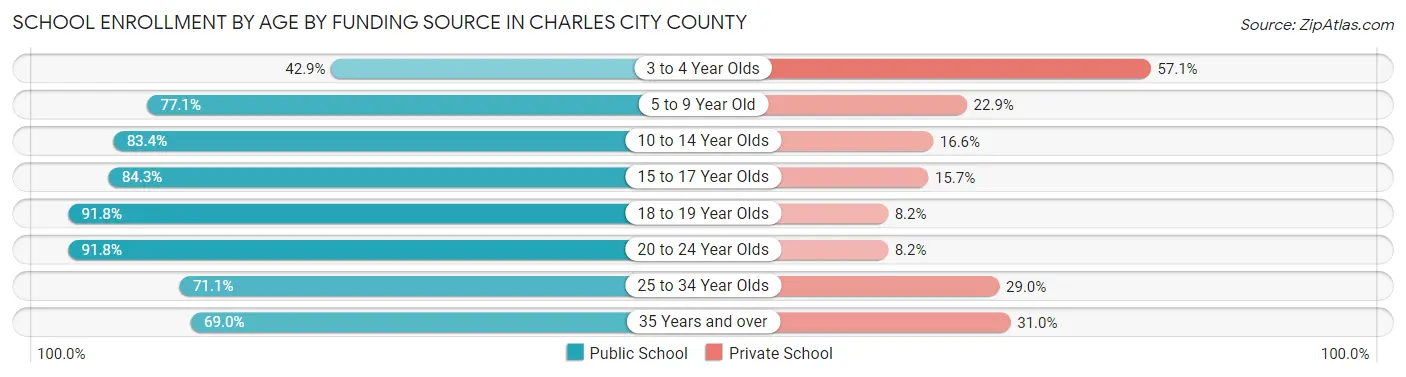
| Age Bracket | Public School | Private School |
| 3 to 4 Year Olds | 18 (42.9%) | 24 (57.1%) |
| 5 to 9 Year Old | 175 (77.1%) | 52 (22.9%) |
| 10 to 14 Year Olds | 246 (83.4%) | 49 (16.6%) |
| 15 to 17 Year Olds | 161 (84.3%) | 30 (15.7%) |
| 18 to 19 Year Olds | 112 (91.8%) | 10 (8.2%) |
| 20 to 24 Year Olds | 56 (91.8%) | 5 (8.2%) |
| 25 to 34 Year Olds | 27 (71.1%) | 11 (28.9%) |
| 35 Years and over | 80 (69.0%) | 36 (31.0%) |
| Total | 875 (80.1%) | 217 (19.9%) |
Educational Attainment by Field of Study in Charles City County
Business (188 | 20.4%), education (105 | 11.4%), science & technology (104 | 11.3%), social sciences (99 | 10.8%), and bio, nature & agricultural (67 | 7.3%) are the most common fields of study among 920 individuals in Charles City County who have obtained a bachelor's degree or higher.
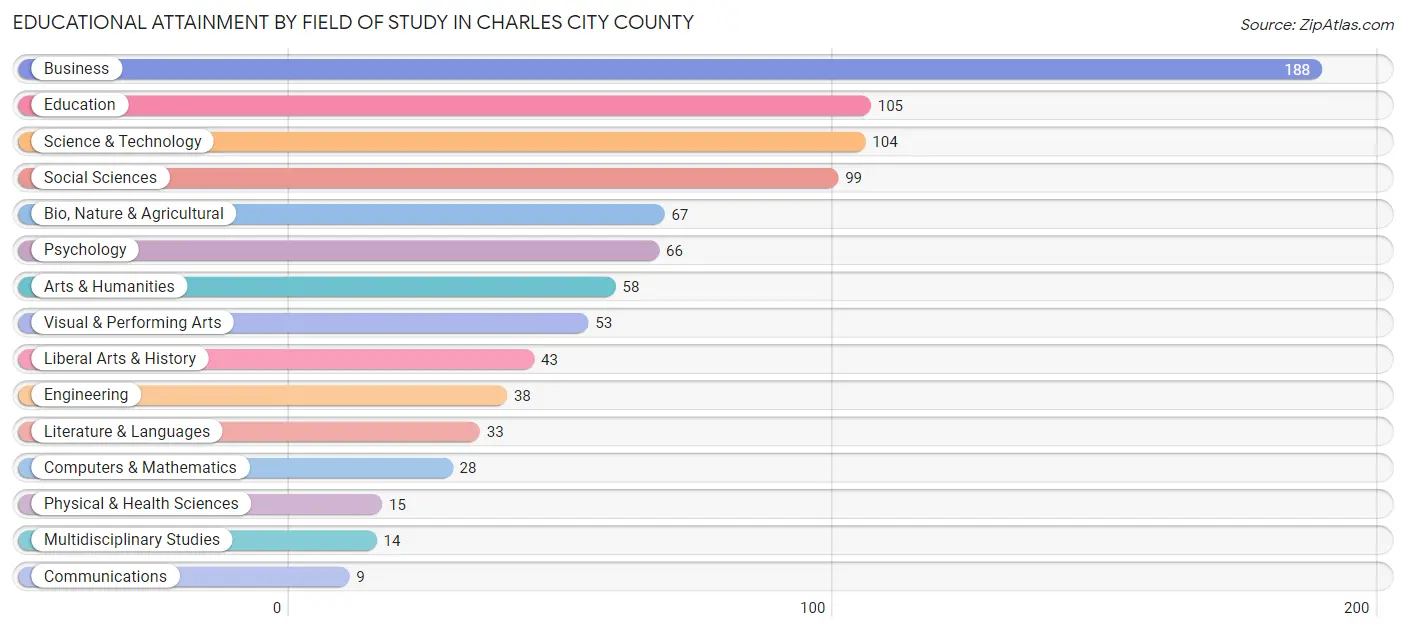
| Field of Study | # Graduates | % Graduates |
| Computers & Mathematics | 28 | 3.0% |
| Bio, Nature & Agricultural | 67 | 7.3% |
| Physical & Health Sciences | 15 | 1.6% |
| Psychology | 66 | 7.2% |
| Social Sciences | 99 | 10.8% |
| Engineering | 38 | 4.1% |
| Multidisciplinary Studies | 14 | 1.5% |
| Science & Technology | 104 | 11.3% |
| Business | 188 | 20.4% |
| Education | 105 | 11.4% |
| Literature & Languages | 33 | 3.6% |
| Liberal Arts & History | 43 | 4.7% |
| Visual & Performing Arts | 53 | 5.8% |
| Communications | 9 | 1.0% |
| Arts & Humanities | 58 | 6.3% |
| Total | 920 | 100.0% |
Transportation & Commute in Charles City County
Vehicle Availability by Sex in Charles City County
The most prevalent vehicle ownership categories in Charles City County are males with 2 vehicles (519, accounting for 30.0%) and females with 2 vehicles (463, making up 34.8%).
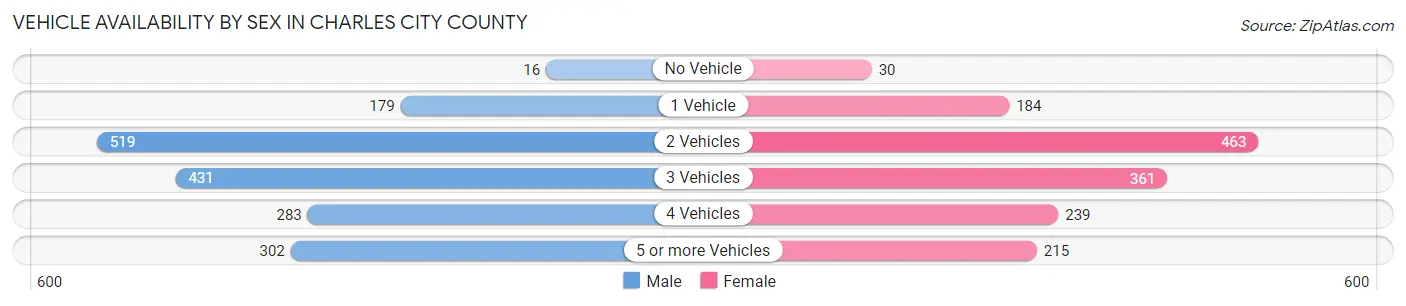
| Vehicles Available | Male | Female |
| No Vehicle | 16 (0.9%) | 30 (2.0%) |
| 1 Vehicle | 179 (10.3%) | 184 (12.3%) |
| 2 Vehicles | 519 (30.0%) | 463 (31.0%) |
| 3 Vehicles | 431 (24.9%) | 361 (24.2%) |
| 4 Vehicles | 283 (16.4%) | 239 (16.0%) |
| 5 or more Vehicles | 302 (17.5%) | 215 (14.4%) |
| Total | 1,730 (100.0%) | 1,492 (100.0%) |
Commute Time in Charles City County
The most frequently occuring commute durations in Charles City County are 30 to 34 minutes (627 commuters, 21.0%), 45 to 59 minutes (599 commuters, 20.1%), and 40 to 44 minutes (296 commuters, 9.9%).
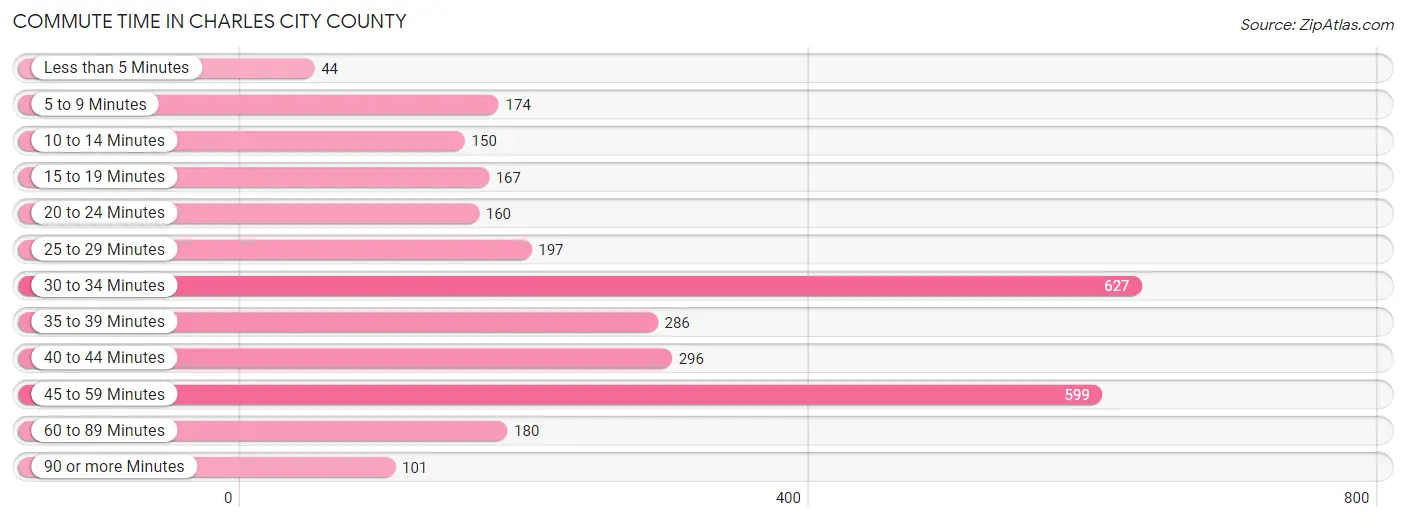
| Commute Time | # Commuters | % Commuters |
| Less than 5 Minutes | 44 | 1.5% |
| 5 to 9 Minutes | 174 | 5.8% |
| 10 to 14 Minutes | 150 | 5.0% |
| 15 to 19 Minutes | 167 | 5.6% |
| 20 to 24 Minutes | 160 | 5.4% |
| 25 to 29 Minutes | 197 | 6.6% |
| 30 to 34 Minutes | 627 | 21.0% |
| 35 to 39 Minutes | 286 | 9.6% |
| 40 to 44 Minutes | 296 | 9.9% |
| 45 to 59 Minutes | 599 | 20.1% |
| 60 to 89 Minutes | 180 | 6.0% |
| 90 or more Minutes | 101 | 3.4% |
Commute Time by Sex in Charles City County
The most common commute times in Charles City County are 30 to 34 minutes (379 commuters, 23.4%) for males and 45 to 59 minutes (281 commuters, 20.6%) for females.
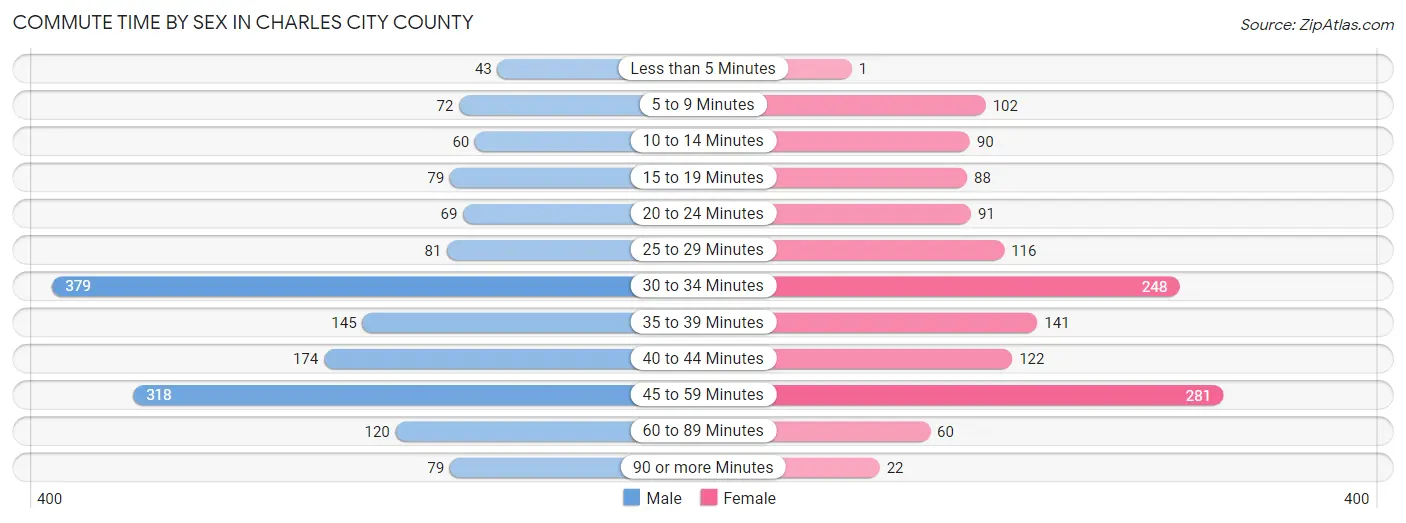
| Commute Time | Male | Female |
| Less than 5 Minutes | 43 (2.7%) | 1 (0.1%) |
| 5 to 9 Minutes | 72 (4.4%) | 102 (7.5%) |
| 10 to 14 Minutes | 60 (3.7%) | 90 (6.6%) |
| 15 to 19 Minutes | 79 (4.9%) | 88 (6.5%) |
| 20 to 24 Minutes | 69 (4.3%) | 91 (6.7%) |
| 25 to 29 Minutes | 81 (5.0%) | 116 (8.5%) |
| 30 to 34 Minutes | 379 (23.4%) | 248 (18.2%) |
| 35 to 39 Minutes | 145 (9.0%) | 141 (10.3%) |
| 40 to 44 Minutes | 174 (10.7%) | 122 (9.0%) |
| 45 to 59 Minutes | 318 (19.6%) | 281 (20.6%) |
| 60 to 89 Minutes | 120 (7.4%) | 60 (4.4%) |
| 90 or more Minutes | 79 (4.9%) | 22 (1.6%) |
Time of Departure to Work by Sex in Charles City County
The most frequent times of departure to work in Charles City County are 6:00 AM to 6:29 AM (302, 18.6%) for males and 7:00 AM to 7:29 AM (275, 20.2%) for females.
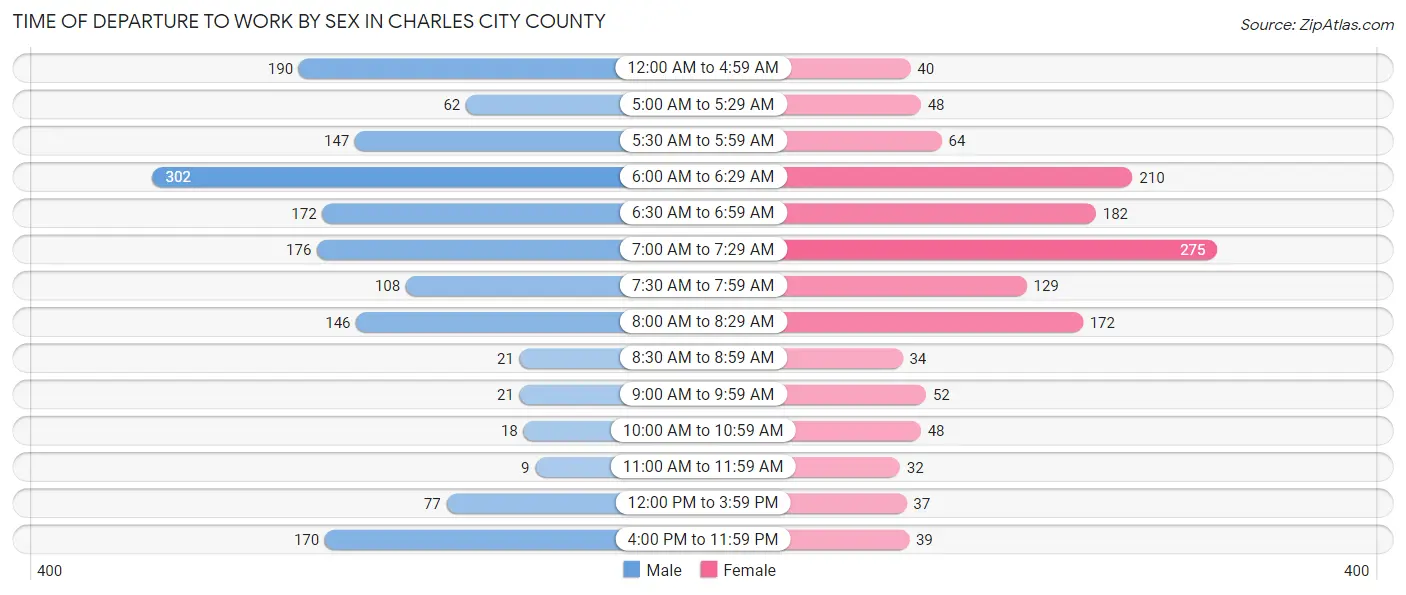
| Time of Departure | Male | Female |
| 12:00 AM to 4:59 AM | 190 (11.7%) | 40 (2.9%) |
| 5:00 AM to 5:29 AM | 62 (3.8%) | 48 (3.5%) |
| 5:30 AM to 5:59 AM | 147 (9.1%) | 64 (4.7%) |
| 6:00 AM to 6:29 AM | 302 (18.6%) | 210 (15.4%) |
| 6:30 AM to 6:59 AM | 172 (10.6%) | 182 (13.4%) |
| 7:00 AM to 7:29 AM | 176 (10.9%) | 275 (20.2%) |
| 7:30 AM to 7:59 AM | 108 (6.7%) | 129 (9.5%) |
| 8:00 AM to 8:29 AM | 146 (9.0%) | 172 (12.6%) |
| 8:30 AM to 8:59 AM | 21 (1.3%) | 34 (2.5%) |
| 9:00 AM to 9:59 AM | 21 (1.3%) | 52 (3.8%) |
| 10:00 AM to 10:59 AM | 18 (1.1%) | 48 (3.5%) |
| 11:00 AM to 11:59 AM | 9 (0.6%) | 32 (2.4%) |
| 12:00 PM to 3:59 PM | 77 (4.8%) | 37 (2.7%) |
| 4:00 PM to 11:59 PM | 170 (10.5%) | 39 (2.9%) |
| Total | 1,619 (100.0%) | 1,362 (100.0%) |
Housing Occupancy in Charles City County
Occupancy by Ownership in Charles City County
Of the total 2,905 dwellings in Charles City County, owner-occupied units account for 2,459 (84.7%), while renter-occupied units make up 446 (15.3%).
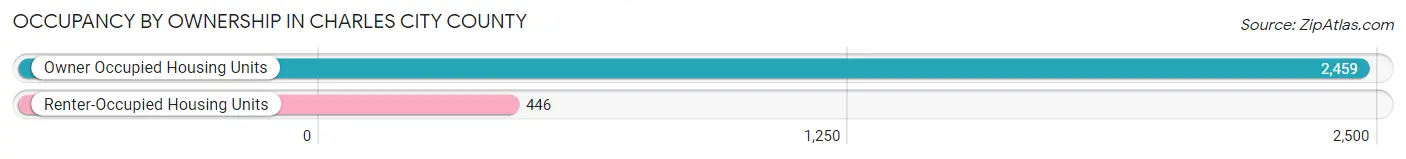
| Occupancy | # Housing Units | % Housing Units |
| Owner Occupied Housing Units | 2,459 | 84.7% |
| Renter-Occupied Housing Units | 446 | 15.3% |
| Total Occupied Housing Units | 2,905 | 100.0% |
Occupancy by Household Size in Charles City County
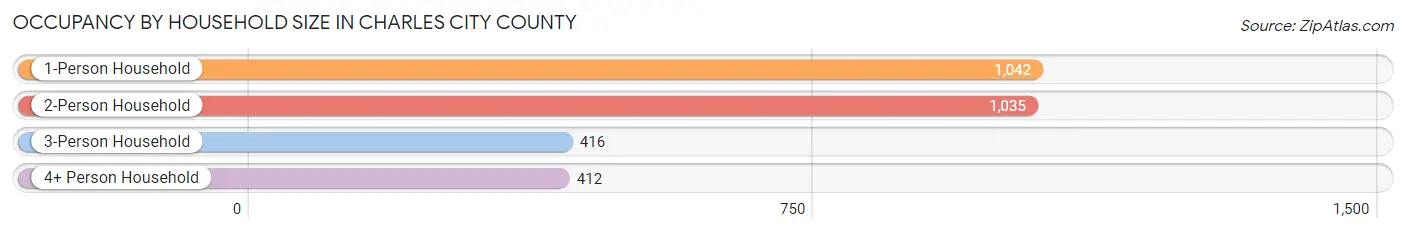
| Household Size | # Housing Units | % Housing Units |
| 1-Person Household | 1,042 | 35.9% |
| 2-Person Household | 1,035 | 35.6% |
| 3-Person Household | 416 | 14.3% |
| 4+ Person Household | 412 | 14.2% |
| Total Housing Units | 2,905 | 100.0% |
Occupancy by Ownership by Household Size in Charles City County
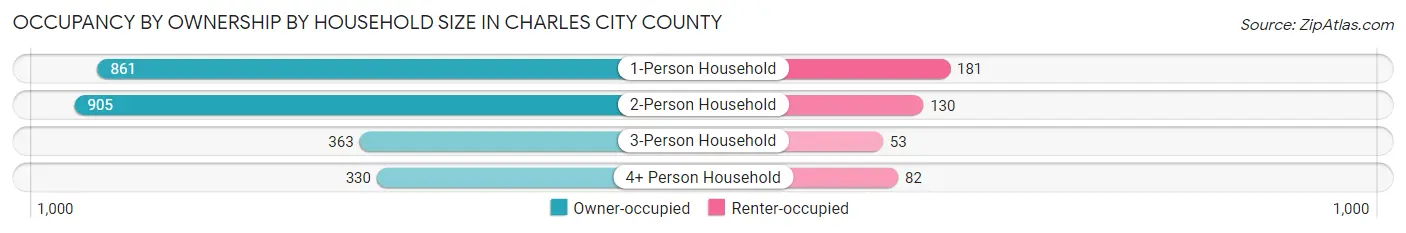
| Household Size | Owner-occupied | Renter-occupied |
| 1-Person Household | 861 (82.6%) | 181 (17.4%) |
| 2-Person Household | 905 (87.4%) | 130 (12.6%) |
| 3-Person Household | 363 (87.3%) | 53 (12.7%) |
| 4+ Person Household | 330 (80.1%) | 82 (19.9%) |
| Total Housing Units | 2,459 (84.7%) | 446 (15.3%) |
Occupancy by Educational Attainment in Charles City County
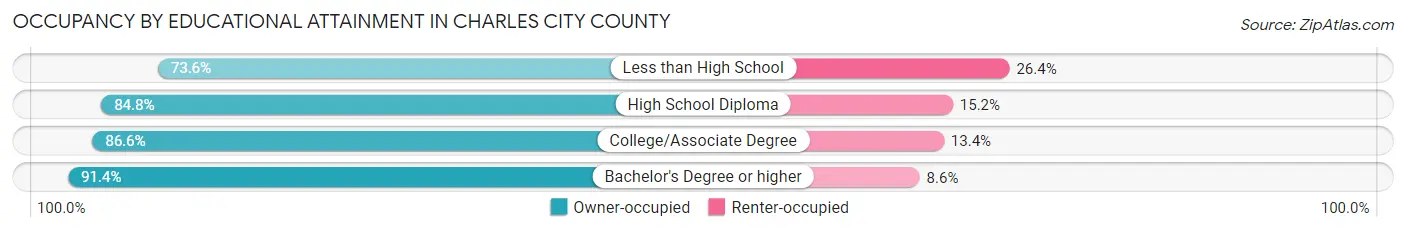
| Household Size | Owner-occupied | Renter-occupied |
| Less than High School | 334 (73.6%) | 120 (26.4%) |
| High School Diploma | 971 (84.8%) | 174 (15.2%) |
| College/Associate Degree | 709 (86.6%) | 110 (13.4%) |
| Bachelor's Degree or higher | 445 (91.4%) | 42 (8.6%) |
Occupancy by Age of Householder in Charles City County
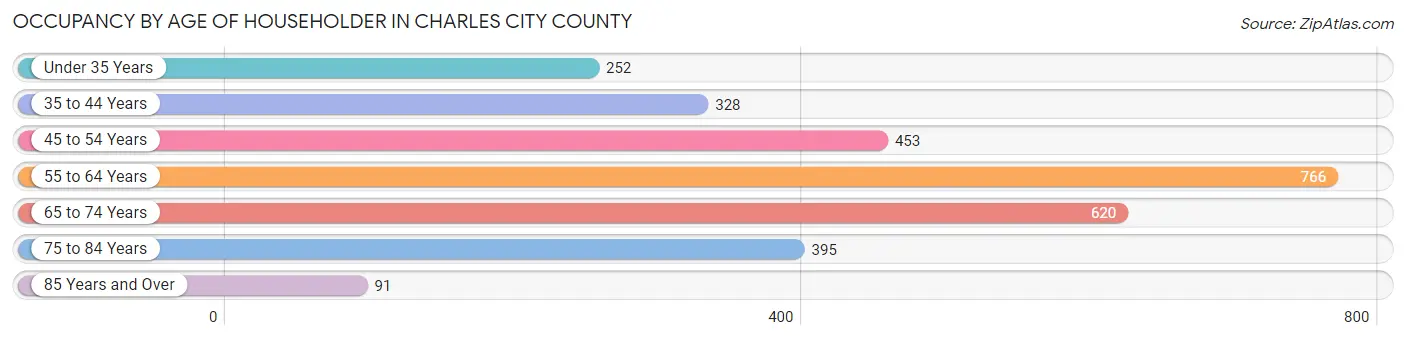
| Age Bracket | # Households | % Households |
| Under 35 Years | 252 | 8.7% |
| 35 to 44 Years | 328 | 11.3% |
| 45 to 54 Years | 453 | 15.6% |
| 55 to 64 Years | 766 | 26.4% |
| 65 to 74 Years | 620 | 21.3% |
| 75 to 84 Years | 395 | 13.6% |
| 85 Years and Over | 91 | 3.1% |
| Total | 2,905 | 100.0% |
Housing Finances in Charles City County
Median Income by Occupancy in Charles City County
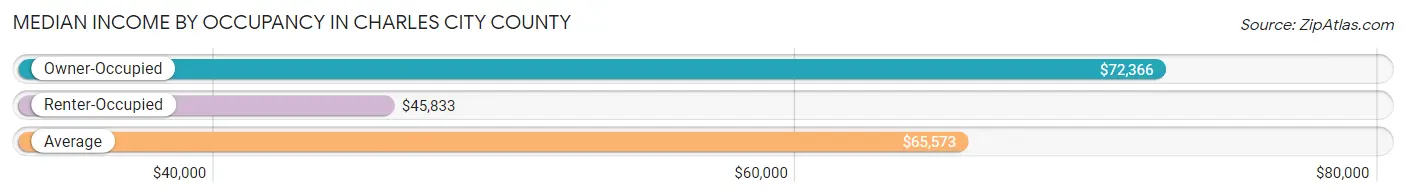
| Occupancy Type | # Households | Median Income |
| Owner-Occupied | 2,459 (84.7%) | $72,366 |
| Renter-Occupied | 446 (15.3%) | $45,833 |
| Average | 2,905 (100.0%) | $65,573 |
Occupancy by Householder Income Bracket in Charles City County
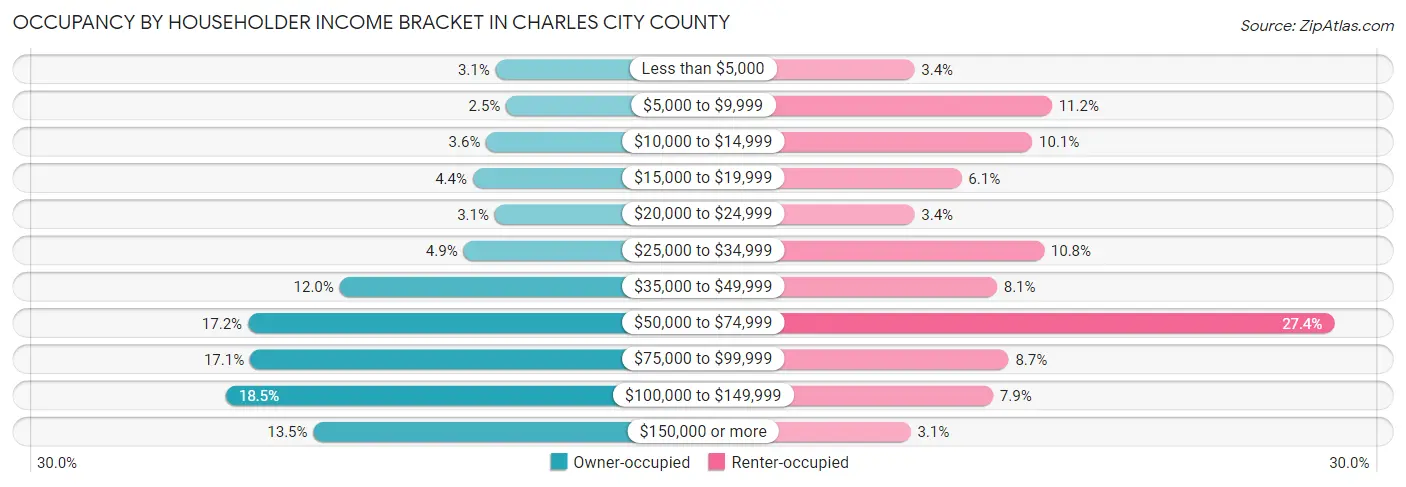
| Income Bracket | Owner-occupied | Renter-occupied |
| Less than $5,000 | 76 (3.1%) | 15 (3.4%) |
| $5,000 to $9,999 | 61 (2.5%) | 50 (11.2%) |
| $10,000 to $14,999 | 89 (3.6%) | 45 (10.1%) |
| $15,000 to $19,999 | 108 (4.4%) | 27 (6.0%) |
| $20,000 to $24,999 | 77 (3.1%) | 15 (3.4%) |
| $25,000 to $34,999 | 121 (4.9%) | 48 (10.8%) |
| $35,000 to $49,999 | 295 (12.0%) | 36 (8.1%) |
| $50,000 to $74,999 | 424 (17.2%) | 122 (27.4%) |
| $75,000 to $99,999 | 421 (17.1%) | 39 (8.7%) |
| $100,000 to $149,999 | 455 (18.5%) | 35 (7.9%) |
| $150,000 or more | 332 (13.5%) | 14 (3.1%) |
| Total | 2,459 (100.0%) | 446 (100.0%) |
Monthly Housing Cost Tiers in Charles City County
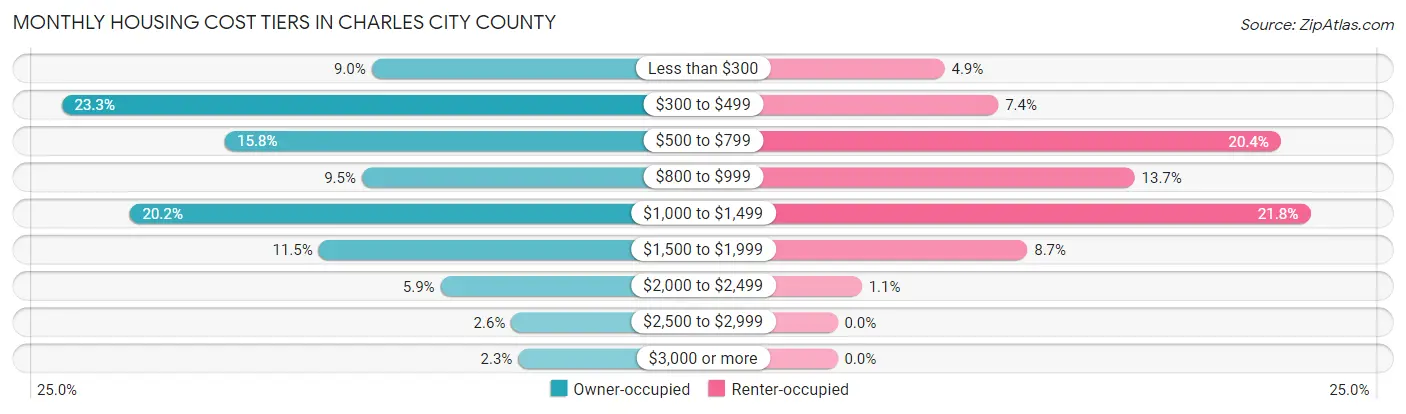
| Monthly Cost | Owner-occupied | Renter-occupied |
| Less than $300 | 222 (9.0%) | 22 (4.9%) |
| $300 to $499 | 573 (23.3%) | 33 (7.4%) |
| $500 to $799 | 389 (15.8%) | 91 (20.4%) |
| $800 to $999 | 233 (9.5%) | 61 (13.7%) |
| $1,000 to $1,499 | 496 (20.2%) | 97 (21.7%) |
| $1,500 to $1,999 | 282 (11.5%) | 39 (8.7%) |
| $2,000 to $2,499 | 144 (5.9%) | 5 (1.1%) |
| $2,500 to $2,999 | 64 (2.6%) | 0 (0.0%) |
| $3,000 or more | 56 (2.3%) | 0 (0.0%) |
| Total | 2,459 (100.0%) | 446 (100.0%) |
Physical Housing Characteristics in Charles City County
Housing Structures in Charles City County
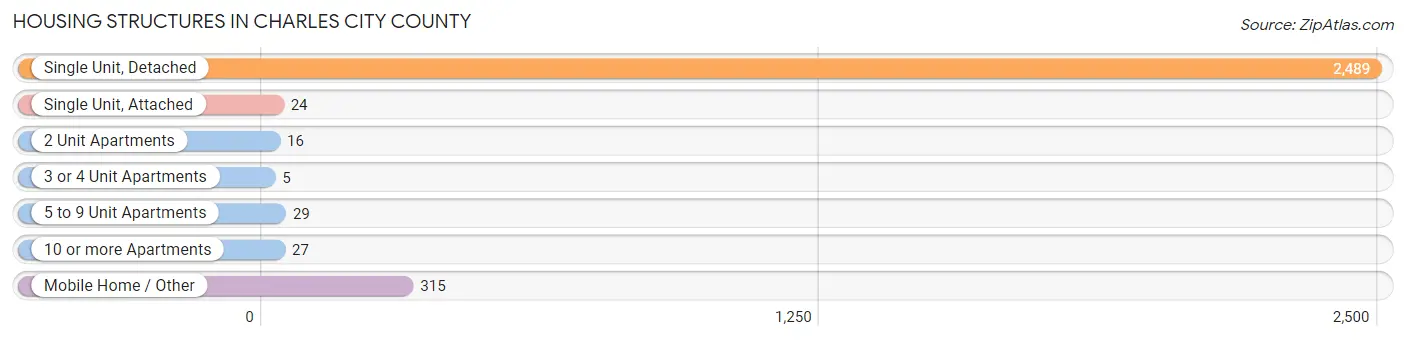
| Structure Type | # Housing Units | % Housing Units |
| Single Unit, Detached | 2,489 | 85.7% |
| Single Unit, Attached | 24 | 0.8% |
| 2 Unit Apartments | 16 | 0.5% |
| 3 or 4 Unit Apartments | 5 | 0.2% |
| 5 to 9 Unit Apartments | 29 | 1.0% |
| 10 or more Apartments | 27 | 0.9% |
| Mobile Home / Other | 315 | 10.8% |
| Total | 2,905 | 100.0% |
Housing Structures by Occupancy in Charles City County
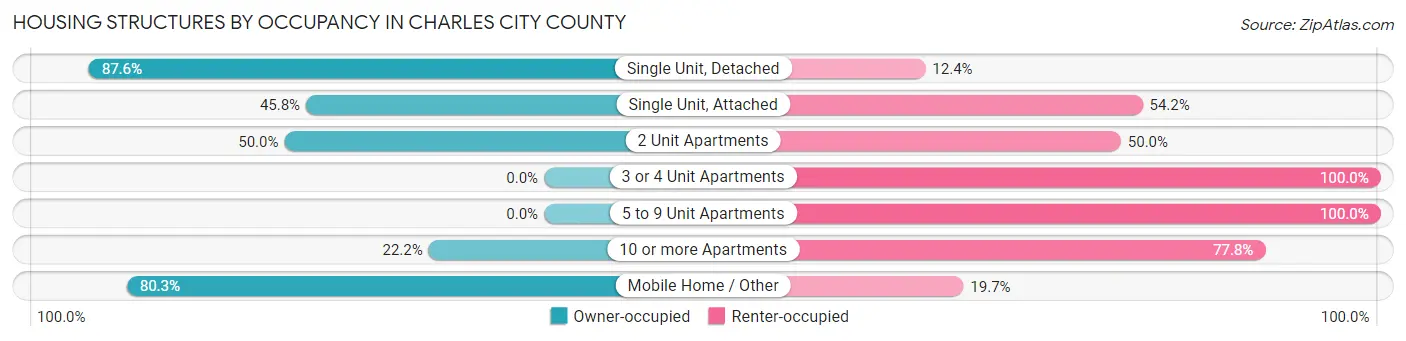
| Structure Type | Owner-occupied | Renter-occupied |
| Single Unit, Detached | 2,181 (87.6%) | 308 (12.4%) |
| Single Unit, Attached | 11 (45.8%) | 13 (54.2%) |
| 2 Unit Apartments | 8 (50.0%) | 8 (50.0%) |
| 3 or 4 Unit Apartments | 0 (0.0%) | 5 (100.0%) |
| 5 to 9 Unit Apartments | 0 (0.0%) | 29 (100.0%) |
| 10 or more Apartments | 6 (22.2%) | 21 (77.8%) |
| Mobile Home / Other | 253 (80.3%) | 62 (19.7%) |
| Total | 2,459 (84.7%) | 446 (15.3%) |
Housing Structures by Number of Rooms in Charles City County
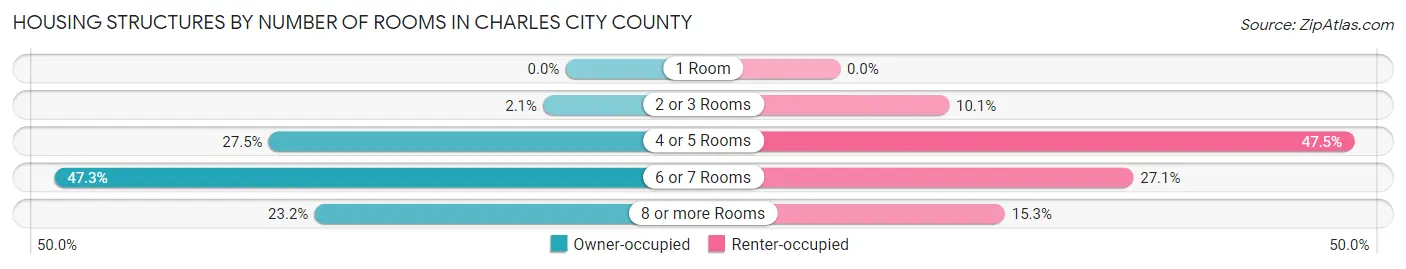
| Number of Rooms | Owner-occupied | Renter-occupied |
| 1 Room | 0 (0.0%) | 0 (0.0%) |
| 2 or 3 Rooms | 51 (2.1%) | 45 (10.1%) |
| 4 or 5 Rooms | 675 (27.5%) | 212 (47.5%) |
| 6 or 7 Rooms | 1,162 (47.2%) | 121 (27.1%) |
| 8 or more Rooms | 571 (23.2%) | 68 (15.2%) |
| Total | 2,459 (100.0%) | 446 (100.0%) |
Housing Structure by Heating Type in Charles City County
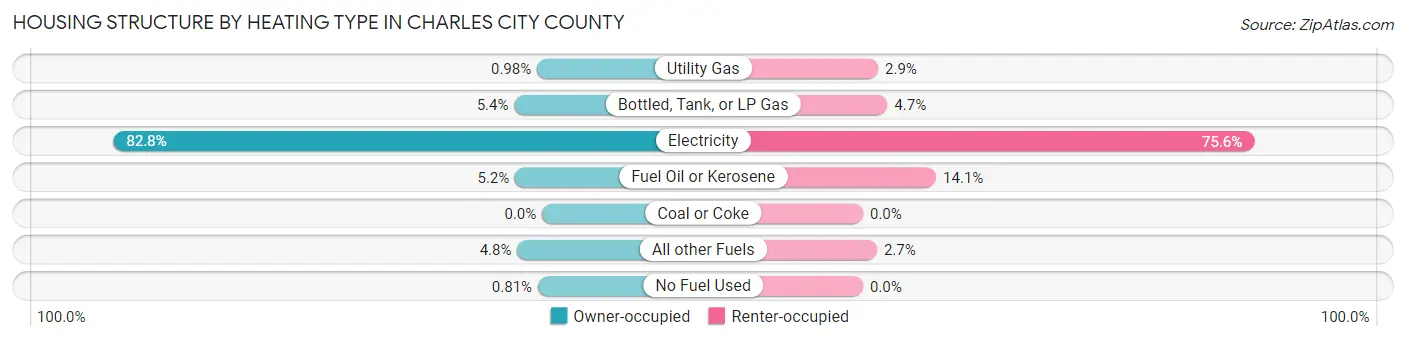
| Heating Type | Owner-occupied | Renter-occupied |
| Utility Gas | 24 (1.0%) | 13 (2.9%) |
| Bottled, Tank, or LP Gas | 132 (5.4%) | 21 (4.7%) |
| Electricity | 2,037 (82.8%) | 337 (75.6%) |
| Fuel Oil or Kerosene | 128 (5.2%) | 63 (14.1%) |
| Coal or Coke | 0 (0.0%) | 0 (0.0%) |
| All other Fuels | 118 (4.8%) | 12 (2.7%) |
| No Fuel Used | 20 (0.8%) | 0 (0.0%) |
| Total | 2,459 (100.0%) | 446 (100.0%) |
Household Vehicle Usage in Charles City County
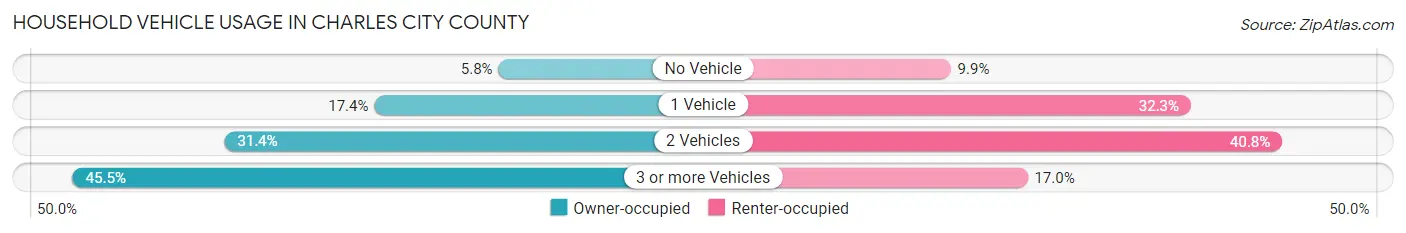
| Vehicles per Household | Owner-occupied | Renter-occupied |
| No Vehicle | 142 (5.8%) | 44 (9.9%) |
| 1 Vehicle | 427 (17.4%) | 144 (32.3%) |
| 2 Vehicles | 771 (31.4%) | 182 (40.8%) |
| 3 or more Vehicles | 1,119 (45.5%) | 76 (17.0%) |
| Total | 2,459 (100.0%) | 446 (100.0%) |
Real Estate & Mortgages in Charles City County
Real Estate and Mortgage Overview in Charles City County
| Characteristic | Without Mortgage | With Mortgage |
| Housing Units | 1,128 | 1,331 |
| Median Property Value | $167,100 | $221,600 |
| Median Household Income | $59,250 | $240 |
| Monthly Housing Costs | $393 | $49 |
| Real Estate Taxes | $1,255 | $18 |
Property Value by Mortgage Status in Charles City County
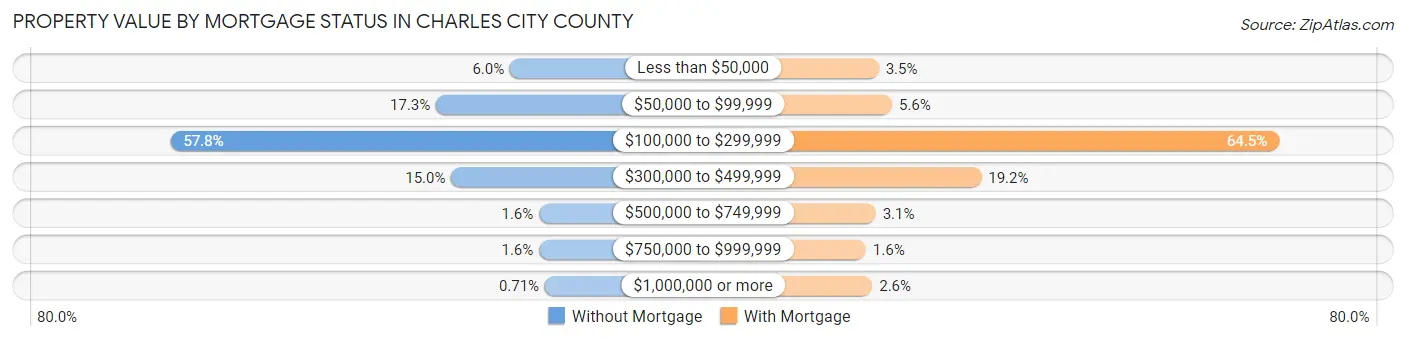
| Property Value | Without Mortgage | With Mortgage |
| Less than $50,000 | 68 (6.0%) | 47 (3.5%) |
| $50,000 to $99,999 | 195 (17.3%) | 74 (5.6%) |
| $100,000 to $299,999 | 652 (57.8%) | 859 (64.5%) |
| $300,000 to $499,999 | 169 (15.0%) | 255 (19.2%) |
| $500,000 to $749,999 | 18 (1.6%) | 41 (3.1%) |
| $750,000 to $999,999 | 18 (1.6%) | 21 (1.6%) |
| $1,000,000 or more | 8 (0.7%) | 34 (2.5%) |
| Total | 1,128 (100.0%) | 1,331 (100.0%) |
Household Income by Mortgage Status in Charles City County
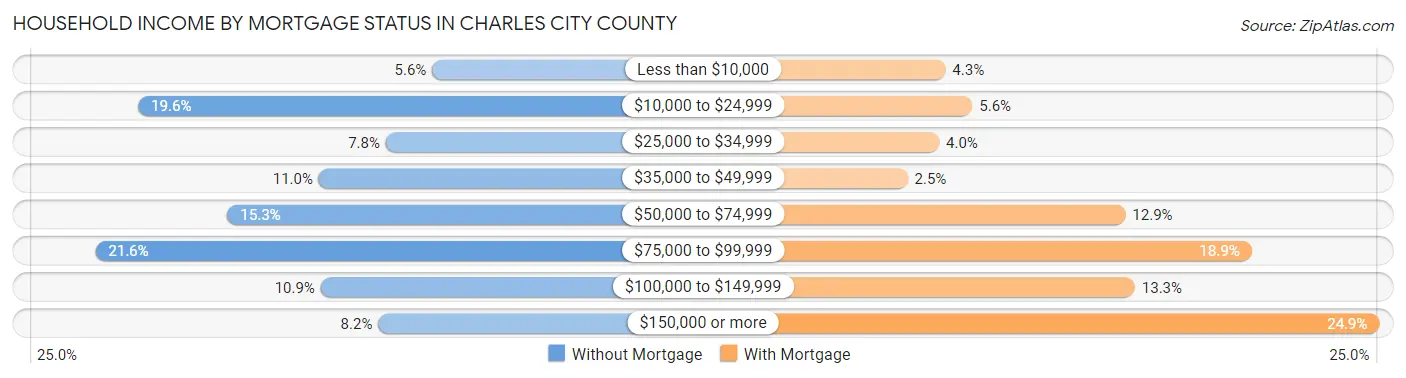
| Household Income | Without Mortgage | With Mortgage |
| Less than $10,000 | 63 (5.6%) | 57 (4.3%) |
| $10,000 to $24,999 | 221 (19.6%) | 74 (5.6%) |
| $25,000 to $34,999 | 88 (7.8%) | 53 (4.0%) |
| $35,000 to $49,999 | 124 (11.0%) | 33 (2.5%) |
| $50,000 to $74,999 | 173 (15.3%) | 171 (12.9%) |
| $75,000 to $99,999 | 244 (21.6%) | 251 (18.9%) |
| $100,000 to $149,999 | 123 (10.9%) | 177 (13.3%) |
| $150,000 or more | 92 (8.2%) | 332 (24.9%) |
| Total | 1,128 (100.0%) | 1,331 (100.0%) |
Property Value to Household Income Ratio in Charles City County
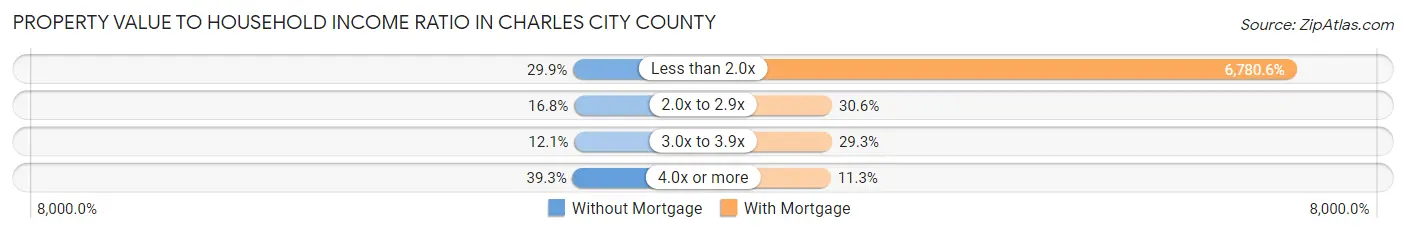
| Value-to-Income Ratio | Without Mortgage | With Mortgage |
| Less than 2.0x | 337 (29.9%) | 90,250 (6,780.6%) |
| 2.0x to 2.9x | 189 (16.8%) | 407 (30.6%) |
| 3.0x to 3.9x | 136 (12.1%) | 390 (29.3%) |
| 4.0x or more | 443 (39.3%) | 151 (11.3%) |
| Total | 1,128 (100.0%) | 1,331 (100.0%) |
Real Estate Taxes by Mortgage Status in Charles City County
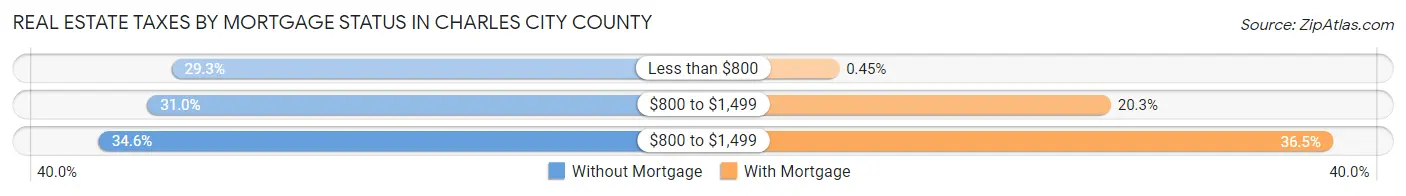
| Property Taxes | Without Mortgage | With Mortgage |
| Less than $800 | 330 (29.3%) | 6 (0.4%) |
| $800 to $1,499 | 350 (31.0%) | 270 (20.3%) |
| $800 to $1,499 | 390 (34.6%) | 486 (36.5%) |
| Total | 1,128 (100.0%) | 1,331 (100.0%) |
Health & Disability in Charles City County
Health Insurance Coverage by Age in Charles City County
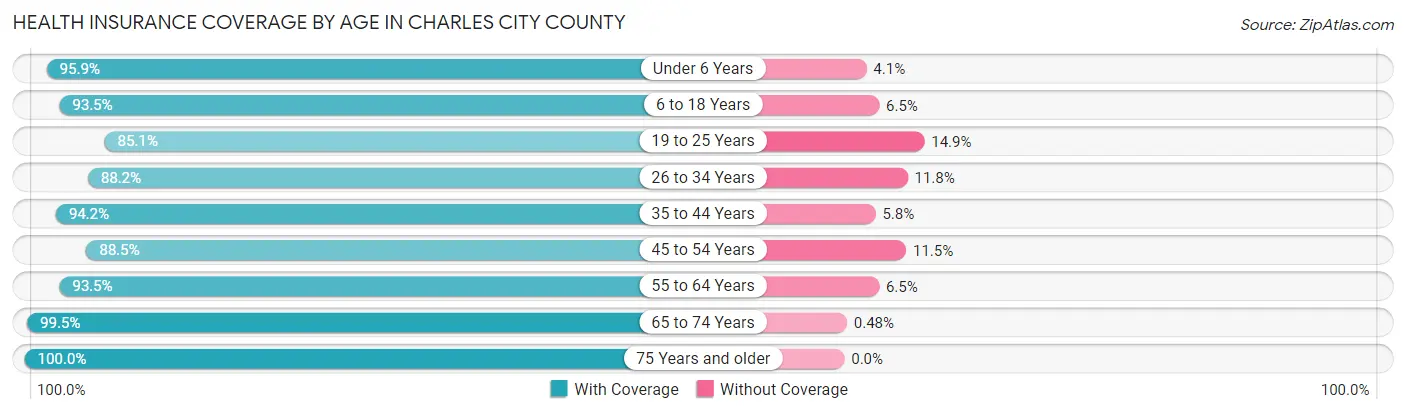
| Age Bracket | With Coverage | Without Coverage |
| Under 6 Years | 326 (95.9%) | 14 (4.1%) |
| 6 to 18 Years | 735 (93.5%) | 51 (6.5%) |
| 19 to 25 Years | 365 (85.1%) | 64 (14.9%) |
| 26 to 34 Years | 464 (88.2%) | 62 (11.8%) |
| 35 to 44 Years | 647 (94.2%) | 40 (5.8%) |
| 45 to 54 Years | 807 (88.5%) | 105 (11.5%) |
| 55 to 64 Years | 1,244 (93.5%) | 86 (6.5%) |
| 65 to 74 Years | 1,046 (99.5%) | 5 (0.5%) |
| 75 Years and older | 680 (100.0%) | 0 (0.0%) |
| Total | 6,314 (93.7%) | 427 (6.3%) |
Health Insurance Coverage by Citizenship Status in Charles City County
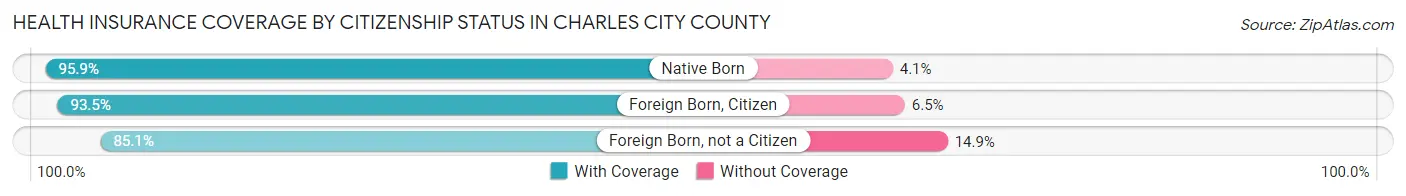
| Citizenship Status | With Coverage | Without Coverage |
| Native Born | 326 (95.9%) | 14 (4.1%) |
| Foreign Born, Citizen | 735 (93.5%) | 51 (6.5%) |
| Foreign Born, not a Citizen | 365 (85.1%) | 64 (14.9%) |
Health Insurance Coverage by Household Income in Charles City County
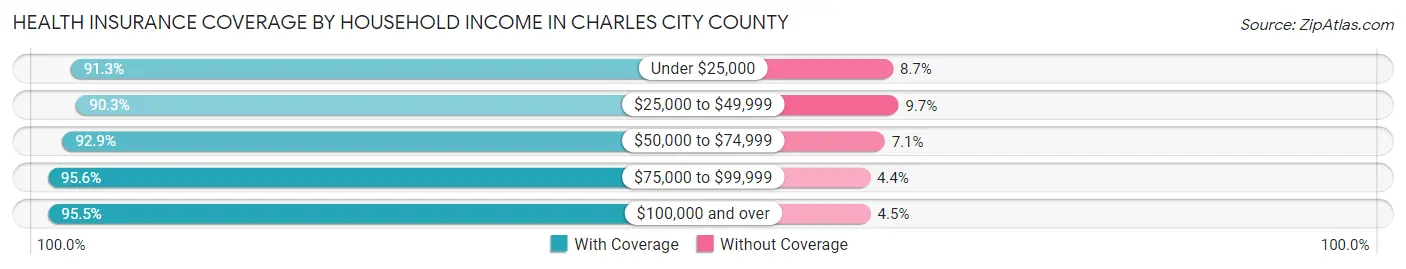
| Household Income | With Coverage | Without Coverage |
| Under $25,000 | 897 (91.3%) | 85 (8.7%) |
| $25,000 to $49,999 | 904 (90.3%) | 97 (9.7%) |
| $50,000 to $74,999 | 1,177 (92.9%) | 90 (7.1%) |
| $75,000 to $99,999 | 986 (95.6%) | 45 (4.4%) |
| $100,000 and over | 2,350 (95.5%) | 110 (4.5%) |
Public vs Private Health Insurance Coverage by Age in Charles City County
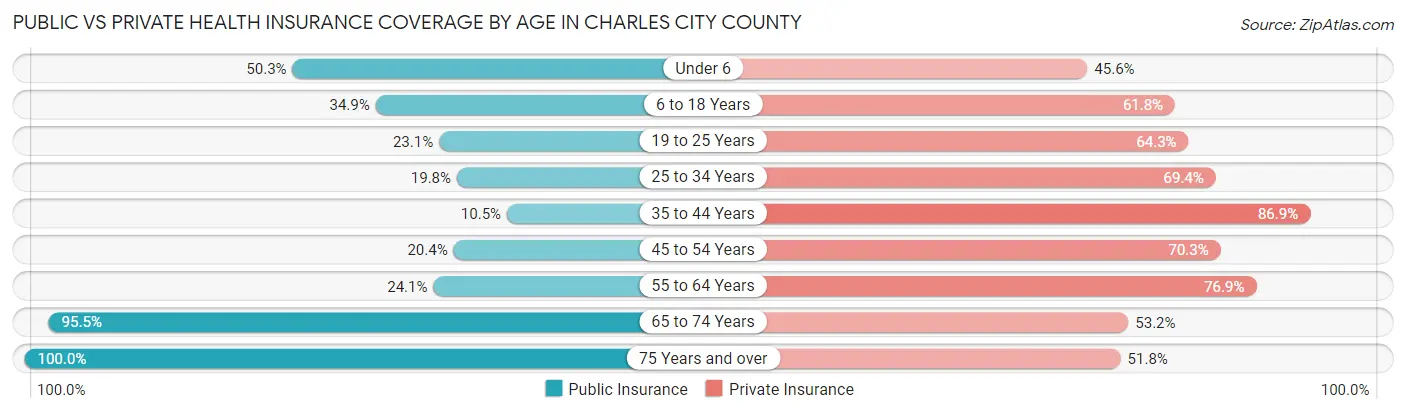
| Age Bracket | Public Insurance | Private Insurance |
| Under 6 | 171 (50.3%) | 155 (45.6%) |
| 6 to 18 Years | 274 (34.9%) | 486 (61.8%) |
| 19 to 25 Years | 99 (23.1%) | 276 (64.3%) |
| 25 to 34 Years | 104 (19.8%) | 365 (69.4%) |
| 35 to 44 Years | 72 (10.5%) | 597 (86.9%) |
| 45 to 54 Years | 186 (20.4%) | 641 (70.3%) |
| 55 to 64 Years | 321 (24.1%) | 1,023 (76.9%) |
| 65 to 74 Years | 1,004 (95.5%) | 559 (53.2%) |
| 75 Years and over | 680 (100.0%) | 352 (51.8%) |
| Total | 2,911 (43.2%) | 4,454 (66.1%) |
Disability Status by Sex by Age in Charles City County
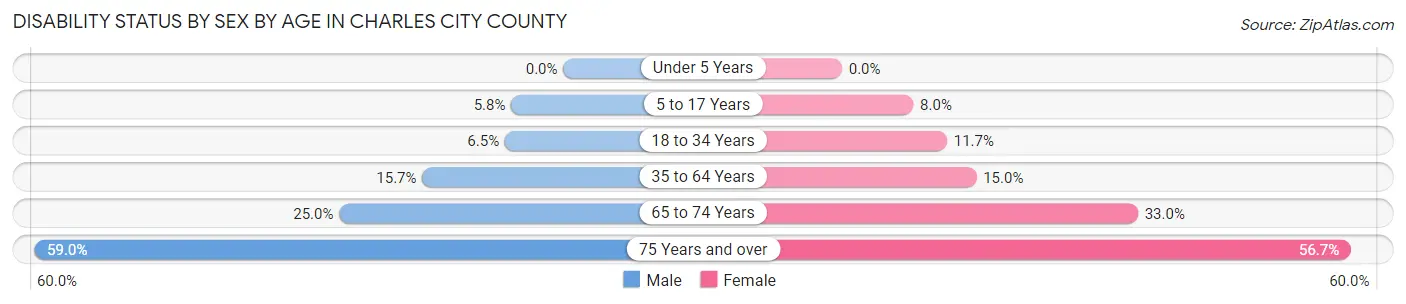
| Age Bracket | Male | Female |
| Under 5 Years | 0 (0.0%) | 0 (0.0%) |
| 5 to 17 Years | 22 (5.8%) | 29 (8.0%) |
| 18 to 34 Years | 36 (6.5%) | 61 (11.7%) |
| 35 to 64 Years | 227 (15.7%) | 222 (15.0%) |
| 65 to 74 Years | 129 (24.9%) | 176 (33.0%) |
| 75 Years and over | 168 (59.0%) | 224 (56.7%) |
Disability Class by Sex by Age in Charles City County
Disability Class: Hearing Difficulty
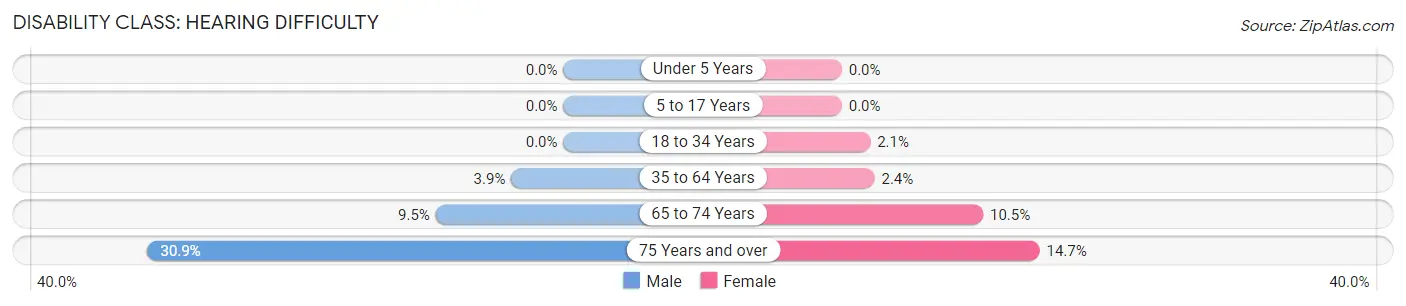
| Age Bracket | Male | Female |
| Under 5 Years | 0 (0.0%) | 0 (0.0%) |
| 5 to 17 Years | 0 (0.0%) | 0 (0.0%) |
| 18 to 34 Years | 0 (0.0%) | 11 (2.1%) |
| 35 to 64 Years | 56 (3.9%) | 36 (2.4%) |
| 65 to 74 Years | 49 (9.5%) | 56 (10.5%) |
| 75 Years and over | 88 (30.9%) | 58 (14.7%) |
Disability Class: Vision Difficulty
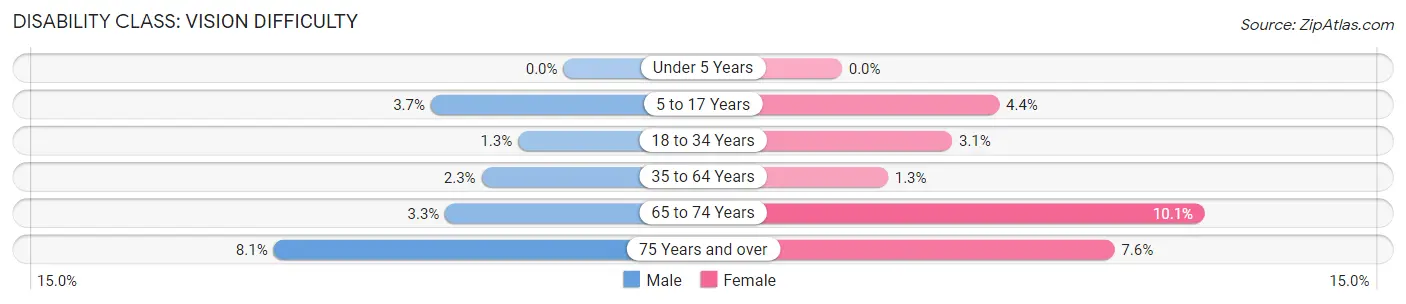
| Age Bracket | Male | Female |
| Under 5 Years | 0 (0.0%) | 0 (0.0%) |
| 5 to 17 Years | 14 (3.7%) | 16 (4.4%) |
| 18 to 34 Years | 7 (1.3%) | 16 (3.1%) |
| 35 to 64 Years | 33 (2.3%) | 19 (1.3%) |
| 65 to 74 Years | 17 (3.3%) | 54 (10.1%) |
| 75 Years and over | 23 (8.1%) | 30 (7.6%) |
Disability Class: Cognitive Difficulty
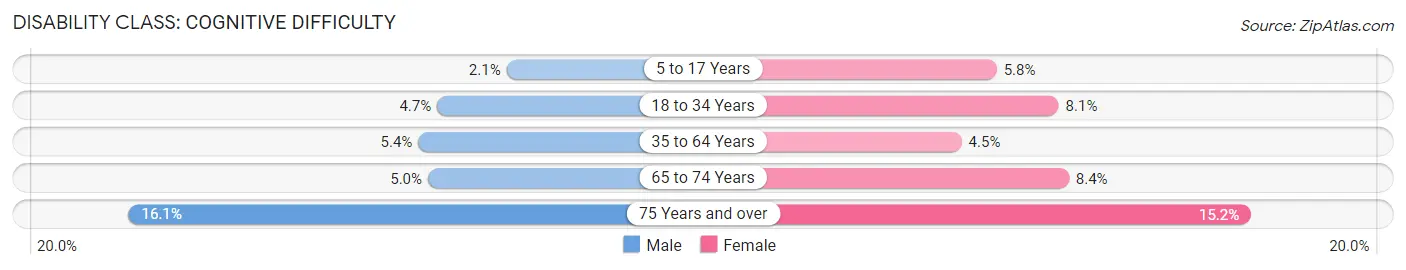
| Age Bracket | Male | Female |
| 5 to 17 Years | 8 (2.1%) | 21 (5.8%) |
| 18 to 34 Years | 26 (4.7%) | 42 (8.1%) |
| 35 to 64 Years | 78 (5.4%) | 66 (4.4%) |
| 65 to 74 Years | 26 (5.0%) | 45 (8.4%) |
| 75 Years and over | 46 (16.1%) | 60 (15.2%) |
Disability Class: Ambulatory Difficulty
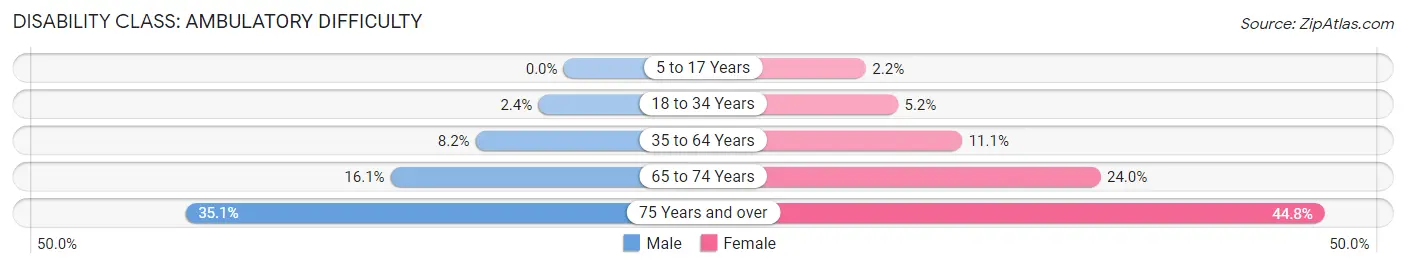
| Age Bracket | Male | Female |
| 5 to 17 Years | 0 (0.0%) | 8 (2.2%) |
| 18 to 34 Years | 13 (2.4%) | 27 (5.2%) |
| 35 to 64 Years | 118 (8.2%) | 165 (11.1%) |
| 65 to 74 Years | 83 (16.1%) | 128 (24.0%) |
| 75 Years and over | 100 (35.1%) | 177 (44.8%) |
Disability Class: Self-Care Difficulty
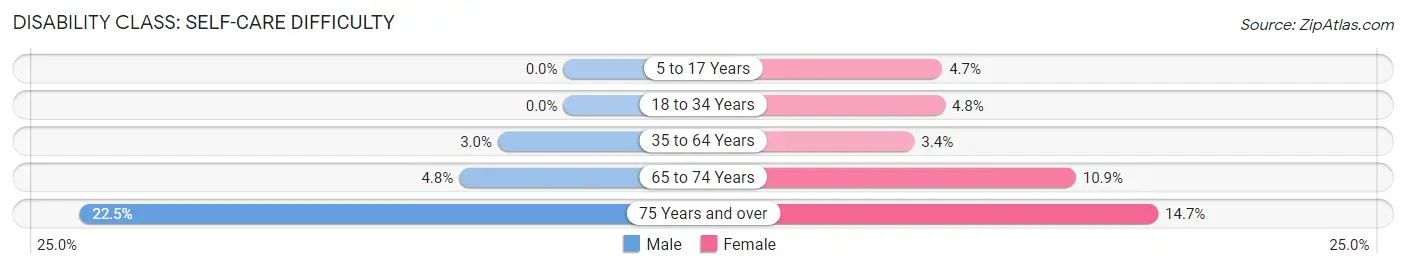
| Age Bracket | Male | Female |
| 5 to 17 Years | 0 (0.0%) | 17 (4.7%) |
| 18 to 34 Years | 0 (0.0%) | 25 (4.8%) |
| 35 to 64 Years | 44 (3.0%) | 50 (3.4%) |
| 65 to 74 Years | 25 (4.8%) | 58 (10.9%) |
| 75 Years and over | 64 (22.5%) | 58 (14.7%) |
Technology Access in Charles City County
Computing Device Access in Charles City County
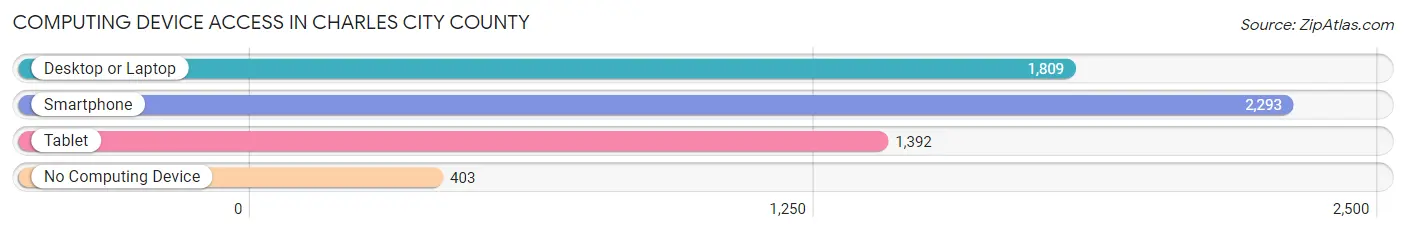
| Device Type | # Households | % Households |
| Desktop or Laptop | 1,809 | 62.3% |
| Smartphone | 2,293 | 78.9% |
| Tablet | 1,392 | 47.9% |
| No Computing Device | 403 | 13.9% |
| Total | 2,905 | 100.0% |
Internet Access in Charles City County
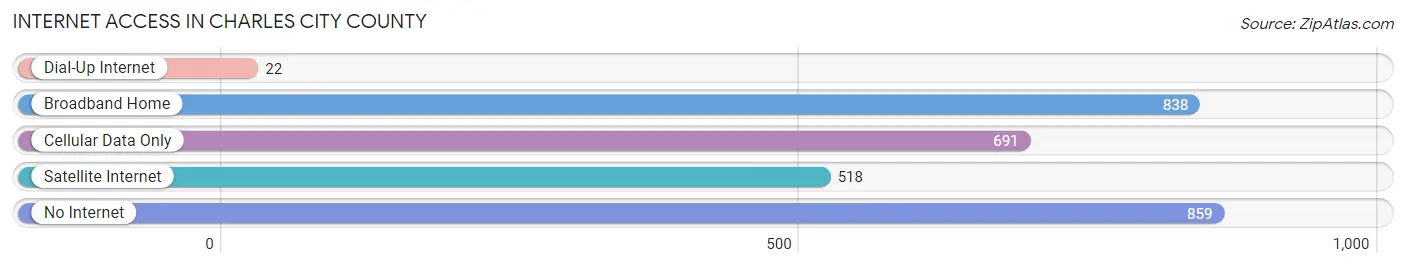
| Internet Type | # Households | % Households |
| Dial-Up Internet | 22 | 0.8% |
| Broadband Home | 838 | 28.8% |
| Cellular Data Only | 691 | 23.8% |
| Satellite Internet | 518 | 17.8% |
| No Internet | 859 | 29.6% |
| Total | 2,905 | 100.0% |
Charles City County Summary
Charles City County is a county located in the Commonwealth of Virginia. It is located on the south side of the James River, and is part of the Greater Richmond Region. The county seat is the town of Charles City. The county was established in 1619 and is one of the original eight shires of Virginia.
Geography
Charles City County is located in the east-central part of Virginia, on the south side of the James River. It is bordered by New Kent County to the north, James City County to the east, Prince George County to the south, and Henrico County to the west. The county has a total area of 246 square miles, of which 241 square miles is land and 5 square miles (2.1%) is water.
The county is mostly flat, with some rolling hills in the northern part of the county. The James River forms the eastern border of the county, and the Chickahominy River forms the western border. The county is drained by the Chickahominy and James Rivers, and several creeks, including the Appomattox, Blackwater, and Swift Creek.
The county is home to several state parks, including Berkeley Plantation, Henricus Historical Park, and Westover Plantation.
Demographics
As of the 2010 United States Census, there were 7,256 people, 2,717 households, and 1,945 families residing in the county. The population density was 30.2 people per square mile. There were 3,093 housing units at an average density of 12.8 per square mile. The racial makeup of the county was 57.2% White, 40.2% Black or African American, 0.3% Native American, 0.3% Asian, 0.1% Pacific Islander, 0.7% from other races, and 1.2% from two or more races. 1.9% of the population were Hispanic or Latino of any race.
There were 2,717 households, out of which 28.2% had children under the age of 18 living with them, 48.2% were married couples living together, 17.2% had a female householder with no husband present, and 29.2% were non-families. 24.2% of all households were made up of individuals, and 10.2% had someone living alone who was 65 years of age or older. The average household size was 2.60 and the average family size was 3.07.
The median age in the county was 39.7 years. 22.7% of residents were under the age of 18; 7.2% were between the ages of 18 and 24; 28.2% were from 25 to 44; 28.2% were from 45 to 64; and 13.7% were 65 years of age or older. The gender makeup of the county was 48.2% male and 51.8% female.
Economy
The economy of Charles City County is largely based on agriculture and tourism. The county is home to several large farms, including the Berkeley Plantation, which is one of the oldest plantations in the United States. The county is also home to several wineries, including the James River Cellars Winery.
Tourism is also an important part of the economy. The county is home to several historic sites, including the Berkeley Plantation, Henricus Historical Park, and Westover Plantation. The county is also home to several parks, including the Chickahominy Riverfront Park and the Charles City County Park.
The county is also home to several businesses, including the Charles City County Industrial Park, which is home to several manufacturing and distribution companies. The county is also home to several retail stores, restaurants, and other businesses.
Conclusion
Charles City County is a county located in the Commonwealth of Virginia. It is located on the south side of the James River, and is part of the Greater Richmond Region. The county was established in 1619 and is one of the original eight shires of Virginia. The county has a total area of 246 square miles, and is mostly flat, with some rolling hills in the northern part of the county. The population of the county was 7,256 as of the 2010 United States Census. The economy of the county is largely based on agriculture and tourism. The county is home to several large farms, wineries, and historic sites, as well as several businesses.
Common Questions
What is Per Capita Income in Charles City County?
Per Capita income in Charles City County is $38,351.
What is the Median Family Income in Charles City County?
Median Family Income in Charles City County is $88,210.
What is the Median Household income in Charles City County?
Median Household Income in Charles City County is $65,573.
What is Income or Wage Gap in Charles City County?
Income or Wage Gap in Charles City County is 16.3%.
Women in Charles City County earn 83.7 cents for every dollar earned by a man.
What is Inequality or Gini Index in Charles City County?
Inequality or Gini Index in Charles City County is 0.45.
What is the Total Population of Charles City County?
Total Population of Charles City County is 6,760.
What is the Total Male Population of Charles City County?
Total Male Population of Charles City County is 3,362.
What is the Total Female Population of Charles City County?
Total Female Population of Charles City County is 3,398.
What is the Ratio of Males per 100 Females in Charles City County?
There are 98.94 Males per 100 Females in Charles City County.
What is the Ratio of Females per 100 Males in Charles City County?
There are 101.07 Females per 100 Males in Charles City County.
What is the Median Population Age in Charles City County?
Median Population Age in Charles City County is 52.0 Years.
What is the Average Family Size in Charles City County
Average Family Size in Charles City County is 3.0 People.
What is the Average Household Size in Charles City County
Average Household Size in Charles City County is 2.3 People.
How Large is the Labor Force in Charles City County?
There are 3,436 People in the Labor Forcein in Charles City County.
What is the Percentage of People in the Labor Force in Charles City County?
58.2% of People are in the Labor Force in Charles City County.
What is the Unemployment Rate in Charles City County?
Unemployment Rate in Charles City County is 4.1%.