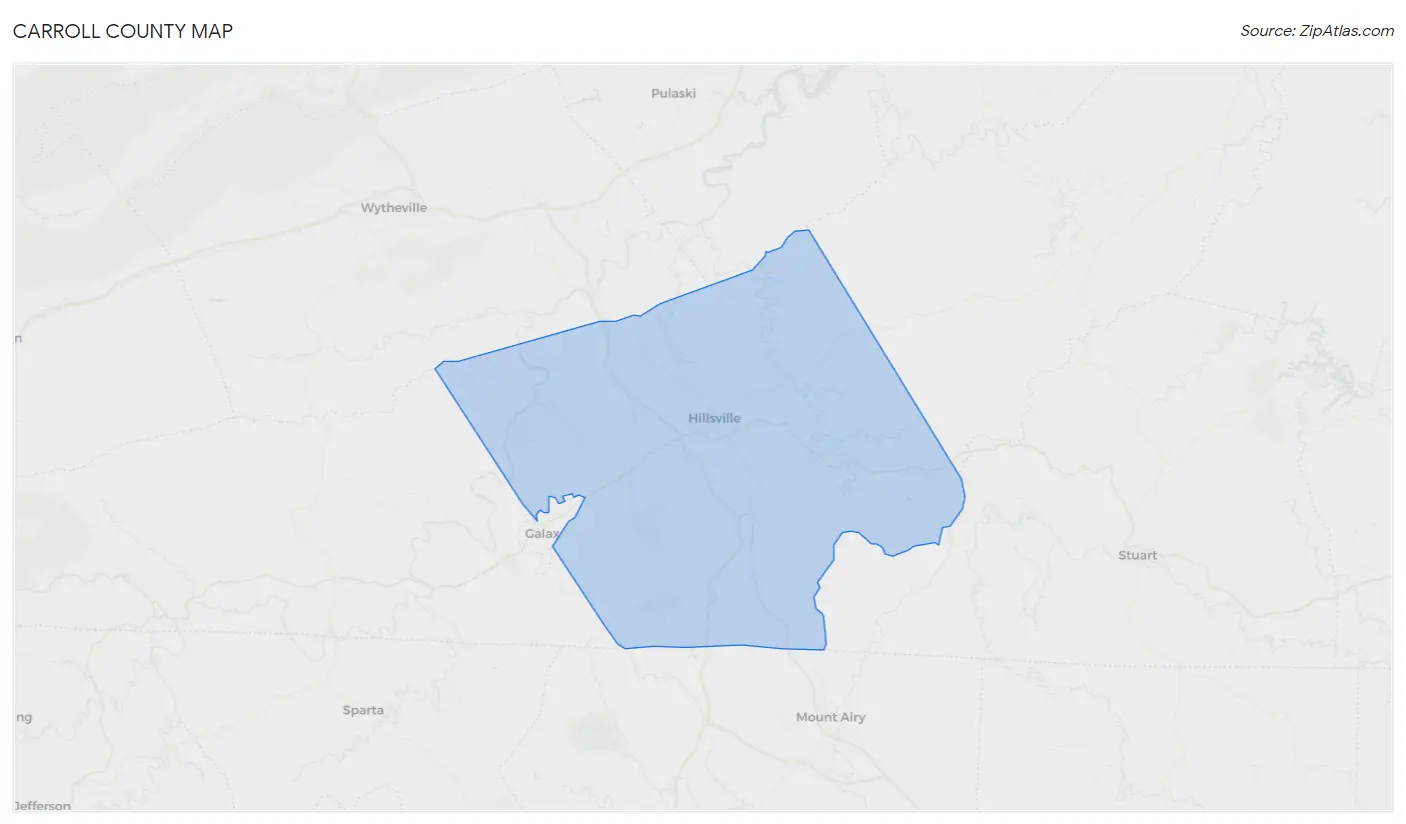
Carroll County, VA Map & Demographics
Carroll County Map
Carroll County Overview
$27,972
PER CAPITA INCOME
$61,754
AVG FAMILY INCOME
$49,113
AVG HOUSEHOLD INCOME
18.8%
WAGE / INCOME GAP [ % ]
81.2¢/ $1
WAGE / INCOME GAP [ $ ]
$9,340
FAMILY INCOME DEFICIT
0.44
INEQUALITY / GINI INDEX
29,126
TOTAL POPULATION
14,335
MALE POPULATION
14,791
FEMALE POPULATION
96.92
MALES / 100 FEMALES
103.18
FEMALES / 100 MALES
48.7
MEDIAN AGE
3.0
AVG FAMILY SIZE
2.4
AVG HOUSEHOLD SIZE
12,930
LABOR FORCE [ PEOPLE ]
52.4%
PERCENT IN LABOR FORCE
4.8%
UNEMPLOYMENT RATE
Income in Carroll County
Income Overview in Carroll County
Per Capita Income in Carroll County is $27,972, while median incomes of families and households are $61,754 and $49,113 respectively.
| Characteristic | Number | Measure |
| Per Capita Income | 29,126 | $27,972 |
| Median Family Income | 8,048 | $61,754 |
| Mean Family Income | 8,048 | $73,334 |
| Median Household Income | 12,141 | $49,113 |
| Mean Household Income | 12,141 | $63,652 |
| Income Deficit | 8,048 | $9,340 |
| Wage / Income Gap (%) | 29,126 | 18.83% |
| Wage / Income Gap ($) | 29,126 | 81.17¢ per $1 |
| Gini / Inequality Index | 29,126 | 0.44 |
Earnings by Sex in Carroll County
Average Earnings in Carroll County are $32,403, $35,358 for men and $28,700 for women, a difference of 18.8%.
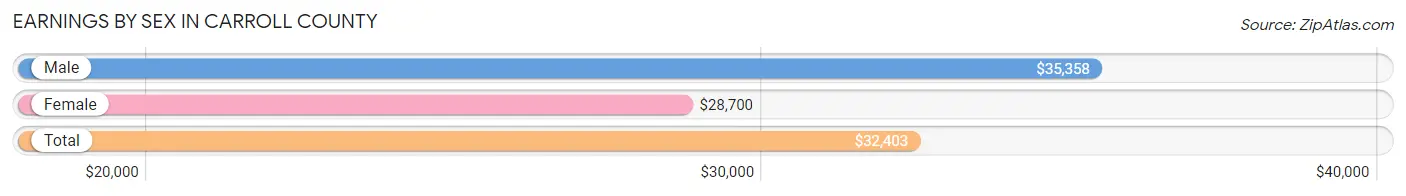
| Sex | Number | Average Earnings |
| Male | 7,087 (52.4%) | $35,358 |
| Female | 6,428 (47.6%) | $28,700 |
| Total | 13,515 (100.0%) | $32,403 |
Earnings by Sex by Income Bracket in Carroll County
The most common earnings brackets in Carroll County are $55,000 to $64,999 for men (647 | 9.1%) and $25,000 to $29,999 for women (682 | 10.6%).
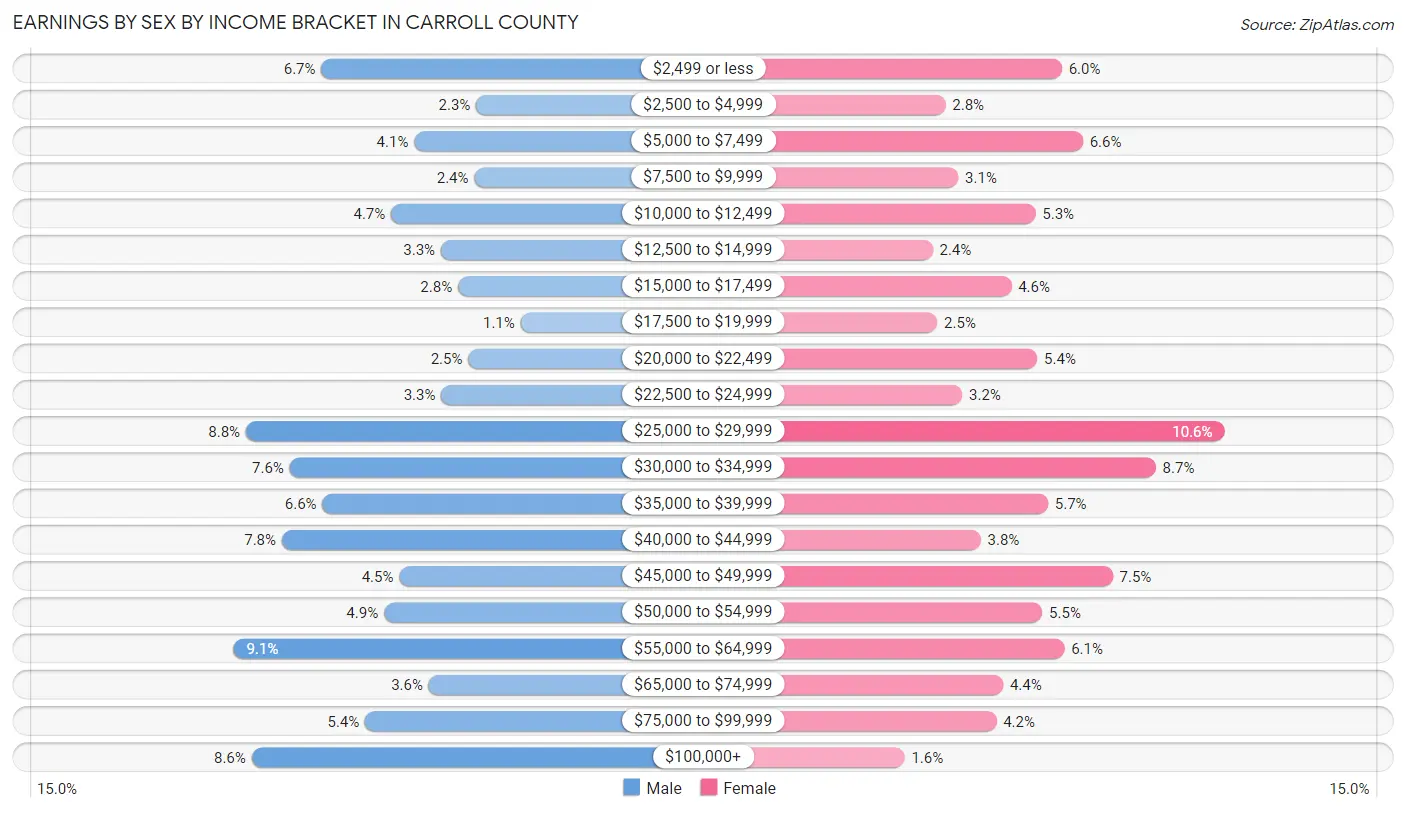
| Income | Male | Female |
| $2,499 or less | 472 (6.7%) | 388 (6.0%) |
| $2,500 to $4,999 | 164 (2.3%) | 178 (2.8%) |
| $5,000 to $7,499 | 287 (4.1%) | 426 (6.6%) |
| $7,500 to $9,999 | 167 (2.4%) | 201 (3.1%) |
| $10,000 to $12,499 | 333 (4.7%) | 341 (5.3%) |
| $12,500 to $14,999 | 234 (3.3%) | 155 (2.4%) |
| $15,000 to $17,499 | 200 (2.8%) | 297 (4.6%) |
| $17,500 to $19,999 | 75 (1.1%) | 163 (2.5%) |
| $20,000 to $22,499 | 179 (2.5%) | 344 (5.3%) |
| $22,500 to $24,999 | 233 (3.3%) | 208 (3.2%) |
| $25,000 to $29,999 | 622 (8.8%) | 682 (10.6%) |
| $30,000 to $34,999 | 535 (7.5%) | 558 (8.7%) |
| $35,000 to $39,999 | 470 (6.6%) | 363 (5.7%) |
| $40,000 to $44,999 | 551 (7.8%) | 242 (3.8%) |
| $45,000 to $49,999 | 317 (4.5%) | 480 (7.5%) |
| $50,000 to $54,999 | 347 (4.9%) | 353 (5.5%) |
| $55,000 to $64,999 | 647 (9.1%) | 393 (6.1%) |
| $65,000 to $74,999 | 258 (3.6%) | 282 (4.4%) |
| $75,000 to $99,999 | 385 (5.4%) | 270 (4.2%) |
| $100,000+ | 611 (8.6%) | 104 (1.6%) |
| Total | 7,087 (100.0%) | 6,428 (100.0%) |
Earnings by Sex by Educational Attainment in Carroll County
Average earnings in Carroll County are $40,242 for men and $32,928 for women, a difference of 18.2%. Men with an educational attainment of graduate degree enjoy the highest average annual earnings of $53,860, while those with less than high school education earn the least with $24,594. Women with an educational attainment of graduate degree earn the most with the average annual earnings of $53,525, while those with less than high school education have the smallest earnings of $21,918.
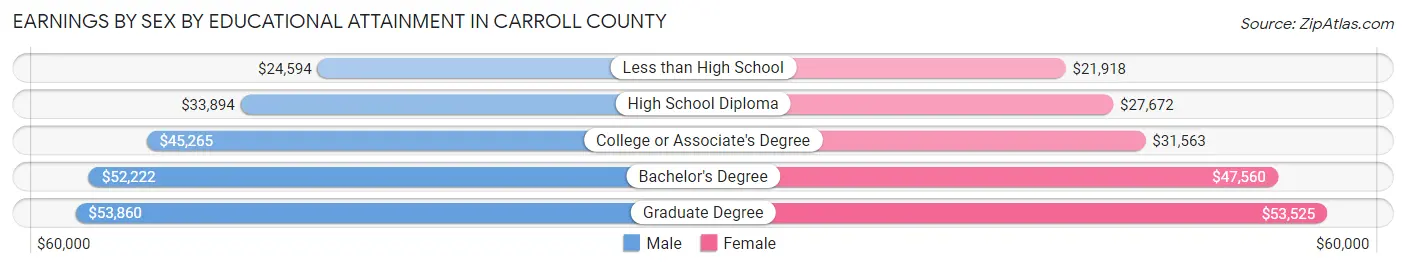
| Educational Attainment | Male Income | Female Income |
| Less than High School | $24,594 | $21,918 |
| High School Diploma | $33,894 | $27,672 |
| College or Associate's Degree | $45,265 | $31,563 |
| Bachelor's Degree | $52,222 | $47,560 |
| Graduate Degree | $53,860 | $53,525 |
| Total | $40,242 | $32,928 |
Family Income in Carroll County
Family Income Brackets in Carroll County
According to the Carroll County family income data, there are 1,722 families falling into the $50,000 to $74,999 income range, which is the most common income bracket and makes up 21.4% of all families. Conversely, the $200,000+ income bracket is the least frequent group with only 169 families (2.1%) belonging to this category.
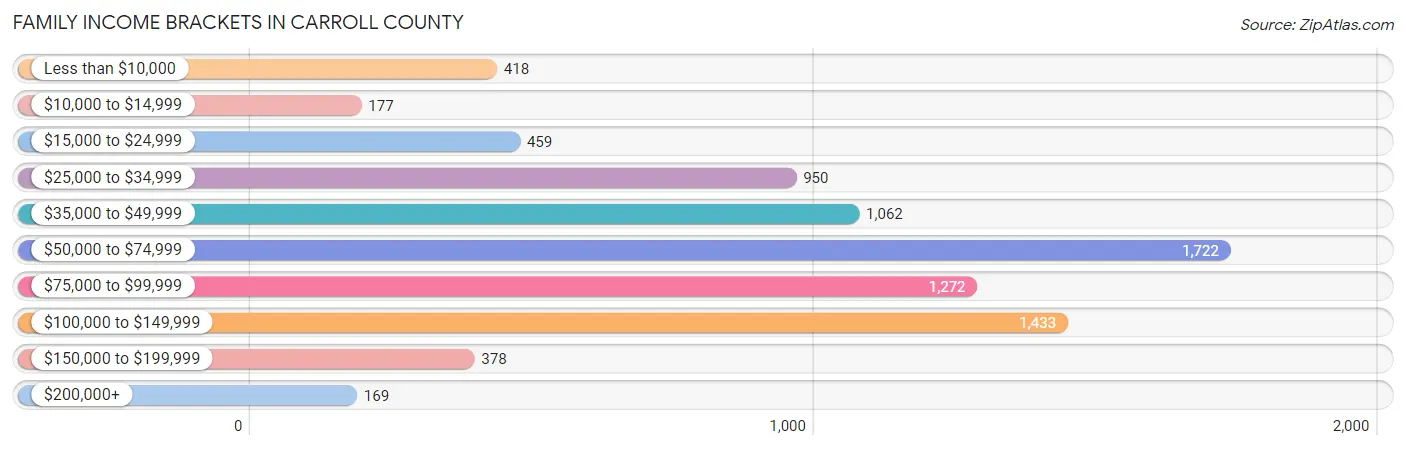
| Income Bracket | # Families | % Families |
| Less than $10,000 | 418 | 5.2% |
| $10,000 to $14,999 | 177 | 2.2% |
| $15,000 to $24,999 | 459 | 5.7% |
| $25,000 to $34,999 | 950 | 11.8% |
| $35,000 to $49,999 | 1,062 | 13.2% |
| $50,000 to $74,999 | 1,722 | 21.4% |
| $75,000 to $99,999 | 1,272 | 15.8% |
| $100,000 to $149,999 | 1,433 | 17.8% |
| $150,000 to $199,999 | 378 | 4.7% |
| $200,000+ | 169 | 2.1% |
Family Income by Famaliy Size in Carroll County
6-person families (116 | 1.4%) account for the highest median family income in Carroll County with $116,385 per family, while 2-person families (4,622 | 57.4%) have the highest median income of $26,855 per family member.
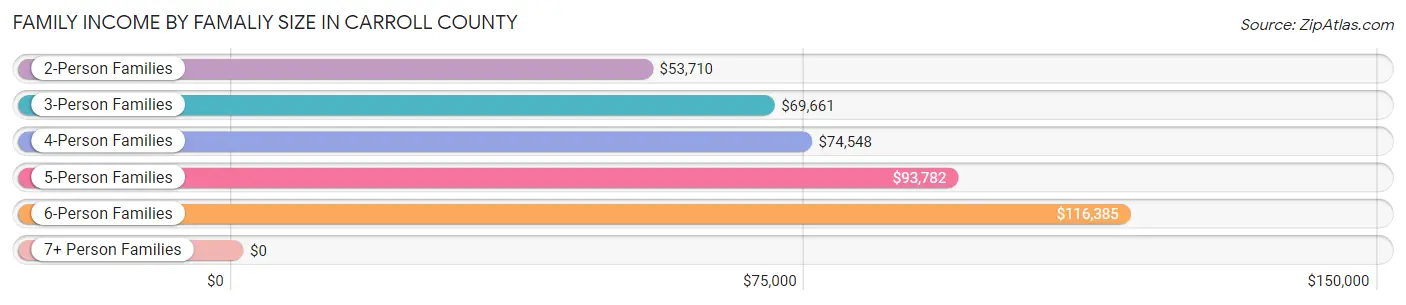
| Income Bracket | # Families | Median Income |
| 2-Person Families | 4,622 (57.4%) | $53,710 |
| 3-Person Families | 1,747 (21.7%) | $69,661 |
| 4-Person Families | 1,064 (13.2%) | $74,548 |
| 5-Person Families | 468 (5.8%) | $93,782 |
| 6-Person Families | 116 (1.4%) | $116,385 |
| 7+ Person Families | 31 (0.4%) | $0 |
| Total | 8,048 (100.0%) | $61,754 |
Family Income by Number of Earners in Carroll County
The median family income in Carroll County is $61,754, with families comprising 3+ earners (760) having the highest median family income of $105,755, while families with no earners (2,191) have the lowest median family income of $37,169, accounting for 9.4% and 27.2% of families, respectively.
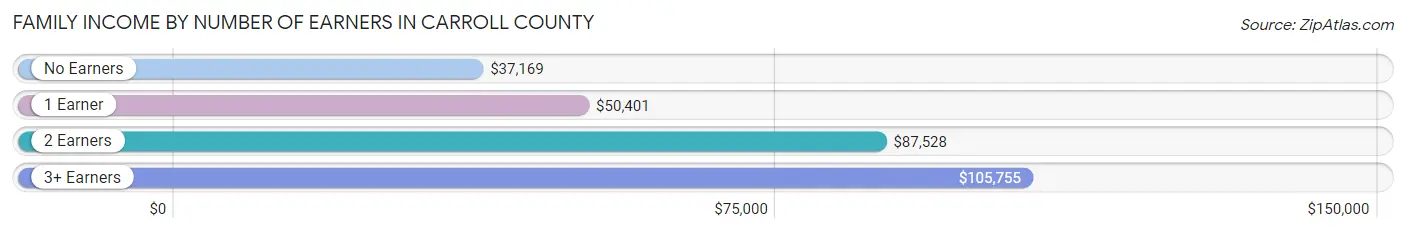
| Number of Earners | # Families | Median Income |
| No Earners | 2,191 (27.2%) | $37,169 |
| 1 Earner | 2,304 (28.6%) | $50,401 |
| 2 Earners | 2,793 (34.7%) | $87,528 |
| 3+ Earners | 760 (9.4%) | $105,755 |
| Total | 8,048 (100.0%) | $61,754 |
Household Income in Carroll County
Household Income Brackets in Carroll County
With 2,161 households falling in the category, the $50,000 to $74,999 income range is the most frequent in Carroll County, accounting for 17.8% of all households. In contrast, only 267 households (2.2%) fall into the $200,000+ income bracket, making it the least populous group.
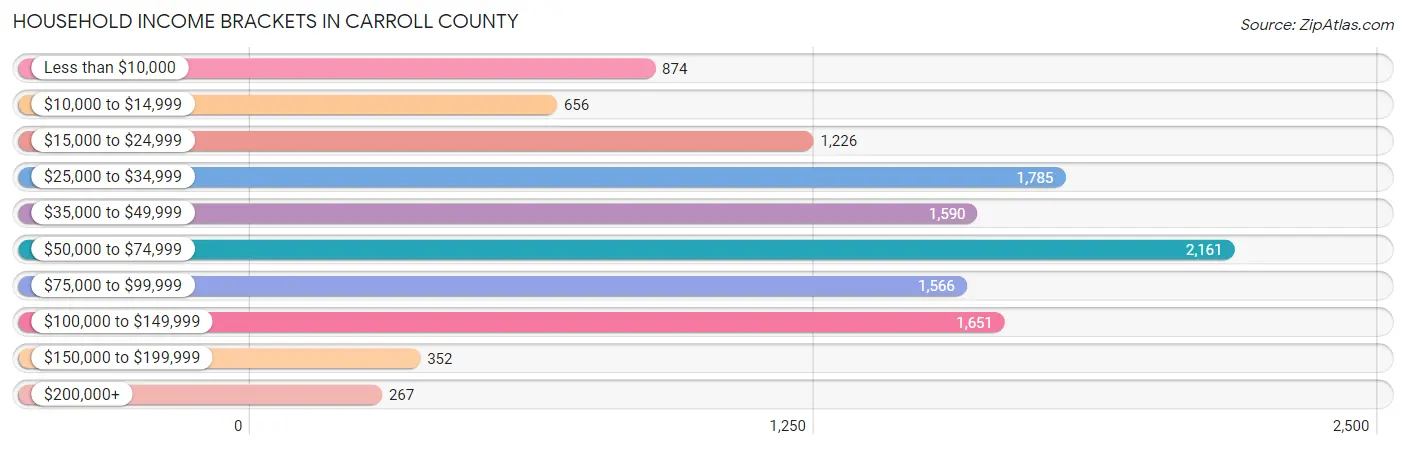
| Income Bracket | # Households | % Households |
| Less than $10,000 | 874 | 7.2% |
| $10,000 to $14,999 | 656 | 5.4% |
| $15,000 to $24,999 | 1,226 | 10.1% |
| $25,000 to $34,999 | 1,785 | 14.7% |
| $35,000 to $49,999 | 1,590 | 13.1% |
| $50,000 to $74,999 | 2,161 | 17.8% |
| $75,000 to $99,999 | 1,566 | 12.9% |
| $100,000 to $149,999 | 1,651 | 13.6% |
| $150,000 to $199,999 | 352 | 2.9% |
| $200,000+ | 267 | 2.2% |
Household Income by Householder Age in Carroll County
The median household income in Carroll County is $49,113, with the highest median household income of $69,496 found in the 25 to 44 years age bracket for the primary householder. A total of 2,413 households (19.9%) fall into this category. Meanwhile, the 15 to 24 years age bracket for the primary householder has the lowest median household income of $27,581, with 364 households (3.0%) in this group.
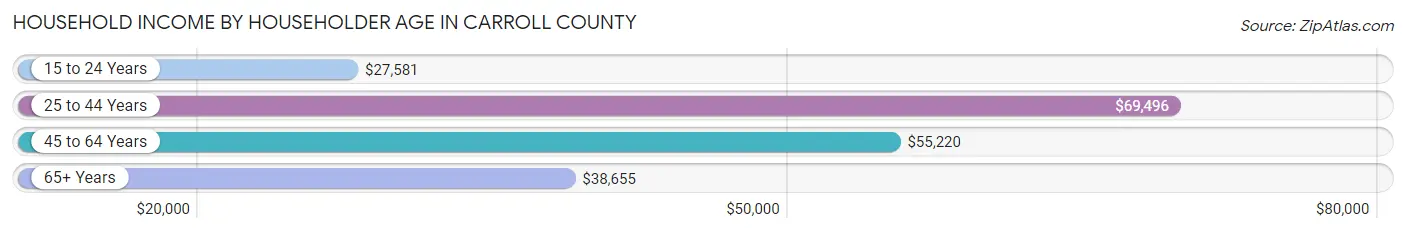
| Income Bracket | # Households | Median Income |
| 15 to 24 Years | 364 (3.0%) | $27,581 |
| 25 to 44 Years | 2,413 (19.9%) | $69,496 |
| 45 to 64 Years | 4,875 (40.2%) | $55,220 |
| 65+ Years | 4,489 (37.0%) | $38,655 |
| Total | 12,141 (100.0%) | $49,113 |
Poverty in Carroll County
Income Below Poverty by Sex and Age in Carroll County
With 15.5% poverty level for males and 14.9% for females among the residents of Carroll County, 16 and 17 year old males and 15 year old females are the most vulnerable to poverty, with 148 males (37.8%) and 59 females (53.1%) in their respective age groups living below the poverty level.
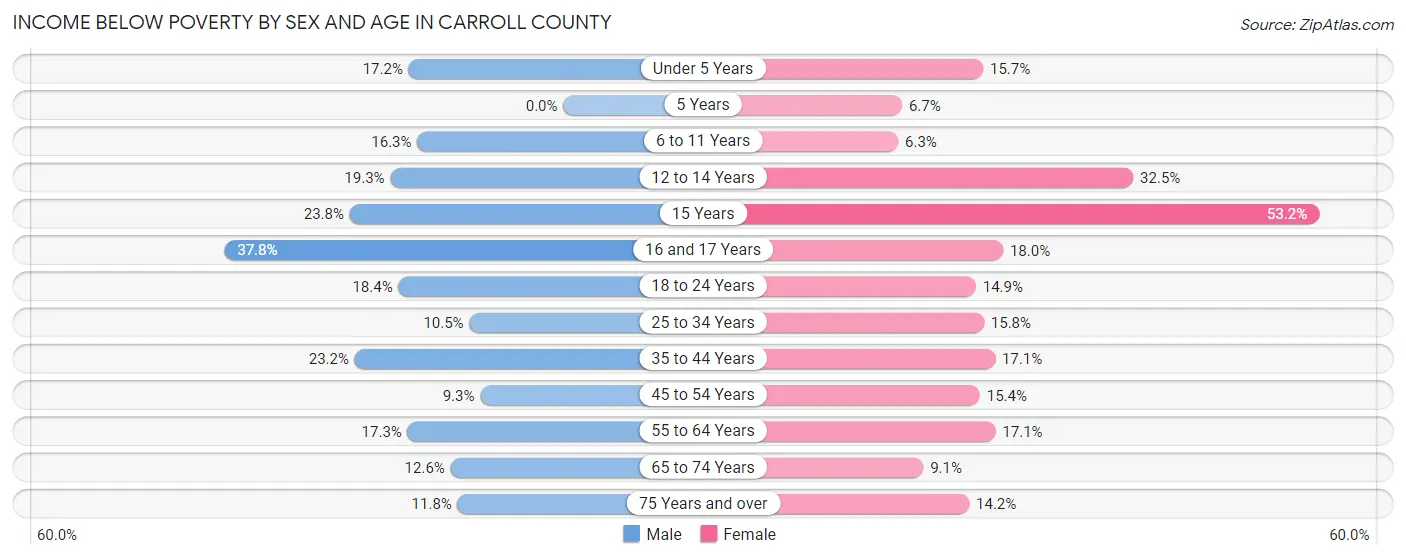
| Age Bracket | Male | Female |
| Under 5 Years | 104 (17.2%) | 95 (15.7%) |
| 5 Years | 0 (0.0%) | 15 (6.7%) |
| 6 to 11 Years | 141 (16.3%) | 53 (6.3%) |
| 12 to 14 Years | 104 (19.3%) | 123 (32.5%) |
| 15 Years | 44 (23.8%) | 59 (53.1%) |
| 16 and 17 Years | 148 (37.8%) | 63 (17.9%) |
| 18 to 24 Years | 179 (18.4%) | 161 (14.9%) |
| 25 to 34 Years | 165 (10.5%) | 218 (15.8%) |
| 35 to 44 Years | 352 (23.2%) | 251 (17.1%) |
| 45 to 54 Years | 178 (9.2%) | 298 (15.4%) |
| 55 to 64 Years | 394 (17.3%) | 420 (17.1%) |
| 65 to 74 Years | 261 (12.6%) | 196 (9.1%) |
| 75 Years and over | 156 (11.8%) | 233 (14.2%) |
| Total | 2,226 (15.5%) | 2,185 (14.9%) |
Income Above Poverty by Sex and Age in Carroll County
According to the poverty statistics in Carroll County, males aged 5 years and females aged 6 to 11 years are the age groups that are most secure financially, with 100.0% of males and 93.7% of females in these age groups living above the poverty line.
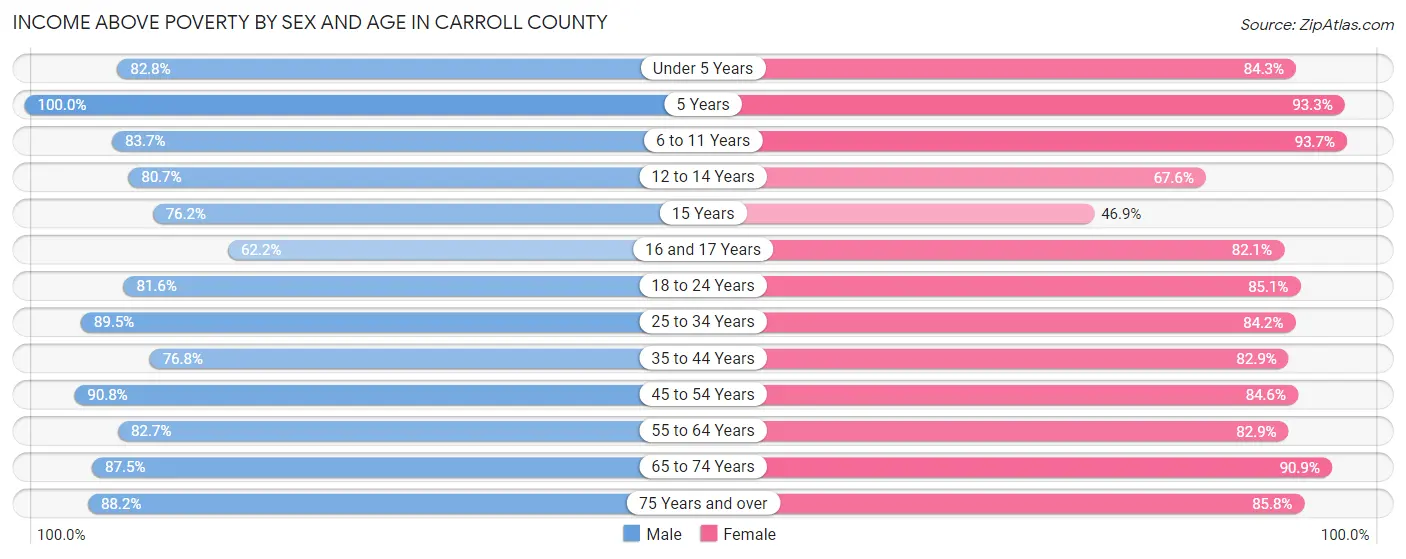
| Age Bracket | Male | Female |
| Under 5 Years | 500 (82.8%) | 509 (84.3%) |
| 5 Years | 56 (100.0%) | 209 (93.3%) |
| 6 to 11 Years | 726 (83.7%) | 792 (93.7%) |
| 12 to 14 Years | 436 (80.7%) | 256 (67.5%) |
| 15 Years | 141 (76.2%) | 52 (46.9%) |
| 16 and 17 Years | 244 (62.2%) | 288 (82.1%) |
| 18 to 24 Years | 796 (81.6%) | 918 (85.1%) |
| 25 to 34 Years | 1,412 (89.5%) | 1,160 (84.2%) |
| 35 to 44 Years | 1,163 (76.8%) | 1,220 (82.9%) |
| 45 to 54 Years | 1,746 (90.7%) | 1,641 (84.6%) |
| 55 to 64 Years | 1,878 (82.7%) | 2,035 (82.9%) |
| 65 to 74 Years | 1,818 (87.5%) | 1,964 (90.9%) |
| 75 Years and over | 1,169 (88.2%) | 1,410 (85.8%) |
| Total | 12,085 (84.5%) | 12,454 (85.1%) |
Income Below Poverty Among Married-Couple Families in Carroll County
The poverty statistics for married-couple families in Carroll County show that 6.5% or 414 of the total 6,397 families live below the poverty line. Families with 3 or 4 children have the highest poverty rate of 7.6%, comprising of 34 families. On the other hand, families with 5 or more children have the lowest poverty rate of 0.0%, which includes 0 families.
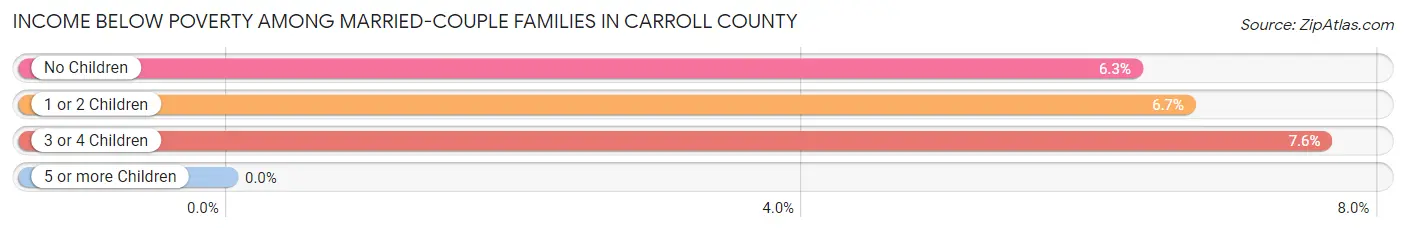
| Children | Above Poverty | Below Poverty |
| No Children | 4,091 (93.7%) | 275 (6.3%) |
| 1 or 2 Children | 1,470 (93.3%) | 105 (6.7%) |
| 3 or 4 Children | 412 (92.4%) | 34 (7.6%) |
| 5 or more Children | 10 (100.0%) | 0 (0.0%) |
| Total | 5,983 (93.5%) | 414 (6.5%) |
Income Below Poverty Among Single-Parent Households in Carroll County
According to the poverty data in Carroll County, 28.8% or 125 single-father households and 36.1% or 440 single-mother households are living below the poverty line. Among single-father households, those with 1 or 2 children have the highest poverty rate, with 48 households (33.1%) experiencing poverty. Likewise, among single-mother households, those with 3 or 4 children have the highest poverty rate, with 59 households (78.7%) falling below the poverty line.
| Children | Single Father | Single Mother |
| No Children | 77 (28.5%) | 72 (12.2%) |
| 1 or 2 Children | 48 (33.1%) | 309 (56.2%) |
| 3 or 4 Children | 0 (0.0%) | 59 (78.7%) |
| 5 or more Children | 0 (0.0%) | 0 (0.0%) |
| Total | 125 (28.8%) | 440 (36.1%) |
Income Below Poverty Among Married-Couple vs Single-Parent Households in Carroll County
The poverty data for Carroll County shows that 414 of the married-couple family households (6.5%) and 565 of the single-parent households (34.2%) are living below the poverty level. Within the married-couple family households, those with 3 or 4 children have the highest poverty rate, with 34 households (7.6%) falling below the poverty line. Among the single-parent households, those with 3 or 4 children have the highest poverty rate, with 59 household (62.8%) living below poverty.
| Children | Married-Couple Families | Single-Parent Households |
| No Children | 275 (6.3%) | 149 (17.3%) |
| 1 or 2 Children | 105 (6.7%) | 357 (51.4%) |
| 3 or 4 Children | 34 (7.6%) | 59 (62.8%) |
| 5 or more Children | 0 (0.0%) | 0 (0.0%) |
| Total | 414 (6.5%) | 565 (34.2%) |
Race in Carroll County
The most populous races in Carroll County are White / Caucasian (27,572 | 94.7%), Hispanic or Latino (1,226 | 4.2%), and Two or more Races (718 | 2.5%).
| Race | # Population | % Population |
| Asian | 38 | 0.1% |
| Black / African American | 139 | 0.5% |
| Hawaiian / Pacific | 10 | 0.0% |
| Hispanic or Latino | 1,226 | 4.2% |
| Native / Alaskan | 70 | 0.2% |
| White / Caucasian | 27,572 | 94.7% |
| Two or more Races | 718 | 2.5% |
| Some other Race | 579 | 2.0% |
| Total | 29,126 | 100.0% |
Ancestry in Carroll County
The most populous ancestries reported in Carroll County are American (8,797 | 30.2%), English (4,581 | 15.7%), Irish (2,736 | 9.4%), German (2,422 | 8.3%), and Scotch-Irish (706 | 2.4%), together accounting for 66.1% of all Carroll County residents.
| Ancestry | # Population | % Population |
| African | 34 | 0.1% |
| American | 8,797 | 30.2% |
| Arab | 75 | 0.3% |
| Bhutanese | 6 | 0.0% |
| Blackfeet | 16 | 0.1% |
| British | 47 | 0.2% |
| Central American | 368 | 1.3% |
| Cherokee | 119 | 0.4% |
| Colombian | 82 | 0.3% |
| Cree | 6 | 0.0% |
| Czech | 4 | 0.0% |
| Czechoslovakian | 5 | 0.0% |
| Dutch | 153 | 0.5% |
| Eastern European | 62 | 0.2% |
| Ecuadorian | 27 | 0.1% |
| English | 4,581 | 15.7% |
| Ethiopian | 2 | 0.0% |
| European | 649 | 2.2% |
| French | 164 | 0.6% |
| French Canadian | 37 | 0.1% |
| German | 2,422 | 8.3% |
| Greek | 21 | 0.1% |
| Honduran | 366 | 1.3% |
| Hungarian | 149 | 0.5% |
| Irish | 2,736 | 9.4% |
| Italian | 485 | 1.7% |
| Jamaican | 31 | 0.1% |
| Lebanese | 7 | 0.0% |
| Lumbee | 1 | 0.0% |
| Mexican | 536 | 1.8% |
| Mexican American Indian | 55 | 0.2% |
| Mongolian | 1 | 0.0% |
| Moroccan | 68 | 0.2% |
| Northern European | 53 | 0.2% |
| Norwegian | 32 | 0.1% |
| Pakistani | 9 | 0.0% |
| Pennsylvania German | 21 | 0.1% |
| Polish | 212 | 0.7% |
| Puerto Rican | 44 | 0.2% |
| Russian | 30 | 0.1% |
| Salvadoran | 2 | 0.0% |
| Scandinavian | 25 | 0.1% |
| Scotch-Irish | 706 | 2.4% |
| Scottish | 477 | 1.6% |
| Slovene | 25 | 0.1% |
| South American | 109 | 0.4% |
| Spaniard | 169 | 0.6% |
| Sri Lankan | 10 | 0.0% |
| Subsaharan African | 38 | 0.1% |
| Swedish | 28 | 0.1% |
| Swiss | 162 | 0.6% |
| Thai | 19 | 0.1% |
| Ukrainian | 35 | 0.1% |
| Welsh | 144 | 0.5% | View All 54 Rows |
Immigrants in Carroll County
The most numerous immigrant groups reported in Carroll County came from Latin America (397 | 1.4%), Central America (340 | 1.2%), Honduras (175 | 0.6%), Mexico (165 | 0.6%), and Africa (111 | 0.4%), together accounting for 4.1% of all Carroll County residents.
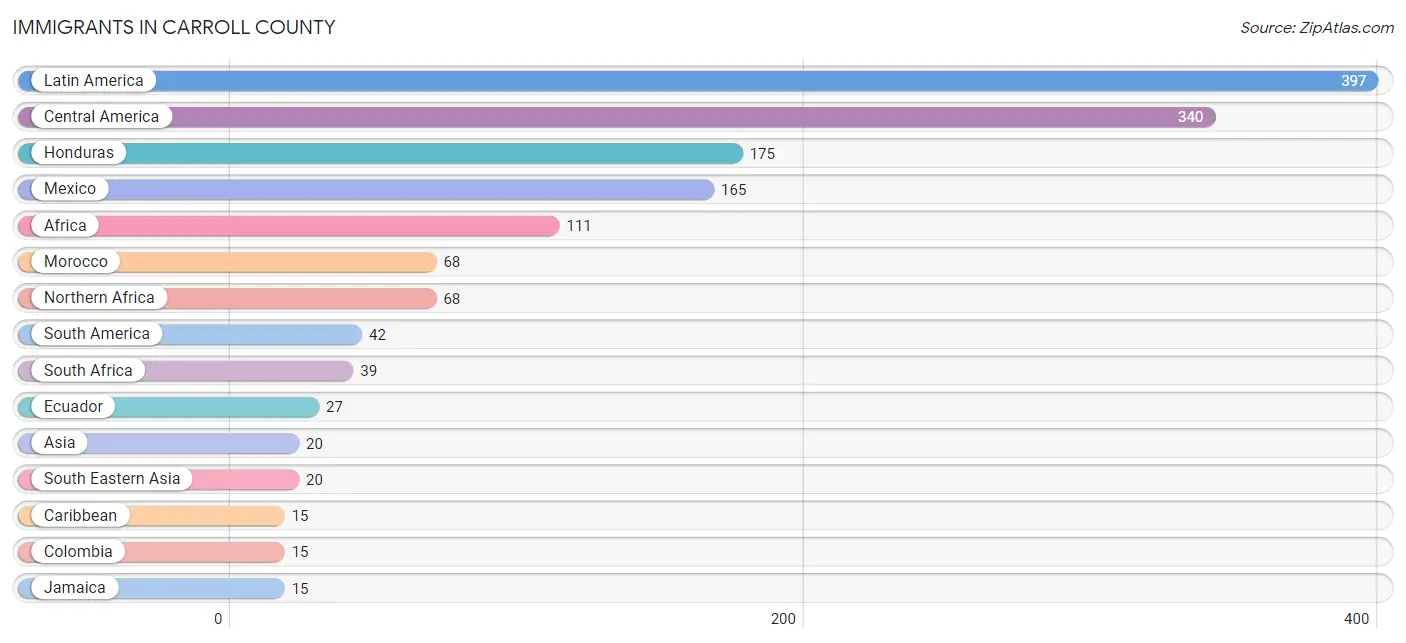
| Immigration Origin | # Population | % Population |
| Africa | 111 | 0.4% |
| Asia | 20 | 0.1% |
| Caribbean | 15 | 0.1% |
| Central America | 340 | 1.2% |
| Colombia | 15 | 0.1% |
| Congo | 1 | 0.0% |
| Eastern Africa | 3 | 0.0% |
| Ecuador | 27 | 0.1% |
| Ethiopia | 2 | 0.0% |
| Honduras | 175 | 0.6% |
| Jamaica | 15 | 0.1% |
| Latin America | 397 | 1.4% |
| Malaysia | 1 | 0.0% |
| Mexico | 165 | 0.6% |
| Middle Africa | 1 | 0.0% |
| Morocco | 68 | 0.2% |
| Northern Africa | 68 | 0.2% |
| South Africa | 39 | 0.1% |
| South America | 42 | 0.1% |
| South Eastern Asia | 20 | 0.1% |
| Thailand | 9 | 0.0% |
| Vietnam | 10 | 0.0% | View All 22 Rows |
Sex and Age in Carroll County
Sex and Age in Carroll County
The most populous age groups in Carroll County are 60 to 64 Years (1,293 | 9.0%) for men and 65 to 69 Years (1,298 | 8.8%) for women.
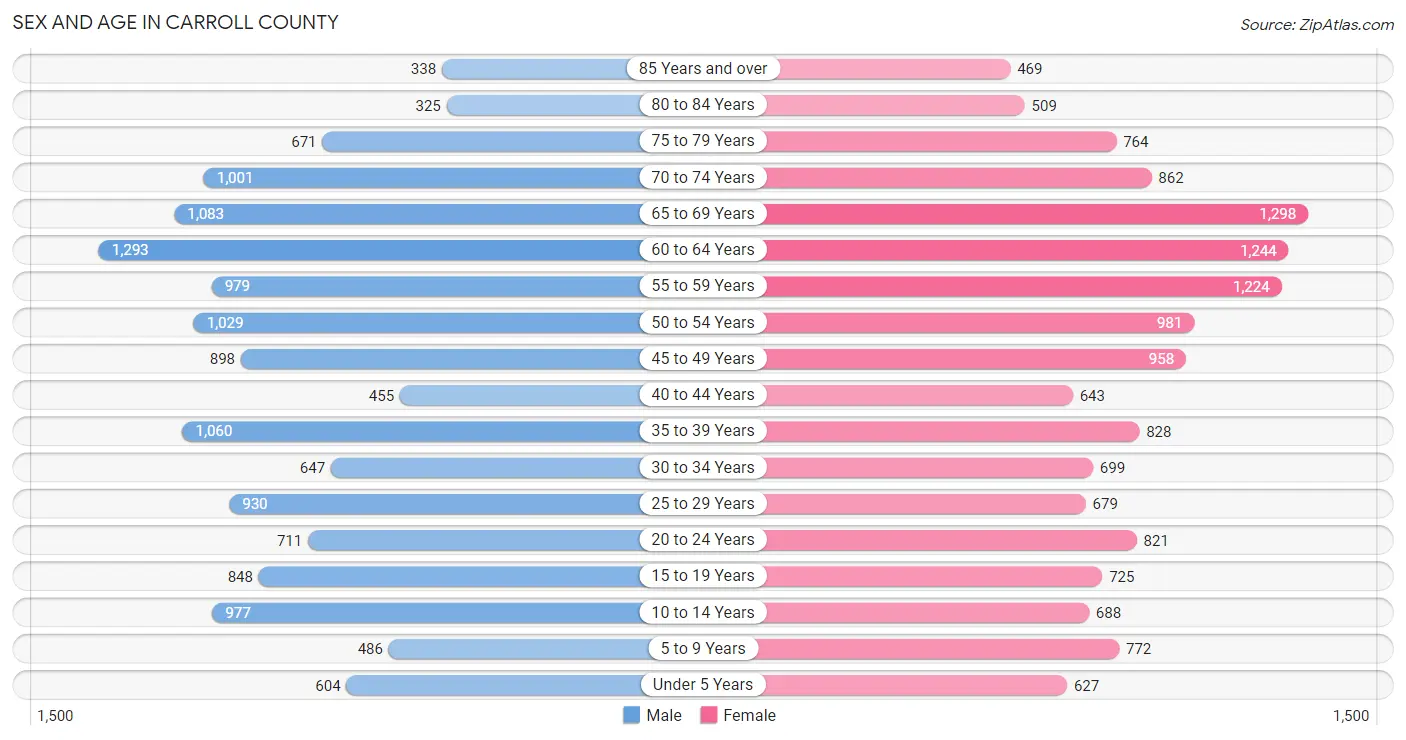
| Age Bracket | Male | Female |
| Under 5 Years | 604 (4.2%) | 627 (4.2%) |
| 5 to 9 Years | 486 (3.4%) | 772 (5.2%) |
| 10 to 14 Years | 977 (6.8%) | 688 (4.6%) |
| 15 to 19 Years | 848 (5.9%) | 725 (4.9%) |
| 20 to 24 Years | 711 (5.0%) | 821 (5.6%) |
| 25 to 29 Years | 930 (6.5%) | 679 (4.6%) |
| 30 to 34 Years | 647 (4.5%) | 699 (4.7%) |
| 35 to 39 Years | 1,060 (7.4%) | 828 (5.6%) |
| 40 to 44 Years | 455 (3.2%) | 643 (4.3%) |
| 45 to 49 Years | 898 (6.3%) | 958 (6.5%) |
| 50 to 54 Years | 1,029 (7.2%) | 981 (6.6%) |
| 55 to 59 Years | 979 (6.8%) | 1,224 (8.3%) |
| 60 to 64 Years | 1,293 (9.0%) | 1,244 (8.4%) |
| 65 to 69 Years | 1,083 (7.5%) | 1,298 (8.8%) |
| 70 to 74 Years | 1,001 (7.0%) | 862 (5.8%) |
| 75 to 79 Years | 671 (4.7%) | 764 (5.2%) |
| 80 to 84 Years | 325 (2.3%) | 509 (3.4%) |
| 85 Years and over | 338 (2.4%) | 469 (3.2%) |
| Total | 14,335 (100.0%) | 14,791 (100.0%) |
Families and Households in Carroll County
Median Family Size in Carroll County
The median family size in Carroll County is 2.95 persons per family, with single female/mother families (1,217 | 15.1%) accounting for the largest median family size of 3.17 persons per family. On the other hand, single male/father families (434 | 5.4%) represent the smallest median family size with 2.78 persons per family.
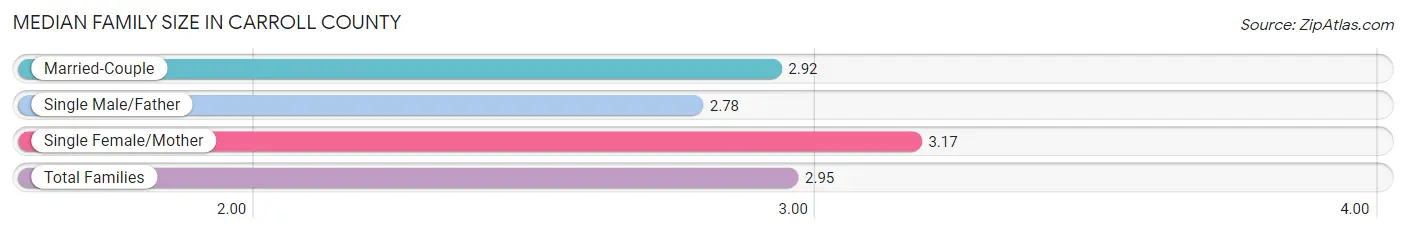
| Family Type | # Families | Family Size |
| Married-Couple | 6,397 (79.5%) | 2.92 |
| Single Male/Father | 434 (5.4%) | 2.78 |
| Single Female/Mother | 1,217 (15.1%) | 3.17 |
| Total Families | 8,048 (100.0%) | 2.95 |
Median Household Size in Carroll County
The median household size in Carroll County is 2.38 persons per household, with single female/mother households (1,217 | 10.0%) accounting for the largest median household size of 3.5 persons per household. non-family households (4,093 | 33.7%) represent the smallest median household size with 1.11 persons per household.
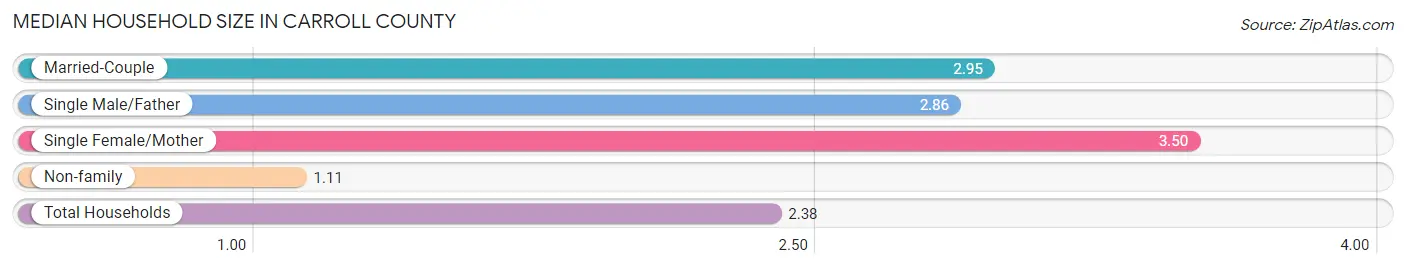
| Household Type | # Households | Household Size |
| Married-Couple | 6,397 (52.7%) | 2.95 |
| Single Male/Father | 434 (3.6%) | 2.86 |
| Single Female/Mother | 1,217 (10.0%) | 3.50 |
| Non-family | 4,093 (33.7%) | 1.11 |
| Total Households | 12,141 (100.0%) | 2.38 |
Household Size by Marriage Status in Carroll County
Out of a total of 12,141 households in Carroll County, 8,048 (66.3%) are family households, while 4,093 (33.7%) are nonfamily households. The most numerous type of family households are 2-person households, comprising 4,531, and the most common type of nonfamily households are 1-person households, comprising 3,761.
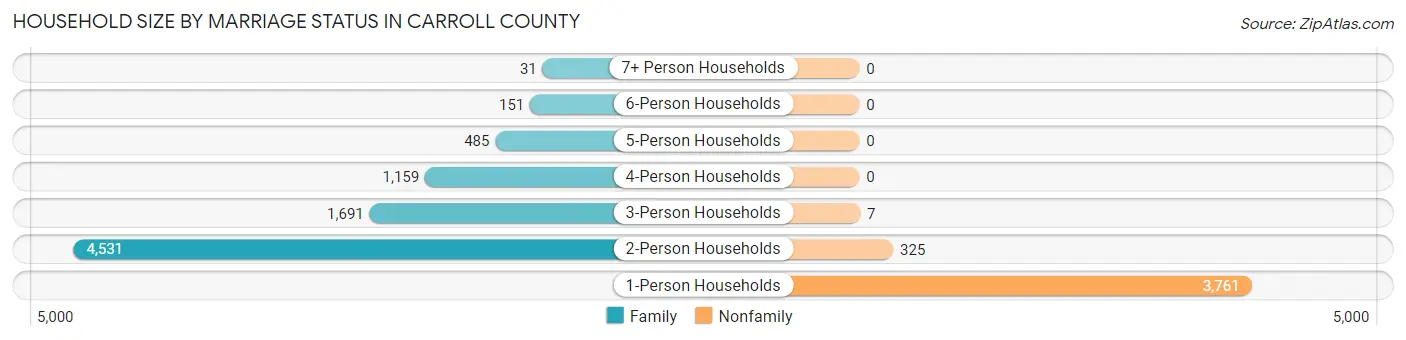
| Household Size | Family Households | Nonfamily Households |
| 1-Person Households | - | 3,761 (31.0%) |
| 2-Person Households | 4,531 (37.3%) | 325 (2.7%) |
| 3-Person Households | 1,691 (13.9%) | 7 (0.1%) |
| 4-Person Households | 1,159 (9.6%) | 0 (0.0%) |
| 5-Person Households | 485 (4.0%) | 0 (0.0%) |
| 6-Person Households | 151 (1.2%) | 0 (0.0%) |
| 7+ Person Households | 31 (0.3%) | 0 (0.0%) |
| Total | 8,048 (66.3%) | 4,093 (33.7%) |
Female Fertility in Carroll County
Fertility by Age in Carroll County
Average fertility rate in Carroll County is 36.0 births per 1,000 women. Women in the age bracket of 20 to 34 years have the highest fertility rate with 68.0 births per 1,000 women. Women in the age bracket of 20 to 34 years acount for 76.0% of all women with births.
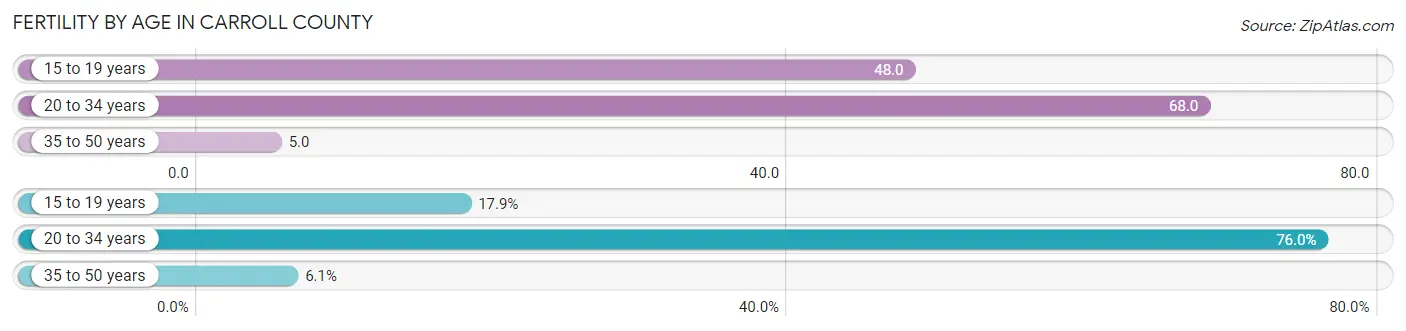
| Age Bracket | Women with Births | Births / 1,000 Women |
| 15 to 19 years | 35 (17.9%) | 48.0 |
| 20 to 34 years | 149 (76.0%) | 68.0 |
| 35 to 50 years | 12 (6.1%) | 5.0 |
| Total | 196 (100.0%) | 36.0 |
Fertility by Age by Marriage Status in Carroll County
54.6% of women with births (196) in Carroll County are married. The highest percentage of unmarried women with births falls into 15 to 19 years age bracket with 100.0% of them unmarried at the time of birth, while the lowest percentage of unmarried women with births belong to 20 to 34 years age bracket with 32.9% of them unmarried.
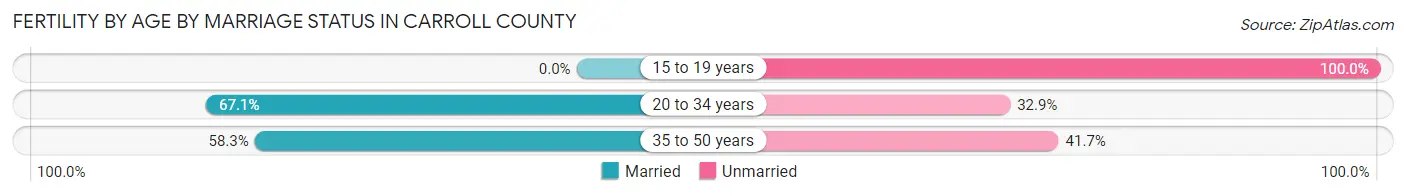
| Age Bracket | Married | Unmarried |
| 15 to 19 years | 0 (0.0%) | 35 (100.0%) |
| 20 to 34 years | 100 (67.1%) | 49 (32.9%) |
| 35 to 50 years | 7 (58.3%) | 5 (41.7%) |
| Total | 107 (54.6%) | 89 (45.4%) |
Fertility by Education in Carroll County
Average fertility rate in Carroll County is 36.0 births per 1,000 women. Women with the education attainment of bachelor's degree have the highest fertility rate of 101.0 births per 1,000 women, while women with the education attainment of high school diploma have the lowest fertility at 21.0 births per 1,000 women. Women with the education attainment of bachelor's degree represent 34.2% of all women with births.
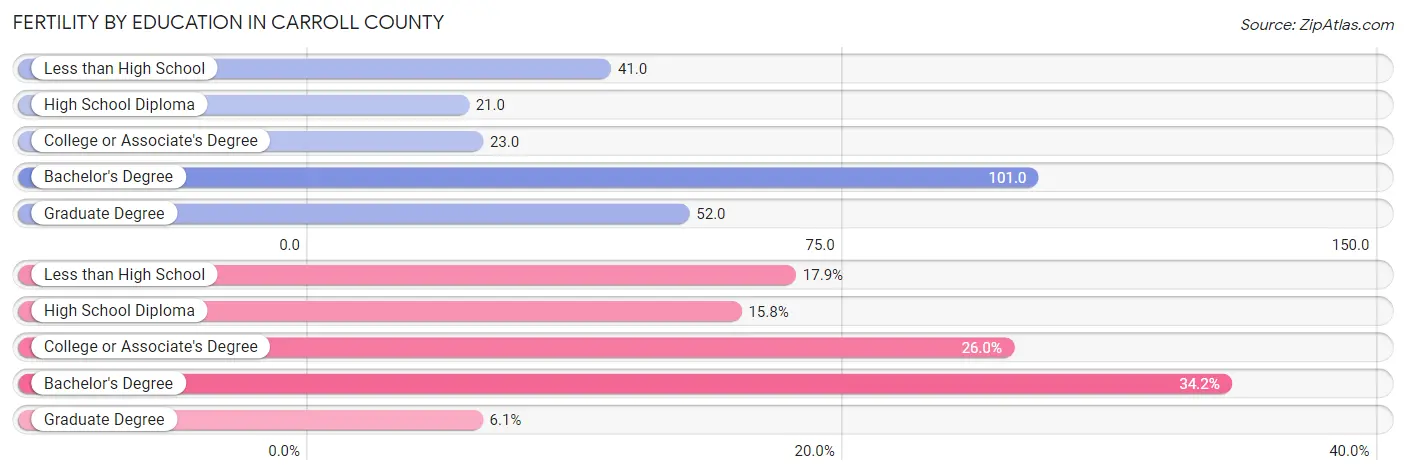
| Educational Attainment | Women with Births | Births / 1,000 Women |
| Less than High School | 35 (17.9%) | 41.0 |
| High School Diploma | 31 (15.8%) | 21.0 |
| College or Associate's Degree | 51 (26.0%) | 23.0 |
| Bachelor's Degree | 67 (34.2%) | 101.0 |
| Graduate Degree | 12 (6.1%) | 52.0 |
| Total | 196 (100.0%) | 36.0 |
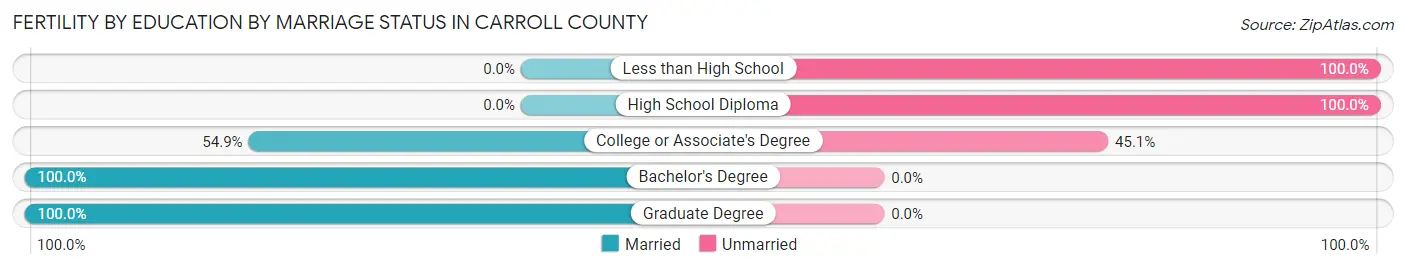
Fertility by Education by Marriage Status in Carroll County
45.4% of women with births in Carroll County are unmarried. Women with the educational attainment of bachelor's degree are most likely to be married with 100.0% of them married at childbirth, while women with the educational attainment of less than high school are least likely to be married with 100.0% of them unmarried at childbirth.
| Educational Attainment | Married | Unmarried |
| Less than High School | 0 (0.0%) | 35 (100.0%) |
| High School Diploma | 0 (0.0%) | 31 (100.0%) |
| College or Associate's Degree | 28 (54.9%) | 23 (45.1%) |
| Bachelor's Degree | 67 (100.0%) | 0 (0.0%) |
| Graduate Degree | 12 (100.0%) | 0 (0.0%) |
| Total | 107 (54.6%) | 89 (45.4%) |
Employment Characteristics in Carroll County
Employment by Class of Employer in Carroll County
Among the 12,029 employed individuals in Carroll County, private company employees (8,072 | 67.1%), local government employees (1,099 | 9.1%), and self-employed (not incorporated) (916 | 7.6%) make up the most common classes of employment.
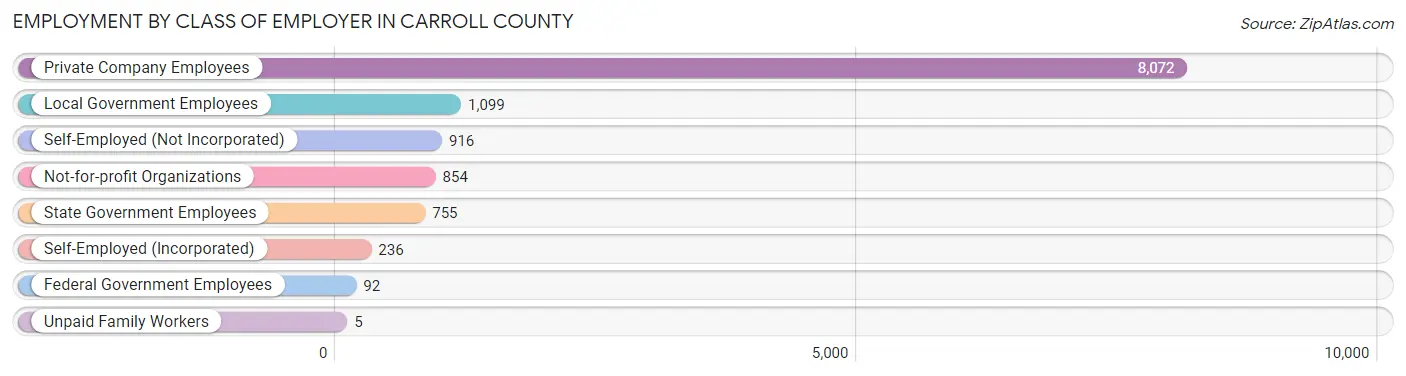
| Employer Class | # Employees | % Employees |
| Private Company Employees | 8,072 | 67.1% |
| Self-Employed (Incorporated) | 236 | 2.0% |
| Self-Employed (Not Incorporated) | 916 | 7.6% |
| Not-for-profit Organizations | 854 | 7.1% |
| Local Government Employees | 1,099 | 9.1% |
| State Government Employees | 755 | 6.3% |
| Federal Government Employees | 92 | 0.8% |
| Unpaid Family Workers | 5 | 0.0% |
| Total | 12,029 | 100.0% |
Employment Status by Age in Carroll County
According to the labor force statistics for Carroll County, out of the total population over 16 years of age (24,675), 52.4% or 12,930 individuals are in the labor force, with 4.8% or 621 of them unemployed. The age group with the highest labor force participation rate is 30 to 34 years, with 85.5% or 1,151 individuals in the labor force. Within the labor force, the 20 to 24 years age range has the highest percentage of unemployed individuals, with 13.6% or 156 of them being unemployed.
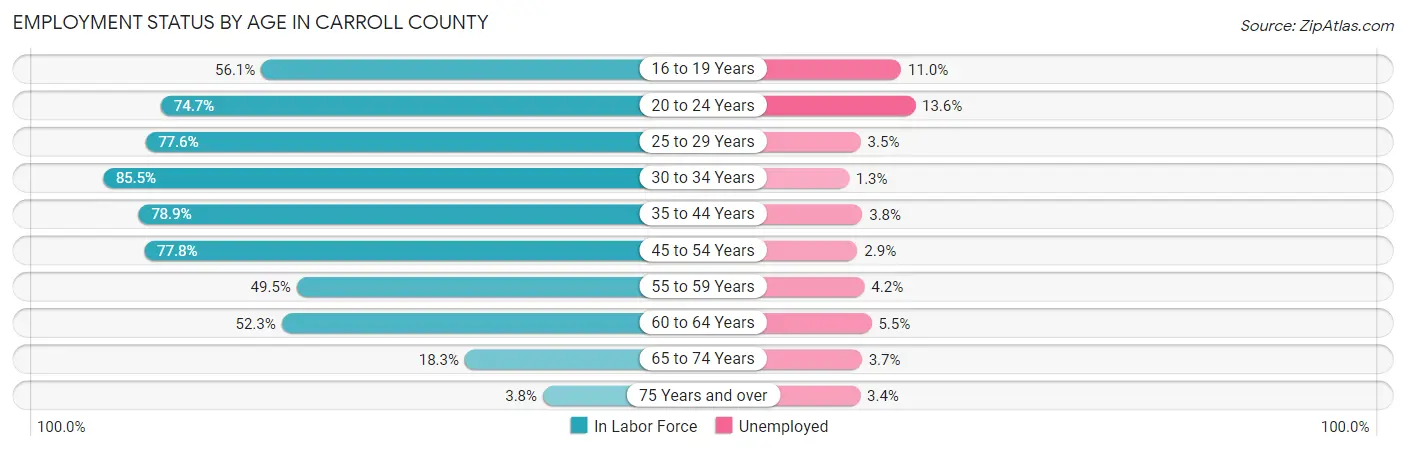
| Age Bracket | In Labor Force | Unemployed |
| 16 to 19 Years | 716 (56.1%) | 79 (11.0%) |
| 20 to 24 Years | 1,144 (74.7%) | 156 (13.6%) |
| 25 to 29 Years | 1,249 (77.6%) | 44 (3.5%) |
| 30 to 34 Years | 1,151 (85.5%) | 15 (1.3%) |
| 35 to 44 Years | 2,356 (78.9%) | 90 (3.8%) |
| 45 to 54 Years | 3,008 (77.8%) | 87 (2.9%) |
| 55 to 59 Years | 1,090 (49.5%) | 46 (4.2%) |
| 60 to 64 Years | 1,327 (52.3%) | 73 (5.5%) |
| 65 to 74 Years | 777 (18.3%) | 29 (3.7%) |
| 75 Years and over | 117 (3.8%) | 4 (3.4%) |
| Total | 12,930 (52.4%) | 621 (4.8%) |
Employment Status by Educational Attainment in Carroll County
According to labor force statistics for Carroll County, 70.0% of individuals (10,183) out of the total population between 25 and 64 years of age (14,547) are in the labor force, with 3.5% or 356 of them being unemployed. The group with the highest labor force participation rate are those with the educational attainment of bachelor's degree or higher, with 86.4% or 2,108 individuals in the labor force. Within the labor force, individuals with less than high school education have the highest percentage of unemployment, with 14.7% or 91 of them being unemployed.
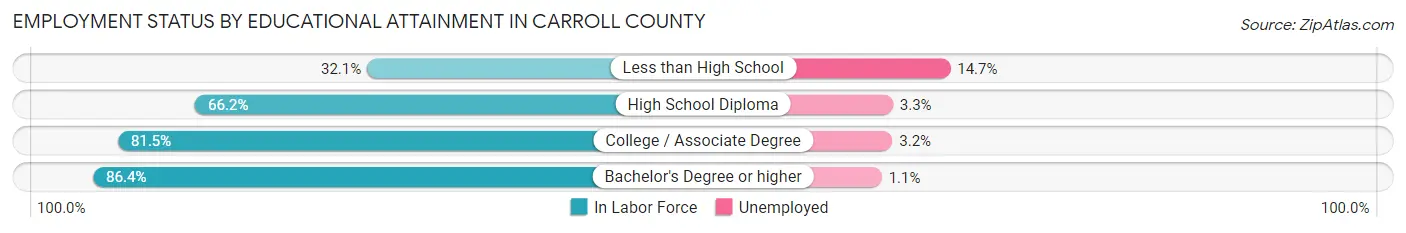
| Educational Attainment | In Labor Force | Unemployed |
| Less than High School | 622 (32.1%) | 285 (14.7%) |
| High School Diploma | 3,620 (66.2%) | 180 (3.3%) |
| College / Associate Degree | 3,831 (81.5%) | 150 (3.2%) |
| Bachelor's Degree or higher | 2,108 (86.4%) | 27 (1.1%) |
| Total | 10,183 (70.0%) | 509 (3.5%) |
Employment Occupations by Sex in Carroll County
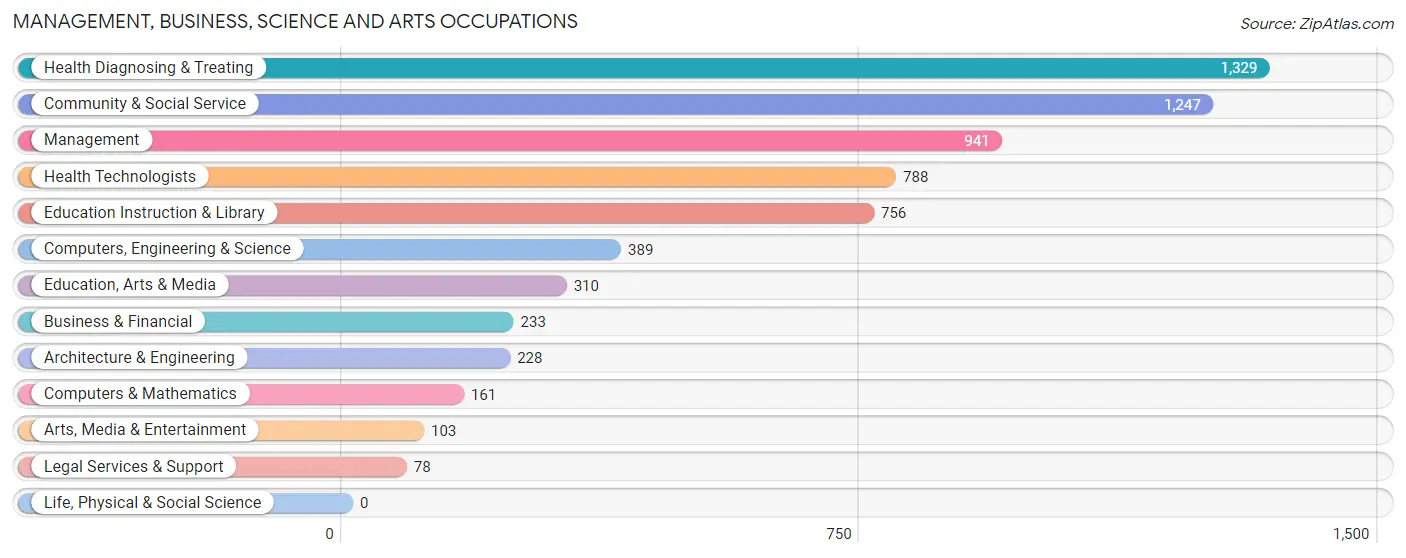
Management, Business, Science and Arts Occupations
The most common Management, Business, Science and Arts occupations in Carroll County are Health Diagnosing & Treating (1,329 | 10.8%), Community & Social Service (1,247 | 10.1%), Management (941 | 7.6%), Health Technologists (788 | 6.4%), and Education Instruction & Library (756 | 6.1%).
Management, Business, Science and Arts Occupations by Sex
Within the Management, Business, Science and Arts occupations in Carroll County, the most male-oriented occupations are Architecture & Engineering (97.4%), Legal Services & Support (82.1%), and Computers, Engineering & Science (69.2%), while the most female-oriented occupations are Health Diagnosing & Treating (90.1%), Health Technologists (89.3%), and Arts, Media & Entertainment (82.5%).
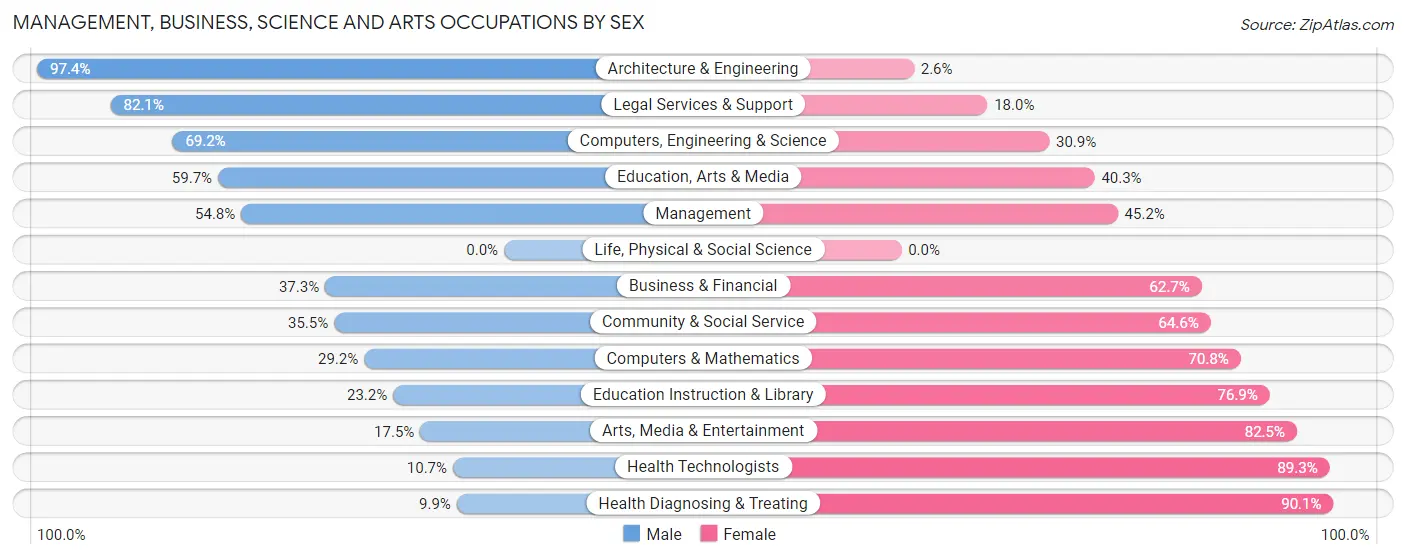
| Occupation | Male | Female |
| Management | 516 (54.8%) | 425 (45.2%) |
| Business & Financial | 87 (37.3%) | 146 (62.7%) |
| Computers, Engineering & Science | 269 (69.2%) | 120 (30.8%) |
| Computers & Mathematics | 47 (29.2%) | 114 (70.8%) |
| Architecture & Engineering | 222 (97.4%) | 6 (2.6%) |
| Life, Physical & Social Science | 0 (0.0%) | 0 (0.0%) |
| Community & Social Service | 442 (35.4%) | 805 (64.5%) |
| Education, Arts & Media | 185 (59.7%) | 125 (40.3%) |
| Legal Services & Support | 64 (82.1%) | 14 (17.9%) |
| Education Instruction & Library | 175 (23.2%) | 581 (76.8%) |
| Arts, Media & Entertainment | 18 (17.5%) | 85 (82.5%) |
| Health Diagnosing & Treating | 131 (9.9%) | 1,198 (90.1%) |
| Health Technologists | 84 (10.7%) | 704 (89.3%) |
| Total (Category) | 1,445 (34.9%) | 2,694 (65.1%) |
| Total (Overall) | 6,309 (51.3%) | 5,994 (48.7%) |
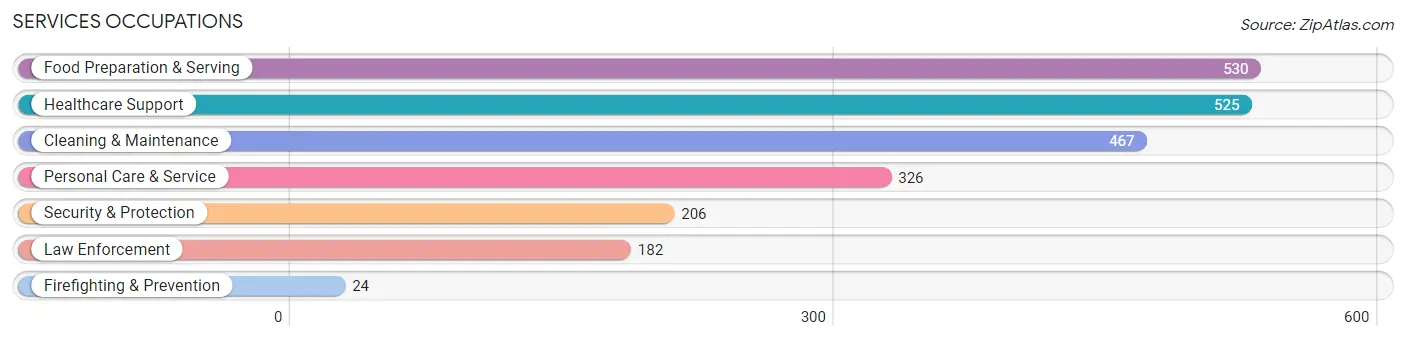
Services Occupations
The most common Services occupations in Carroll County are Food Preparation & Serving (530 | 4.3%), Healthcare Support (525 | 4.3%), Cleaning & Maintenance (467 | 3.8%), Personal Care & Service (326 | 2.6%), and Security & Protection (206 | 1.7%).
Services Occupations by Sex
Within the Services occupations in Carroll County, the most male-oriented occupations are Firefighting & Prevention (100.0%), Security & Protection (95.6%), and Law Enforcement (95.1%), while the most female-oriented occupations are Healthcare Support (91.2%), Food Preparation & Serving (77.2%), and Personal Care & Service (65.6%).
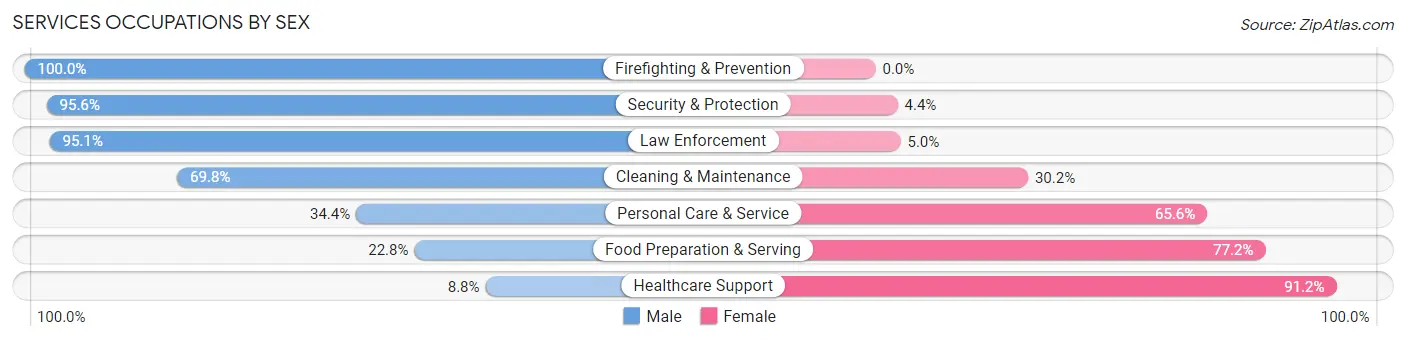
| Occupation | Male | Female |
| Healthcare Support | 46 (8.8%) | 479 (91.2%) |
| Security & Protection | 197 (95.6%) | 9 (4.4%) |
| Firefighting & Prevention | 24 (100.0%) | 0 (0.0%) |
| Law Enforcement | 173 (95.1%) | 9 (5.0%) |
| Food Preparation & Serving | 121 (22.8%) | 409 (77.2%) |
| Cleaning & Maintenance | 326 (69.8%) | 141 (30.2%) |
| Personal Care & Service | 112 (34.4%) | 214 (65.6%) |
| Total (Category) | 802 (39.1%) | 1,252 (61.0%) |
| Total (Overall) | 6,309 (51.3%) | 5,994 (48.7%) |
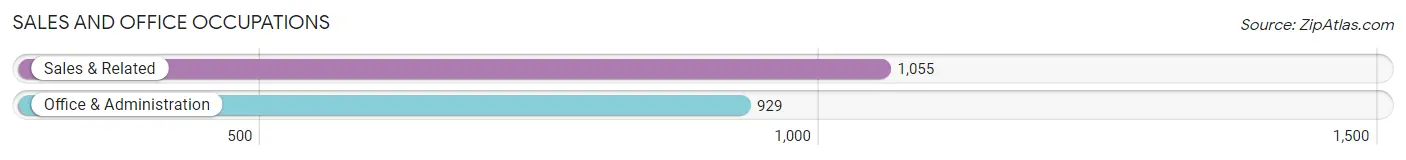
Sales and Office Occupations
The most common Sales and Office occupations in Carroll County are Sales & Related (1,055 | 8.6%), and Office & Administration (929 | 7.5%).
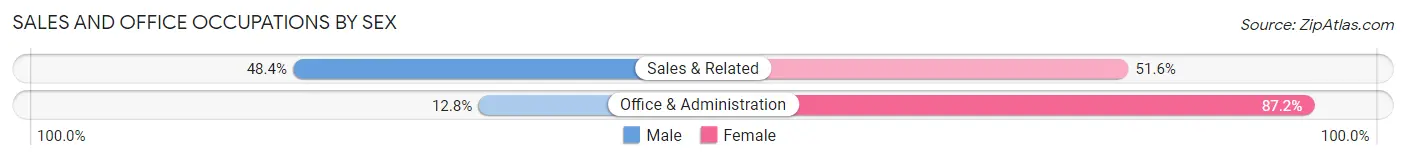
Sales and Office Occupations by Sex
| Occupation | Male | Female |
| Sales & Related | 511 (48.4%) | 544 (51.6%) |
| Office & Administration | 119 (12.8%) | 810 (87.2%) |
| Total (Category) | 630 (31.8%) | 1,354 (68.2%) |
| Total (Overall) | 6,309 (51.3%) | 5,994 (48.7%) |
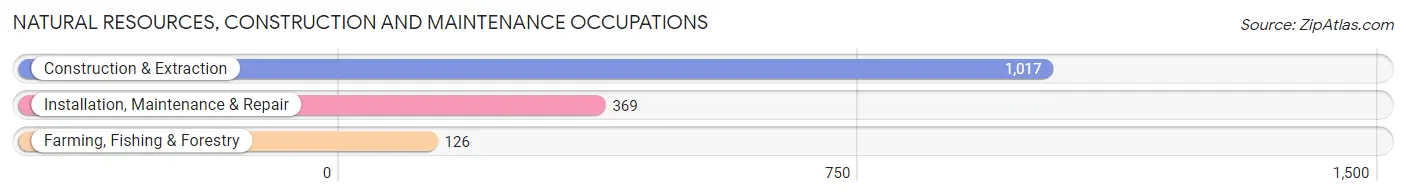
Natural Resources, Construction and Maintenance Occupations
The most common Natural Resources, Construction and Maintenance occupations in Carroll County are Construction & Extraction (1,017 | 8.3%), Installation, Maintenance & Repair (369 | 3.0%), and Farming, Fishing & Forestry (126 | 1.0%).
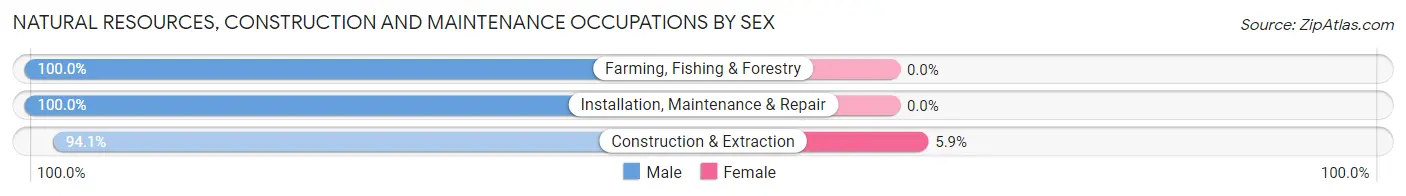
Natural Resources, Construction and Maintenance Occupations by Sex
| Occupation | Male | Female |
| Farming, Fishing & Forestry | 126 (100.0%) | 0 (0.0%) |
| Construction & Extraction | 957 (94.1%) | 60 (5.9%) |
| Installation, Maintenance & Repair | 369 (100.0%) | 0 (0.0%) |
| Total (Category) | 1,452 (96.0%) | 60 (4.0%) |
| Total (Overall) | 6,309 (51.3%) | 5,994 (48.7%) |
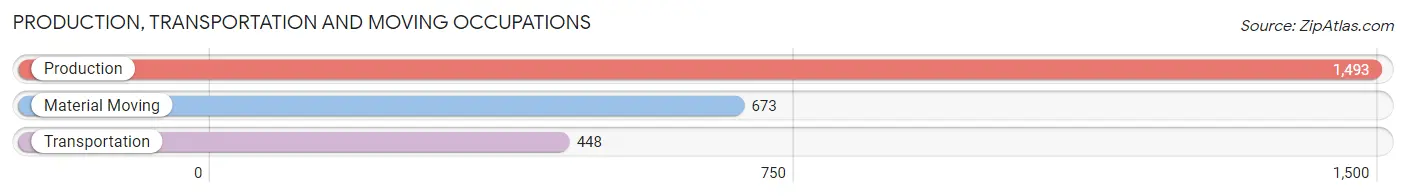
Production, Transportation and Moving Occupations
The most common Production, Transportation and Moving occupations in Carroll County are Production (1,493 | 12.1%), Material Moving (673 | 5.5%), and Transportation (448 | 3.6%).
Production, Transportation and Moving Occupations by Sex
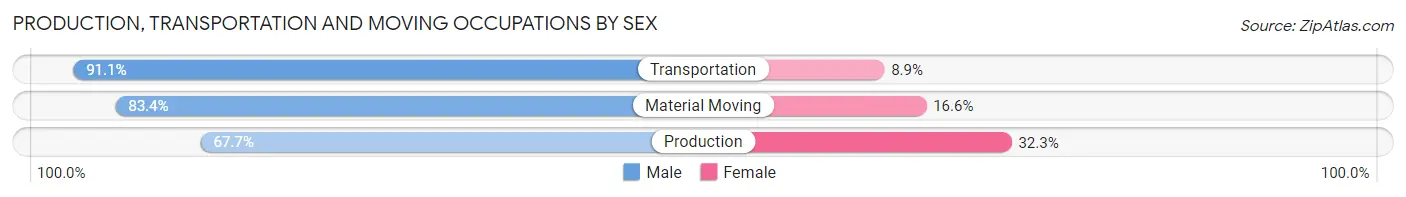
| Occupation | Male | Female |
| Production | 1,011 (67.7%) | 482 (32.3%) |
| Transportation | 408 (91.1%) | 40 (8.9%) |
| Material Moving | 561 (83.4%) | 112 (16.6%) |
| Total (Category) | 1,980 (75.7%) | 634 (24.2%) |
| Total (Overall) | 6,309 (51.3%) | 5,994 (48.7%) |
Employment Industries by Sex in Carroll County
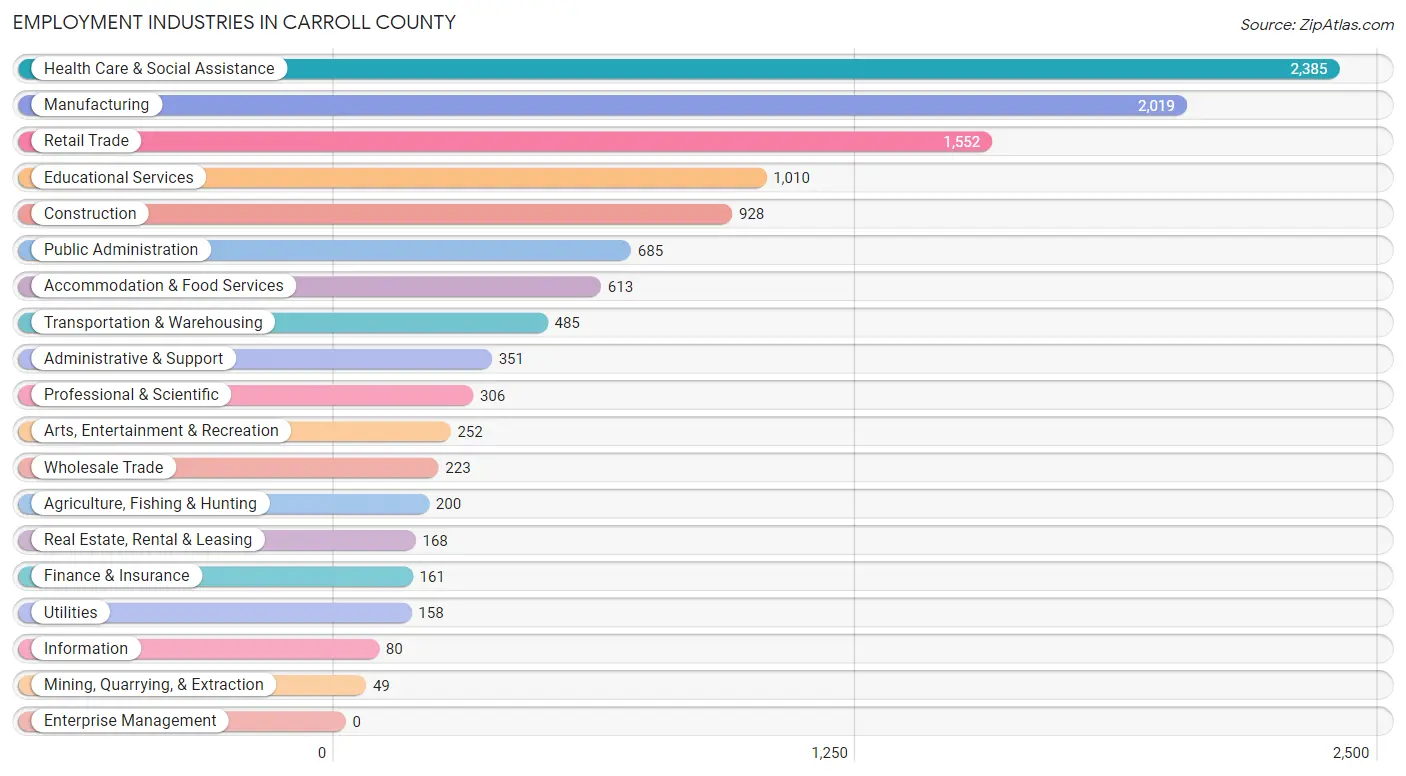
Employment Industries in Carroll County
The major employment industries in Carroll County include Health Care & Social Assistance (2,385 | 19.4%), Manufacturing (2,019 | 16.4%), Retail Trade (1,552 | 12.6%), Educational Services (1,010 | 8.2%), and Construction (928 | 7.5%).
Employment Industries by Sex in Carroll County
The Carroll County industries that see more men than women are Mining, Quarrying, & Extraction (100.0%), Utilities (100.0%), and Wholesale Trade (95.1%), whereas the industries that tend to have a higher number of women are Health Care & Social Assistance (89.6%), Finance & Insurance (88.2%), and Educational Services (75.7%).
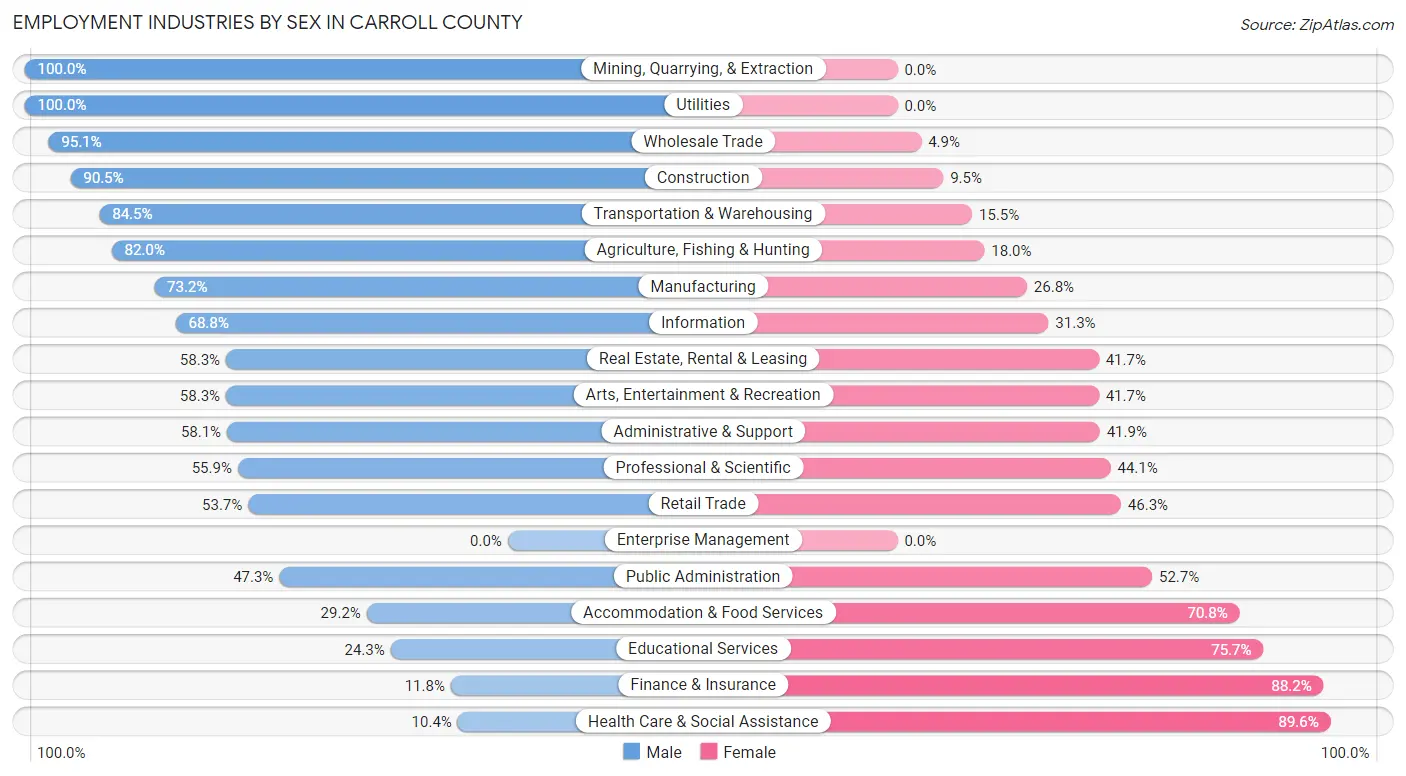
| Industry | Male | Female |
| Agriculture, Fishing & Hunting | 164 (82.0%) | 36 (18.0%) |
| Mining, Quarrying, & Extraction | 49 (100.0%) | 0 (0.0%) |
| Construction | 840 (90.5%) | 88 (9.5%) |
| Manufacturing | 1,478 (73.2%) | 541 (26.8%) |
| Wholesale Trade | 212 (95.1%) | 11 (4.9%) |
| Retail Trade | 834 (53.7%) | 718 (46.3%) |
| Transportation & Warehousing | 410 (84.5%) | 75 (15.5%) |
| Utilities | 158 (100.0%) | 0 (0.0%) |
| Information | 55 (68.8%) | 25 (31.2%) |
| Finance & Insurance | 19 (11.8%) | 142 (88.2%) |
| Real Estate, Rental & Leasing | 98 (58.3%) | 70 (41.7%) |
| Professional & Scientific | 171 (55.9%) | 135 (44.1%) |
| Enterprise Management | 0 (0.0%) | 0 (0.0%) |
| Administrative & Support | 204 (58.1%) | 147 (41.9%) |
| Educational Services | 245 (24.3%) | 765 (75.7%) |
| Health Care & Social Assistance | 247 (10.4%) | 2,138 (89.6%) |
| Arts, Entertainment & Recreation | 147 (58.3%) | 105 (41.7%) |
| Accommodation & Food Services | 179 (29.2%) | 434 (70.8%) |
| Public Administration | 324 (47.3%) | 361 (52.7%) |
| Total | 6,309 (51.3%) | 5,994 (48.7%) |
Education in Carroll County
School Enrollment in Carroll County
The most common levels of schooling among the 4,726 students in Carroll County are middle school (1,300 | 27.5%), high school (1,151 | 24.3%), and elementary school (977 | 20.7%).
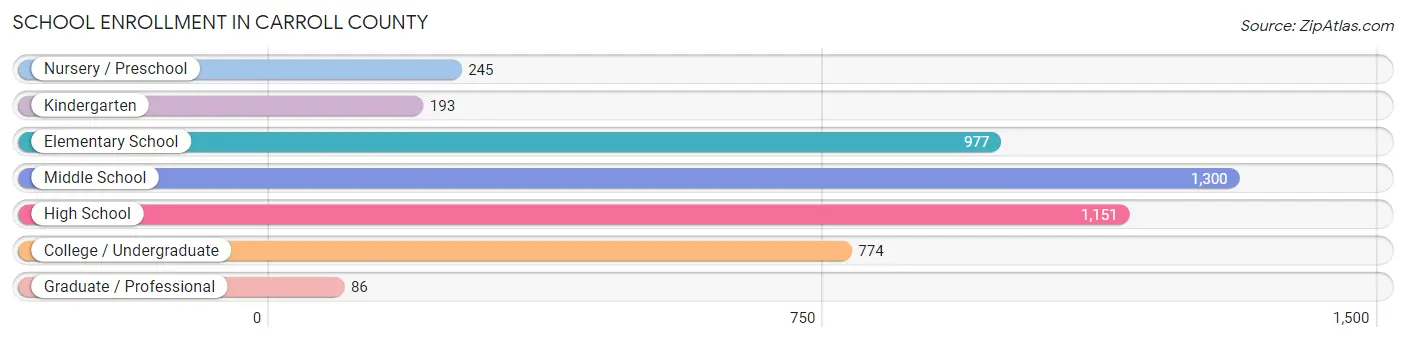
| School Level | # Students | % Students |
| Nursery / Preschool | 245 | 5.2% |
| Kindergarten | 193 | 4.1% |
| Elementary School | 977 | 20.7% |
| Middle School | 1,300 | 27.5% |
| High School | 1,151 | 24.3% |
| College / Undergraduate | 774 | 16.4% |
| Graduate / Professional | 86 | 1.8% |
| Total | 4,726 | 100.0% |
School Enrollment by Age by Funding Source in Carroll County
Out of a total of 4,726 students who are enrolled in schools in Carroll County, 619 (13.1%) attend a private institution, while the remaining 4,107 (86.9%) are enrolled in public schools. The age group of 35 years and over has the highest likelihood of being enrolled in private schools, with 78 (31.5% in the age bracket) enrolled. Conversely, the age group of 15 to 17 year olds has the lowest likelihood of being enrolled in a private school, with 908 (96.0% in the age bracket) attending a public institution.
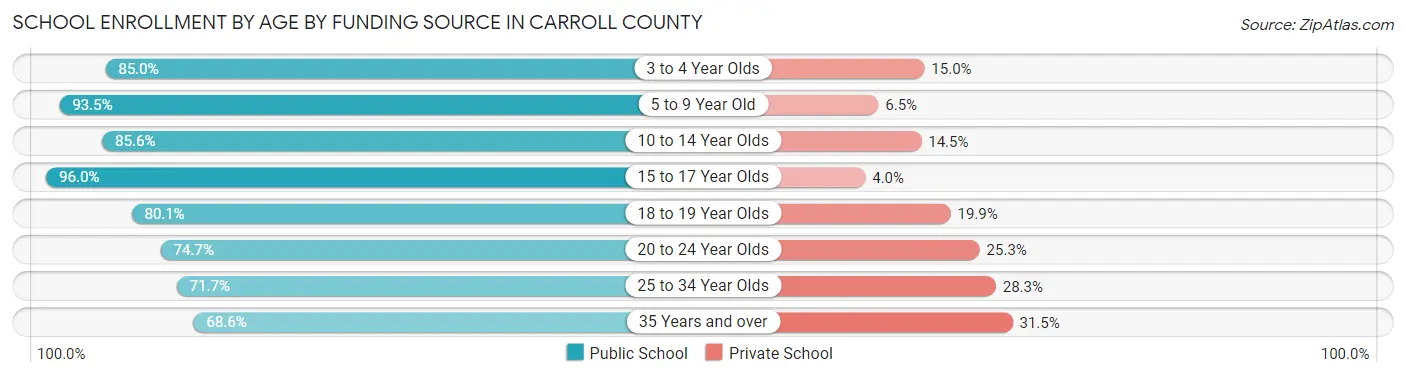
| Age Bracket | Public School | Private School |
| 3 to 4 Year Olds | 192 (85.0%) | 34 (15.0%) |
| 5 to 9 Year Old | 926 (93.5%) | 64 (6.5%) |
| 10 to 14 Year Olds | 1,373 (85.6%) | 232 (14.4%) |
| 15 to 17 Year Olds | 908 (96.0%) | 38 (4.0%) |
| 18 to 19 Year Olds | 185 (80.1%) | 46 (19.9%) |
| 20 to 24 Year Olds | 224 (74.7%) | 76 (25.3%) |
| 25 to 34 Year Olds | 129 (71.7%) | 51 (28.3%) |
| 35 Years and over | 170 (68.5%) | 78 (31.5%) |
| Total | 4,107 (86.9%) | 619 (13.1%) |
Educational Attainment by Field of Study in Carroll County
Education (866 | 21.9%), science & technology (499 | 12.6%), business (497 | 12.6%), bio, nature & agricultural (360 | 9.1%), and liberal arts & history (316 | 8.0%) are the most common fields of study among 3,948 individuals in Carroll County who have obtained a bachelor's degree or higher.
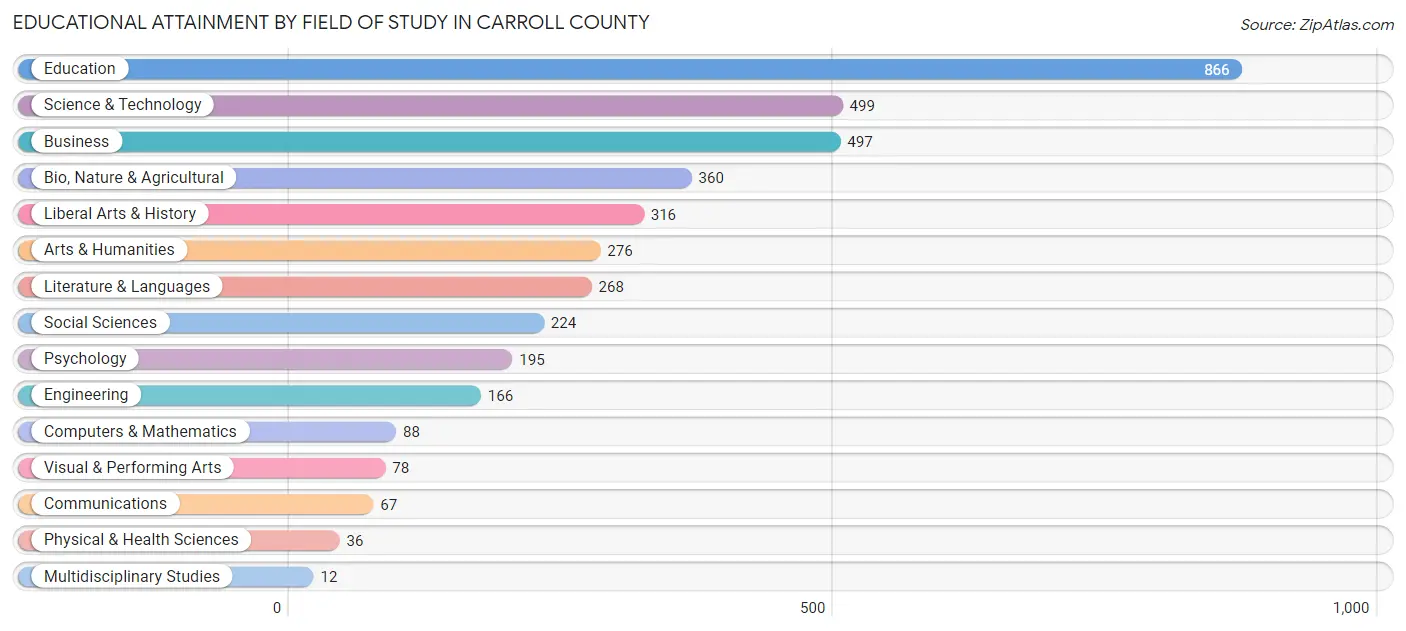
| Field of Study | # Graduates | % Graduates |
| Computers & Mathematics | 88 | 2.2% |
| Bio, Nature & Agricultural | 360 | 9.1% |
| Physical & Health Sciences | 36 | 0.9% |
| Psychology | 195 | 4.9% |
| Social Sciences | 224 | 5.7% |
| Engineering | 166 | 4.2% |
| Multidisciplinary Studies | 12 | 0.3% |
| Science & Technology | 499 | 12.6% |
| Business | 497 | 12.6% |
| Education | 866 | 21.9% |
| Literature & Languages | 268 | 6.8% |
| Liberal Arts & History | 316 | 8.0% |
| Visual & Performing Arts | 78 | 2.0% |
| Communications | 67 | 1.7% |
| Arts & Humanities | 276 | 7.0% |
| Total | 3,948 | 100.0% |
Transportation & Commute in Carroll County
Vehicle Availability by Sex in Carroll County
The most prevalent vehicle ownership categories in Carroll County are males with 2 vehicles (2,102, accounting for 34.2%) and females with 2 vehicles (2,287, making up 35.9%).
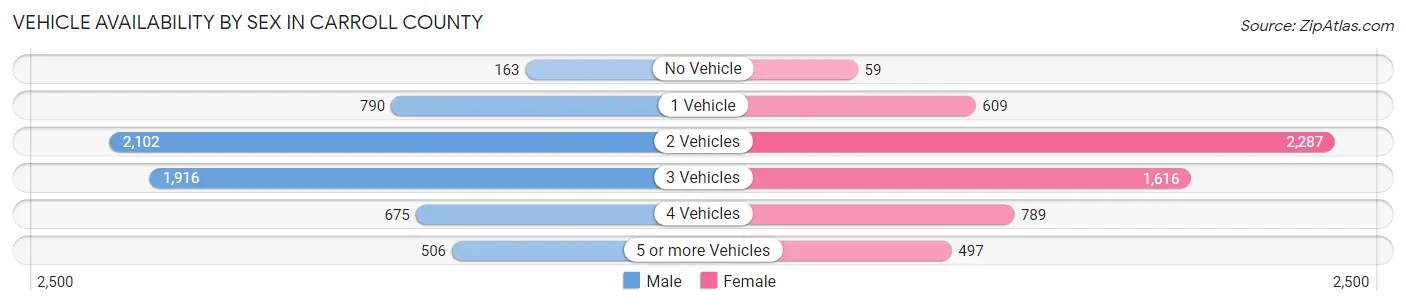
| Vehicles Available | Male | Female |
| No Vehicle | 163 (2.6%) | 59 (1.0%) |
| 1 Vehicle | 790 (12.8%) | 609 (10.4%) |
| 2 Vehicles | 2,102 (34.2%) | 2,287 (39.1%) |
| 3 Vehicles | 1,916 (31.1%) | 1,616 (27.6%) |
| 4 Vehicles | 675 (11.0%) | 789 (13.5%) |
| 5 or more Vehicles | 506 (8.2%) | 497 (8.5%) |
| Total | 6,152 (100.0%) | 5,857 (100.0%) |
Commute Time in Carroll County
The most frequently occuring commute durations in Carroll County are 15 to 19 minutes (1,841 commuters, 15.9%), 20 to 24 minutes (1,732 commuters, 14.9%), and 10 to 14 minutes (1,508 commuters, 13.0%).
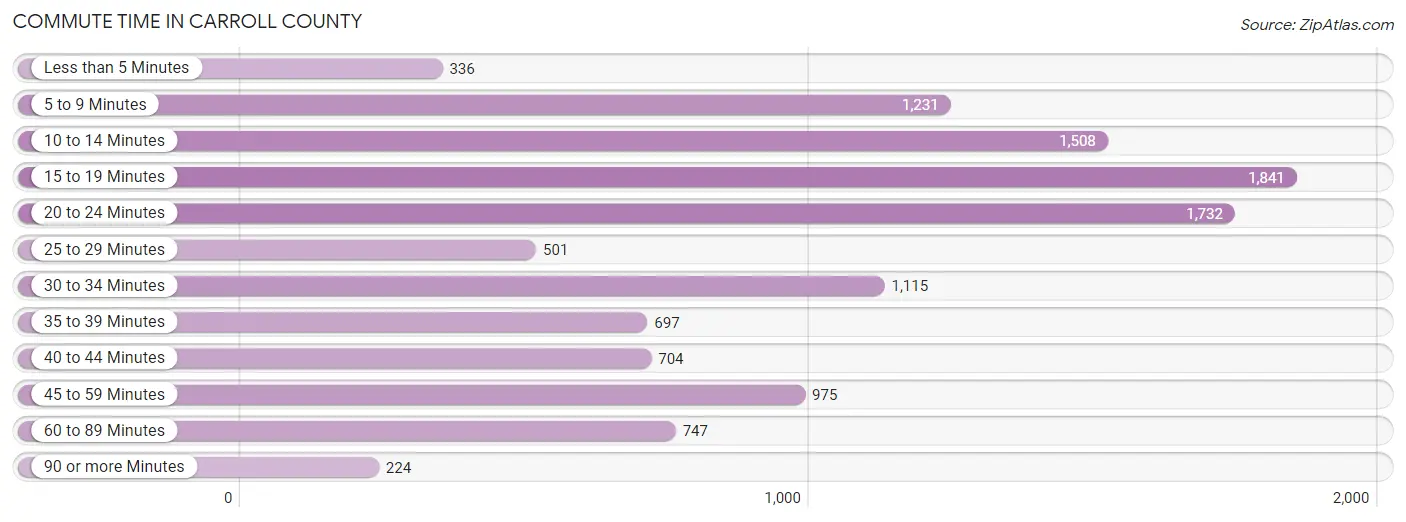
| Commute Time | # Commuters | % Commuters |
| Less than 5 Minutes | 336 | 2.9% |
| 5 to 9 Minutes | 1,231 | 10.6% |
| 10 to 14 Minutes | 1,508 | 13.0% |
| 15 to 19 Minutes | 1,841 | 15.9% |
| 20 to 24 Minutes | 1,732 | 14.9% |
| 25 to 29 Minutes | 501 | 4.3% |
| 30 to 34 Minutes | 1,115 | 9.6% |
| 35 to 39 Minutes | 697 | 6.0% |
| 40 to 44 Minutes | 704 | 6.1% |
| 45 to 59 Minutes | 975 | 8.4% |
| 60 to 89 Minutes | 747 | 6.4% |
| 90 or more Minutes | 224 | 1.9% |
Commute Time by Sex in Carroll County
The most common commute times in Carroll County are 20 to 24 minutes (996 commuters, 16.6%) for males and 15 to 19 minutes (988 commuters, 17.6%) for females.
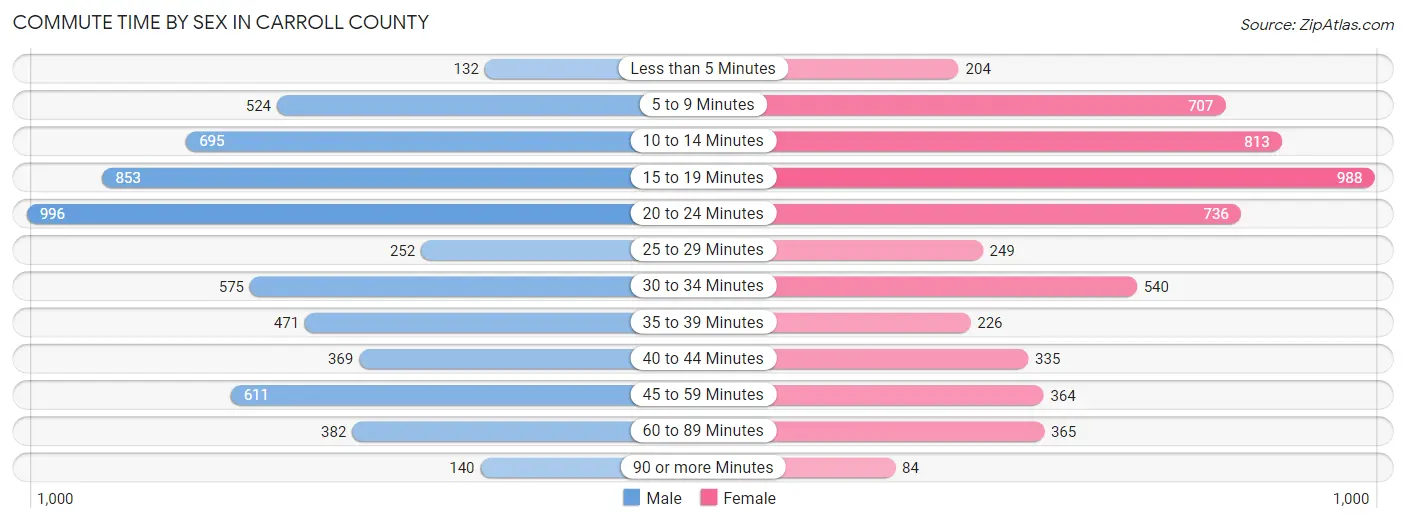
| Commute Time | Male | Female |
| Less than 5 Minutes | 132 (2.2%) | 204 (3.6%) |
| 5 to 9 Minutes | 524 (8.7%) | 707 (12.6%) |
| 10 to 14 Minutes | 695 (11.6%) | 813 (14.5%) |
| 15 to 19 Minutes | 853 (14.2%) | 988 (17.6%) |
| 20 to 24 Minutes | 996 (16.6%) | 736 (13.1%) |
| 25 to 29 Minutes | 252 (4.2%) | 249 (4.4%) |
| 30 to 34 Minutes | 575 (9.6%) | 540 (9.6%) |
| 35 to 39 Minutes | 471 (7.9%) | 226 (4.0%) |
| 40 to 44 Minutes | 369 (6.1%) | 335 (6.0%) |
| 45 to 59 Minutes | 611 (10.2%) | 364 (6.5%) |
| 60 to 89 Minutes | 382 (6.4%) | 365 (6.5%) |
| 90 or more Minutes | 140 (2.3%) | 84 (1.5%) |
Time of Departure to Work by Sex in Carroll County
The most frequent times of departure to work in Carroll County are 7:00 AM to 7:29 AM (1,055, 17.6%) for males and 7:30 AM to 7:59 AM (905, 16.1%) for females.
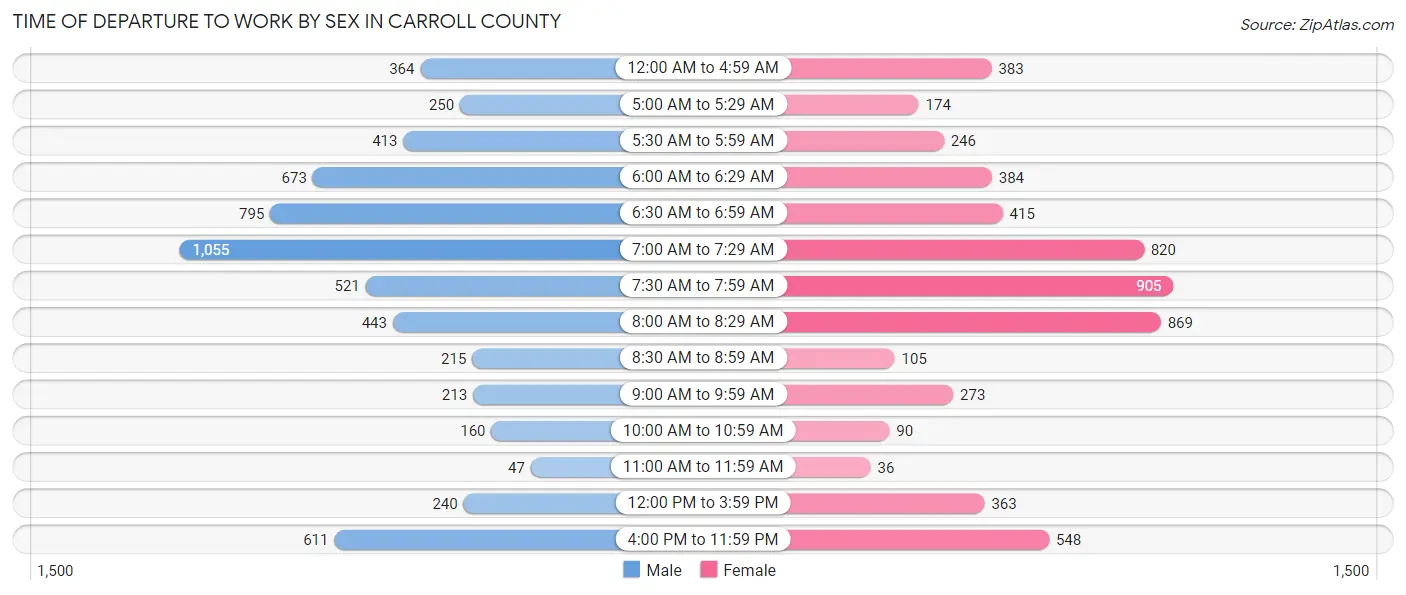
| Time of Departure | Male | Female |
| 12:00 AM to 4:59 AM | 364 (6.1%) | 383 (6.8%) |
| 5:00 AM to 5:29 AM | 250 (4.2%) | 174 (3.1%) |
| 5:30 AM to 5:59 AM | 413 (6.9%) | 246 (4.4%) |
| 6:00 AM to 6:29 AM | 673 (11.2%) | 384 (6.8%) |
| 6:30 AM to 6:59 AM | 795 (13.3%) | 415 (7.4%) |
| 7:00 AM to 7:29 AM | 1,055 (17.6%) | 820 (14.6%) |
| 7:30 AM to 7:59 AM | 521 (8.7%) | 905 (16.1%) |
| 8:00 AM to 8:29 AM | 443 (7.4%) | 869 (15.5%) |
| 8:30 AM to 8:59 AM | 215 (3.6%) | 105 (1.9%) |
| 9:00 AM to 9:59 AM | 213 (3.5%) | 273 (4.9%) |
| 10:00 AM to 10:59 AM | 160 (2.7%) | 90 (1.6%) |
| 11:00 AM to 11:59 AM | 47 (0.8%) | 36 (0.6%) |
| 12:00 PM to 3:59 PM | 240 (4.0%) | 363 (6.5%) |
| 4:00 PM to 11:59 PM | 611 (10.2%) | 548 (9.8%) |
| Total | 6,000 (100.0%) | 5,611 (100.0%) |
Housing Occupancy in Carroll County
Occupancy by Ownership in Carroll County
Of the total 12,141 dwellings in Carroll County, owner-occupied units account for 9,522 (78.4%), while renter-occupied units make up 2,619 (21.6%).
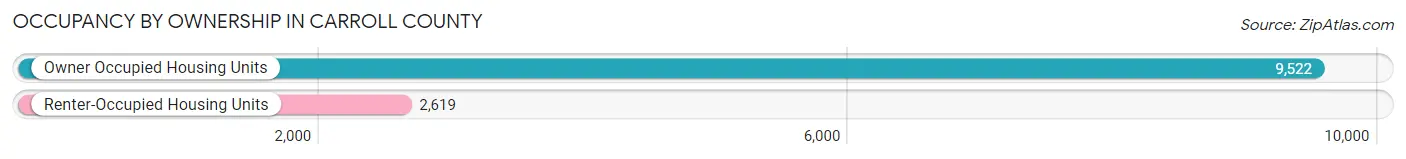
| Occupancy | # Housing Units | % Housing Units |
| Owner Occupied Housing Units | 9,522 | 78.4% |
| Renter-Occupied Housing Units | 2,619 | 21.6% |
| Total Occupied Housing Units | 12,141 | 100.0% |
Occupancy by Household Size in Carroll County
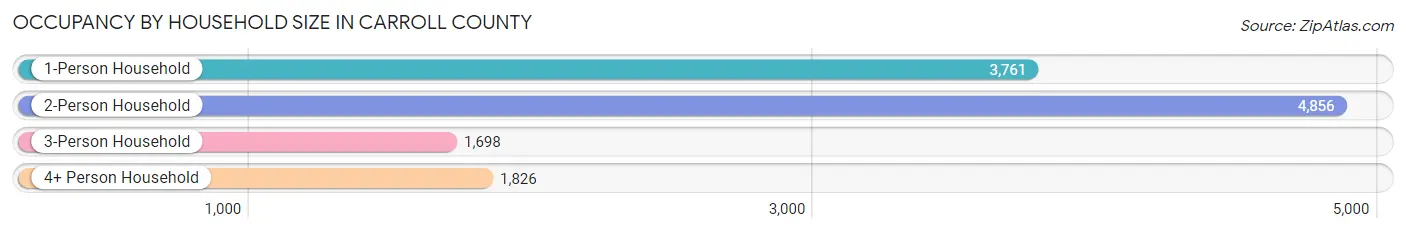
| Household Size | # Housing Units | % Housing Units |
| 1-Person Household | 3,761 | 31.0% |
| 2-Person Household | 4,856 | 40.0% |
| 3-Person Household | 1,698 | 14.0% |
| 4+ Person Household | 1,826 | 15.0% |
| Total Housing Units | 12,141 | 100.0% |
Occupancy by Ownership by Household Size in Carroll County
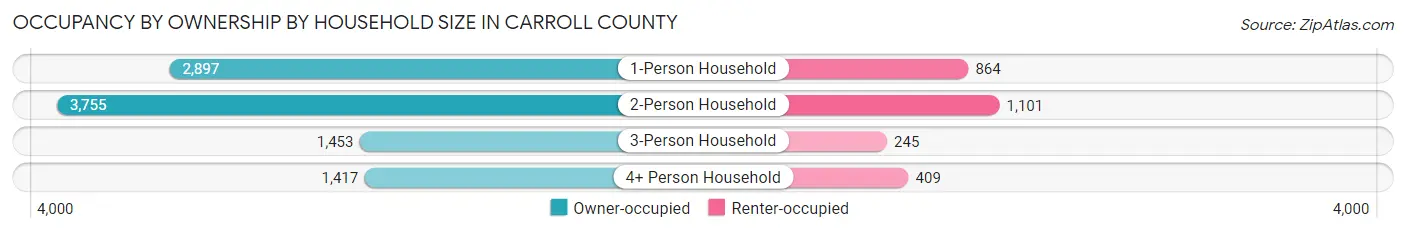
| Household Size | Owner-occupied | Renter-occupied |
| 1-Person Household | 2,897 (77.0%) | 864 (23.0%) |
| 2-Person Household | 3,755 (77.3%) | 1,101 (22.7%) |
| 3-Person Household | 1,453 (85.6%) | 245 (14.4%) |
| 4+ Person Household | 1,417 (77.6%) | 409 (22.4%) |
| Total Housing Units | 9,522 (78.4%) | 2,619 (21.6%) |
Occupancy by Educational Attainment in Carroll County
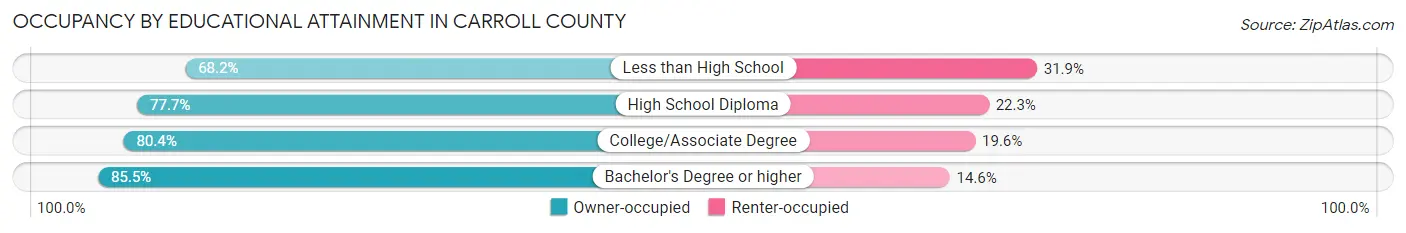
| Household Size | Owner-occupied | Renter-occupied |
| Less than High School | 1,290 (68.1%) | 603 (31.9%) |
| High School Diploma | 3,266 (77.7%) | 938 (22.3%) |
| College/Associate Degree | 3,152 (80.4%) | 769 (19.6%) |
| Bachelor's Degree or higher | 1,814 (85.5%) | 309 (14.5%) |
Occupancy by Age of Householder in Carroll County
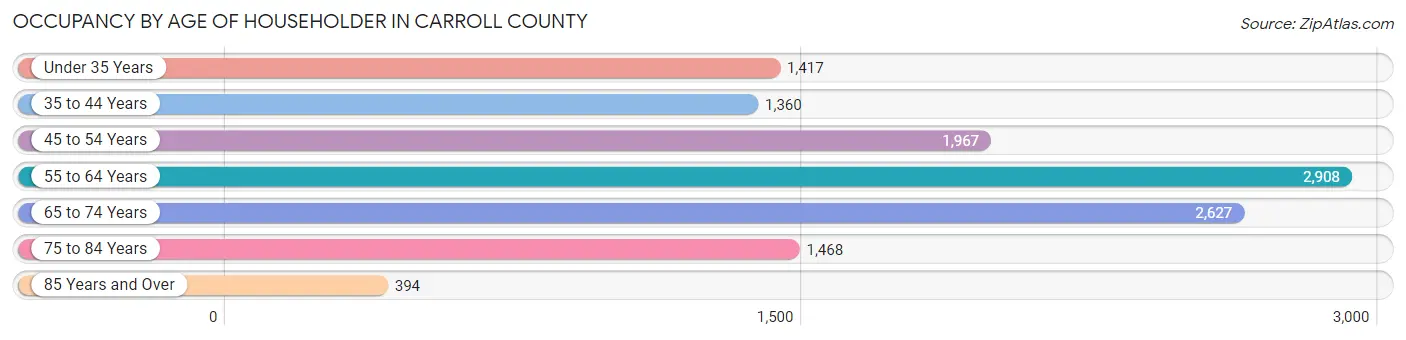
| Age Bracket | # Households | % Households |
| Under 35 Years | 1,417 | 11.7% |
| 35 to 44 Years | 1,360 | 11.2% |
| 45 to 54 Years | 1,967 | 16.2% |
| 55 to 64 Years | 2,908 | 23.9% |
| 65 to 74 Years | 2,627 | 21.6% |
| 75 to 84 Years | 1,468 | 12.1% |
| 85 Years and Over | 394 | 3.3% |
| Total | 12,141 | 100.0% |
Housing Finances in Carroll County
Median Income by Occupancy in Carroll County
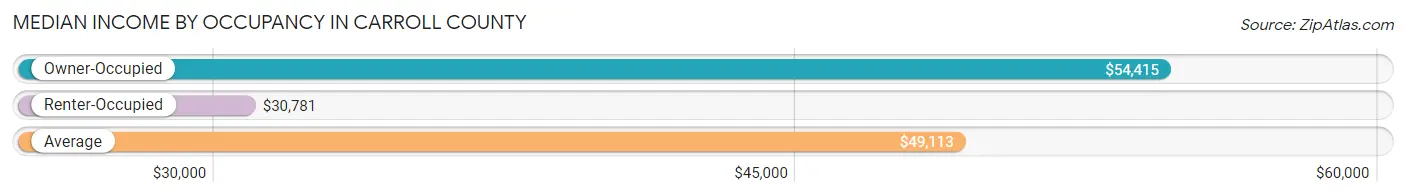
| Occupancy Type | # Households | Median Income |
| Owner-Occupied | 9,522 (78.4%) | $54,415 |
| Renter-Occupied | 2,619 (21.6%) | $30,781 |
| Average | 12,141 (100.0%) | $49,113 |
Occupancy by Householder Income Bracket in Carroll County
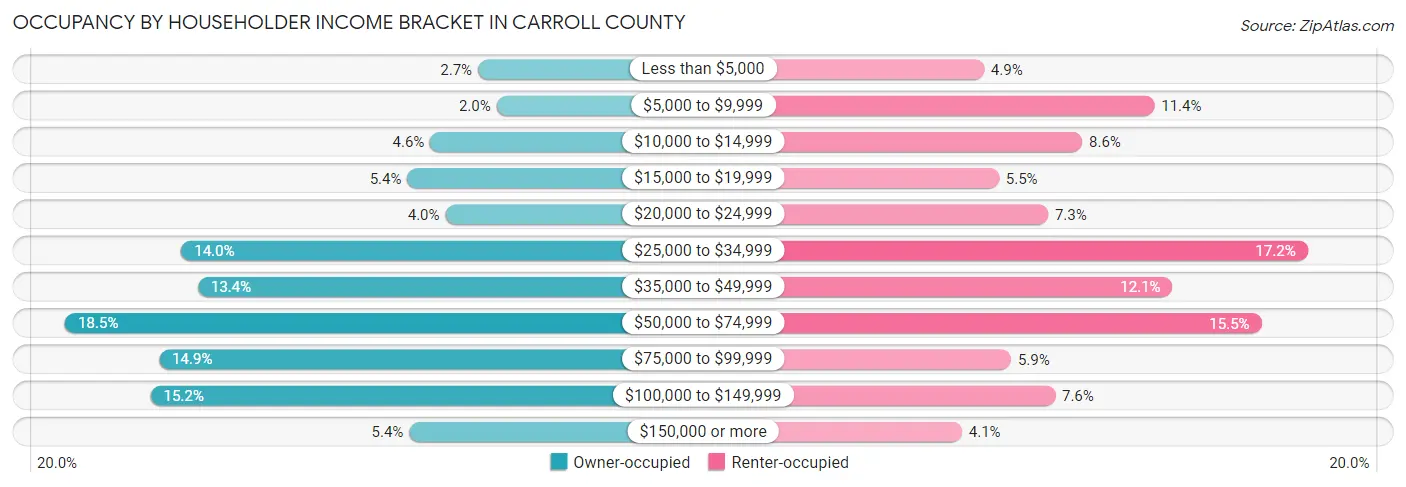
| Income Bracket | Owner-occupied | Renter-occupied |
| Less than $5,000 | 260 (2.7%) | 128 (4.9%) |
| $5,000 to $9,999 | 192 (2.0%) | 298 (11.4%) |
| $10,000 to $14,999 | 433 (4.5%) | 226 (8.6%) |
| $15,000 to $19,999 | 516 (5.4%) | 143 (5.5%) |
| $20,000 to $24,999 | 378 (4.0%) | 192 (7.3%) |
| $25,000 to $34,999 | 1,336 (14.0%) | 451 (17.2%) |
| $35,000 to $49,999 | 1,276 (13.4%) | 316 (12.1%) |
| $50,000 to $74,999 | 1,758 (18.5%) | 405 (15.5%) |
| $75,000 to $99,999 | 1,417 (14.9%) | 155 (5.9%) |
| $100,000 to $149,999 | 1,447 (15.2%) | 199 (7.6%) |
| $150,000 or more | 509 (5.3%) | 106 (4.1%) |
| Total | 9,522 (100.0%) | 2,619 (100.0%) |
Monthly Housing Cost Tiers in Carroll County
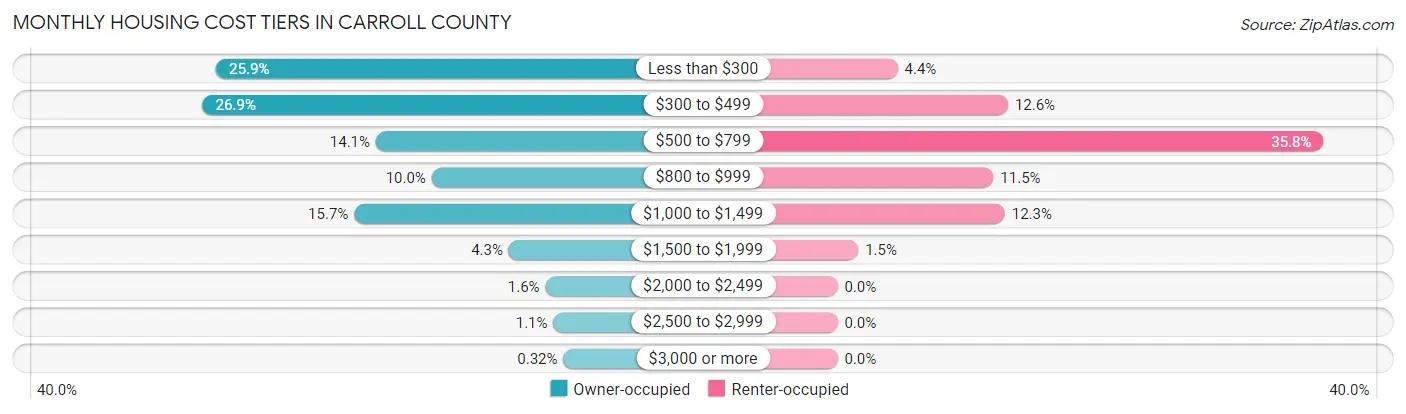
| Monthly Cost | Owner-occupied | Renter-occupied |
| Less than $300 | 2,465 (25.9%) | 116 (4.4%) |
| $300 to $499 | 2,560 (26.9%) | 329 (12.6%) |
| $500 to $799 | 1,345 (14.1%) | 937 (35.8%) |
| $800 to $999 | 954 (10.0%) | 301 (11.5%) |
| $1,000 to $1,499 | 1,498 (15.7%) | 323 (12.3%) |
| $1,500 to $1,999 | 413 (4.3%) | 40 (1.5%) |
| $2,000 to $2,499 | 156 (1.6%) | 0 (0.0%) |
| $2,500 to $2,999 | 101 (1.1%) | 0 (0.0%) |
| $3,000 or more | 30 (0.3%) | 0 (0.0%) |
| Total | 9,522 (100.0%) | 2,619 (100.0%) |
Physical Housing Characteristics in Carroll County
Housing Structures in Carroll County
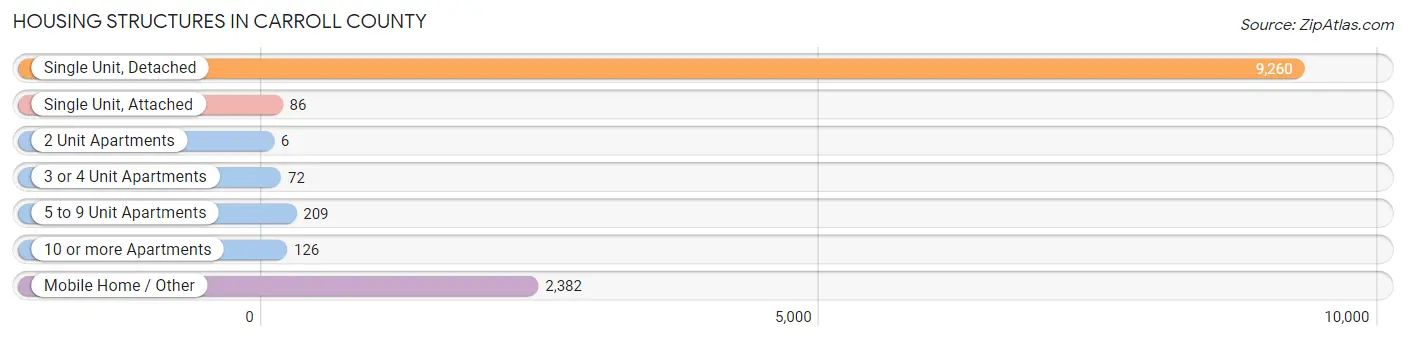
| Structure Type | # Housing Units | % Housing Units |
| Single Unit, Detached | 9,260 | 76.3% |
| Single Unit, Attached | 86 | 0.7% |
| 2 Unit Apartments | 6 | 0.1% |
| 3 or 4 Unit Apartments | 72 | 0.6% |
| 5 to 9 Unit Apartments | 209 | 1.7% |
| 10 or more Apartments | 126 | 1.0% |
| Mobile Home / Other | 2,382 | 19.6% |
| Total | 12,141 | 100.0% |
Housing Structures by Occupancy in Carroll County
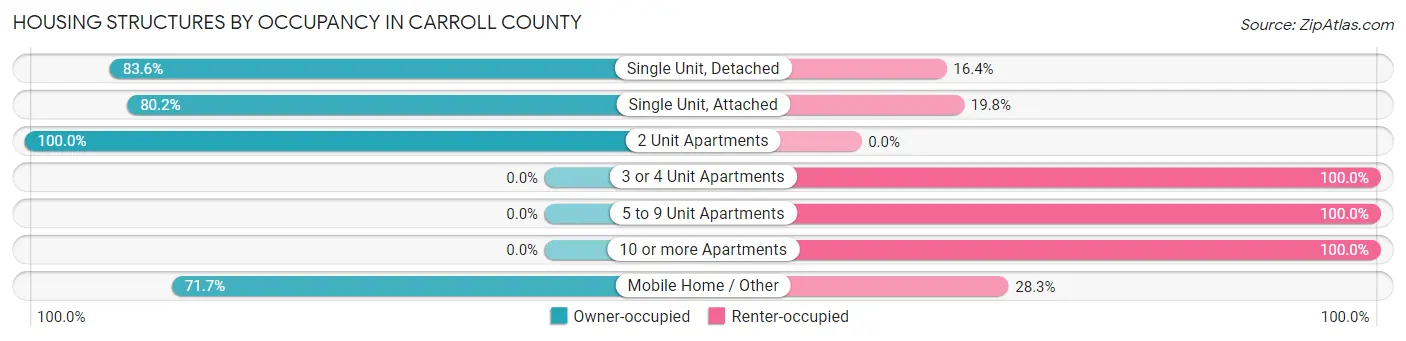
| Structure Type | Owner-occupied | Renter-occupied |
| Single Unit, Detached | 7,740 (83.6%) | 1,520 (16.4%) |
| Single Unit, Attached | 69 (80.2%) | 17 (19.8%) |
| 2 Unit Apartments | 6 (100.0%) | 0 (0.0%) |
| 3 or 4 Unit Apartments | 0 (0.0%) | 72 (100.0%) |
| 5 to 9 Unit Apartments | 0 (0.0%) | 209 (100.0%) |
| 10 or more Apartments | 0 (0.0%) | 126 (100.0%) |
| Mobile Home / Other | 1,707 (71.7%) | 675 (28.3%) |
| Total | 9,522 (78.4%) | 2,619 (21.6%) |
Housing Structures by Number of Rooms in Carroll County
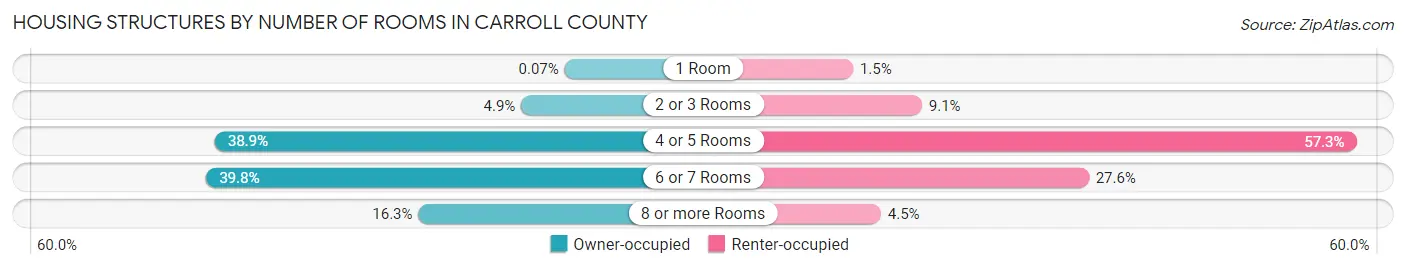
| Number of Rooms | Owner-occupied | Renter-occupied |
| 1 Room | 7 (0.1%) | 38 (1.5%) |
| 2 or 3 Rooms | 466 (4.9%) | 238 (9.1%) |
| 4 or 5 Rooms | 3,703 (38.9%) | 1,501 (57.3%) |
| 6 or 7 Rooms | 3,794 (39.8%) | 723 (27.6%) |
| 8 or more Rooms | 1,552 (16.3%) | 119 (4.5%) |
| Total | 9,522 (100.0%) | 2,619 (100.0%) |
Housing Structure by Heating Type in Carroll County
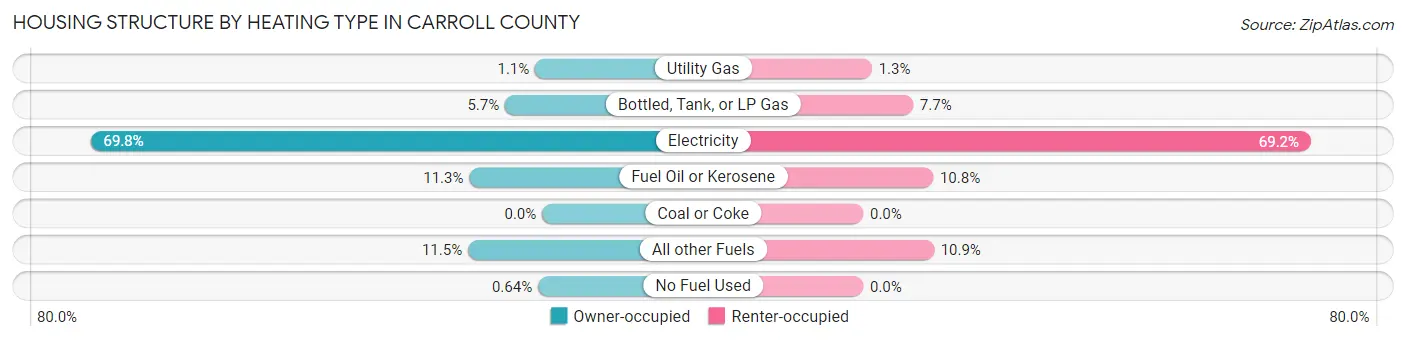
| Heating Type | Owner-occupied | Renter-occupied |
| Utility Gas | 103 (1.1%) | 35 (1.3%) |
| Bottled, Tank, or LP Gas | 546 (5.7%) | 202 (7.7%) |
| Electricity | 6,649 (69.8%) | 1,813 (69.2%) |
| Fuel Oil or Kerosene | 1,072 (11.3%) | 283 (10.8%) |
| Coal or Coke | 0 (0.0%) | 0 (0.0%) |
| All other Fuels | 1,091 (11.5%) | 286 (10.9%) |
| No Fuel Used | 61 (0.6%) | 0 (0.0%) |
| Total | 9,522 (100.0%) | 2,619 (100.0%) |
Household Vehicle Usage in Carroll County
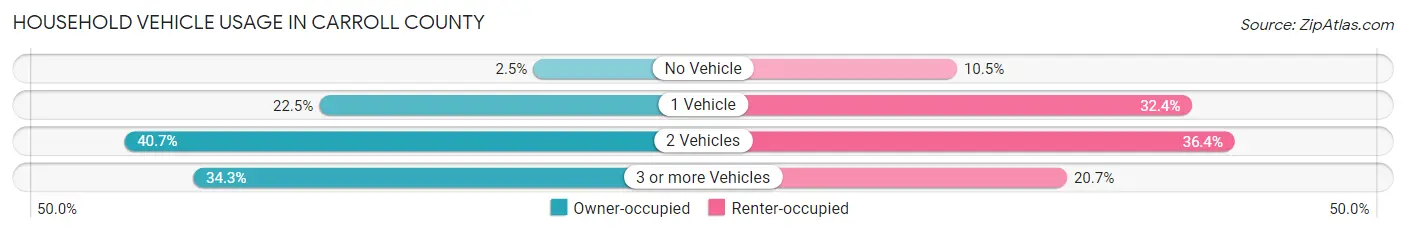
| Vehicles per Household | Owner-occupied | Renter-occupied |
| No Vehicle | 241 (2.5%) | 274 (10.5%) |
| 1 Vehicle | 2,143 (22.5%) | 849 (32.4%) |
| 2 Vehicles | 3,875 (40.7%) | 953 (36.4%) |
| 3 or more Vehicles | 3,263 (34.3%) | 543 (20.7%) |
| Total | 9,522 (100.0%) | 2,619 (100.0%) |
Real Estate & Mortgages in Carroll County
Real Estate and Mortgage Overview in Carroll County
| Characteristic | Without Mortgage | With Mortgage |
| Housing Units | 5,593 | 3,929 |
| Median Property Value | $118,300 | $161,600 |
| Median Household Income | $45,613 | $295 |
| Monthly Housing Costs | $316 | $30 |
| Real Estate Taxes | $817 | $71 |
Property Value by Mortgage Status in Carroll County
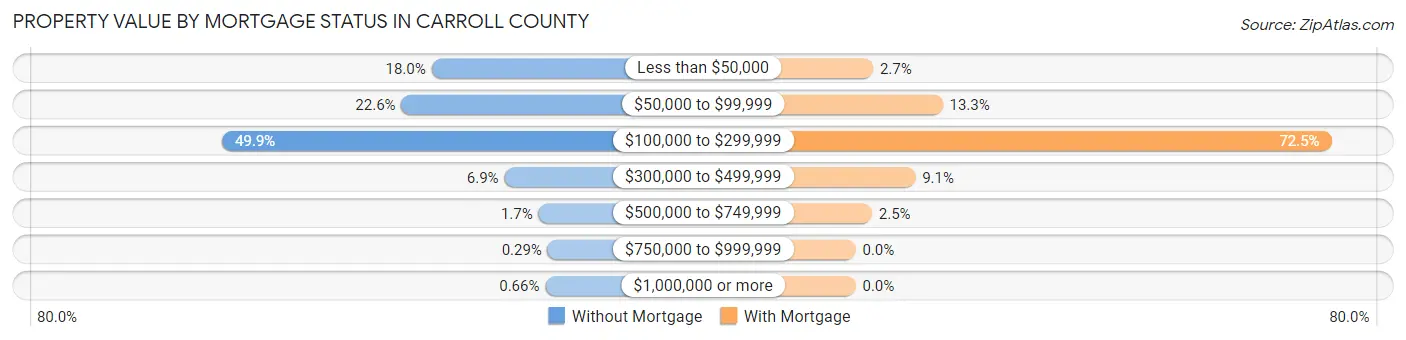
| Property Value | Without Mortgage | With Mortgage |
| Less than $50,000 | 1,006 (18.0%) | 104 (2.6%) |
| $50,000 to $99,999 | 1,263 (22.6%) | 521 (13.3%) |
| $100,000 to $299,999 | 2,792 (49.9%) | 2,849 (72.5%) |
| $300,000 to $499,999 | 385 (6.9%) | 357 (9.1%) |
| $500,000 to $749,999 | 94 (1.7%) | 98 (2.5%) |
| $750,000 to $999,999 | 16 (0.3%) | 0 (0.0%) |
| $1,000,000 or more | 37 (0.7%) | 0 (0.0%) |
| Total | 5,593 (100.0%) | 3,929 (100.0%) |
Household Income by Mortgage Status in Carroll County
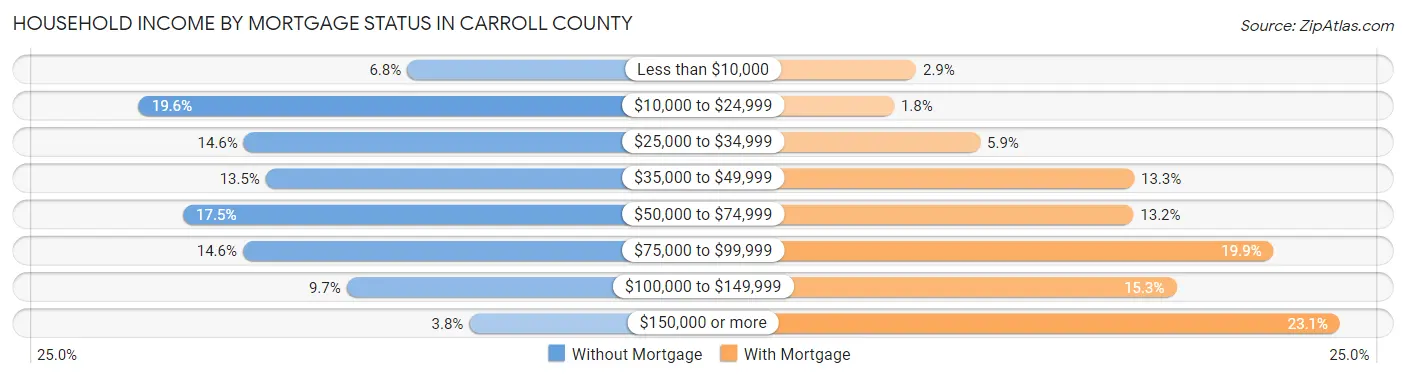
| Household Income | Without Mortgage | With Mortgage |
| Less than $10,000 | 380 (6.8%) | 113 (2.9%) |
| $10,000 to $24,999 | 1,094 (19.6%) | 72 (1.8%) |
| $25,000 to $34,999 | 815 (14.6%) | 233 (5.9%) |
| $35,000 to $49,999 | 756 (13.5%) | 521 (13.3%) |
| $50,000 to $74,999 | 976 (17.4%) | 520 (13.2%) |
| $75,000 to $99,999 | 817 (14.6%) | 782 (19.9%) |
| $100,000 to $149,999 | 541 (9.7%) | 600 (15.3%) |
| $150,000 or more | 214 (3.8%) | 906 (23.1%) |
| Total | 5,593 (100.0%) | 3,929 (100.0%) |
Property Value to Household Income Ratio in Carroll County
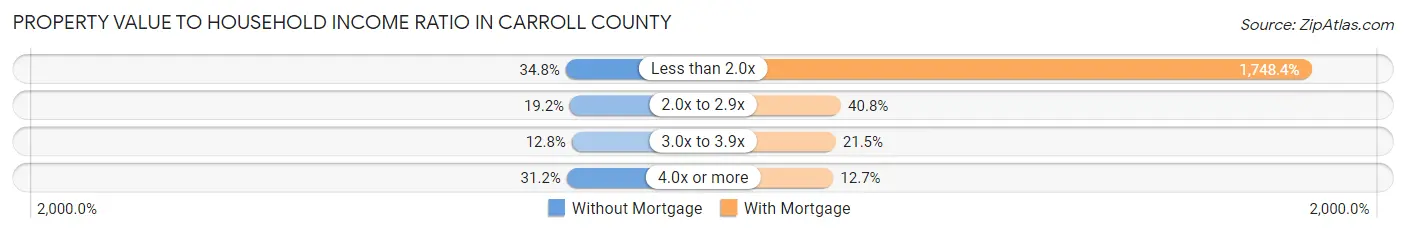
| Value-to-Income Ratio | Without Mortgage | With Mortgage |
| Less than 2.0x | 1,946 (34.8%) | 68,694 (1,748.4%) |
| 2.0x to 2.9x | 1,075 (19.2%) | 1,603 (40.8%) |
| 3.0x to 3.9x | 717 (12.8%) | 845 (21.5%) |
| 4.0x or more | 1,742 (31.1%) | 498 (12.7%) |
| Total | 5,593 (100.0%) | 3,929 (100.0%) |
Real Estate Taxes by Mortgage Status in Carroll County
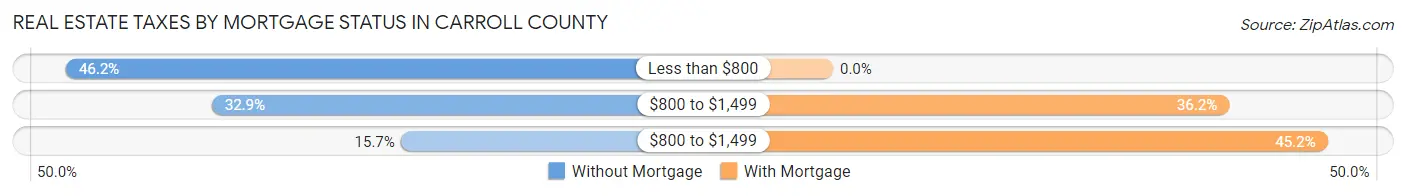
| Property Taxes | Without Mortgage | With Mortgage |
| Less than $800 | 2,585 (46.2%) | 0 (0.0%) |
| $800 to $1,499 | 1,840 (32.9%) | 1,421 (36.2%) |
| $800 to $1,499 | 876 (15.7%) | 1,774 (45.2%) |
| Total | 5,593 (100.0%) | 3,929 (100.0%) |
Health & Disability in Carroll County
Health Insurance Coverage by Age in Carroll County
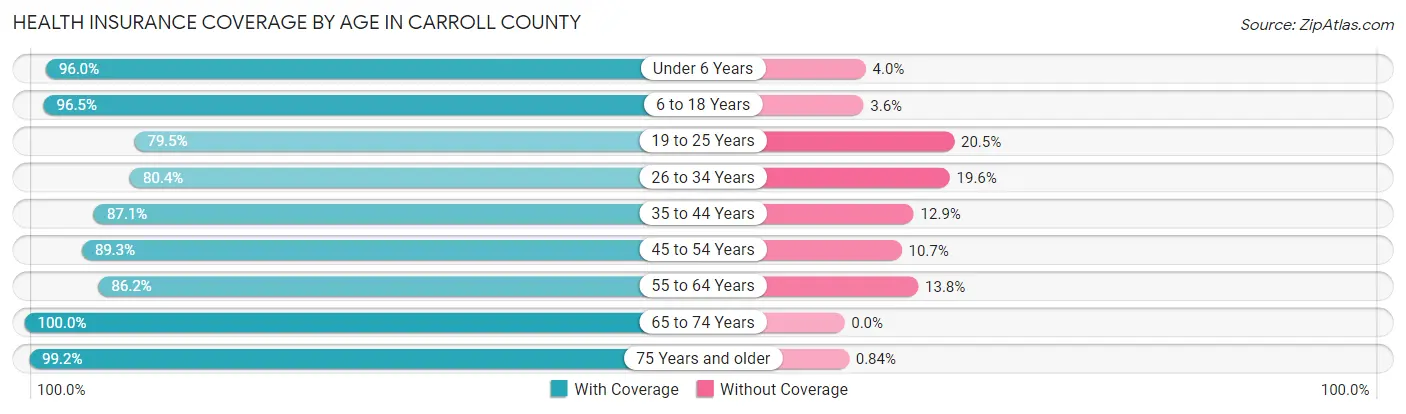
| Age Bracket | With Coverage | Without Coverage |
| Under 6 Years | 1,451 (96.0%) | 60 (4.0%) |
| 6 to 18 Years | 3,720 (96.5%) | 137 (3.5%) |
| 19 to 25 Years | 1,602 (79.5%) | 412 (20.5%) |
| 26 to 34 Years | 2,255 (80.4%) | 551 (19.6%) |
| 35 to 44 Years | 2,600 (87.1%) | 386 (12.9%) |
| 45 to 54 Years | 3,451 (89.3%) | 412 (10.7%) |
| 55 to 64 Years | 4,076 (86.2%) | 651 (13.8%) |
| 65 to 74 Years | 4,239 (100.0%) | 0 (0.0%) |
| 75 Years and older | 2,943 (99.2%) | 25 (0.8%) |
| Total | 26,337 (90.9%) | 2,634 (9.1%) |
Health Insurance Coverage by Citizenship Status in Carroll County
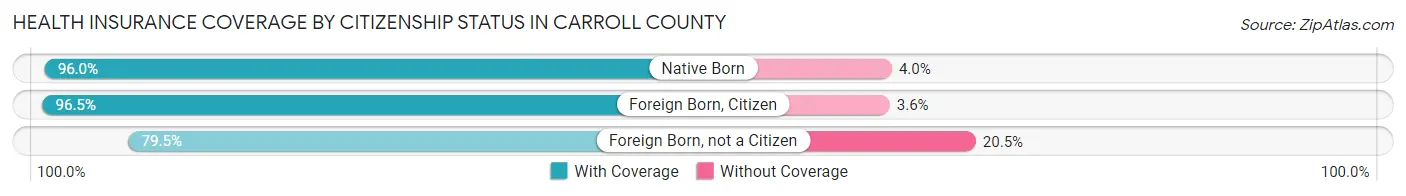
| Citizenship Status | With Coverage | Without Coverage |
| Native Born | 1,451 (96.0%) | 60 (4.0%) |
| Foreign Born, Citizen | 3,720 (96.5%) | 137 (3.5%) |
| Foreign Born, not a Citizen | 1,602 (79.5%) | 412 (20.5%) |
Health Insurance Coverage by Household Income in Carroll County
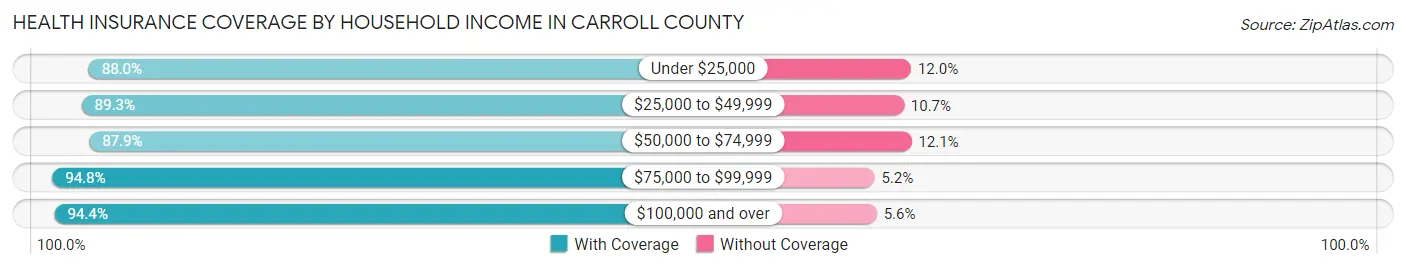
| Household Income | With Coverage | Without Coverage |
| Under $25,000 | 4,042 (88.0%) | 553 (12.0%) |
| $25,000 to $49,999 | 6,484 (89.3%) | 776 (10.7%) |
| $50,000 to $74,999 | 4,893 (87.9%) | 674 (12.1%) |
| $75,000 to $99,999 | 3,833 (94.8%) | 210 (5.2%) |
| $100,000 and over | 7,044 (94.4%) | 419 (5.6%) |
Public vs Private Health Insurance Coverage by Age in Carroll County
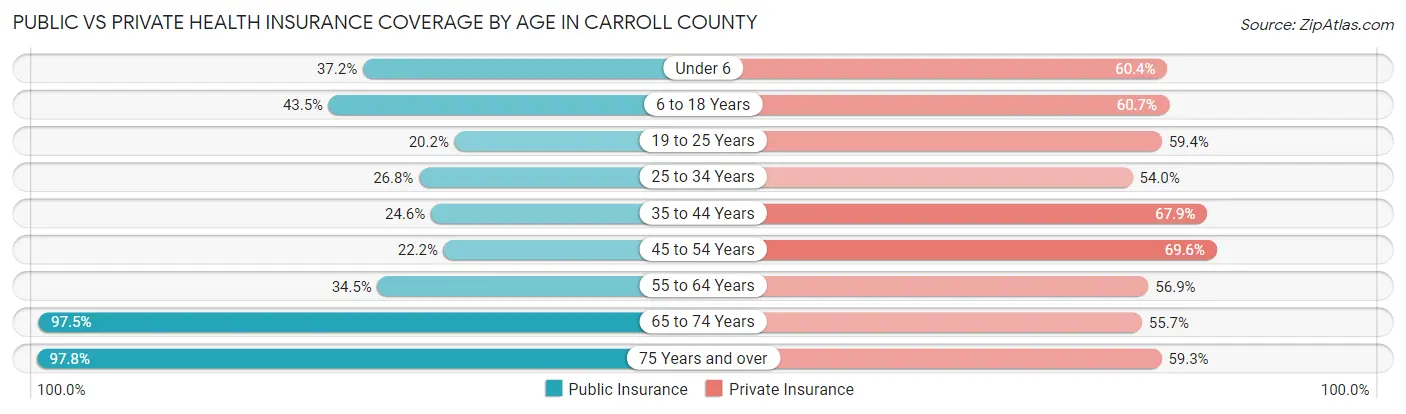
| Age Bracket | Public Insurance | Private Insurance |
| Under 6 | 562 (37.2%) | 913 (60.4%) |
| 6 to 18 Years | 1,678 (43.5%) | 2,341 (60.7%) |
| 19 to 25 Years | 406 (20.2%) | 1,196 (59.4%) |
| 25 to 34 Years | 751 (26.8%) | 1,514 (54.0%) |
| 35 to 44 Years | 733 (24.5%) | 2,026 (67.8%) |
| 45 to 54 Years | 857 (22.2%) | 2,689 (69.6%) |
| 55 to 64 Years | 1,629 (34.5%) | 2,690 (56.9%) |
| 65 to 74 Years | 4,132 (97.5%) | 2,361 (55.7%) |
| 75 Years and over | 2,902 (97.8%) | 1,761 (59.3%) |
| Total | 13,650 (47.1%) | 17,491 (60.4%) |
Disability Status by Sex by Age in Carroll County
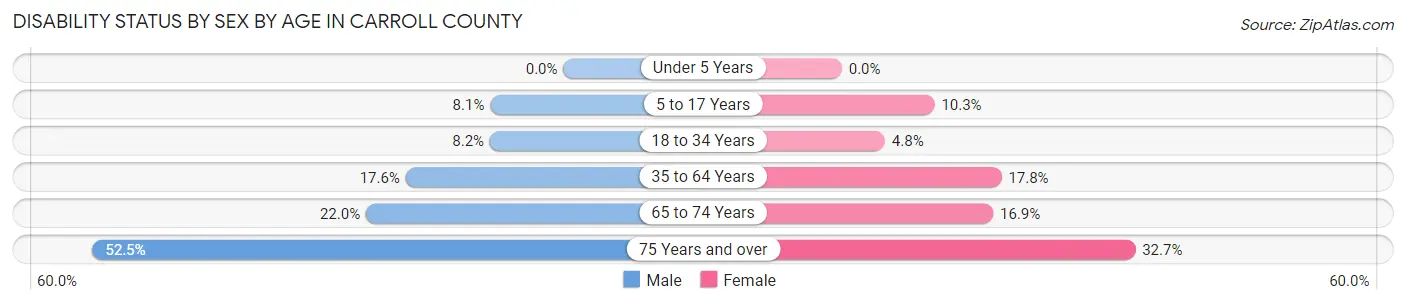
| Age Bracket | Male | Female |
| Under 5 Years | 0 (0.0%) | 0 (0.0%) |
| 5 to 17 Years | 166 (8.1%) | 198 (10.3%) |
| 18 to 34 Years | 208 (8.2%) | 118 (4.8%) |
| 35 to 64 Years | 1,003 (17.6%) | 1,043 (17.8%) |
| 65 to 74 Years | 457 (22.0%) | 364 (16.9%) |
| 75 Years and over | 695 (52.4%) | 537 (32.7%) |
Disability Class by Sex by Age in Carroll County
Disability Class: Hearing Difficulty
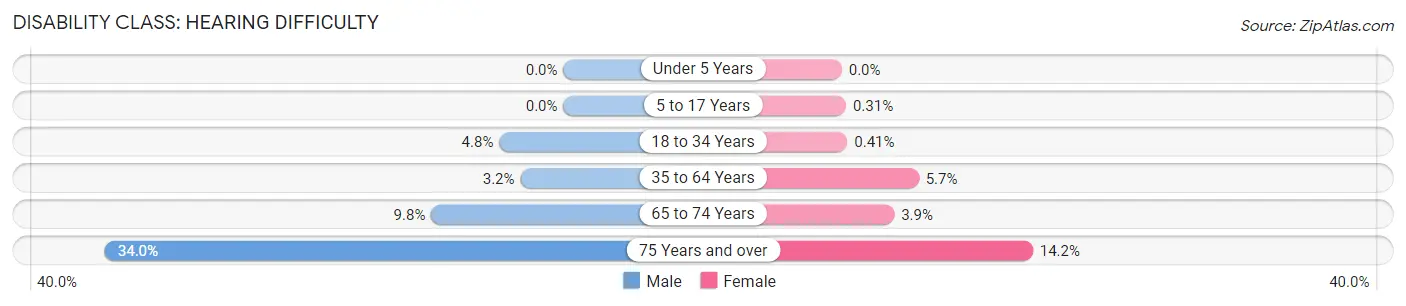
| Age Bracket | Male | Female |
| Under 5 Years | 0 (0.0%) | 0 (0.0%) |
| 5 to 17 Years | 0 (0.0%) | 6 (0.3%) |
| 18 to 34 Years | 121 (4.8%) | 10 (0.4%) |
| 35 to 64 Years | 182 (3.2%) | 335 (5.7%) |
| 65 to 74 Years | 204 (9.8%) | 84 (3.9%) |
| 75 Years and over | 451 (34.0%) | 233 (14.2%) |
Disability Class: Vision Difficulty
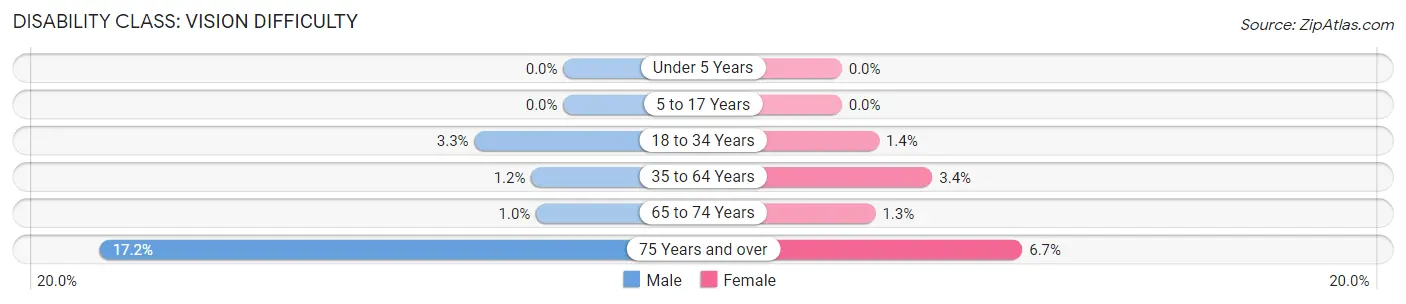
| Age Bracket | Male | Female |
| Under 5 Years | 0 (0.0%) | 0 (0.0%) |
| 5 to 17 Years | 0 (0.0%) | 0 (0.0%) |
| 18 to 34 Years | 84 (3.3%) | 34 (1.4%) |
| 35 to 64 Years | 68 (1.2%) | 197 (3.4%) |
| 65 to 74 Years | 21 (1.0%) | 27 (1.3%) |
| 75 Years and over | 228 (17.2%) | 110 (6.7%) |
Disability Class: Cognitive Difficulty
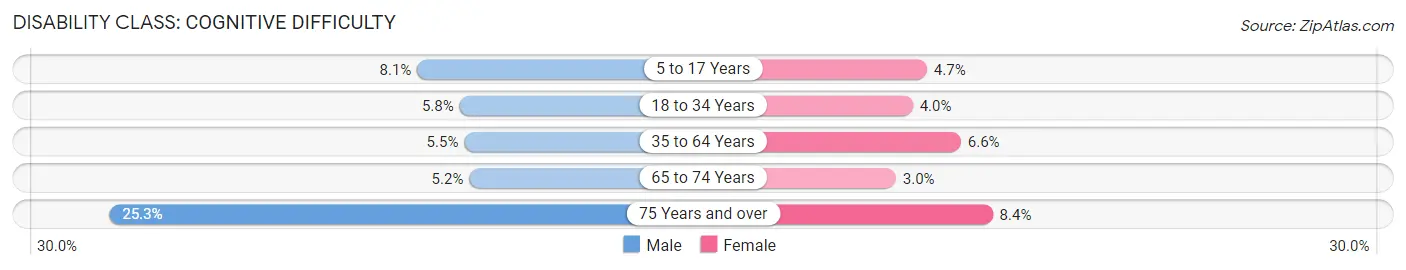
| Age Bracket | Male | Female |
| 5 to 17 Years | 166 (8.1%) | 91 (4.7%) |
| 18 to 34 Years | 147 (5.8%) | 97 (4.0%) |
| 35 to 64 Years | 315 (5.5%) | 389 (6.6%) |
| 65 to 74 Years | 109 (5.2%) | 65 (3.0%) |
| 75 Years and over | 335 (25.3%) | 138 (8.4%) |
Disability Class: Ambulatory Difficulty
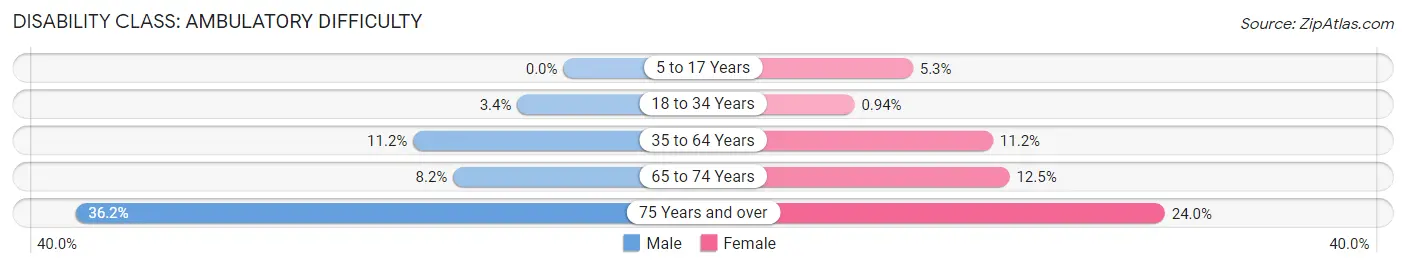
| Age Bracket | Male | Female |
| 5 to 17 Years | 0 (0.0%) | 101 (5.3%) |
| 18 to 34 Years | 87 (3.4%) | 23 (0.9%) |
| 35 to 64 Years | 637 (11.2%) | 658 (11.2%) |
| 65 to 74 Years | 170 (8.2%) | 269 (12.4%) |
| 75 Years and over | 480 (36.2%) | 394 (24.0%) |
Disability Class: Self-Care Difficulty
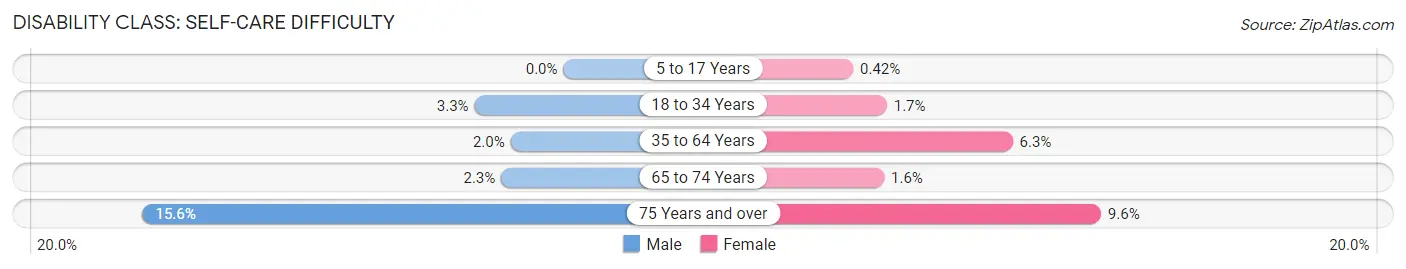
| Age Bracket | Male | Female |
| 5 to 17 Years | 0 (0.0%) | 8 (0.4%) |
| 18 to 34 Years | 84 (3.3%) | 41 (1.7%) |
| 35 to 64 Years | 112 (2.0%) | 372 (6.3%) |
| 65 to 74 Years | 48 (2.3%) | 34 (1.6%) |
| 75 Years and over | 207 (15.6%) | 158 (9.6%) |
Technology Access in Carroll County
Computing Device Access in Carroll County
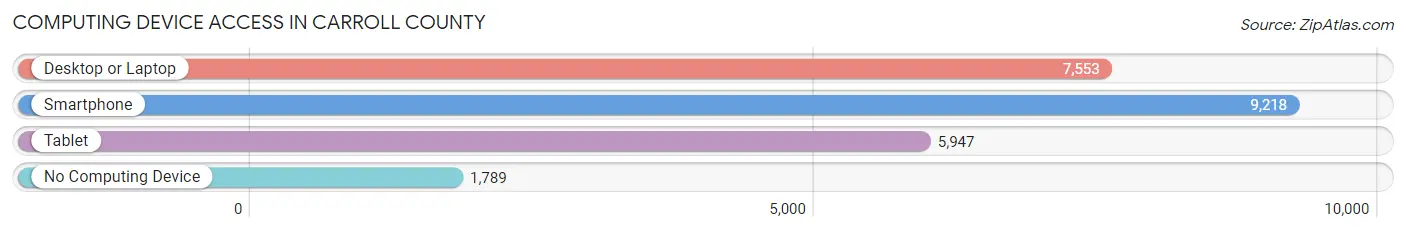
| Device Type | # Households | % Households |
| Desktop or Laptop | 7,553 | 62.2% |
| Smartphone | 9,218 | 75.9% |
| Tablet | 5,947 | 49.0% |
| No Computing Device | 1,789 | 14.7% |
| Total | 12,141 | 100.0% |
Internet Access in Carroll County
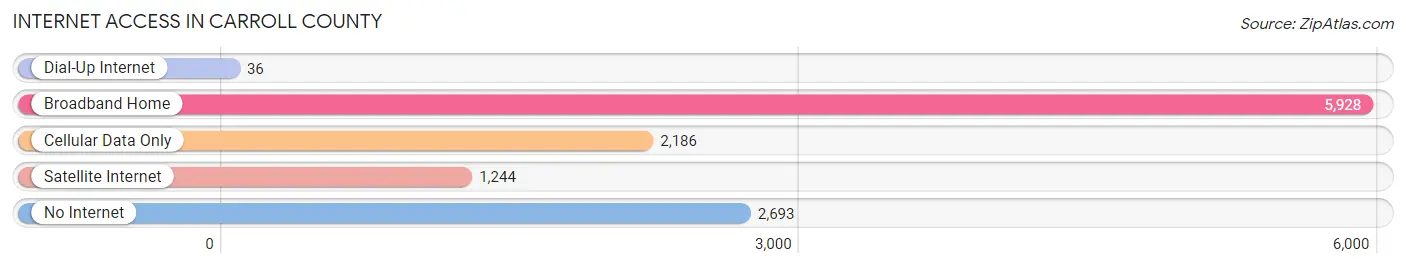
| Internet Type | # Households | % Households |
| Dial-Up Internet | 36 | 0.3% |
| Broadband Home | 5,928 | 48.8% |
| Cellular Data Only | 2,186 | 18.0% |
| Satellite Internet | 1,244 | 10.2% |
| No Internet | 2,693 | 22.2% |
| Total | 12,141 | 100.0% |
Carroll County Summary
Carroll County is located in the southwestern part of the Commonwealth of Virginia, and is part of the Blue Ridge Mountains region. It is bordered by Grayson County to the north, Wythe County to the east, Pulaski County to the south, and Patrick County to the west. The county seat is Hillsville, and the county has a total area of 437 square miles.
History
Carroll County was formed in 1842 from parts of Grayson and Wythe counties. It was named for Charles Carroll of Carrollton, the last surviving signer of the Declaration of Independence. The county was largely rural and agricultural until the late 19th century, when the railroad arrived and the timber industry began to develop. The county was also home to several iron ore mines, which provided employment for many of the county’s residents.
In the early 20th century, the county’s economy shifted to manufacturing, with the establishment of several furniture factories. The county also became a popular tourist destination, with the opening of the Blue Ridge Parkway in the 1930s.
Geography
Carroll County is located in the Blue Ridge Mountains region of Virginia. The county is mostly mountainous, with elevations ranging from 1,000 to 4,000 feet. The highest point in the county is Flat Top Mountain, which has an elevation of 4,000 feet. The county is drained by the New River and its tributaries, including the Little River, the Laurel Fork, and the Chestnut Creek.
The county is home to several state parks, including Grayson Highlands State Park, New River Trail State Park, and the Blue Ridge Parkway. The county also contains the Jefferson National Forest, which covers over 1,000 square miles.
Economy
The economy of Carroll County is largely based on agriculture and tourism. The county is home to several large farms, which produce a variety of crops, including corn, soybeans, hay, and tobacco. The county is also home to several wineries, which produce a variety of wines.
Tourism is also an important part of the county’s economy. The county is home to several state parks, as well as the Blue Ridge Parkway, which runs through the county. The county is also home to several historic sites, including the Hillsville Courthouse, the Hillsville Historic District, and the New River Trail State Park.
Demographics
As of the 2010 census, the population of Carroll County was 30,042. The population is largely white (94.3%), with small percentages of African Americans (2.7%), Hispanics (1.3%), and Asians (0.7%). The median household income is $37,945, and the median home value is $128,400.
The county is served by two school districts, the Carroll County Public Schools and the Galax City Public Schools. The county is also home to several higher education institutions, including New River Community College, Appalachian School of Law, and the University of Virginia’s College at Wise.
Conclusion
Carroll County is a rural county located in the Blue Ridge Mountains region of Virginia. The county has a long history of agriculture and timber production, and more recently has become a popular tourist destination. The county’s economy is largely based on agriculture and tourism, and the population is largely white. The county is served by two school districts, and is home to several higher education institutions.
Common Questions
What is Per Capita Income in Carroll County?
Per Capita income in Carroll County is $27,972.
What is the Median Family Income in Carroll County?
Median Family Income in Carroll County is $61,754.
What is the Median Household income in Carroll County?
Median Household Income in Carroll County is $49,113.
What is Income or Wage Gap in Carroll County?
Income or Wage Gap in Carroll County is 18.8%.
Women in Carroll County earn 81.2 cents for every dollar earned by a man.
What is Family Income Deficit in Carroll County?
Family Income Deficit in Carroll County is $9,340.
Families that are below poverty line in Carroll County earn $9,340 less on average than the poverty threshold level.
What is Inequality or Gini Index in Carroll County?
Inequality or Gini Index in Carroll County is 0.44.
What is the Total Population of Carroll County?
Total Population of Carroll County is 29,126.
What is the Total Male Population of Carroll County?
Total Male Population of Carroll County is 14,335.
What is the Total Female Population of Carroll County?
Total Female Population of Carroll County is 14,791.
What is the Ratio of Males per 100 Females in Carroll County?
There are 96.92 Males per 100 Females in Carroll County.
What is the Ratio of Females per 100 Males in Carroll County?
There are 103.18 Females per 100 Males in Carroll County.
What is the Median Population Age in Carroll County?
Median Population Age in Carroll County is 48.7 Years.
What is the Average Family Size in Carroll County
Average Family Size in Carroll County is 3.0 People.
What is the Average Household Size in Carroll County
Average Household Size in Carroll County is 2.4 People.
How Large is the Labor Force in Carroll County?
There are 12,930 People in the Labor Forcein in Carroll County.
What is the Percentage of People in the Labor Force in Carroll County?
52.4% of People are in the Labor Force in Carroll County.
What is the Unemployment Rate in Carroll County?
Unemployment Rate in Carroll County is 4.8%.