Buckingham County, VA Map & Demographics
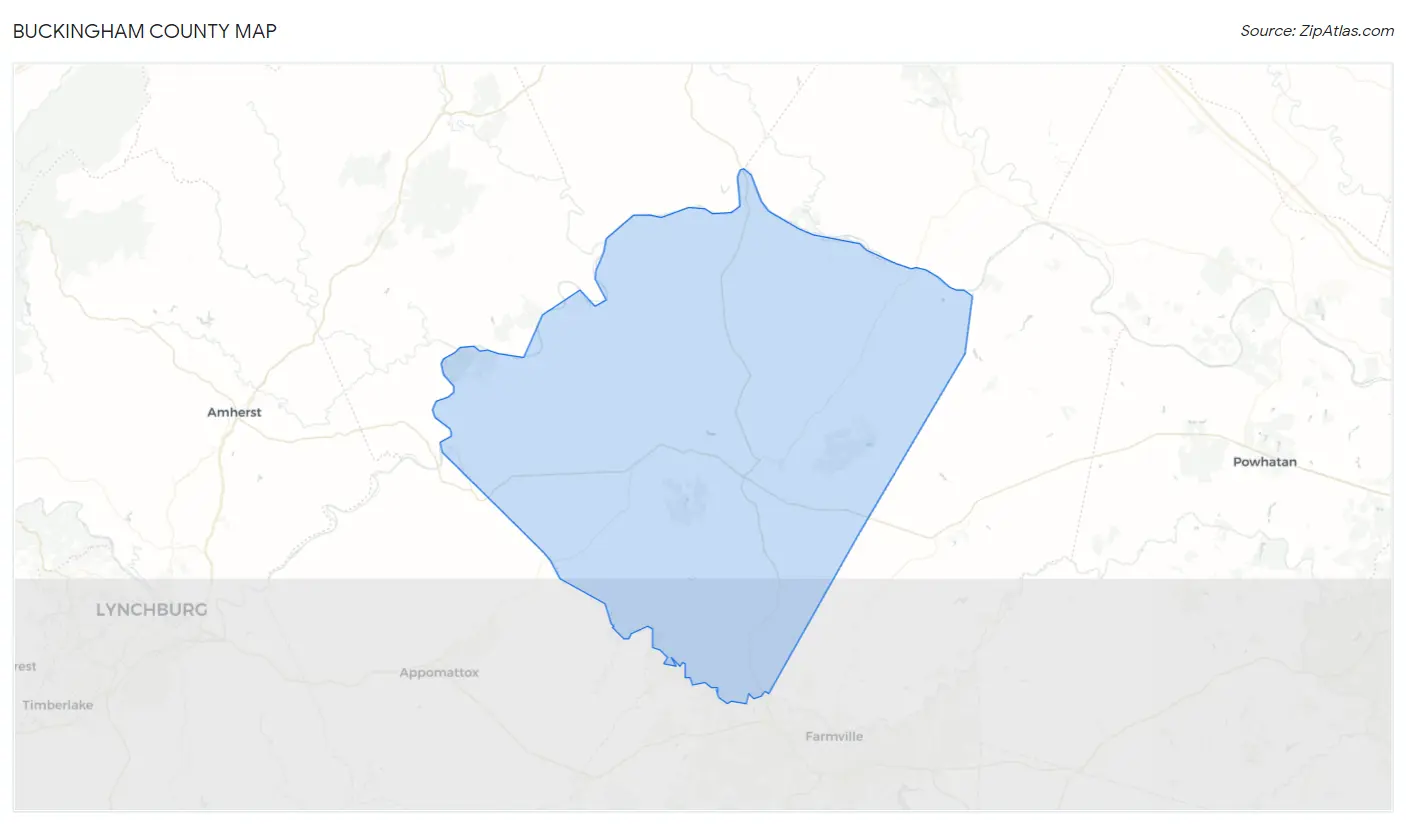
Buckingham County Map
Buckingham County Overview
$27,139
PER CAPITA INCOME
$76,351
AVG FAMILY INCOME
$59,894
AVG HOUSEHOLD INCOME
13.2%
WAGE / INCOME GAP [ % ]
86.8¢/ $1
WAGE / INCOME GAP [ $ ]
$9,173
FAMILY INCOME DEFICIT
0.43
INEQUALITY / GINI INDEX
16,869
TOTAL POPULATION
9,405
MALE POPULATION
7,464
FEMALE POPULATION
126.00
MALES / 100 FEMALES
79.36
FEMALES / 100 MALES
43.3
MEDIAN AGE
3.1
AVG FAMILY SIZE
2.5
AVG HOUSEHOLD SIZE
7,160
LABOR FORCE [ PEOPLE ]
50.5%
PERCENT IN LABOR FORCE
5.0%
UNEMPLOYMENT RATE
Income in Buckingham County
Income Overview in Buckingham County
Per Capita Income in Buckingham County is $27,139, while median incomes of families and households are $76,351 and $59,894 respectively.
| Characteristic | Number | Measure |
| Per Capita Income | 16,869 | $27,139 |
| Median Family Income | 3,975 | $76,351 |
| Mean Family Income | 3,975 | $89,999 |
| Median Household Income | 5,898 | $59,894 |
| Mean Household Income | 5,898 | $73,274 |
| Income Deficit | 3,975 | $9,173 |
| Wage / Income Gap (%) | 16,869 | 13.18% |
| Wage / Income Gap ($) | 16,869 | 86.82¢ per $1 |
| Gini / Inequality Index | 16,869 | 0.43 |
Earnings by Sex in Buckingham County
Average Earnings in Buckingham County are $35,546, $38,438 for men and $33,370 for women, a difference of 13.2%.
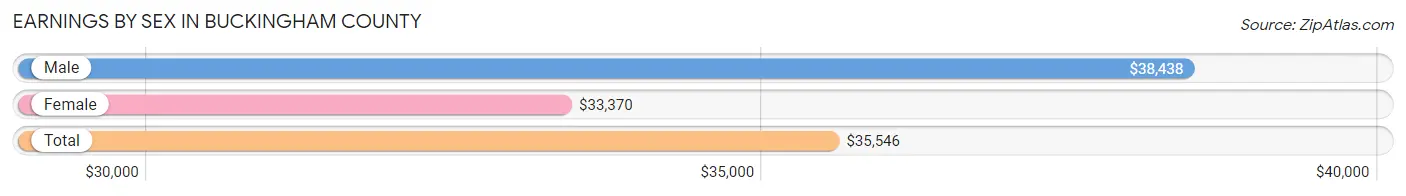
| Sex | Number | Average Earnings |
| Male | 4,303 (57.7%) | $38,438 |
| Female | 3,155 (42.3%) | $33,370 |
| Total | 7,458 (100.0%) | $35,546 |
Earnings by Sex by Income Bracket in Buckingham County
The most common earnings brackets in Buckingham County are $100,000+ for men (517 | 12.0%) and $30,000 to $34,999 for women (371 | 11.8%).
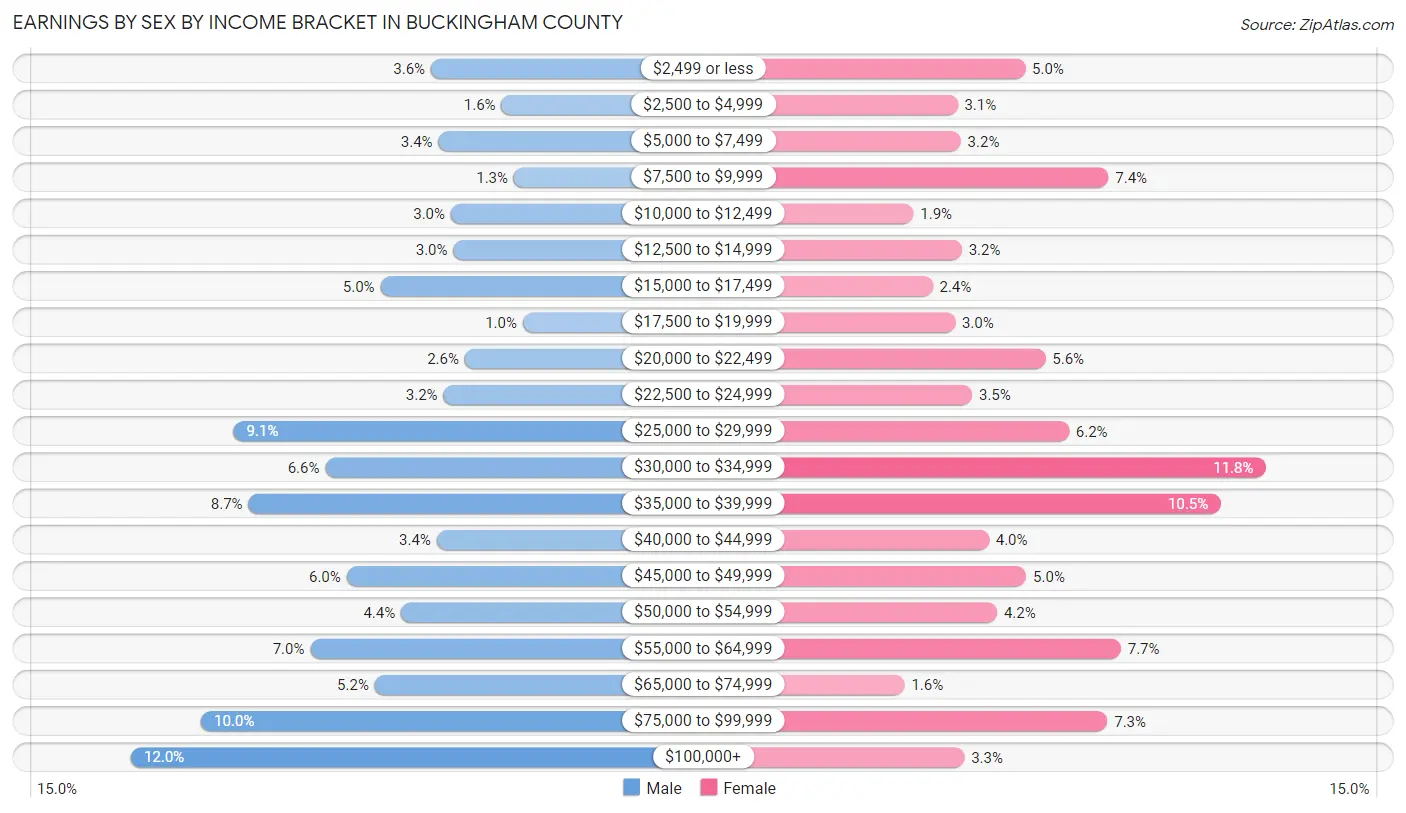
| Income | Male | Female |
| $2,499 or less | 154 (3.6%) | 158 (5.0%) |
| $2,500 to $4,999 | 69 (1.6%) | 98 (3.1%) |
| $5,000 to $7,499 | 145 (3.4%) | 101 (3.2%) |
| $7,500 to $9,999 | 54 (1.3%) | 232 (7.3%) |
| $10,000 to $12,499 | 130 (3.0%) | 59 (1.9%) |
| $12,500 to $14,999 | 127 (2.9%) | 102 (3.2%) |
| $15,000 to $17,499 | 215 (5.0%) | 76 (2.4%) |
| $17,500 to $19,999 | 43 (1.0%) | 96 (3.0%) |
| $20,000 to $22,499 | 113 (2.6%) | 176 (5.6%) |
| $22,500 to $24,999 | 139 (3.2%) | 111 (3.5%) |
| $25,000 to $29,999 | 393 (9.1%) | 197 (6.2%) |
| $30,000 to $34,999 | 282 (6.6%) | 371 (11.8%) |
| $35,000 to $39,999 | 375 (8.7%) | 331 (10.5%) |
| $40,000 to $44,999 | 147 (3.4%) | 126 (4.0%) |
| $45,000 to $49,999 | 256 (5.9%) | 159 (5.0%) |
| $50,000 to $54,999 | 190 (4.4%) | 133 (4.2%) |
| $55,000 to $64,999 | 300 (7.0%) | 243 (7.7%) |
| $65,000 to $74,999 | 222 (5.2%) | 51 (1.6%) |
| $75,000 to $99,999 | 432 (10.0%) | 231 (7.3%) |
| $100,000+ | 517 (12.0%) | 104 (3.3%) |
| Total | 4,303 (100.0%) | 3,155 (100.0%) |
Earnings by Sex by Educational Attainment in Buckingham County
Average earnings in Buckingham County are $45,223 for men and $34,600 for women, a difference of 23.5%. Men with an educational attainment of graduate degree enjoy the highest average annual earnings of $55,500, while those with less than high school education earn the least with $33,407. Women with an educational attainment of bachelor's degree earn the most with the average annual earnings of $56,853, while those with less than high school education have the smallest earnings of $22,097.
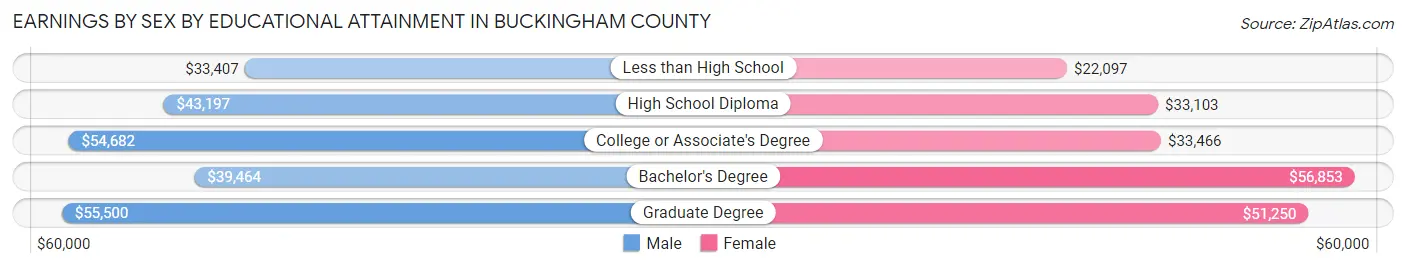
| Educational Attainment | Male Income | Female Income |
| Less than High School | $33,407 | $22,097 |
| High School Diploma | $43,197 | $33,103 |
| College or Associate's Degree | $54,682 | $33,466 |
| Bachelor's Degree | $39,464 | $56,853 |
| Graduate Degree | $55,500 | $51,250 |
| Total | $45,223 | $34,600 |
Family Income in Buckingham County
Family Income Brackets in Buckingham County
According to the Buckingham County family income data, there are 815 families falling into the $100,000 to $149,999 income range, which is the most common income bracket and makes up 20.5% of all families. Conversely, the less than $10,000 income bracket is the least frequent group with only 91 families (2.3%) belonging to this category.
| Income Bracket | # Families | % Families |
| Less than $10,000 | 91 | 2.3% |
| $10,000 to $14,999 | 135 | 3.4% |
| $15,000 to $24,999 | 215 | 5.4% |
| $25,000 to $34,999 | 413 | 10.4% |
| $35,000 to $49,999 | 322 | 8.1% |
| $50,000 to $74,999 | 704 | 17.7% |
| $75,000 to $99,999 | 704 | 17.7% |
| $100,000 to $149,999 | 815 | 20.5% |
| $150,000 to $199,999 | 390 | 9.8% |
| $200,000+ | 191 | 4.8% |
Family Income by Famaliy Size in Buckingham County
6-person families (67 | 1.7%) account for the highest median family income in Buckingham County with $215,597 per family, while 6-person families (67 | 1.7%) have the highest median income of $35,933 per family member.
| Income Bracket | # Families | Median Income |
| 2-Person Families | 1,909 (48.0%) | $66,730 |
| 3-Person Families | 949 (23.9%) | $87,774 |
| 4-Person Families | 532 (13.4%) | $90,000 |
| 5-Person Families | 433 (10.9%) | $90,888 |
| 6-Person Families | 67 (1.7%) | $215,597 |
| 7+ Person Families | 85 (2.1%) | $77,112 |
| Total | 3,975 (100.0%) | $76,351 |
Family Income by Number of Earners in Buckingham County
The median family income in Buckingham County is $76,351, with families comprising 3+ earners (390) having the highest median family income of $149,038, while families with no earners (744) have the lowest median family income of $33,421, accounting for 9.8% and 18.7% of families, respectively.
| Number of Earners | # Families | Median Income |
| No Earners | 744 (18.7%) | $33,421 |
| 1 Earner | 1,254 (31.6%) | $58,788 |
| 2 Earners | 1,587 (39.9%) | $98,259 |
| 3+ Earners | 390 (9.8%) | $149,038 |
| Total | 3,975 (100.0%) | $76,351 |
Household Income in Buckingham County
Household Income Brackets in Buckingham County
With 1,044 households falling in the category, the $50,000 to $74,999 income range is the most frequent in Buckingham County, accounting for 17.7% of all households. In contrast, only 201 households (3.4%) fall into the $200,000+ income bracket, making it the least populous group.
| Income Bracket | # Households | % Households |
| Less than $10,000 | 236 | 4.0% |
| $10,000 to $14,999 | 383 | 6.5% |
| $15,000 to $24,999 | 619 | 10.5% |
| $25,000 to $34,999 | 661 | 11.2% |
| $35,000 to $49,999 | 661 | 11.2% |
| $50,000 to $74,999 | 1,044 | 17.7% |
| $75,000 to $99,999 | 832 | 14.1% |
| $100,000 to $149,999 | 873 | 14.8% |
| $150,000 to $199,999 | 395 | 6.7% |
| $200,000+ | 201 | 3.4% |
Household Income by Householder Age in Buckingham County
The median household income in Buckingham County is $59,894, with the highest median household income of $76,595 found in the 25 to 44 years age bracket for the primary householder. A total of 1,385 households (23.5%) fall into this category. Meanwhile, the 65+ years age bracket for the primary householder has the lowest median household income of $38,067, with 2,120 households (35.9%) in this group.
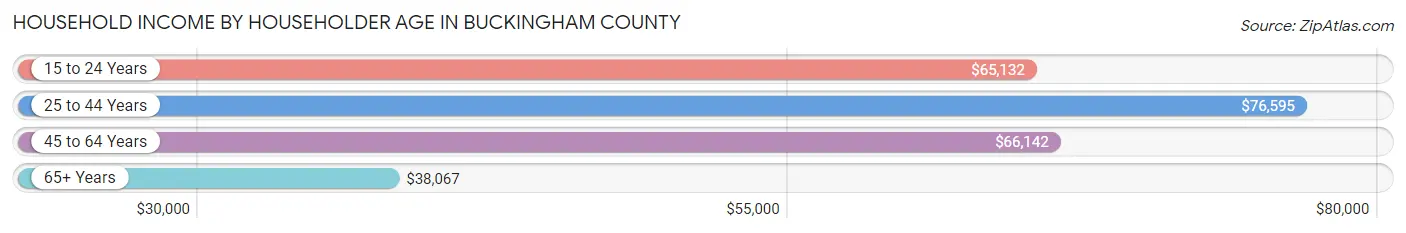
| Income Bracket | # Households | Median Income |
| 15 to 24 Years | 36 (0.6%) | $65,132 |
| 25 to 44 Years | 1,385 (23.5%) | $76,595 |
| 45 to 64 Years | 2,357 (40.0%) | $66,142 |
| 65+ Years | 2,120 (35.9%) | $38,067 |
| Total | 5,898 (100.0%) | $59,894 |
Poverty in Buckingham County
Income Below Poverty by Sex and Age in Buckingham County
With 10.9% poverty level for males and 17.1% for females among the residents of Buckingham County, 5 year old males and 5 year old females are the most vulnerable to poverty, with 29 males (33.0%) and 46 females (32.4%) in their respective age groups living below the poverty level.
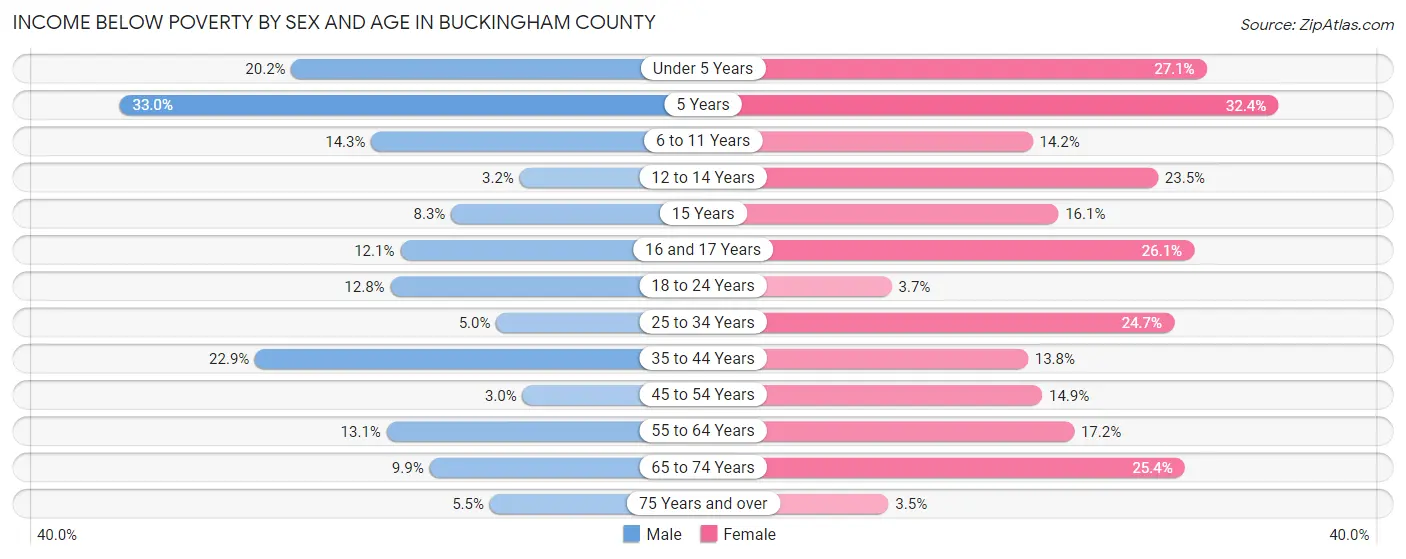
| Age Bracket | Male | Female |
| Under 5 Years | 85 (20.2%) | 98 (27.1%) |
| 5 Years | 29 (33.0%) | 46 (32.4%) |
| 6 to 11 Years | 70 (14.3%) | 65 (14.2%) |
| 12 to 14 Years | 8 (3.2%) | 65 (23.5%) |
| 15 Years | 3 (8.3%) | 18 (16.1%) |
| 16 and 17 Years | 23 (12.1%) | 40 (26.1%) |
| 18 to 24 Years | 75 (12.8%) | 21 (3.7%) |
| 25 to 34 Years | 55 (5.0%) | 195 (24.6%) |
| 35 to 44 Years | 183 (22.9%) | 107 (13.8%) |
| 45 to 54 Years | 32 (3.0%) | 131 (14.9%) |
| 55 to 64 Years | 133 (13.1%) | 199 (17.2%) |
| 65 to 74 Years | 89 (9.9%) | 259 (25.4%) |
| 75 Years and over | 29 (5.5%) | 25 (3.5%) |
| Total | 814 (10.9%) | 1,269 (17.1%) |
Income Above Poverty by Sex and Age in Buckingham County
According to the poverty statistics in Buckingham County, males aged 45 to 54 years and females aged 75 years and over are the age groups that are most secure financially, with 97.0% of males and 96.5% of females in these age groups living above the poverty line.
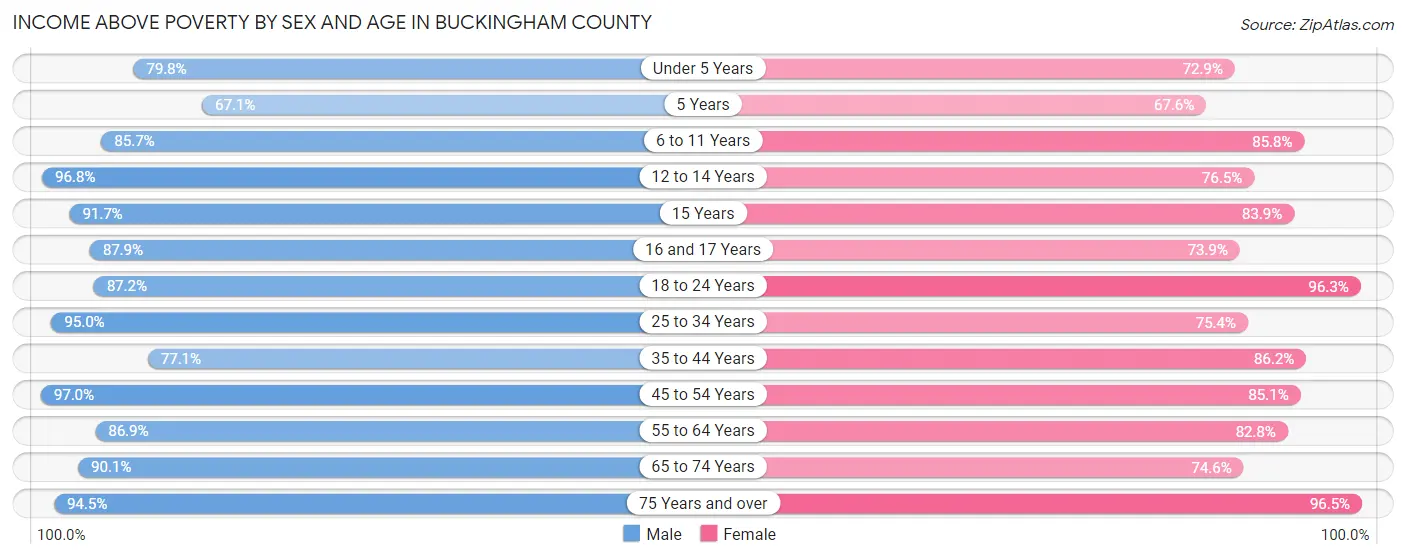
| Age Bracket | Male | Female |
| Under 5 Years | 336 (79.8%) | 264 (72.9%) |
| 5 Years | 59 (67.0%) | 96 (67.6%) |
| 6 to 11 Years | 421 (85.7%) | 394 (85.8%) |
| 12 to 14 Years | 239 (96.8%) | 212 (76.5%) |
| 15 Years | 33 (91.7%) | 94 (83.9%) |
| 16 and 17 Years | 167 (87.9%) | 113 (73.9%) |
| 18 to 24 Years | 509 (87.2%) | 546 (96.3%) |
| 25 to 34 Years | 1,049 (95.0%) | 596 (75.3%) |
| 35 to 44 Years | 617 (77.1%) | 668 (86.2%) |
| 45 to 54 Years | 1,024 (97.0%) | 750 (85.1%) |
| 55 to 64 Years | 881 (86.9%) | 955 (82.8%) |
| 65 to 74 Years | 806 (90.1%) | 759 (74.6%) |
| 75 Years and over | 502 (94.5%) | 697 (96.5%) |
| Total | 6,643 (89.1%) | 6,144 (82.9%) |
Income Below Poverty Among Married-Couple Families in Buckingham County
The poverty statistics for married-couple families in Buckingham County show that 5.1% or 153 of the total 3,000 families live below the poverty line. Families with 3 or 4 children have the highest poverty rate of 11.0%, comprising of 36 families. On the other hand, families with 1 or 2 children have the lowest poverty rate of 4.2%, which includes 31 families.
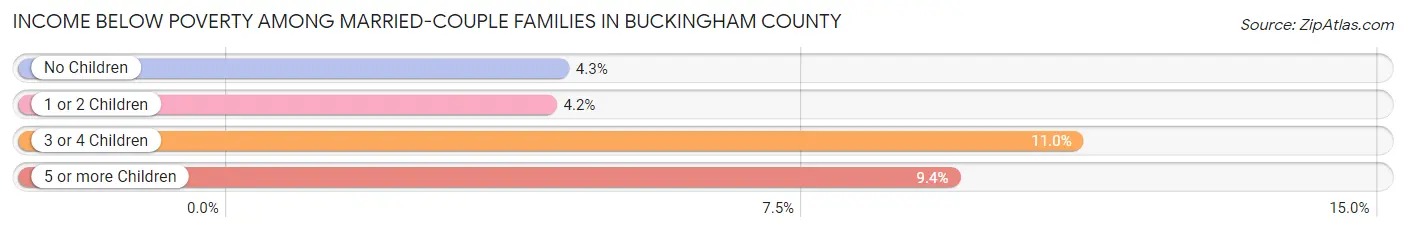
| Children | Above Poverty | Below Poverty |
| No Children | 1,794 (95.7%) | 81 (4.3%) |
| 1 or 2 Children | 715 (95.8%) | 31 (4.2%) |
| 3 or 4 Children | 290 (89.0%) | 36 (11.0%) |
| 5 or more Children | 48 (90.6%) | 5 (9.4%) |
| Total | 2,847 (94.9%) | 153 (5.1%) |
Income Below Poverty Among Single-Parent Households in Buckingham County
According to the poverty data in Buckingham County, 13.1% or 47 single-father households and 36.7% or 226 single-mother households are living below the poverty line. Among single-father households, those with no children have the highest poverty rate, with 29 households (21.2%) experiencing poverty. Likewise, among single-mother households, those with 3 or 4 children have the highest poverty rate, with 61 households (70.9%) falling below the poverty line.
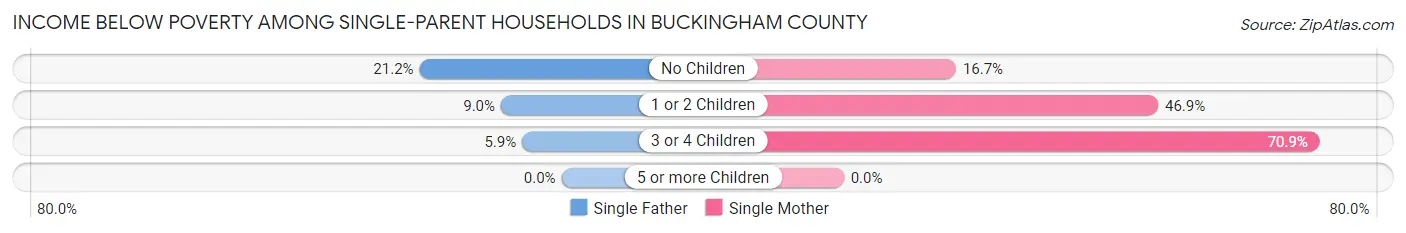
| Children | Single Father | Single Mother |
| No Children | 29 (21.2%) | 46 (16.7%) |
| 1 or 2 Children | 14 (9.0%) | 119 (46.9%) |
| 3 or 4 Children | 4 (5.9%) | 61 (70.9%) |
| 5 or more Children | 0 (0.0%) | 0 (0.0%) |
| Total | 47 (13.1%) | 226 (36.7%) |
Income Below Poverty Among Married-Couple vs Single-Parent Households in Buckingham County
The poverty data for Buckingham County shows that 153 of the married-couple family households (5.1%) and 273 of the single-parent households (28.0%) are living below the poverty level. Within the married-couple family households, those with 3 or 4 children have the highest poverty rate, with 36 households (11.0%) falling below the poverty line. Among the single-parent households, those with 3 or 4 children have the highest poverty rate, with 65 household (42.2%) living below poverty.
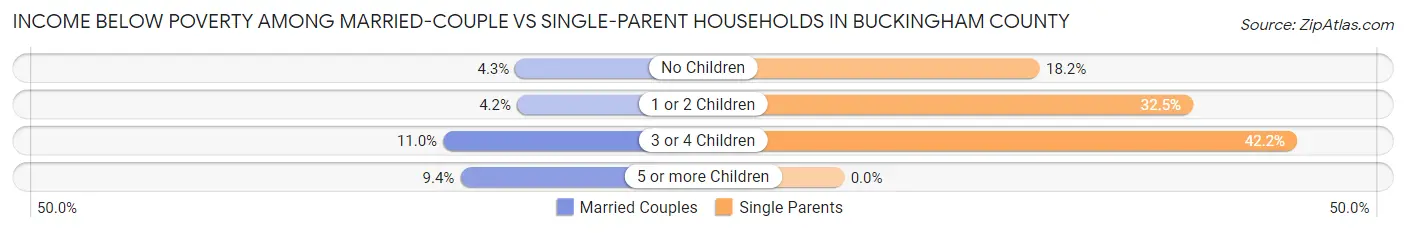
| Children | Married-Couple Families | Single-Parent Households |
| No Children | 81 (4.3%) | 75 (18.2%) |
| 1 or 2 Children | 31 (4.2%) | 133 (32.5%) |
| 3 or 4 Children | 36 (11.0%) | 65 (42.2%) |
| 5 or more Children | 5 (9.4%) | 0 (0.0%) |
| Total | 153 (5.1%) | 273 (28.0%) |
Race in Buckingham County
The most populous races in Buckingham County are White / Caucasian (10,348 | 61.3%), Black / African American (5,429 | 32.2%), and Two or more Races (758 | 4.5%).
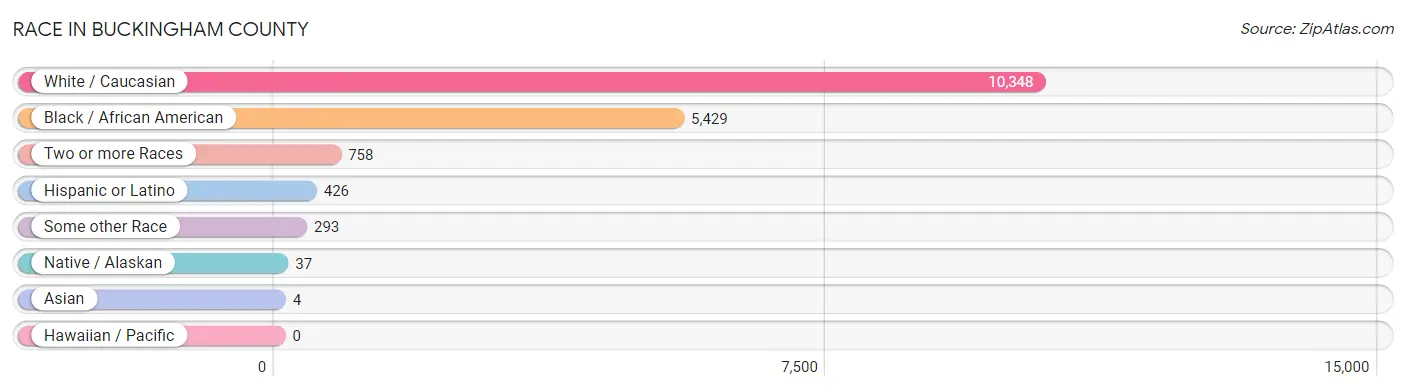
| Race | # Population | % Population |
| Asian | 4 | 0.0% |
| Black / African American | 5,429 | 32.2% |
| Hawaiian / Pacific | 0 | 0.0% |
| Hispanic or Latino | 426 | 2.5% |
| Native / Alaskan | 37 | 0.2% |
| White / Caucasian | 10,348 | 61.3% |
| Two or more Races | 758 | 4.5% |
| Some other Race | 293 | 1.7% |
| Total | 16,869 | 100.0% |
Ancestry in Buckingham County
The most populous ancestries reported in Buckingham County are English (2,081 | 12.3%), American (1,464 | 8.7%), German (1,221 | 7.2%), Irish (1,142 | 6.8%), and Italian (435 | 2.6%), together accounting for 37.6% of all Buckingham County residents.
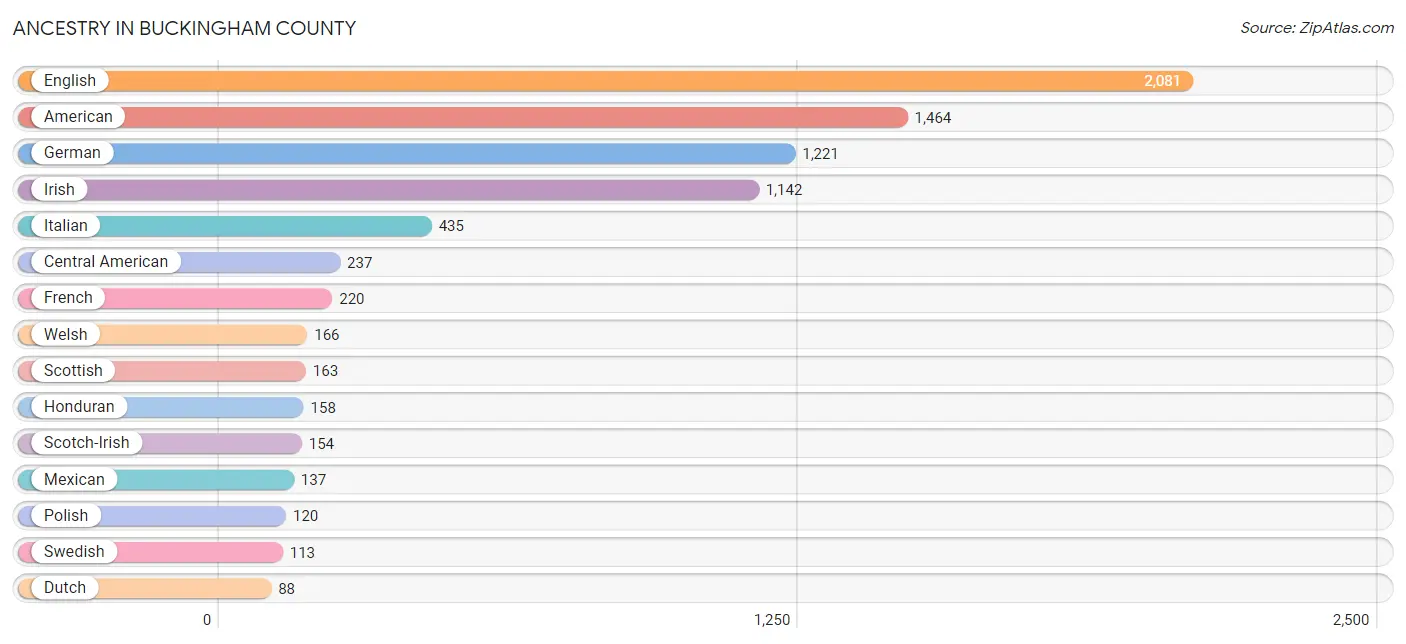
| Ancestry | # Population | % Population |
| African | 56 | 0.3% |
| American | 1,464 | 8.7% |
| Arab | 27 | 0.2% |
| Austrian | 47 | 0.3% |
| Blackfeet | 16 | 0.1% |
| British | 72 | 0.4% |
| Canadian | 23 | 0.1% |
| Central American | 237 | 1.4% |
| Cherokee | 19 | 0.1% |
| Costa Rican | 17 | 0.1% |
| Cuban | 17 | 0.1% |
| Czech | 22 | 0.1% |
| Czechoslovakian | 12 | 0.1% |
| Dutch | 88 | 0.5% |
| Eastern European | 14 | 0.1% |
| Egyptian | 11 | 0.1% |
| English | 2,081 | 12.3% |
| European | 86 | 0.5% |
| Finnish | 7 | 0.0% |
| French | 220 | 1.3% |
| French Canadian | 16 | 0.1% |
| German | 1,221 | 7.2% |
| Greek | 32 | 0.2% |
| Guatemalan | 18 | 0.1% |
| Honduran | 158 | 0.9% |
| Hungarian | 26 | 0.2% |
| Irish | 1,142 | 6.8% |
| Iroquois | 8 | 0.1% |
| Italian | 435 | 2.6% |
| Jamaican | 8 | 0.1% |
| Korean | 16 | 0.1% |
| Lebanese | 4 | 0.0% |
| Mexican | 137 | 0.8% |
| Mexican American Indian | 4 | 0.0% |
| Moroccan | 12 | 0.1% |
| Northern European | 9 | 0.1% |
| Norwegian | 18 | 0.1% |
| Panamanian | 9 | 0.1% |
| Pennsylvania German | 30 | 0.2% |
| Peruvian | 16 | 0.1% |
| Polish | 120 | 0.7% |
| Portuguese | 30 | 0.2% |
| Puerto Rican | 17 | 0.1% |
| Russian | 87 | 0.5% |
| Salvadoran | 25 | 0.2% |
| Scandinavian | 13 | 0.1% |
| Scotch-Irish | 154 | 0.9% |
| Scottish | 163 | 1.0% |
| Slovak | 10 | 0.1% |
| South American | 16 | 0.1% |
| Subsaharan African | 56 | 0.3% |
| Swedish | 113 | 0.7% |
| Swiss | 69 | 0.4% |
| Thai | 3 | 0.0% |
| Turkish | 5 | 0.0% |
| Ukrainian | 5 | 0.0% |
| Welsh | 166 | 1.0% | View All 57 Rows |
Immigrants in Buckingham County
The most numerous immigrant groups reported in Buckingham County came from Latin America (156 | 0.9%), Central America (126 | 0.7%), Europe (83 | 0.5%), Eastern Europe (55 | 0.3%), and Russia (55 | 0.3%), together accounting for 2.8% of all Buckingham County residents.
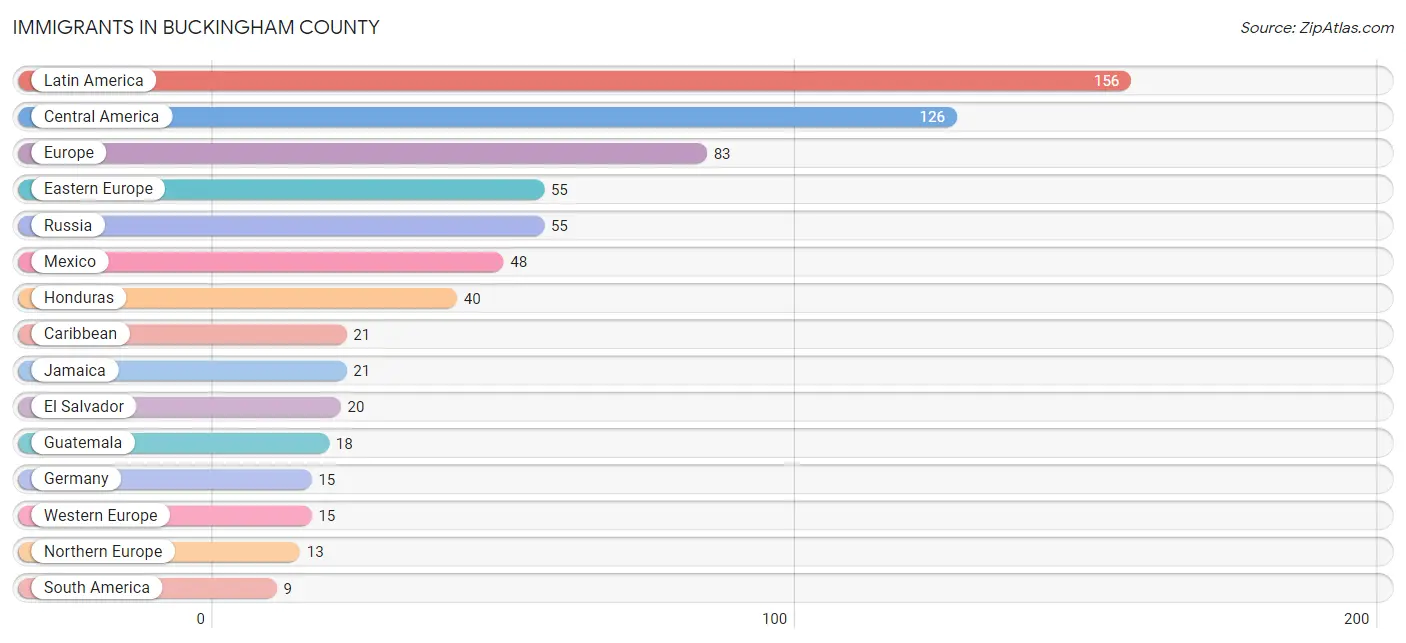
| Immigration Origin | # Population | % Population |
| Africa | 7 | 0.0% |
| Asia | 4 | 0.0% |
| Caribbean | 21 | 0.1% |
| Central America | 126 | 0.7% |
| Eastern Europe | 55 | 0.3% |
| El Salvador | 20 | 0.1% |
| England | 7 | 0.0% |
| Europe | 83 | 0.5% |
| Germany | 15 | 0.1% |
| Guatemala | 18 | 0.1% |
| Honduras | 40 | 0.2% |
| India | 3 | 0.0% |
| Jamaica | 21 | 0.1% |
| Latin America | 156 | 0.9% |
| Mexico | 48 | 0.3% |
| Northern Europe | 13 | 0.1% |
| Peru | 4 | 0.0% |
| Philippines | 1 | 0.0% |
| Russia | 55 | 0.3% |
| South America | 9 | 0.1% |
| South Central Asia | 3 | 0.0% |
| South Eastern Asia | 1 | 0.0% |
| Western Europe | 15 | 0.1% | View All 23 Rows |
Sex and Age in Buckingham County
Sex and Age in Buckingham County
The most populous age groups in Buckingham County are 55 to 59 Years (790 | 8.4%) for men and 60 to 64 Years (688 | 9.2%) for women.
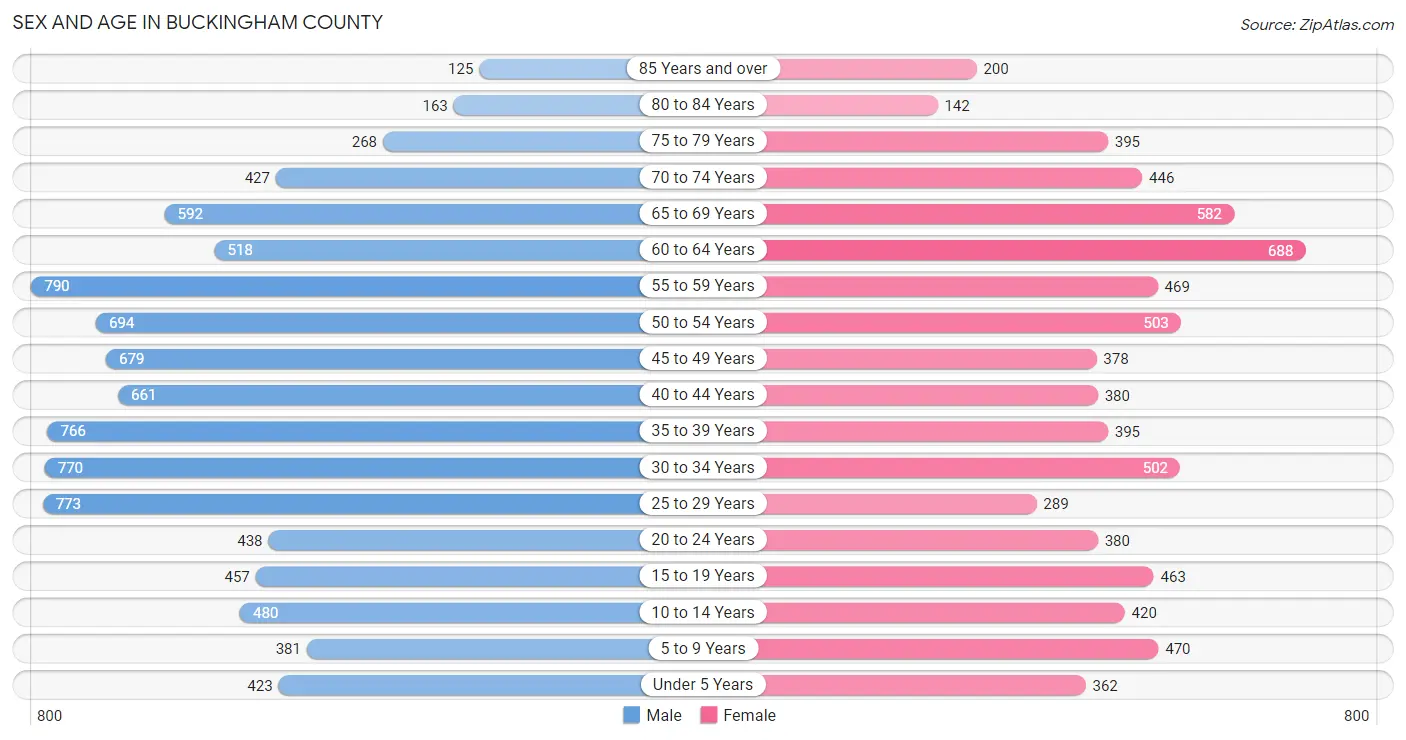
| Age Bracket | Male | Female |
| Under 5 Years | 423 (4.5%) | 362 (4.9%) |
| 5 to 9 Years | 381 (4.1%) | 470 (6.3%) |
| 10 to 14 Years | 480 (5.1%) | 420 (5.6%) |
| 15 to 19 Years | 457 (4.9%) | 463 (6.2%) |
| 20 to 24 Years | 438 (4.7%) | 380 (5.1%) |
| 25 to 29 Years | 773 (8.2%) | 289 (3.9%) |
| 30 to 34 Years | 770 (8.2%) | 502 (6.7%) |
| 35 to 39 Years | 766 (8.1%) | 395 (5.3%) |
| 40 to 44 Years | 661 (7.0%) | 380 (5.1%) |
| 45 to 49 Years | 679 (7.2%) | 378 (5.1%) |
| 50 to 54 Years | 694 (7.4%) | 503 (6.7%) |
| 55 to 59 Years | 790 (8.4%) | 469 (6.3%) |
| 60 to 64 Years | 518 (5.5%) | 688 (9.2%) |
| 65 to 69 Years | 592 (6.3%) | 582 (7.8%) |
| 70 to 74 Years | 427 (4.5%) | 446 (6.0%) |
| 75 to 79 Years | 268 (2.9%) | 395 (5.3%) |
| 80 to 84 Years | 163 (1.7%) | 142 (1.9%) |
| 85 Years and over | 125 (1.3%) | 200 (2.7%) |
| Total | 9,405 (100.0%) | 7,464 (100.0%) |
Families and Households in Buckingham County
Median Family Size in Buckingham County
The median family size in Buckingham County is 3.11 persons per family, with single male/father families (360 | 9.1%) accounting for the largest median family size of 3.23 persons per family. On the other hand, single female/mother families (615 | 15.5%) represent the smallest median family size with 2.88 persons per family.
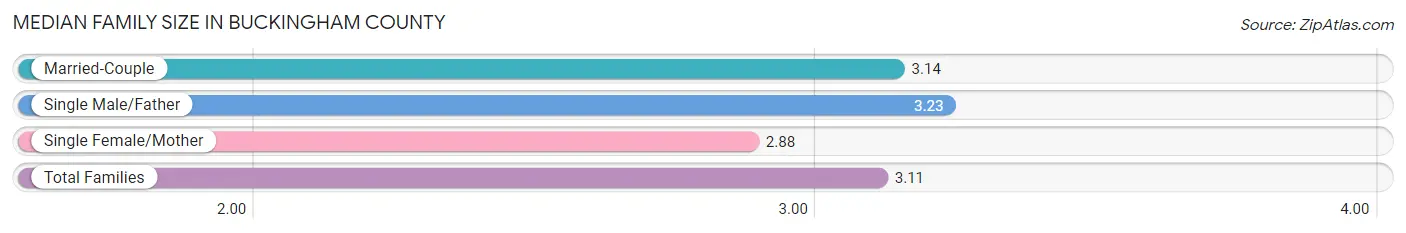
| Family Type | # Families | Family Size |
| Married-Couple | 3,000 (75.5%) | 3.14 |
| Single Male/Father | 360 (9.1%) | 3.23 |
| Single Female/Mother | 615 (15.5%) | 2.88 |
| Total Families | 3,975 (100.0%) | 3.11 |
Median Household Size in Buckingham County
The median household size in Buckingham County is 2.52 persons per household, with single male/father households (360 | 6.1%) accounting for the largest median household size of 3.58 persons per household. non-family households (1,923 | 32.6%) represent the smallest median household size with 1.16 persons per household.
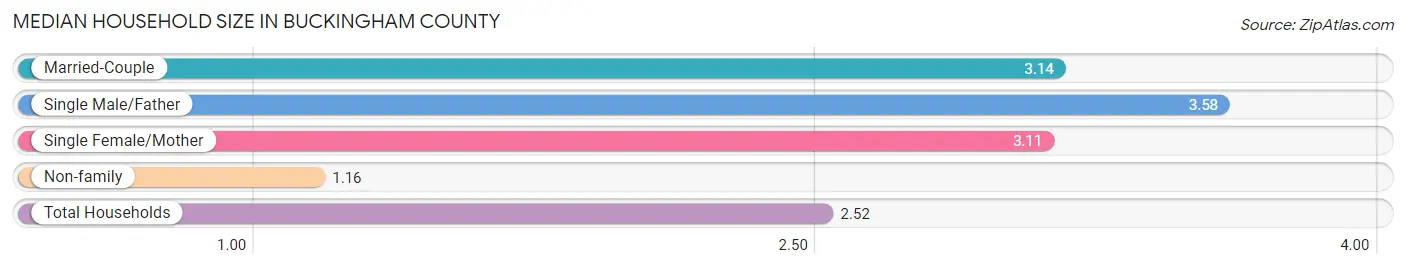
| Household Type | # Households | Household Size |
| Married-Couple | 3,000 (50.9%) | 3.14 |
| Single Male/Father | 360 (6.1%) | 3.58 |
| Single Female/Mother | 615 (10.4%) | 3.11 |
| Non-family | 1,923 (32.6%) | 1.16 |
| Total Households | 5,898 (100.0%) | 2.52 |
Household Size by Marriage Status in Buckingham County
Out of a total of 5,898 households in Buckingham County, 3,975 (67.4%) are family households, while 1,923 (32.6%) are nonfamily households. The most numerous type of family households are 2-person households, comprising 1,864, and the most common type of nonfamily households are 1-person households, comprising 1,660.
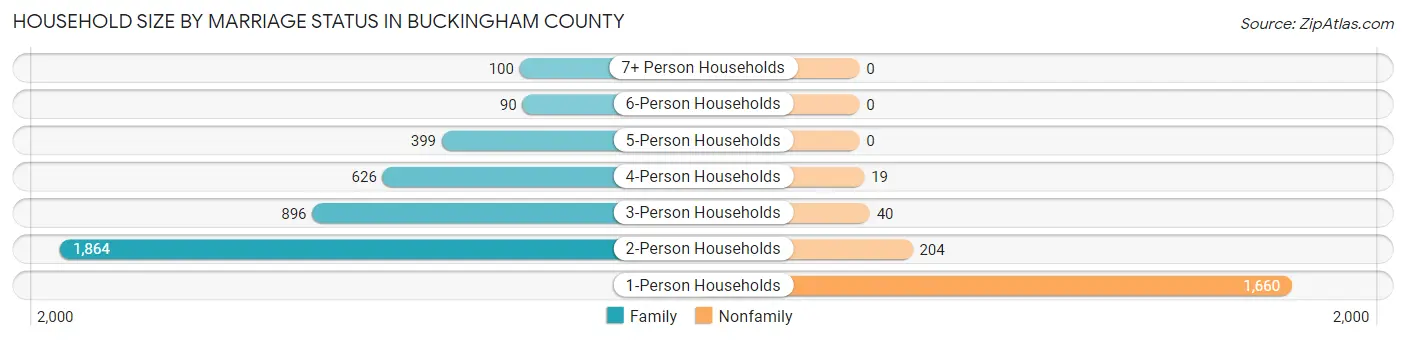
| Household Size | Family Households | Nonfamily Households |
| 1-Person Households | - | 1,660 (28.1%) |
| 2-Person Households | 1,864 (31.6%) | 204 (3.5%) |
| 3-Person Households | 896 (15.2%) | 40 (0.7%) |
| 4-Person Households | 626 (10.6%) | 19 (0.3%) |
| 5-Person Households | 399 (6.8%) | 0 (0.0%) |
| 6-Person Households | 90 (1.5%) | 0 (0.0%) |
| 7+ Person Households | 100 (1.7%) | 0 (0.0%) |
| Total | 3,975 (67.4%) | 1,923 (32.6%) |
Female Fertility in Buckingham County
Fertility by Age in Buckingham County
Average fertility rate in Buckingham County is 36.0 births per 1,000 women. Women in the age bracket of 20 to 34 years have the highest fertility rate with 88.0 births per 1,000 women. Women in the age bracket of 20 to 34 years acount for 100.0% of all women with births.
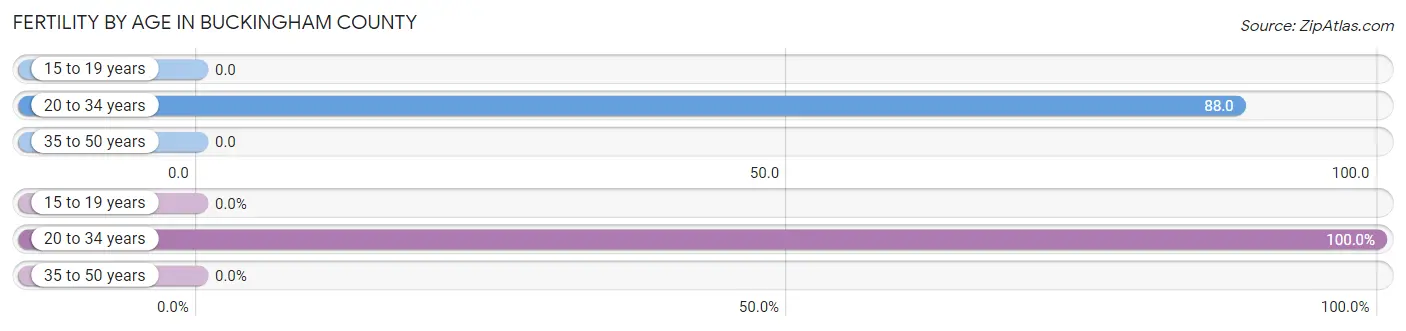
| Age Bracket | Women with Births | Births / 1,000 Women |
| 15 to 19 years | 0 (0.0%) | 0.0 |
| 20 to 34 years | 103 (100.0%) | 88.0 |
| 35 to 50 years | 0 (0.0%) | 0.0 |
| Total | 103 (100.0%) | 36.0 |
Fertility by Age by Marriage Status in Buckingham County
53.4% of women with births (103) in Buckingham County are married. The highest percentage of unmarried women with births falls into 20 to 34 years age bracket with 46.6% of them unmarried at the time of birth, while the lowest percentage of unmarried women with births belong to 20 to 34 years age bracket with 46.6% of them unmarried.
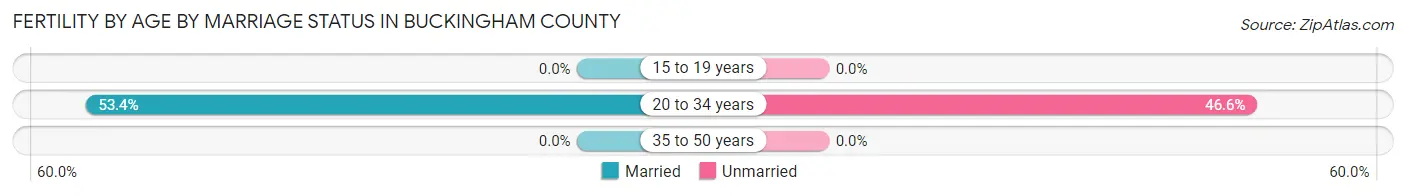
| Age Bracket | Married | Unmarried |
| 15 to 19 years | 0 (0.0%) | 0 (0.0%) |
| 20 to 34 years | 55 (53.4%) | 48 (46.6%) |
| 35 to 50 years | 0 (0.0%) | 0 (0.0%) |
| Total | 55 (53.4%) | 48 (46.6%) |
Fertility by Education in Buckingham County
Average fertility rate in Buckingham County is 36.0 births per 1,000 women. Women with the education attainment of graduate degree have the highest fertility rate of 82.0 births per 1,000 women, while women with the education attainment of less than high school have the lowest fertility at 10.0 births per 1,000 women. Women with the education attainment of high school diploma represent 38.8% of all women with births.
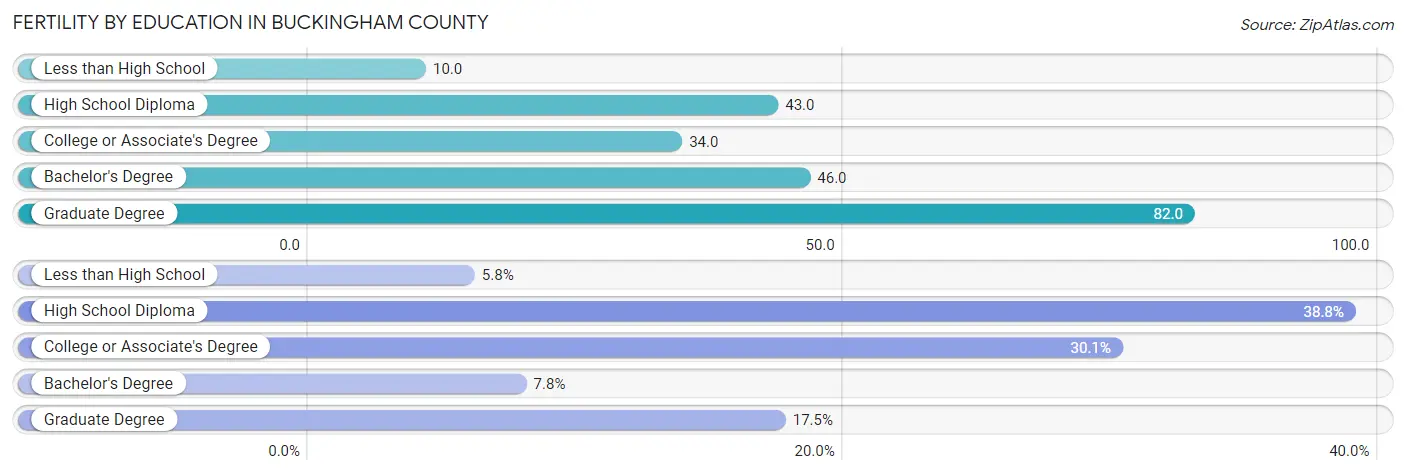
| Educational Attainment | Women with Births | Births / 1,000 Women |
| Less than High School | 6 (5.8%) | 10.0 |
| High School Diploma | 40 (38.8%) | 43.0 |
| College or Associate's Degree | 31 (30.1%) | 34.0 |
| Bachelor's Degree | 8 (7.8%) | 46.0 |
| Graduate Degree | 18 (17.5%) | 82.0 |
| Total | 103 (100.0%) | 36.0 |
Fertility by Education by Marriage Status in Buckingham County
46.6% of women with births in Buckingham County are unmarried. Women with the educational attainment of bachelor's degree are most likely to be married with 100.0% of them married at childbirth, while women with the educational attainment of less than high school are least likely to be married with 100.0% of them unmarried at childbirth.
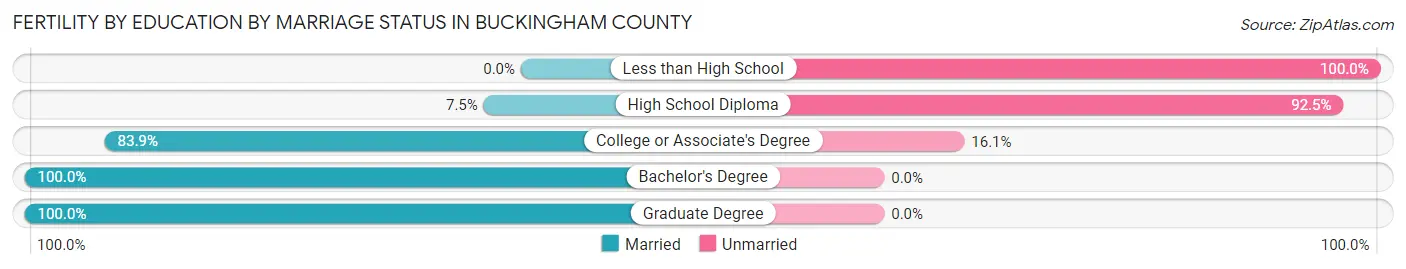
| Educational Attainment | Married | Unmarried |
| Less than High School | 0 (0.0%) | 6 (100.0%) |
| High School Diploma | 3 (7.5%) | 37 (92.5%) |
| College or Associate's Degree | 26 (83.9%) | 5 (16.1%) |
| Bachelor's Degree | 8 (100.0%) | 0 (0.0%) |
| Graduate Degree | 18 (100.0%) | 0 (0.0%) |
| Total | 55 (53.4%) | 48 (46.6%) |
Employment Characteristics in Buckingham County
Employment by Class of Employer in Buckingham County
Among the 6,479 employed individuals in Buckingham County, private company employees (3,860 | 59.6%), not-for-profit organizations (658 | 10.2%), and self-employed (not incorporated) (514 | 7.9%) make up the most common classes of employment.
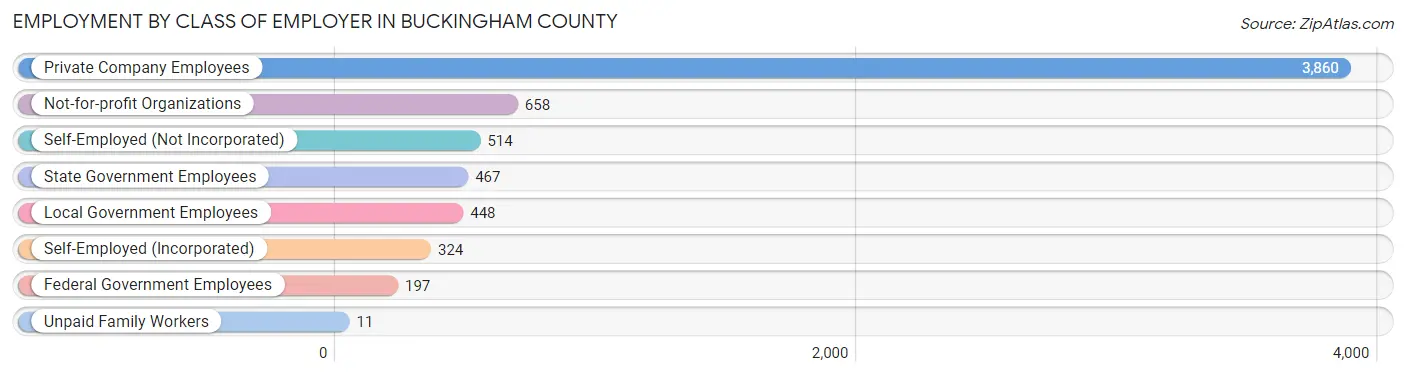
| Employer Class | # Employees | % Employees |
| Private Company Employees | 3,860 | 59.6% |
| Self-Employed (Incorporated) | 324 | 5.0% |
| Self-Employed (Not Incorporated) | 514 | 7.9% |
| Not-for-profit Organizations | 658 | 10.2% |
| Local Government Employees | 448 | 6.9% |
| State Government Employees | 467 | 7.2% |
| Federal Government Employees | 197 | 3.0% |
| Unpaid Family Workers | 11 | 0.2% |
| Total | 6,479 | 100.0% |
Employment Status by Age in Buckingham County
According to the labor force statistics for Buckingham County, out of the total population over 16 years of age (14,179), 50.5% or 7,160 individuals are in the labor force, with 5.0% or 358 of them unemployed. The age group with the highest labor force participation rate is 20 to 24 years, with 76.8% or 628 individuals in the labor force. Within the labor force, the 16 to 19 years age range has the highest percentage of unemployed individuals, with 16.0% or 31 of them being unemployed.
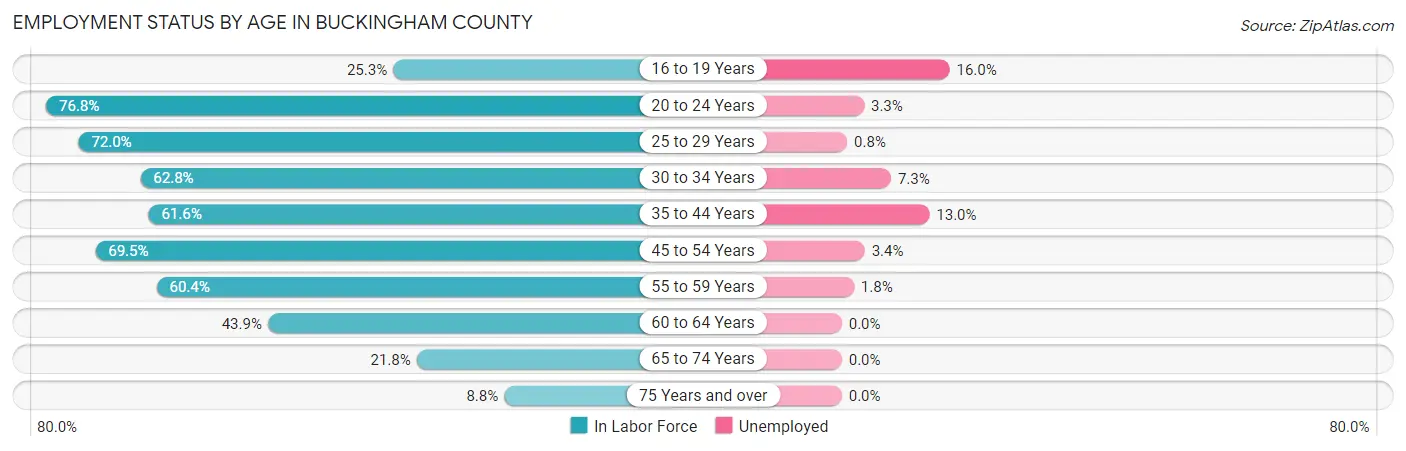
| Age Bracket | In Labor Force | Unemployed |
| 16 to 19 Years | 194 (25.3%) | 31 (16.0%) |
| 20 to 24 Years | 628 (76.8%) | 21 (3.3%) |
| 25 to 29 Years | 765 (72.0%) | 6 (0.8%) |
| 30 to 34 Years | 799 (62.8%) | 58 (7.3%) |
| 35 to 44 Years | 1,356 (61.6%) | 176 (13.0%) |
| 45 to 54 Years | 1,567 (69.5%) | 53 (3.4%) |
| 55 to 59 Years | 760 (60.4%) | 14 (1.8%) |
| 60 to 64 Years | 529 (43.9%) | 0 (0.0%) |
| 65 to 74 Years | 446 (21.8%) | 0 (0.0%) |
| 75 Years and over | 114 (8.8%) | 0 (0.0%) |
| Total | 7,160 (50.5%) | 358 (5.0%) |
Employment Status by Educational Attainment in Buckingham County
According to labor force statistics for Buckingham County, 62.4% of individuals (5,775) out of the total population between 25 and 64 years of age (9,255) are in the labor force, with 5.3% or 306 of them being unemployed. The group with the highest labor force participation rate are those with the educational attainment of bachelor's degree or higher, with 83.6% or 927 individuals in the labor force. Within the labor force, individuals with less than high school education have the highest percentage of unemployment, with 13.3% or 58 of them being unemployed.
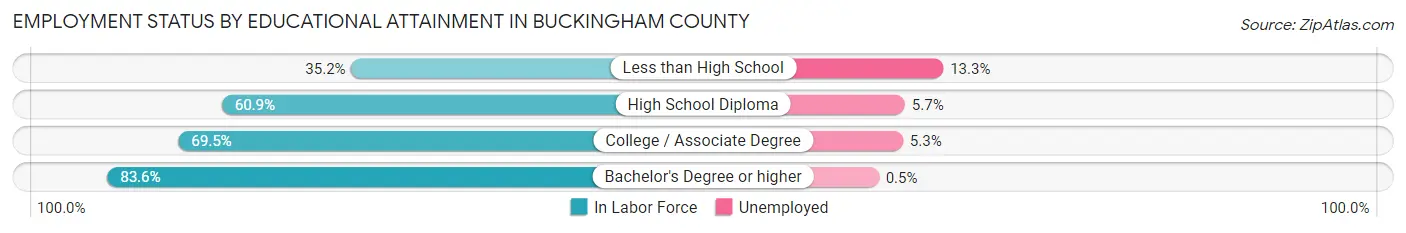
| Educational Attainment | In Labor Force | Unemployed |
| Less than High School | 436 (35.2%) | 165 (13.3%) |
| High School Diploma | 2,711 (60.9%) | 254 (5.7%) |
| College / Associate Degree | 1,706 (69.5%) | 130 (5.3%) |
| Bachelor's Degree or higher | 927 (83.6%) | 6 (0.5%) |
| Total | 5,775 (62.4%) | 491 (5.3%) |
Employment Occupations by Sex in Buckingham County
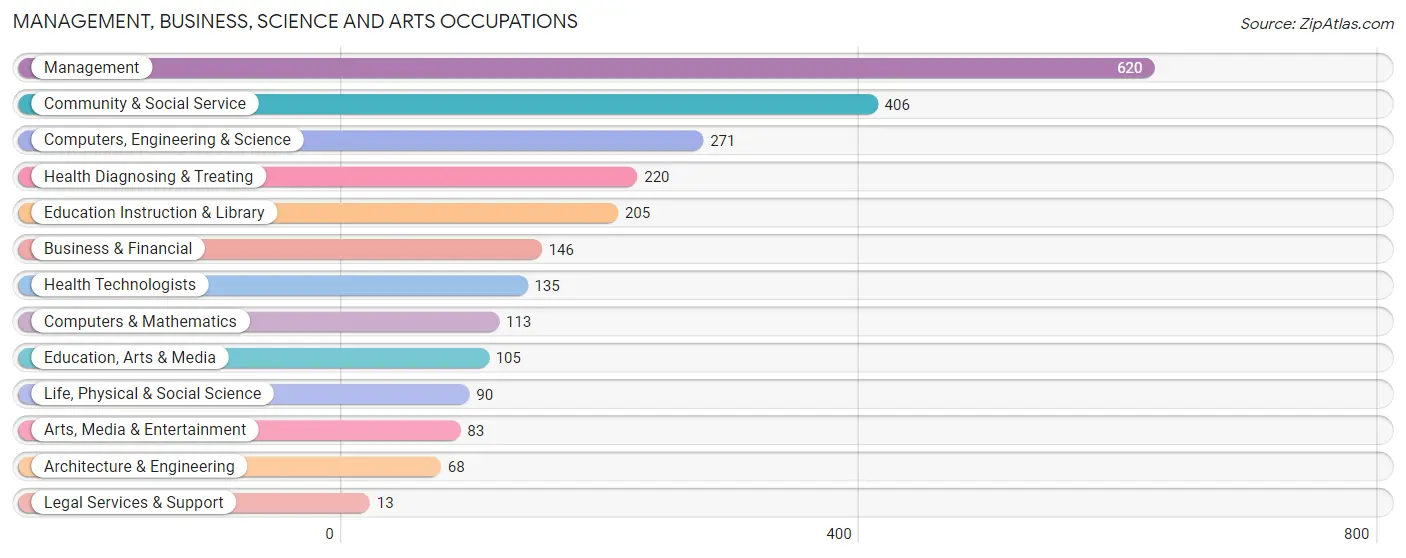
Management, Business, Science and Arts Occupations
The most common Management, Business, Science and Arts occupations in Buckingham County are Management (620 | 9.1%), Community & Social Service (406 | 6.0%), Computers, Engineering & Science (271 | 4.0%), Health Diagnosing & Treating (220 | 3.2%), and Education Instruction & Library (205 | 3.0%).
Management, Business, Science and Arts Occupations by Sex
Within the Management, Business, Science and Arts occupations in Buckingham County, the most male-oriented occupations are Legal Services & Support (100.0%), Computers & Mathematics (78.8%), and Computers, Engineering & Science (69.4%), while the most female-oriented occupations are Health Technologists (87.4%), Education Instruction & Library (86.8%), and Health Diagnosing & Treating (74.1%).
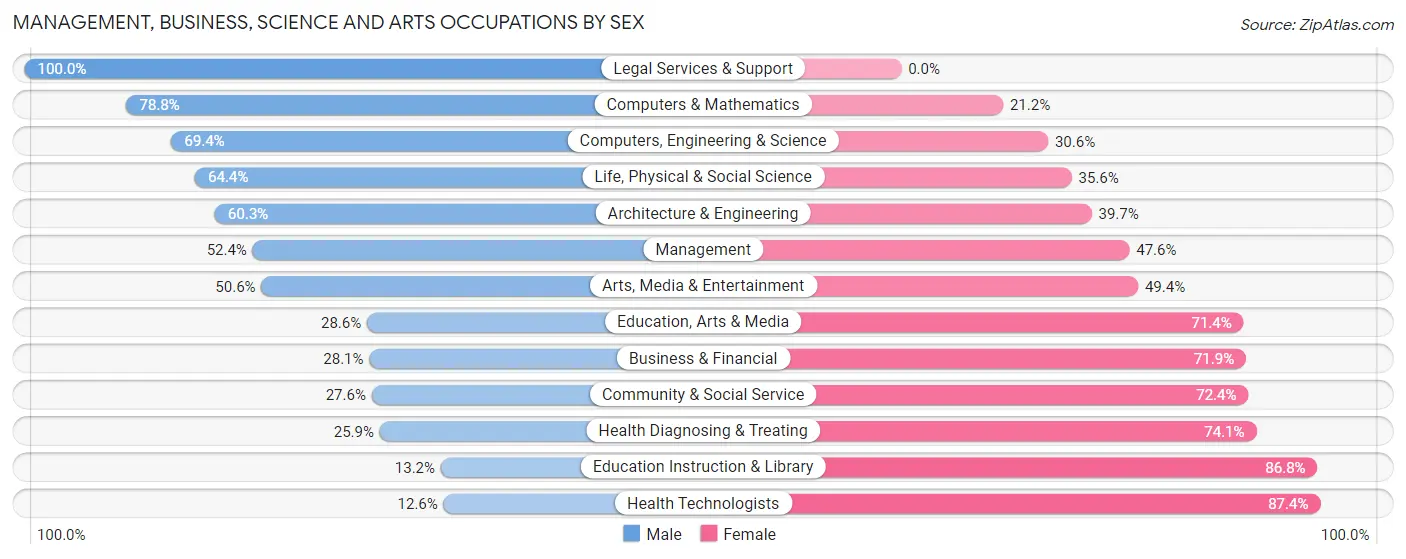
| Occupation | Male | Female |
| Management | 325 (52.4%) | 295 (47.6%) |
| Business & Financial | 41 (28.1%) | 105 (71.9%) |
| Computers, Engineering & Science | 188 (69.4%) | 83 (30.6%) |
| Computers & Mathematics | 89 (78.8%) | 24 (21.2%) |
| Architecture & Engineering | 41 (60.3%) | 27 (39.7%) |
| Life, Physical & Social Science | 58 (64.4%) | 32 (35.6%) |
| Community & Social Service | 112 (27.6%) | 294 (72.4%) |
| Education, Arts & Media | 30 (28.6%) | 75 (71.4%) |
| Legal Services & Support | 13 (100.0%) | 0 (0.0%) |
| Education Instruction & Library | 27 (13.2%) | 178 (86.8%) |
| Arts, Media & Entertainment | 42 (50.6%) | 41 (49.4%) |
| Health Diagnosing & Treating | 57 (25.9%) | 163 (74.1%) |
| Health Technologists | 17 (12.6%) | 118 (87.4%) |
| Total (Category) | 723 (43.5%) | 940 (56.5%) |
| Total (Overall) | 3,895 (57.3%) | 2,906 (42.7%) |
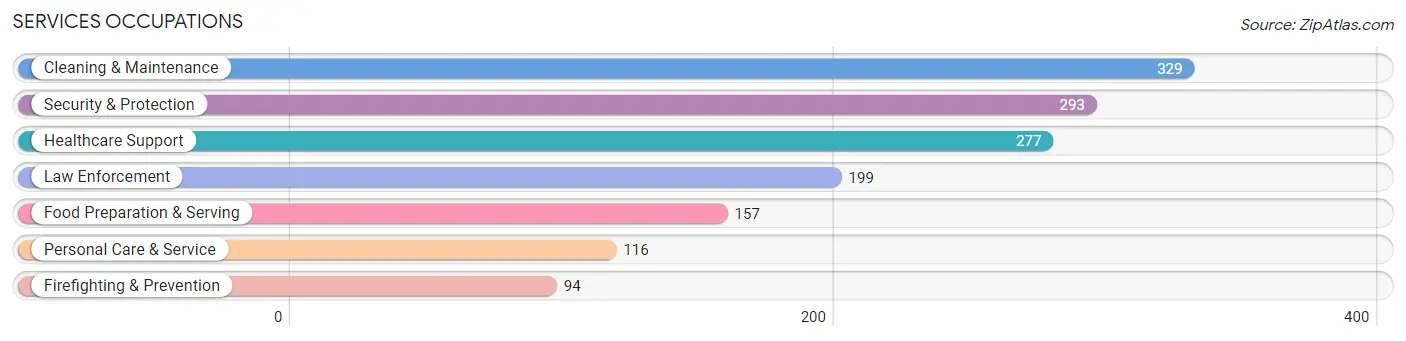
Services Occupations
The most common Services occupations in Buckingham County are Cleaning & Maintenance (329 | 4.8%), Security & Protection (293 | 4.3%), Healthcare Support (277 | 4.1%), Law Enforcement (199 | 2.9%), and Food Preparation & Serving (157 | 2.3%).
Services Occupations by Sex
Within the Services occupations in Buckingham County, the most male-oriented occupations are Firefighting & Prevention (83.0%), Cleaning & Maintenance (68.1%), and Security & Protection (60.8%), while the most female-oriented occupations are Personal Care & Service (94.0%), Healthcare Support (92.1%), and Food Preparation & Serving (61.2%).
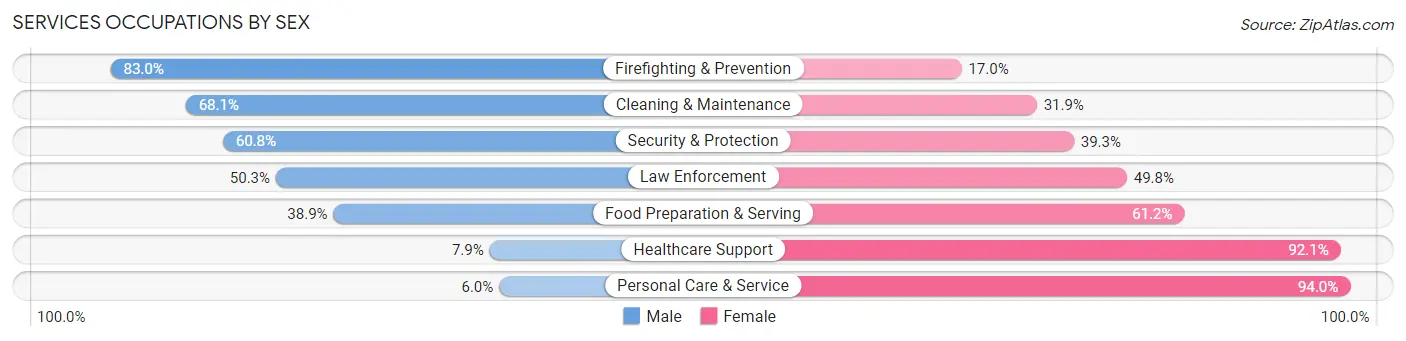
| Occupation | Male | Female |
| Healthcare Support | 22 (7.9%) | 255 (92.1%) |
| Security & Protection | 178 (60.8%) | 115 (39.3%) |
| Firefighting & Prevention | 78 (83.0%) | 16 (17.0%) |
| Law Enforcement | 100 (50.2%) | 99 (49.7%) |
| Food Preparation & Serving | 61 (38.9%) | 96 (61.2%) |
| Cleaning & Maintenance | 224 (68.1%) | 105 (31.9%) |
| Personal Care & Service | 7 (6.0%) | 109 (94.0%) |
| Total (Category) | 492 (42.0%) | 680 (58.0%) |
| Total (Overall) | 3,895 (57.3%) | 2,906 (42.7%) |
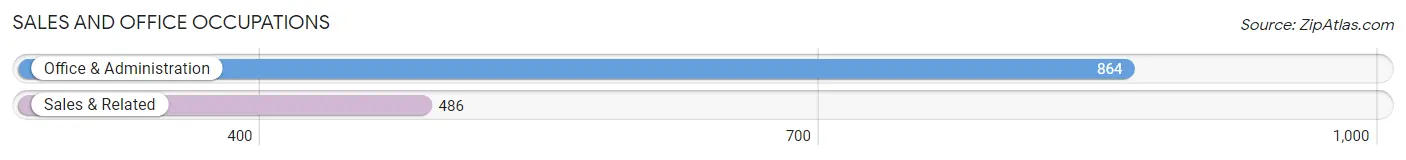
Sales and Office Occupations
The most common Sales and Office occupations in Buckingham County are Office & Administration (864 | 12.7%), and Sales & Related (486 | 7.1%).
Sales and Office Occupations by Sex
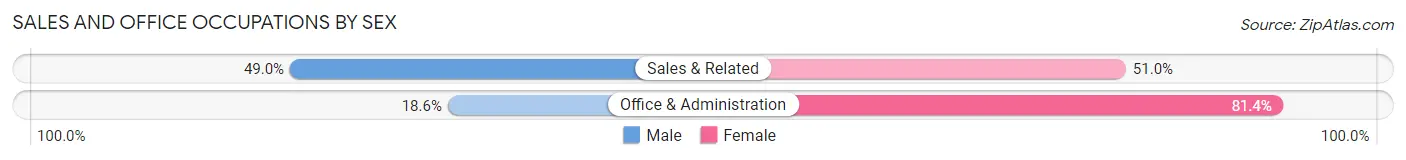
| Occupation | Male | Female |
| Sales & Related | 238 (49.0%) | 248 (51.0%) |
| Office & Administration | 161 (18.6%) | 703 (81.4%) |
| Total (Category) | 399 (29.6%) | 951 (70.4%) |
| Total (Overall) | 3,895 (57.3%) | 2,906 (42.7%) |
Natural Resources, Construction and Maintenance Occupations
The most common Natural Resources, Construction and Maintenance occupations in Buckingham County are Construction & Extraction (773 | 11.4%), Installation, Maintenance & Repair (328 | 4.8%), and Farming, Fishing & Forestry (150 | 2.2%).
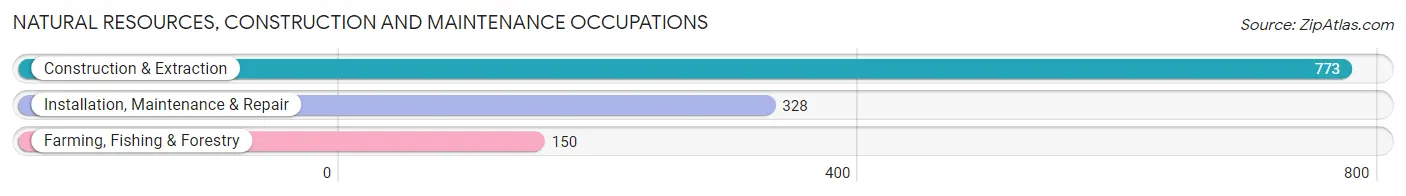
Natural Resources, Construction and Maintenance Occupations by Sex
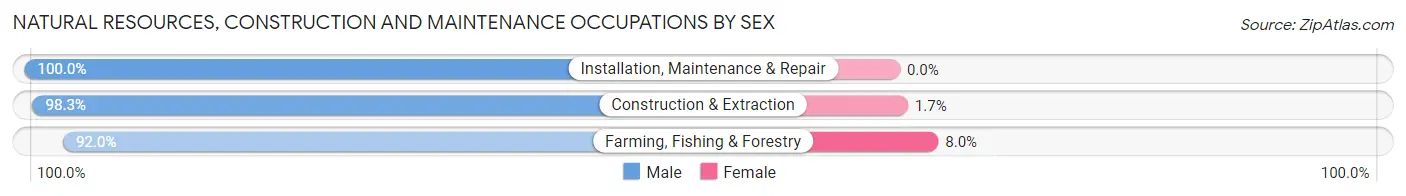
| Occupation | Male | Female |
| Farming, Fishing & Forestry | 138 (92.0%) | 12 (8.0%) |
| Construction & Extraction | 760 (98.3%) | 13 (1.7%) |
| Installation, Maintenance & Repair | 328 (100.0%) | 0 (0.0%) |
| Total (Category) | 1,226 (98.0%) | 25 (2.0%) |
| Total (Overall) | 3,895 (57.3%) | 2,906 (42.7%) |
Production, Transportation and Moving Occupations
The most common Production, Transportation and Moving occupations in Buckingham County are Material Moving (562 | 8.3%), Transportation (490 | 7.2%), and Production (313 | 4.6%).
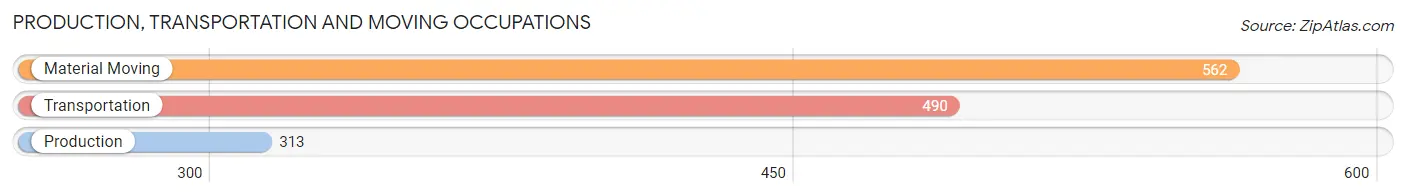
Production, Transportation and Moving Occupations by Sex
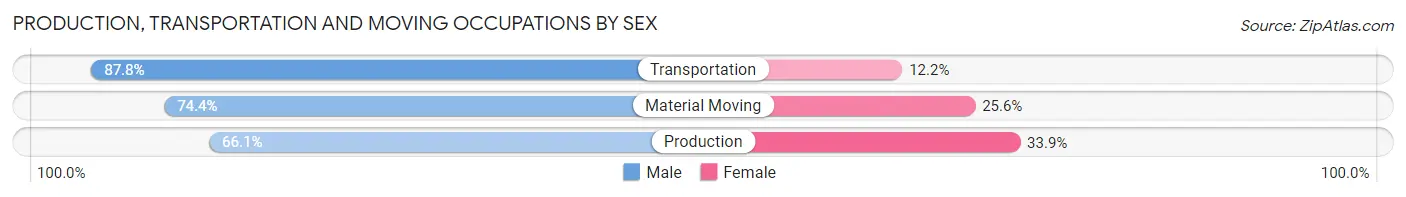
| Occupation | Male | Female |
| Production | 207 (66.1%) | 106 (33.9%) |
| Transportation | 430 (87.8%) | 60 (12.2%) |
| Material Moving | 418 (74.4%) | 144 (25.6%) |
| Total (Category) | 1,055 (77.3%) | 310 (22.7%) |
| Total (Overall) | 3,895 (57.3%) | 2,906 (42.7%) |
Employment Industries by Sex in Buckingham County
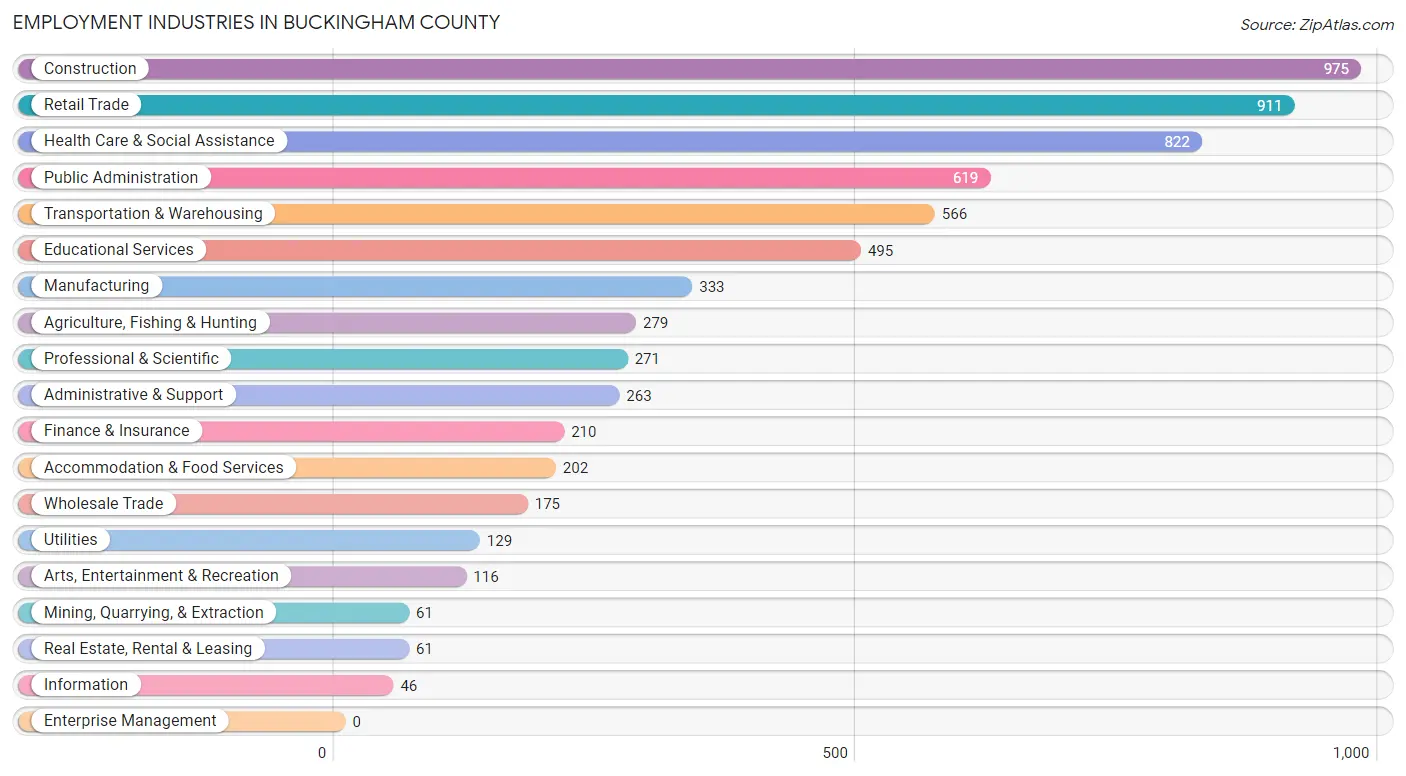
Employment Industries in Buckingham County
The major employment industries in Buckingham County include Construction (975 | 14.3%), Retail Trade (911 | 13.4%), Health Care & Social Assistance (822 | 12.1%), Public Administration (619 | 9.1%), and Transportation & Warehousing (566 | 8.3%).
Employment Industries by Sex in Buckingham County
The Buckingham County industries that see more men than women are Mining, Quarrying, & Extraction (100.0%), Information (95.7%), and Wholesale Trade (94.3%), whereas the industries that tend to have a higher number of women are Finance & Insurance (84.8%), Health Care & Social Assistance (82.5%), and Educational Services (77.8%).
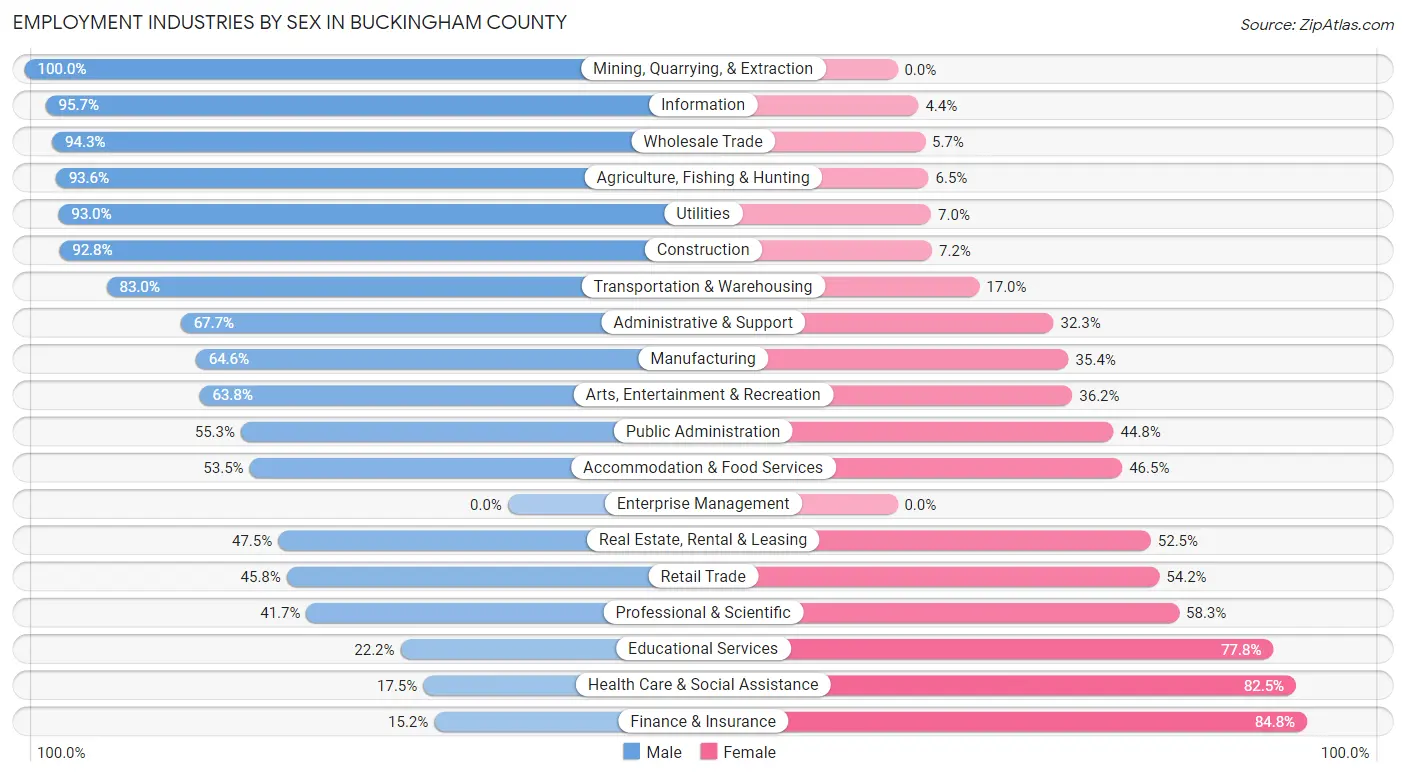
| Industry | Male | Female |
| Agriculture, Fishing & Hunting | 261 (93.5%) | 18 (6.5%) |
| Mining, Quarrying, & Extraction | 61 (100.0%) | 0 (0.0%) |
| Construction | 905 (92.8%) | 70 (7.2%) |
| Manufacturing | 215 (64.6%) | 118 (35.4%) |
| Wholesale Trade | 165 (94.3%) | 10 (5.7%) |
| Retail Trade | 417 (45.8%) | 494 (54.2%) |
| Transportation & Warehousing | 470 (83.0%) | 96 (17.0%) |
| Utilities | 120 (93.0%) | 9 (7.0%) |
| Information | 44 (95.7%) | 2 (4.3%) |
| Finance & Insurance | 32 (15.2%) | 178 (84.8%) |
| Real Estate, Rental & Leasing | 29 (47.5%) | 32 (52.5%) |
| Professional & Scientific | 113 (41.7%) | 158 (58.3%) |
| Enterprise Management | 0 (0.0%) | 0 (0.0%) |
| Administrative & Support | 178 (67.7%) | 85 (32.3%) |
| Educational Services | 110 (22.2%) | 385 (77.8%) |
| Health Care & Social Assistance | 144 (17.5%) | 678 (82.5%) |
| Arts, Entertainment & Recreation | 74 (63.8%) | 42 (36.2%) |
| Accommodation & Food Services | 108 (53.5%) | 94 (46.5%) |
| Public Administration | 342 (55.2%) | 277 (44.8%) |
| Total | 3,895 (57.3%) | 2,906 (42.7%) |
Education in Buckingham County
School Enrollment in Buckingham County
The most common levels of schooling among the 3,193 students in Buckingham County are college / undergraduate (711 | 22.3%), middle school (701 | 22.0%), and high school (697 | 21.8%).
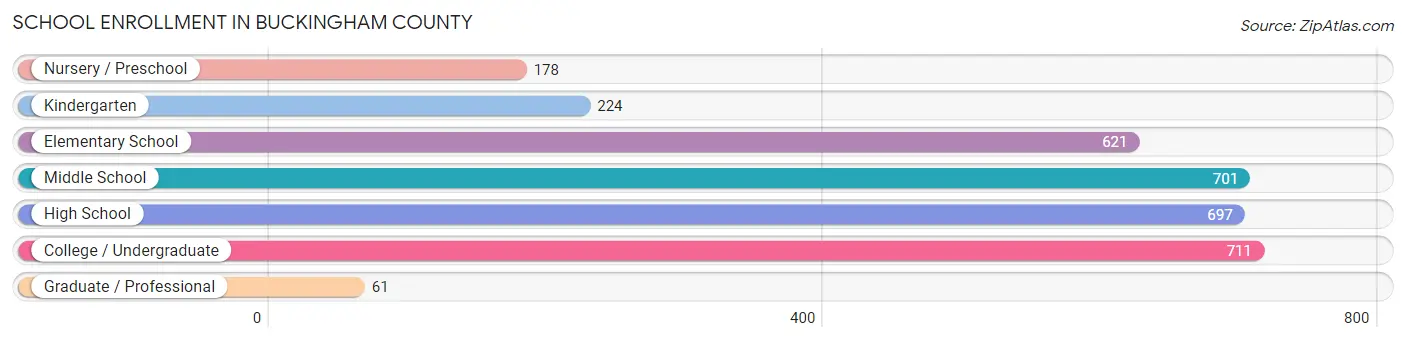
| School Level | # Students | % Students |
| Nursery / Preschool | 178 | 5.6% |
| Kindergarten | 224 | 7.0% |
| Elementary School | 621 | 19.5% |
| Middle School | 701 | 22.0% |
| High School | 697 | 21.8% |
| College / Undergraduate | 711 | 22.3% |
| Graduate / Professional | 61 | 1.9% |
| Total | 3,193 | 100.0% |
School Enrollment by Age by Funding Source in Buckingham County
Out of a total of 3,193 students who are enrolled in schools in Buckingham County, 431 (13.5%) attend a private institution, while the remaining 2,762 (86.5%) are enrolled in public schools. The age group of 3 to 4 year olds has the highest likelihood of being enrolled in private schools, with 32 (24.4% in the age bracket) enrolled. Conversely, the age group of 18 to 19 year olds has the lowest likelihood of being enrolled in a private school, with 141 (100.0% in the age bracket) attending a public institution.
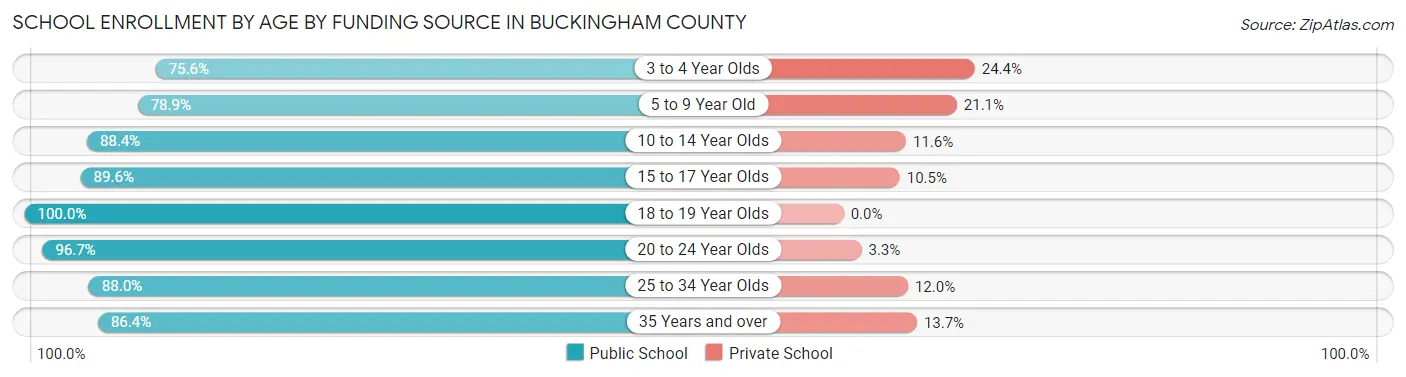
| Age Bracket | Public School | Private School |
| 3 to 4 Year Olds | 99 (75.6%) | 32 (24.4%) |
| 5 to 9 Year Old | 655 (78.9%) | 175 (21.1%) |
| 10 to 14 Year Olds | 753 (88.4%) | 99 (11.6%) |
| 15 to 17 Year Olds | 377 (89.5%) | 44 (10.4%) |
| 18 to 19 Year Olds | 141 (100.0%) | 0 (0.0%) |
| 20 to 24 Year Olds | 261 (96.7%) | 9 (3.3%) |
| 25 to 34 Year Olds | 147 (88.0%) | 20 (12.0%) |
| 35 Years and over | 329 (86.4%) | 52 (13.7%) |
| Total | 2,762 (86.5%) | 431 (13.5%) |
Educational Attainment by Field of Study in Buckingham County
Business (259 | 16.1%), education (236 | 14.7%), bio, nature & agricultural (220 | 13.7%), arts & humanities (182 | 11.3%), and liberal arts & history (154 | 9.6%) are the most common fields of study among 1,609 individuals in Buckingham County who have obtained a bachelor's degree or higher.
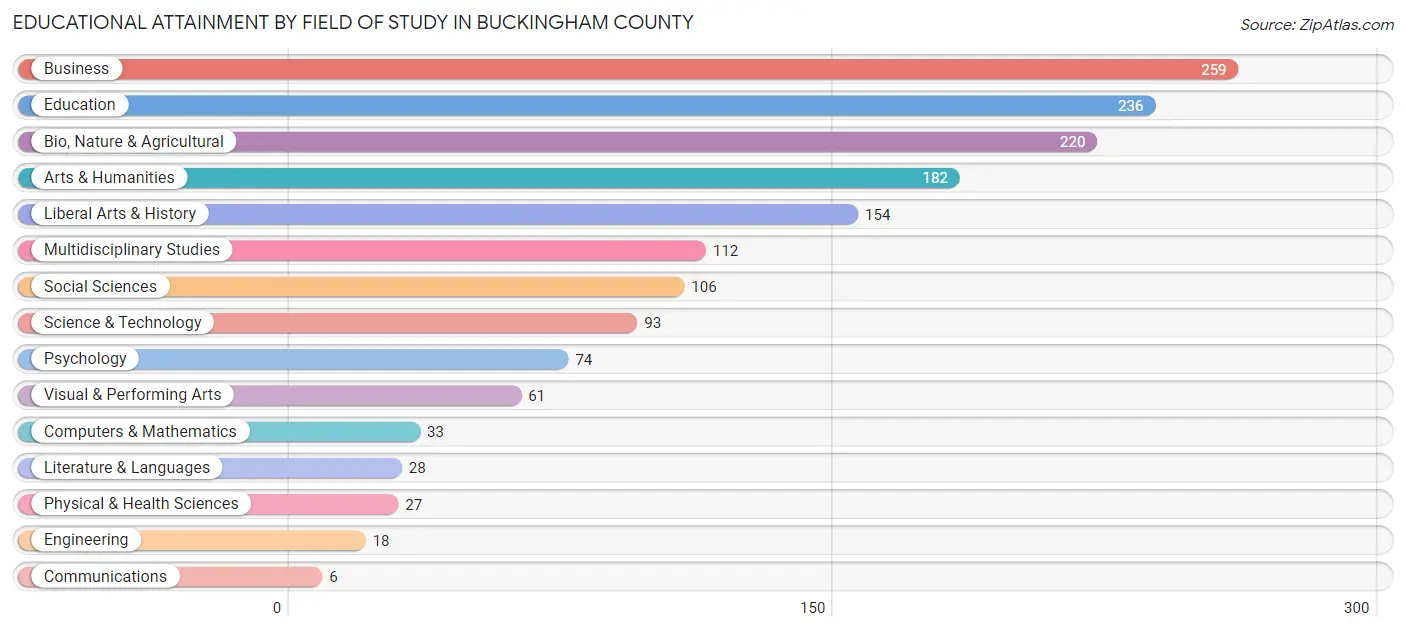
| Field of Study | # Graduates | % Graduates |
| Computers & Mathematics | 33 | 2.1% |
| Bio, Nature & Agricultural | 220 | 13.7% |
| Physical & Health Sciences | 27 | 1.7% |
| Psychology | 74 | 4.6% |
| Social Sciences | 106 | 6.6% |
| Engineering | 18 | 1.1% |
| Multidisciplinary Studies | 112 | 7.0% |
| Science & Technology | 93 | 5.8% |
| Business | 259 | 16.1% |
| Education | 236 | 14.7% |
| Literature & Languages | 28 | 1.7% |
| Liberal Arts & History | 154 | 9.6% |
| Visual & Performing Arts | 61 | 3.8% |
| Communications | 6 | 0.4% |
| Arts & Humanities | 182 | 11.3% |
| Total | 1,609 | 100.0% |
Transportation & Commute in Buckingham County
Vehicle Availability by Sex in Buckingham County
The most prevalent vehicle ownership categories in Buckingham County are males with 3 vehicles (1,060, accounting for 28.7%) and females with 3 vehicles (735, making up 38.4%).
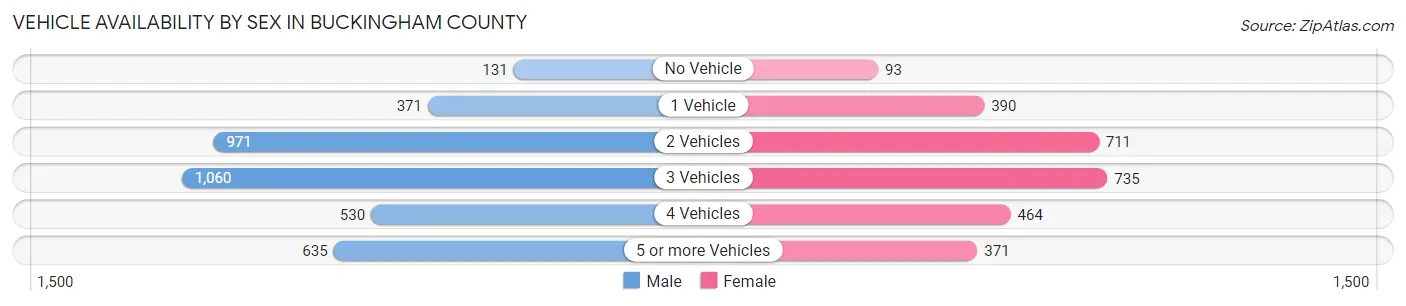
| Vehicles Available | Male | Female |
| No Vehicle | 131 (3.5%) | 93 (3.4%) |
| 1 Vehicle | 371 (10.0%) | 390 (14.1%) |
| 2 Vehicles | 971 (26.3%) | 711 (25.7%) |
| 3 Vehicles | 1,060 (28.7%) | 735 (26.6%) |
| 4 Vehicles | 530 (14.3%) | 464 (16.8%) |
| 5 or more Vehicles | 635 (17.2%) | 371 (13.4%) |
| Total | 3,698 (100.0%) | 2,764 (100.0%) |
Commute Time in Buckingham County
The most frequently occuring commute durations in Buckingham County are 45 to 59 minutes (1,215 commuters, 19.8%), 30 to 34 minutes (823 commuters, 13.4%), and 60 to 89 minutes (723 commuters, 11.8%).
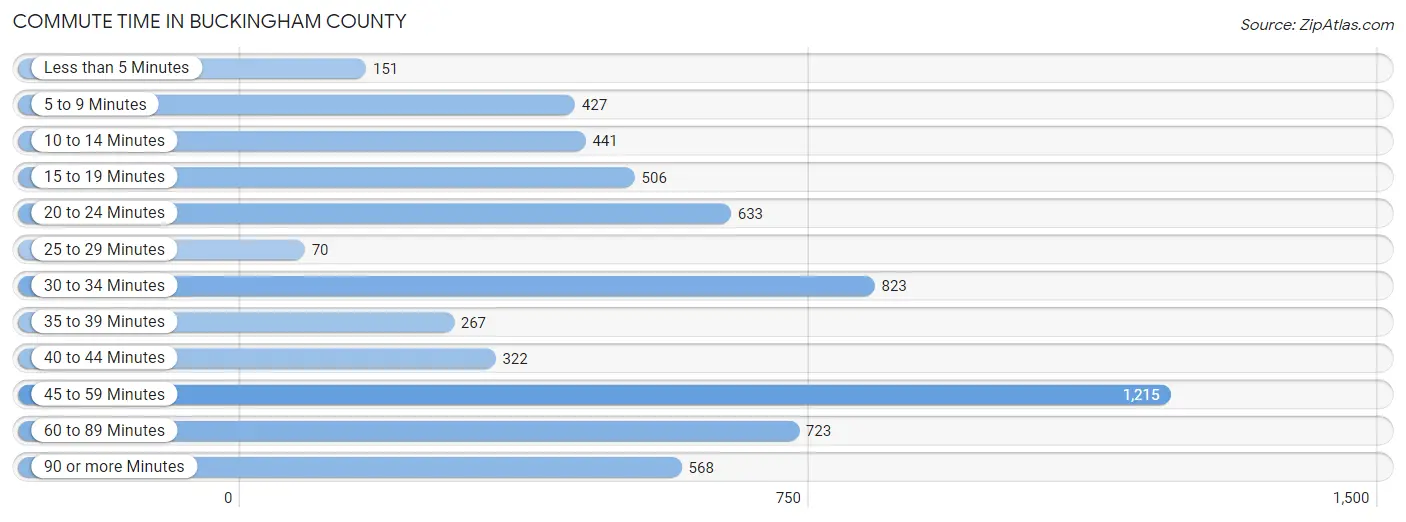
| Commute Time | # Commuters | % Commuters |
| Less than 5 Minutes | 151 | 2.5% |
| 5 to 9 Minutes | 427 | 7.0% |
| 10 to 14 Minutes | 441 | 7.2% |
| 15 to 19 Minutes | 506 | 8.2% |
| 20 to 24 Minutes | 633 | 10.3% |
| 25 to 29 Minutes | 70 | 1.1% |
| 30 to 34 Minutes | 823 | 13.4% |
| 35 to 39 Minutes | 267 | 4.3% |
| 40 to 44 Minutes | 322 | 5.2% |
| 45 to 59 Minutes | 1,215 | 19.8% |
| 60 to 89 Minutes | 723 | 11.8% |
| 90 or more Minutes | 568 | 9.2% |
Commute Time by Sex in Buckingham County
The most common commute times in Buckingham County are 45 to 59 minutes (825 commuters, 23.1%) for males and 45 to 59 minutes (390 commuters, 15.1%) for females.
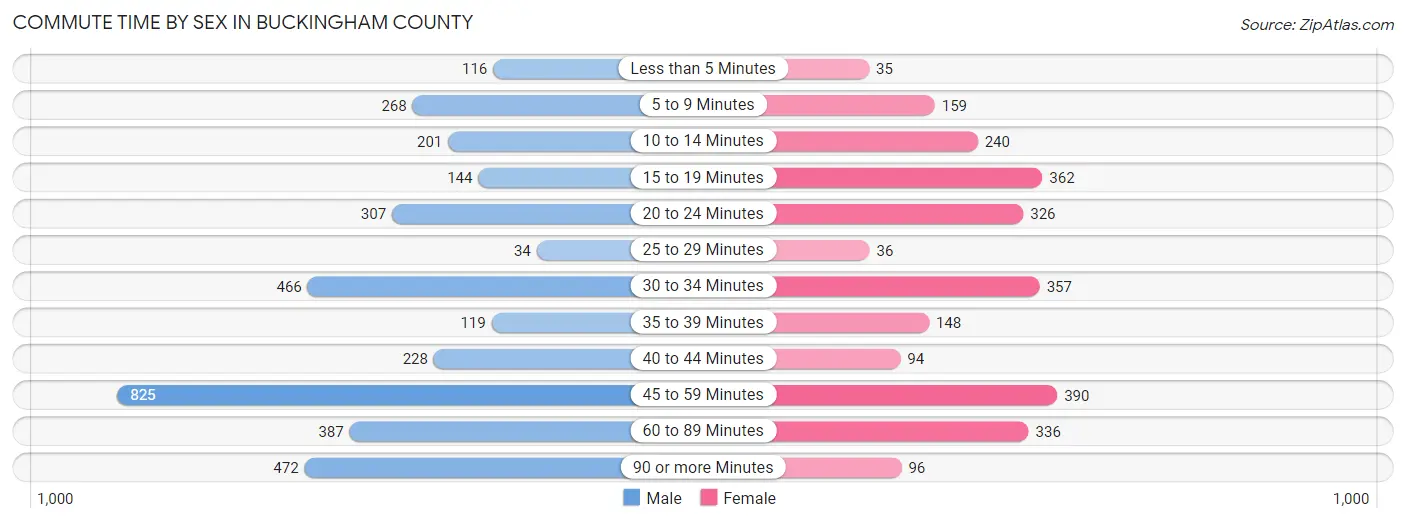
| Commute Time | Male | Female |
| Less than 5 Minutes | 116 (3.3%) | 35 (1.4%) |
| 5 to 9 Minutes | 268 (7.5%) | 159 (6.2%) |
| 10 to 14 Minutes | 201 (5.6%) | 240 (9.3%) |
| 15 to 19 Minutes | 144 (4.0%) | 362 (14.0%) |
| 20 to 24 Minutes | 307 (8.6%) | 326 (12.6%) |
| 25 to 29 Minutes | 34 (0.9%) | 36 (1.4%) |
| 30 to 34 Minutes | 466 (13.1%) | 357 (13.8%) |
| 35 to 39 Minutes | 119 (3.3%) | 148 (5.7%) |
| 40 to 44 Minutes | 228 (6.4%) | 94 (3.6%) |
| 45 to 59 Minutes | 825 (23.1%) | 390 (15.1%) |
| 60 to 89 Minutes | 387 (10.8%) | 336 (13.0%) |
| 90 or more Minutes | 472 (13.2%) | 96 (3.7%) |
Time of Departure to Work by Sex in Buckingham County
The most frequent times of departure to work in Buckingham County are 6:00 AM to 6:29 AM (758, 21.2%) for males and 7:00 AM to 7:29 AM (461, 17.9%) for females.
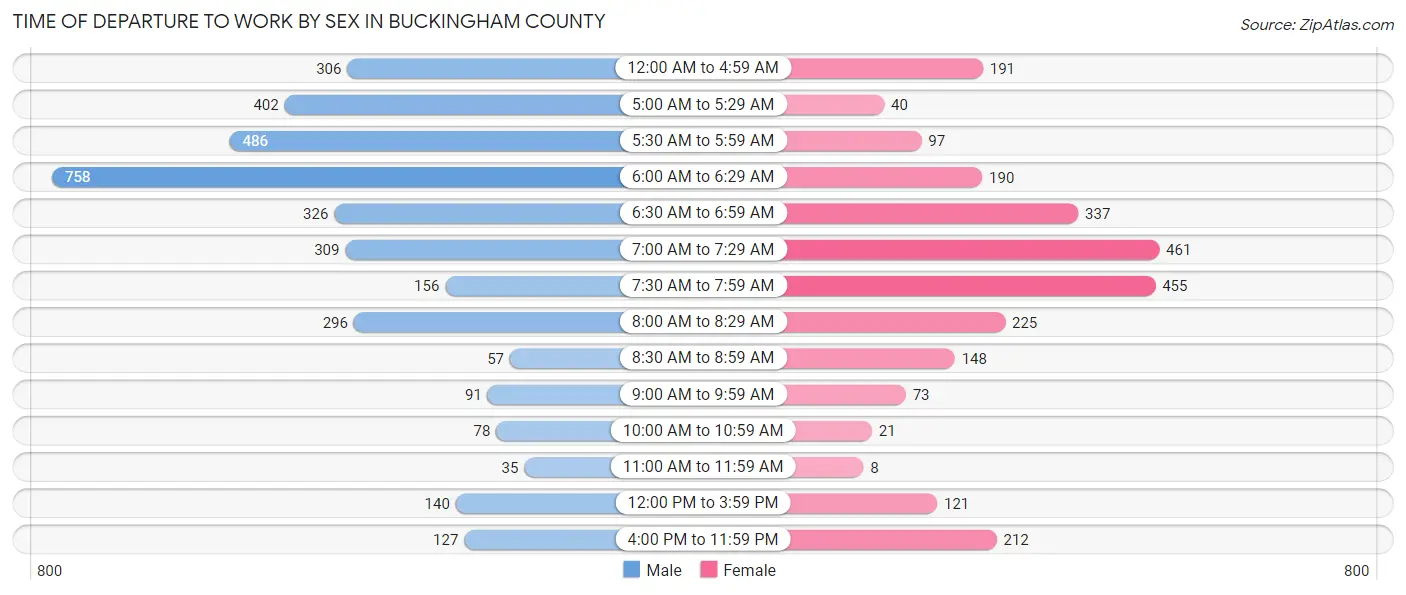
| Time of Departure | Male | Female |
| 12:00 AM to 4:59 AM | 306 (8.6%) | 191 (7.4%) |
| 5:00 AM to 5:29 AM | 402 (11.3%) | 40 (1.5%) |
| 5:30 AM to 5:59 AM | 486 (13.6%) | 97 (3.8%) |
| 6:00 AM to 6:29 AM | 758 (21.2%) | 190 (7.4%) |
| 6:30 AM to 6:59 AM | 326 (9.1%) | 337 (13.1%) |
| 7:00 AM to 7:29 AM | 309 (8.7%) | 461 (17.9%) |
| 7:30 AM to 7:59 AM | 156 (4.4%) | 455 (17.6%) |
| 8:00 AM to 8:29 AM | 296 (8.3%) | 225 (8.7%) |
| 8:30 AM to 8:59 AM | 57 (1.6%) | 148 (5.7%) |
| 9:00 AM to 9:59 AM | 91 (2.5%) | 73 (2.8%) |
| 10:00 AM to 10:59 AM | 78 (2.2%) | 21 (0.8%) |
| 11:00 AM to 11:59 AM | 35 (1.0%) | 8 (0.3%) |
| 12:00 PM to 3:59 PM | 140 (3.9%) | 121 (4.7%) |
| 4:00 PM to 11:59 PM | 127 (3.6%) | 212 (8.2%) |
| Total | 3,567 (100.0%) | 2,579 (100.0%) |
Housing Occupancy in Buckingham County
Occupancy by Ownership in Buckingham County
Of the total 5,898 dwellings in Buckingham County, owner-occupied units account for 4,452 (75.5%), while renter-occupied units make up 1,446 (24.5%).
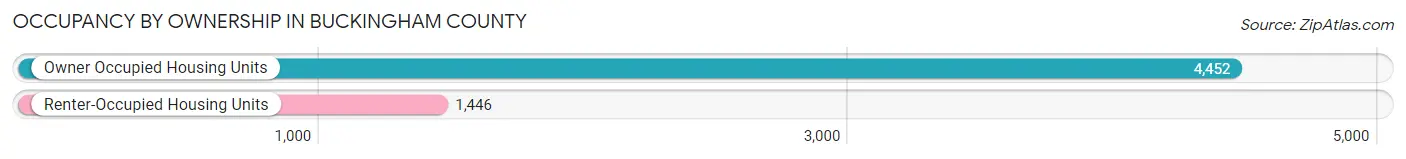
| Occupancy | # Housing Units | % Housing Units |
| Owner Occupied Housing Units | 4,452 | 75.5% |
| Renter-Occupied Housing Units | 1,446 | 24.5% |
| Total Occupied Housing Units | 5,898 | 100.0% |
Occupancy by Household Size in Buckingham County
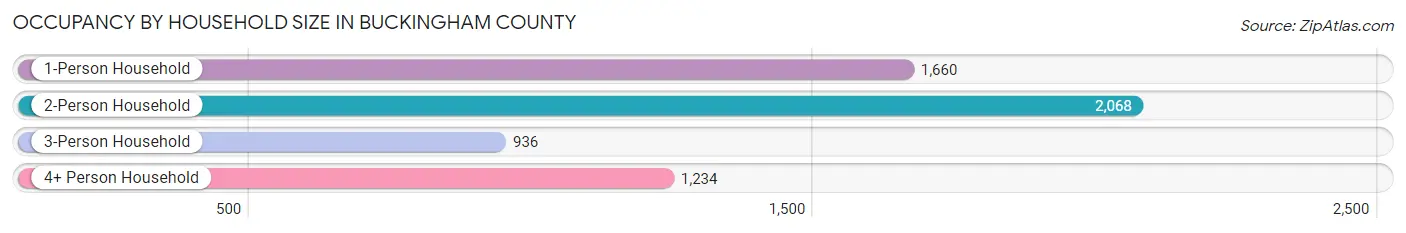
| Household Size | # Housing Units | % Housing Units |
| 1-Person Household | 1,660 | 28.1% |
| 2-Person Household | 2,068 | 35.1% |
| 3-Person Household | 936 | 15.9% |
| 4+ Person Household | 1,234 | 20.9% |
| Total Housing Units | 5,898 | 100.0% |
Occupancy by Ownership by Household Size in Buckingham County
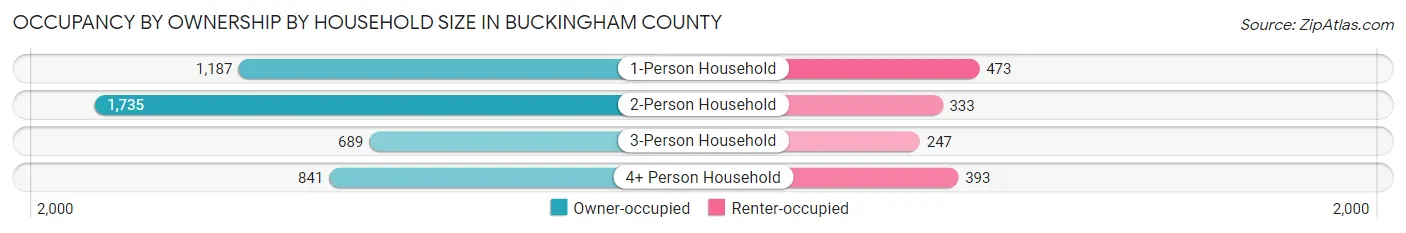
| Household Size | Owner-occupied | Renter-occupied |
| 1-Person Household | 1,187 (71.5%) | 473 (28.5%) |
| 2-Person Household | 1,735 (83.9%) | 333 (16.1%) |
| 3-Person Household | 689 (73.6%) | 247 (26.4%) |
| 4+ Person Household | 841 (68.1%) | 393 (31.9%) |
| Total Housing Units | 4,452 (75.5%) | 1,446 (24.5%) |
Occupancy by Educational Attainment in Buckingham County
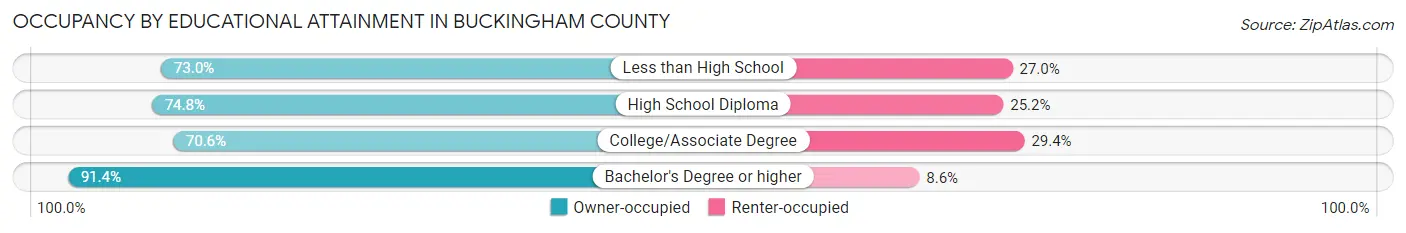
| Household Size | Owner-occupied | Renter-occupied |
| Less than High School | 707 (73.0%) | 262 (27.0%) |
| High School Diploma | 1,688 (74.8%) | 569 (25.2%) |
| College/Associate Degree | 1,309 (70.6%) | 545 (29.4%) |
| Bachelor's Degree or higher | 748 (91.4%) | 70 (8.6%) |
Occupancy by Age of Householder in Buckingham County
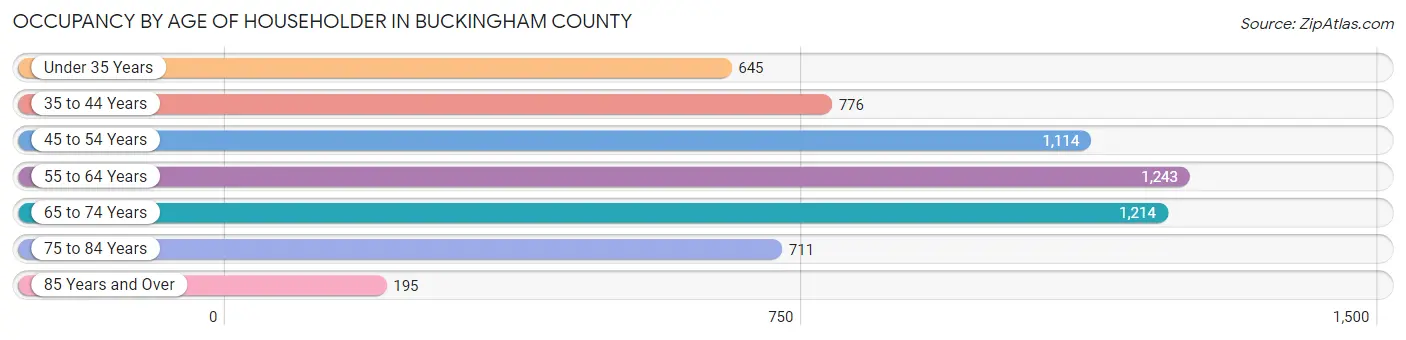
| Age Bracket | # Households | % Households |
| Under 35 Years | 645 | 10.9% |
| 35 to 44 Years | 776 | 13.2% |
| 45 to 54 Years | 1,114 | 18.9% |
| 55 to 64 Years | 1,243 | 21.1% |
| 65 to 74 Years | 1,214 | 20.6% |
| 75 to 84 Years | 711 | 12.0% |
| 85 Years and Over | 195 | 3.3% |
| Total | 5,898 | 100.0% |
Housing Finances in Buckingham County
Median Income by Occupancy in Buckingham County
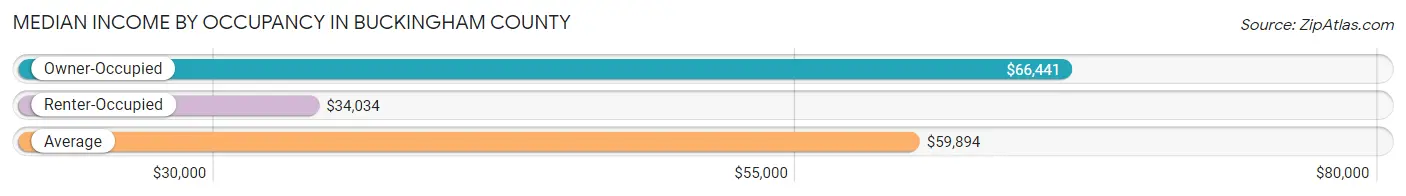
| Occupancy Type | # Households | Median Income |
| Owner-Occupied | 4,452 (75.5%) | $66,441 |
| Renter-Occupied | 1,446 (24.5%) | $34,034 |
| Average | 5,898 (100.0%) | $59,894 |
Occupancy by Householder Income Bracket in Buckingham County
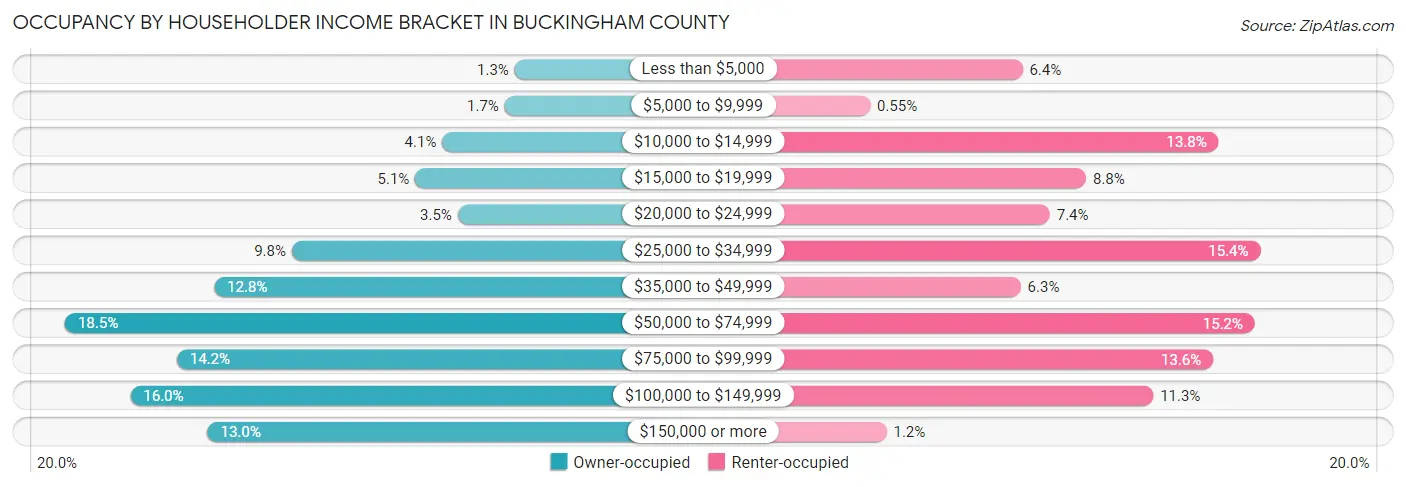
| Income Bracket | Owner-occupied | Renter-occupied |
| Less than $5,000 | 59 (1.3%) | 92 (6.4%) |
| $5,000 to $9,999 | 76 (1.7%) | 8 (0.5%) |
| $10,000 to $14,999 | 182 (4.1%) | 200 (13.8%) |
| $15,000 to $19,999 | 228 (5.1%) | 127 (8.8%) |
| $20,000 to $24,999 | 156 (3.5%) | 107 (7.4%) |
| $25,000 to $34,999 | 437 (9.8%) | 223 (15.4%) |
| $35,000 to $49,999 | 569 (12.8%) | 91 (6.3%) |
| $50,000 to $74,999 | 822 (18.5%) | 220 (15.2%) |
| $75,000 to $99,999 | 632 (14.2%) | 197 (13.6%) |
| $100,000 to $149,999 | 711 (16.0%) | 164 (11.3%) |
| $150,000 or more | 580 (13.0%) | 17 (1.2%) |
| Total | 4,452 (100.0%) | 1,446 (100.0%) |
Monthly Housing Cost Tiers in Buckingham County
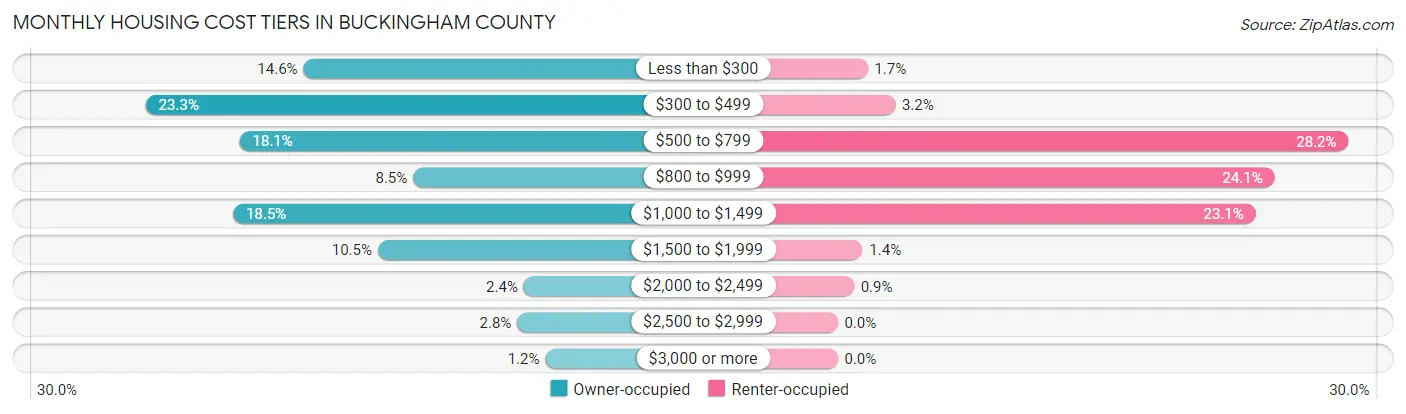
| Monthly Cost | Owner-occupied | Renter-occupied |
| Less than $300 | 650 (14.6%) | 24 (1.7%) |
| $300 to $499 | 1,038 (23.3%) | 46 (3.2%) |
| $500 to $799 | 807 (18.1%) | 408 (28.2%) |
| $800 to $999 | 380 (8.5%) | 349 (24.1%) |
| $1,000 to $1,499 | 823 (18.5%) | 334 (23.1%) |
| $1,500 to $1,999 | 467 (10.5%) | 20 (1.4%) |
| $2,000 to $2,499 | 108 (2.4%) | 13 (0.9%) |
| $2,500 to $2,999 | 124 (2.8%) | 0 (0.0%) |
| $3,000 or more | 55 (1.2%) | 0 (0.0%) |
| Total | 4,452 (100.0%) | 1,446 (100.0%) |
Physical Housing Characteristics in Buckingham County
Housing Structures in Buckingham County
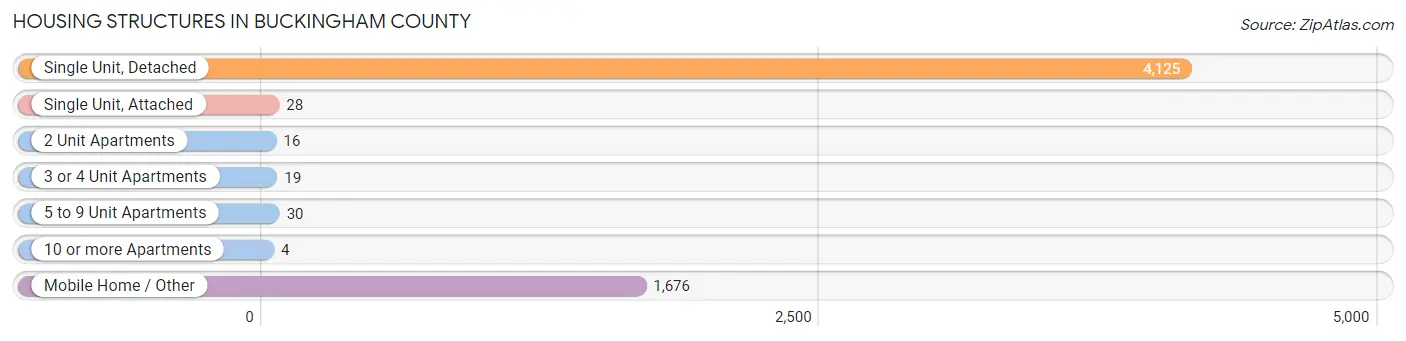
| Structure Type | # Housing Units | % Housing Units |
| Single Unit, Detached | 4,125 | 69.9% |
| Single Unit, Attached | 28 | 0.5% |
| 2 Unit Apartments | 16 | 0.3% |
| 3 or 4 Unit Apartments | 19 | 0.3% |
| 5 to 9 Unit Apartments | 30 | 0.5% |
| 10 or more Apartments | 4 | 0.1% |
| Mobile Home / Other | 1,676 | 28.4% |
| Total | 5,898 | 100.0% |
Housing Structures by Occupancy in Buckingham County
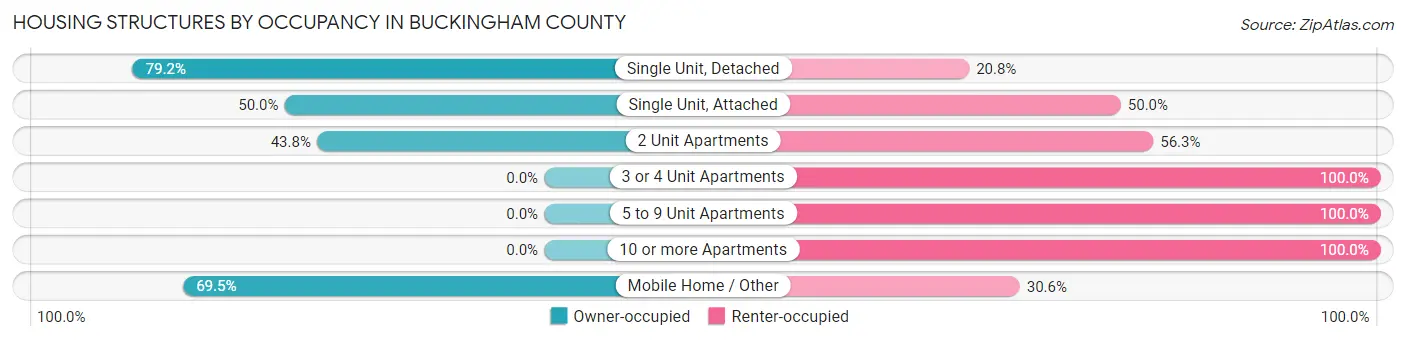
| Structure Type | Owner-occupied | Renter-occupied |
| Single Unit, Detached | 3,267 (79.2%) | 858 (20.8%) |
| Single Unit, Attached | 14 (50.0%) | 14 (50.0%) |
| 2 Unit Apartments | 7 (43.8%) | 9 (56.2%) |
| 3 or 4 Unit Apartments | 0 (0.0%) | 19 (100.0%) |
| 5 to 9 Unit Apartments | 0 (0.0%) | 30 (100.0%) |
| 10 or more Apartments | 0 (0.0%) | 4 (100.0%) |
| Mobile Home / Other | 1,164 (69.5%) | 512 (30.5%) |
| Total | 4,452 (75.5%) | 1,446 (24.5%) |
Housing Structures by Number of Rooms in Buckingham County
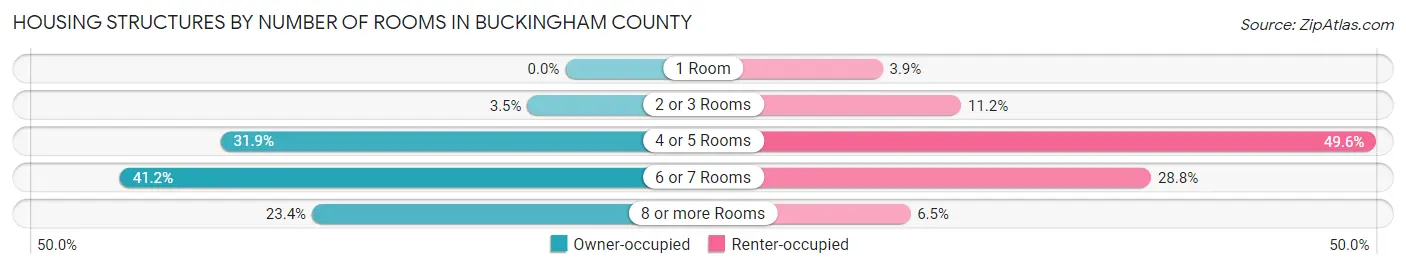
| Number of Rooms | Owner-occupied | Renter-occupied |
| 1 Room | 0 (0.0%) | 57 (3.9%) |
| 2 or 3 Rooms | 156 (3.5%) | 162 (11.2%) |
| 4 or 5 Rooms | 1,419 (31.9%) | 717 (49.6%) |
| 6 or 7 Rooms | 1,834 (41.2%) | 416 (28.8%) |
| 8 or more Rooms | 1,043 (23.4%) | 94 (6.5%) |
| Total | 4,452 (100.0%) | 1,446 (100.0%) |
Housing Structure by Heating Type in Buckingham County
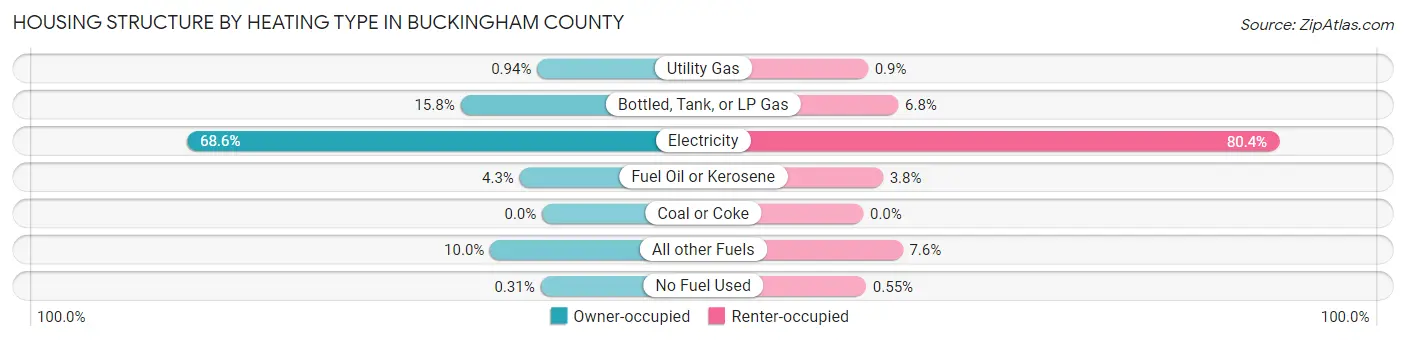
| Heating Type | Owner-occupied | Renter-occupied |
| Utility Gas | 42 (0.9%) | 13 (0.9%) |
| Bottled, Tank, or LP Gas | 702 (15.8%) | 98 (6.8%) |
| Electricity | 3,054 (68.6%) | 1,162 (80.4%) |
| Fuel Oil or Kerosene | 193 (4.3%) | 55 (3.8%) |
| Coal or Coke | 0 (0.0%) | 0 (0.0%) |
| All other Fuels | 447 (10.0%) | 110 (7.6%) |
| No Fuel Used | 14 (0.3%) | 8 (0.5%) |
| Total | 4,452 (100.0%) | 1,446 (100.0%) |
Household Vehicle Usage in Buckingham County
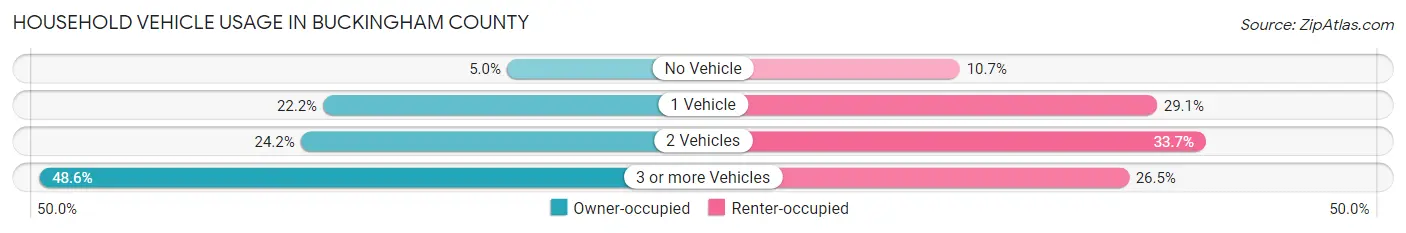
| Vehicles per Household | Owner-occupied | Renter-occupied |
| No Vehicle | 222 (5.0%) | 155 (10.7%) |
| 1 Vehicle | 986 (22.2%) | 421 (29.1%) |
| 2 Vehicles | 1,079 (24.2%) | 487 (33.7%) |
| 3 or more Vehicles | 2,165 (48.6%) | 383 (26.5%) |
| Total | 4,452 (100.0%) | 1,446 (100.0%) |
Real Estate & Mortgages in Buckingham County
Real Estate and Mortgage Overview in Buckingham County
| Characteristic | Without Mortgage | With Mortgage |
| Housing Units | 2,250 | 2,202 |
| Median Property Value | $138,300 | $173,400 |
| Median Household Income | $48,794 | $394 |
| Monthly Housing Costs | $373 | $55 |
| Real Estate Taxes | $763 | $60 |
Property Value by Mortgage Status in Buckingham County
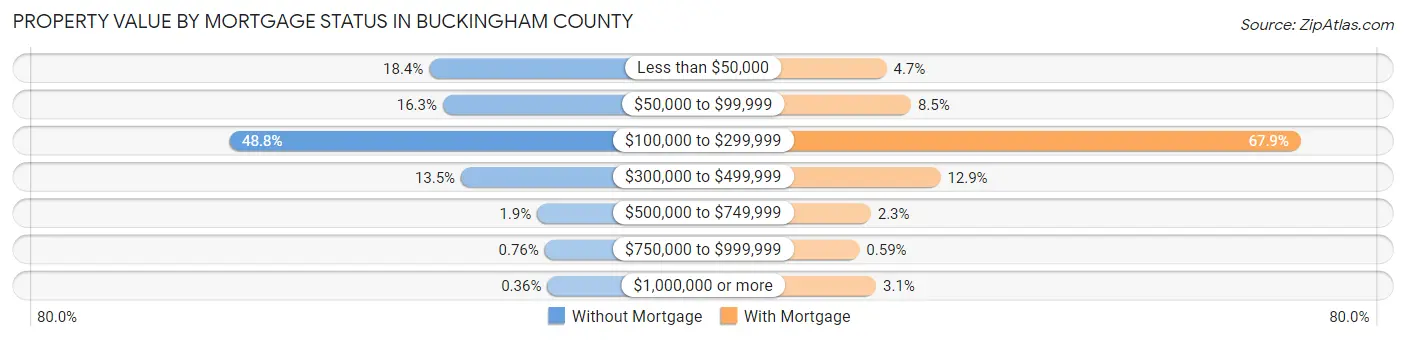
| Property Value | Without Mortgage | With Mortgage |
| Less than $50,000 | 413 (18.4%) | 104 (4.7%) |
| $50,000 to $99,999 | 366 (16.3%) | 186 (8.5%) |
| $100,000 to $299,999 | 1,099 (48.8%) | 1,494 (67.8%) |
| $300,000 to $499,999 | 304 (13.5%) | 285 (12.9%) |
| $500,000 to $749,999 | 43 (1.9%) | 51 (2.3%) |
| $750,000 to $999,999 | 17 (0.8%) | 13 (0.6%) |
| $1,000,000 or more | 8 (0.4%) | 69 (3.1%) |
| Total | 2,250 (100.0%) | 2,202 (100.0%) |
Household Income by Mortgage Status in Buckingham County
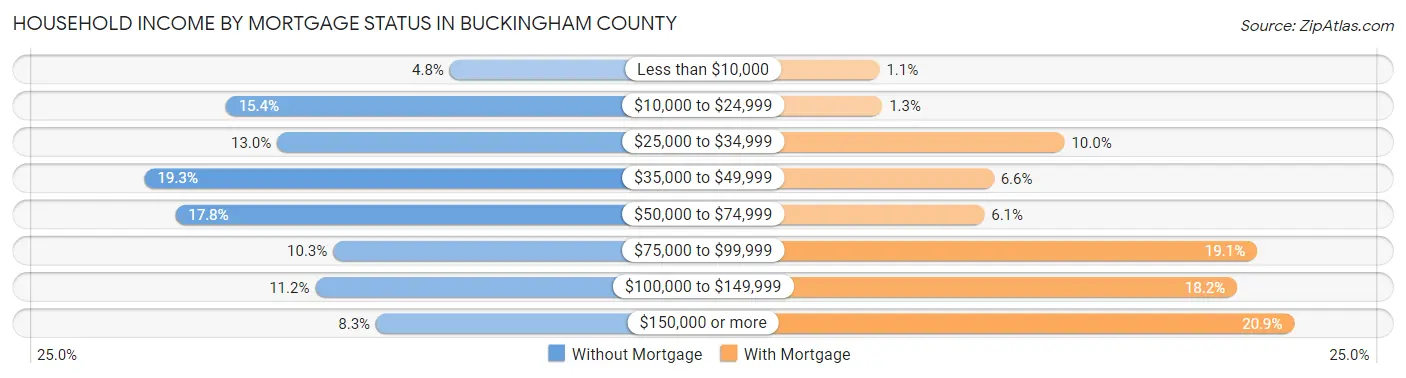
| Household Income | Without Mortgage | With Mortgage |
| Less than $10,000 | 107 (4.8%) | 25 (1.1%) |
| $10,000 to $24,999 | 347 (15.4%) | 28 (1.3%) |
| $25,000 to $34,999 | 292 (13.0%) | 219 (10.0%) |
| $35,000 to $49,999 | 434 (19.3%) | 145 (6.6%) |
| $50,000 to $74,999 | 401 (17.8%) | 135 (6.1%) |
| $75,000 to $99,999 | 232 (10.3%) | 421 (19.1%) |
| $100,000 to $149,999 | 251 (11.2%) | 400 (18.2%) |
| $150,000 or more | 186 (8.3%) | 460 (20.9%) |
| Total | 2,250 (100.0%) | 2,202 (100.0%) |
Property Value to Household Income Ratio in Buckingham County
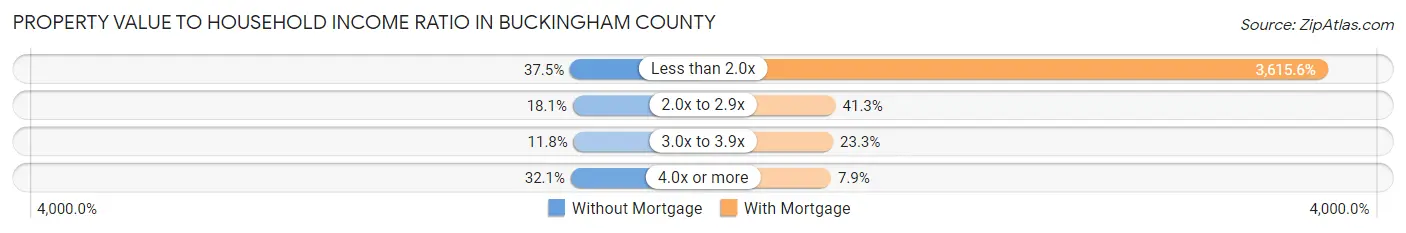
| Value-to-Income Ratio | Without Mortgage | With Mortgage |
| Less than 2.0x | 843 (37.5%) | 79,615 (3,615.6%) |
| 2.0x to 2.9x | 408 (18.1%) | 910 (41.3%) |
| 3.0x to 3.9x | 265 (11.8%) | 513 (23.3%) |
| 4.0x or more | 722 (32.1%) | 173 (7.9%) |
| Total | 2,250 (100.0%) | 2,202 (100.0%) |
Real Estate Taxes by Mortgage Status in Buckingham County
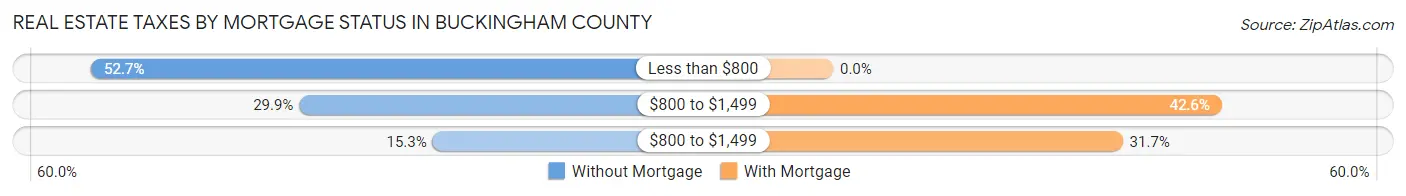
| Property Taxes | Without Mortgage | With Mortgage |
| Less than $800 | 1,186 (52.7%) | 0 (0.0%) |
| $800 to $1,499 | 673 (29.9%) | 938 (42.6%) |
| $800 to $1,499 | 344 (15.3%) | 699 (31.7%) |
| Total | 2,250 (100.0%) | 2,202 (100.0%) |
Health & Disability in Buckingham County
Health Insurance Coverage by Age in Buckingham County
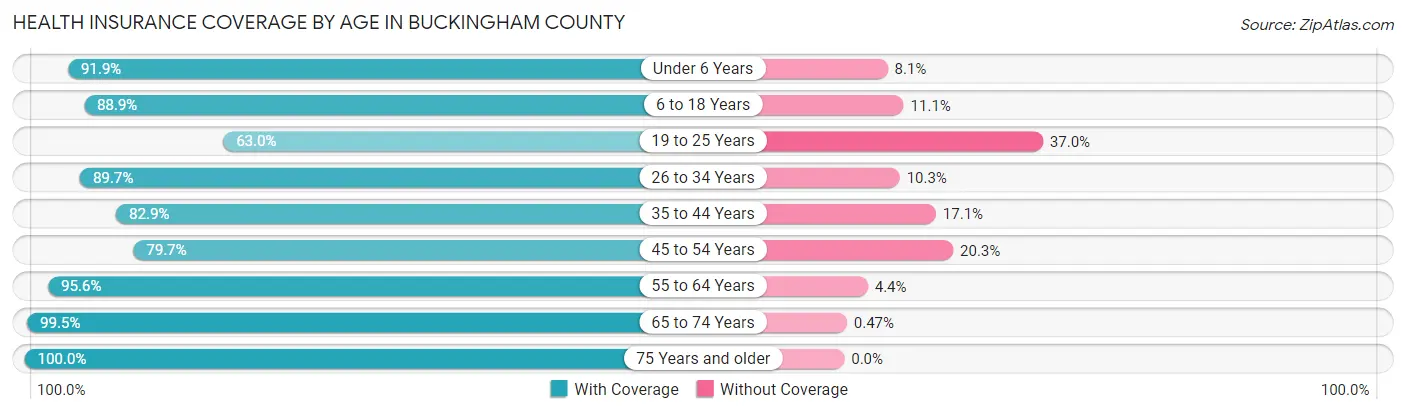
| Age Bracket | With Coverage | Without Coverage |
| Under 6 Years | 933 (91.9%) | 82 (8.1%) |
| 6 to 18 Years | 1,992 (88.9%) | 248 (11.1%) |
| 19 to 25 Years | 600 (63.0%) | 353 (37.0%) |
| 26 to 34 Years | 1,667 (89.7%) | 192 (10.3%) |
| 35 to 44 Years | 1,306 (82.9%) | 269 (17.1%) |
| 45 to 54 Years | 1,544 (79.7%) | 393 (20.3%) |
| 55 to 64 Years | 2,073 (95.6%) | 95 (4.4%) |
| 65 to 74 Years | 1,904 (99.5%) | 9 (0.5%) |
| 75 Years and older | 1,253 (100.0%) | 0 (0.0%) |
| Total | 13,272 (89.0%) | 1,641 (11.0%) |
Health Insurance Coverage by Citizenship Status in Buckingham County
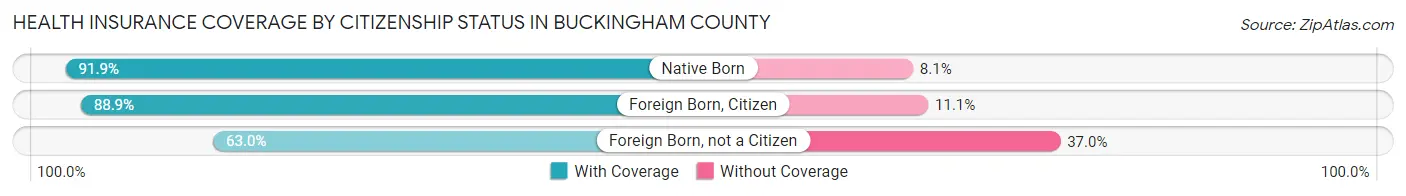
| Citizenship Status | With Coverage | Without Coverage |
| Native Born | 933 (91.9%) | 82 (8.1%) |
| Foreign Born, Citizen | 1,992 (88.9%) | 248 (11.1%) |
| Foreign Born, not a Citizen | 600 (63.0%) | 353 (37.0%) |
Health Insurance Coverage by Household Income in Buckingham County
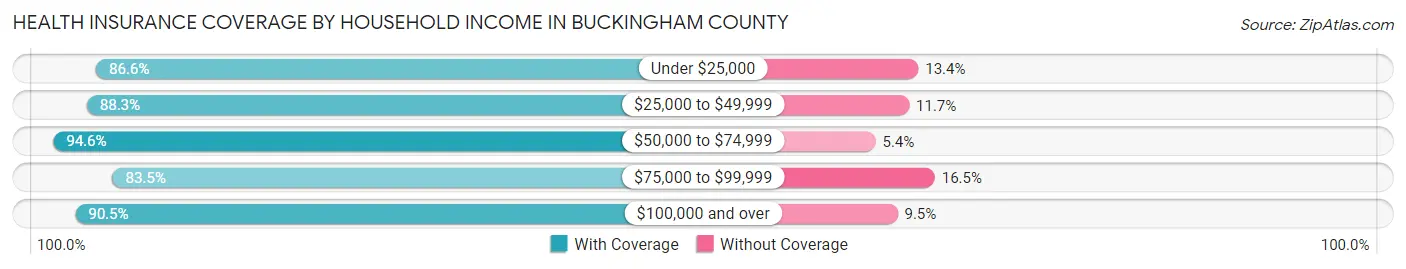
| Household Income | With Coverage | Without Coverage |
| Under $25,000 | 1,854 (86.6%) | 287 (13.4%) |
| $25,000 to $49,999 | 2,339 (88.3%) | 309 (11.7%) |
| $50,000 to $74,999 | 2,421 (94.6%) | 138 (5.4%) |
| $75,000 to $99,999 | 2,224 (83.5%) | 439 (16.5%) |
| $100,000 and over | 4,388 (90.5%) | 461 (9.5%) |
Public vs Private Health Insurance Coverage by Age in Buckingham County
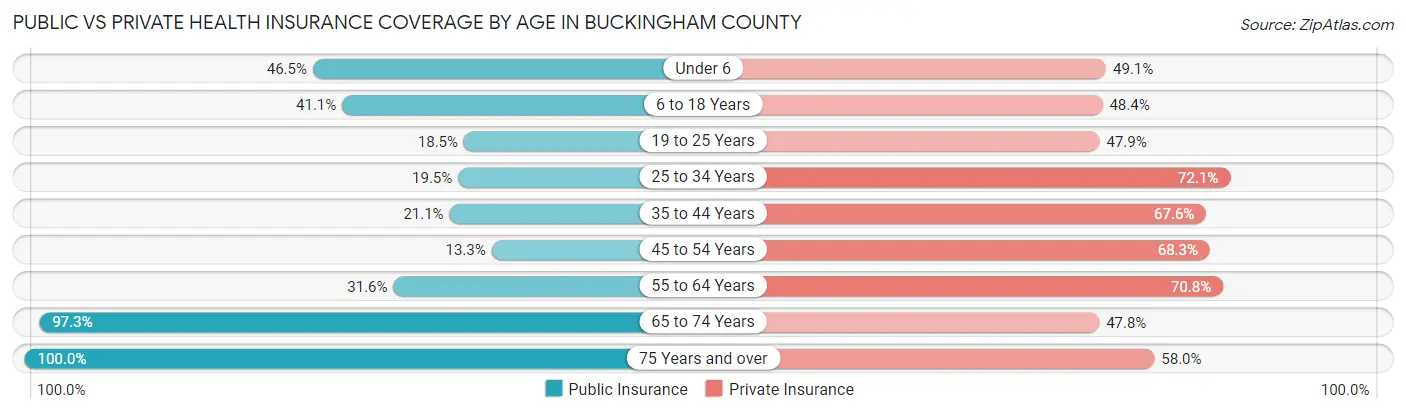
| Age Bracket | Public Insurance | Private Insurance |
| Under 6 | 472 (46.5%) | 498 (49.1%) |
| 6 to 18 Years | 920 (41.1%) | 1,084 (48.4%) |
| 19 to 25 Years | 176 (18.5%) | 456 (47.8%) |
| 25 to 34 Years | 363 (19.5%) | 1,340 (72.1%) |
| 35 to 44 Years | 333 (21.1%) | 1,065 (67.6%) |
| 45 to 54 Years | 258 (13.3%) | 1,323 (68.3%) |
| 55 to 64 Years | 684 (31.6%) | 1,534 (70.8%) |
| 65 to 74 Years | 1,861 (97.3%) | 914 (47.8%) |
| 75 Years and over | 1,253 (100.0%) | 727 (58.0%) |
| Total | 6,320 (42.4%) | 8,941 (60.0%) |
Disability Status by Sex by Age in Buckingham County
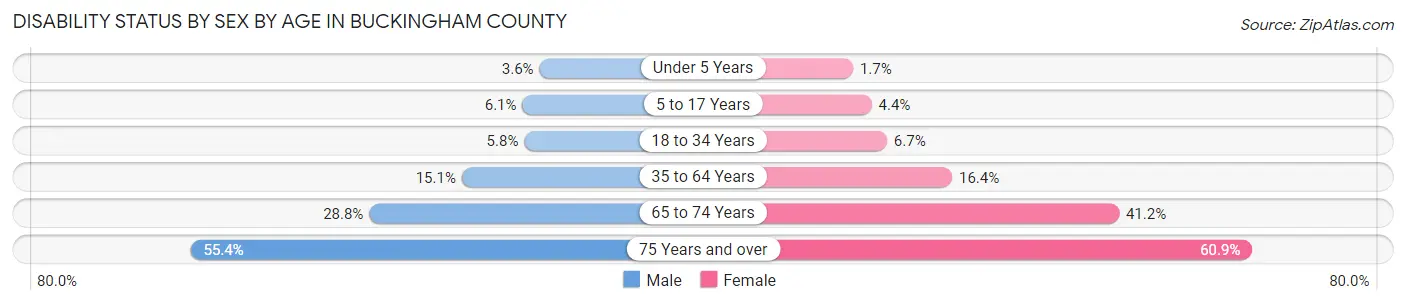
| Age Bracket | Male | Female |
| Under 5 Years | 15 (3.5%) | 6 (1.7%) |
| 5 to 17 Years | 66 (6.1%) | 51 (4.4%) |
| 18 to 34 Years | 98 (5.8%) | 91 (6.7%) |
| 35 to 64 Years | 433 (15.1%) | 460 (16.4%) |
| 65 to 74 Years | 258 (28.8%) | 419 (41.2%) |
| 75 Years and over | 294 (55.4%) | 440 (60.9%) |
Disability Class by Sex by Age in Buckingham County
Disability Class: Hearing Difficulty
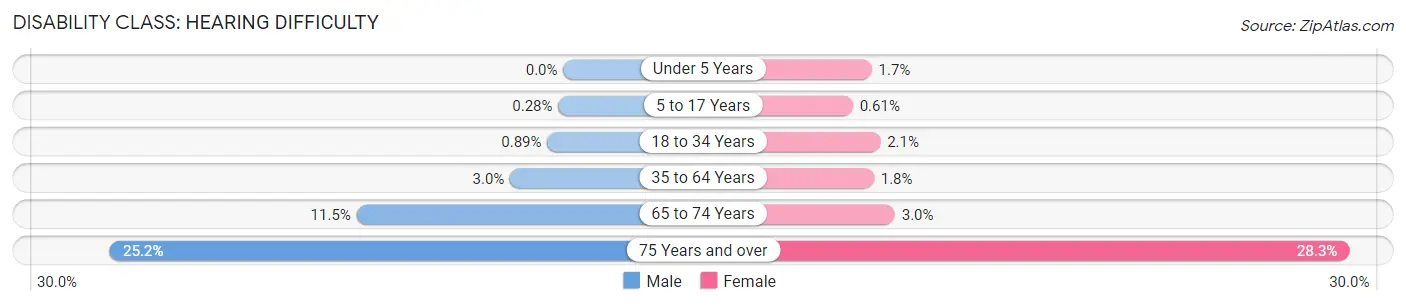
| Age Bracket | Male | Female |
| Under 5 Years | 0 (0.0%) | 6 (1.7%) |
| 5 to 17 Years | 3 (0.3%) | 7 (0.6%) |
| 18 to 34 Years | 15 (0.9%) | 29 (2.1%) |
| 35 to 64 Years | 85 (3.0%) | 50 (1.8%) |
| 65 to 74 Years | 103 (11.5%) | 30 (2.9%) |
| 75 Years and over | 134 (25.2%) | 204 (28.2%) |
Disability Class: Vision Difficulty
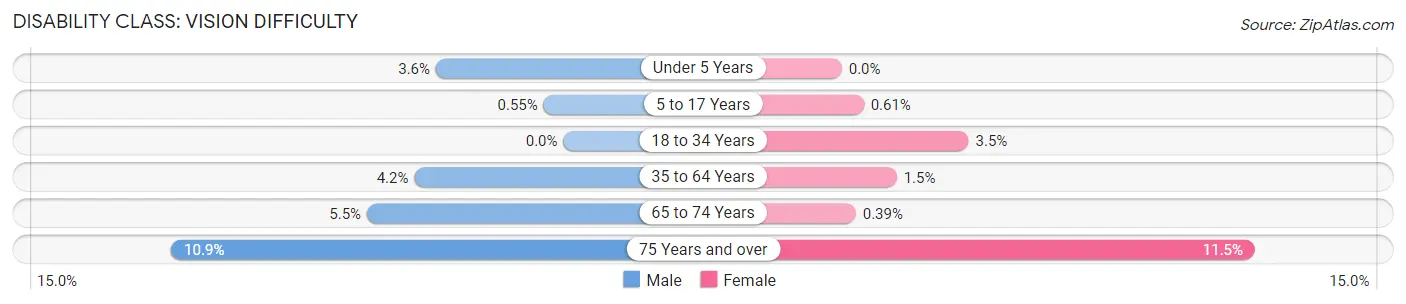
| Age Bracket | Male | Female |
| Under 5 Years | 15 (3.5%) | 0 (0.0%) |
| 5 to 17 Years | 6 (0.5%) | 7 (0.6%) |
| 18 to 34 Years | 0 (0.0%) | 48 (3.5%) |
| 35 to 64 Years | 119 (4.2%) | 43 (1.5%) |
| 65 to 74 Years | 49 (5.5%) | 4 (0.4%) |
| 75 Years and over | 58 (10.9%) | 83 (11.5%) |
Disability Class: Cognitive Difficulty
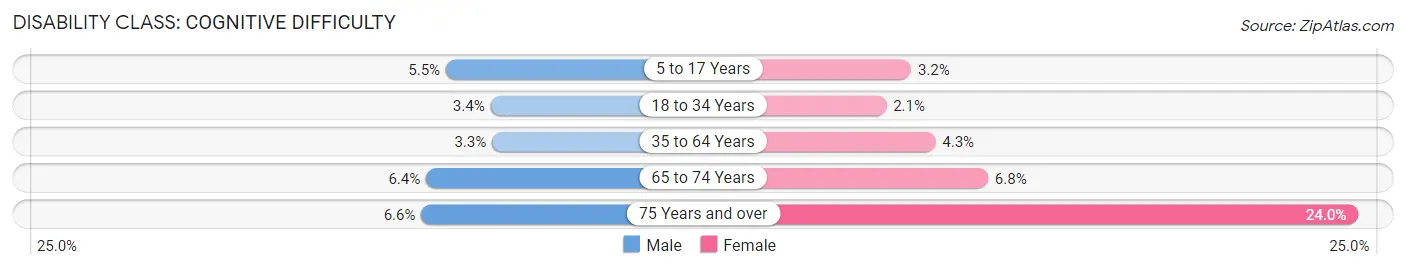
| Age Bracket | Male | Female |
| 5 to 17 Years | 59 (5.4%) | 37 (3.2%) |
| 18 to 34 Years | 57 (3.4%) | 28 (2.1%) |
| 35 to 64 Years | 95 (3.3%) | 122 (4.3%) |
| 65 to 74 Years | 57 (6.4%) | 69 (6.8%) |
| 75 Years and over | 35 (6.6%) | 173 (24.0%) |
Disability Class: Ambulatory Difficulty
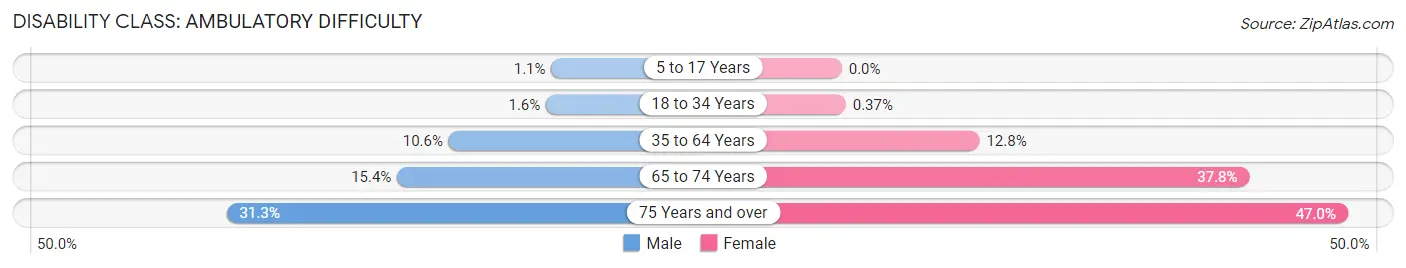
| Age Bracket | Male | Female |
| 5 to 17 Years | 12 (1.1%) | 0 (0.0%) |
| 18 to 34 Years | 27 (1.6%) | 5 (0.4%) |
| 35 to 64 Years | 305 (10.6%) | 359 (12.8%) |
| 65 to 74 Years | 138 (15.4%) | 385 (37.8%) |
| 75 Years and over | 166 (31.3%) | 339 (46.9%) |
Disability Class: Self-Care Difficulty
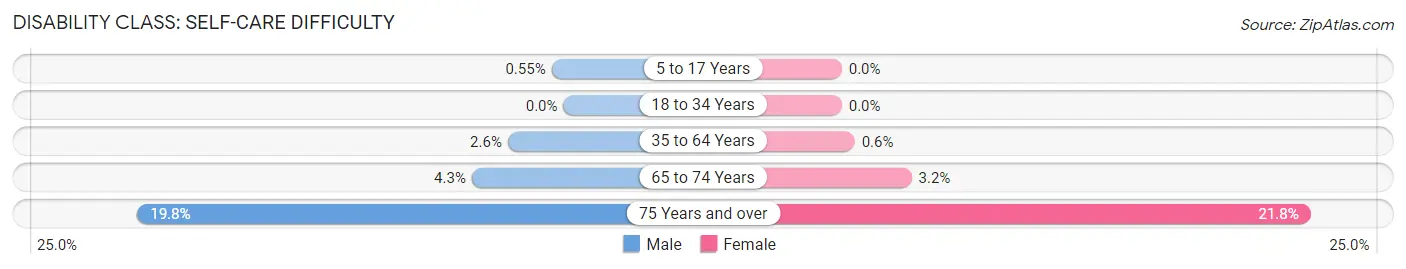
| Age Bracket | Male | Female |
| 5 to 17 Years | 6 (0.5%) | 0 (0.0%) |
| 18 to 34 Years | 0 (0.0%) | 0 (0.0%) |
| 35 to 64 Years | 74 (2.6%) | 17 (0.6%) |
| 65 to 74 Years | 38 (4.3%) | 33 (3.2%) |
| 75 Years and over | 105 (19.8%) | 157 (21.7%) |
Technology Access in Buckingham County
Computing Device Access in Buckingham County
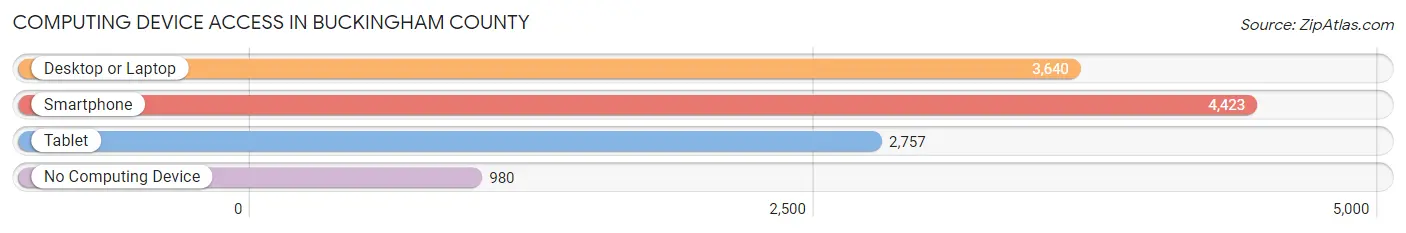
| Device Type | # Households | % Households |
| Desktop or Laptop | 3,640 | 61.7% |
| Smartphone | 4,423 | 75.0% |
| Tablet | 2,757 | 46.7% |
| No Computing Device | 980 | 16.6% |
| Total | 5,898 | 100.0% |
Internet Access in Buckingham County
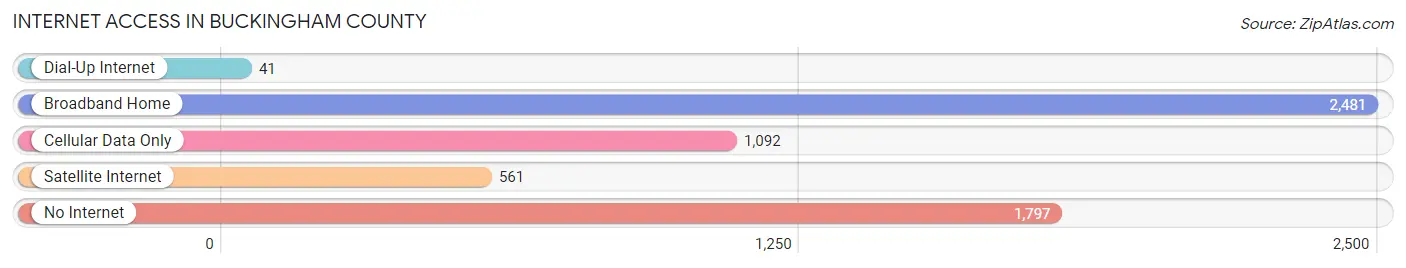
| Internet Type | # Households | % Households |
| Dial-Up Internet | 41 | 0.7% |
| Broadband Home | 2,481 | 42.1% |
| Cellular Data Only | 1,092 | 18.5% |
| Satellite Internet | 561 | 9.5% |
| No Internet | 1,797 | 30.5% |
| Total | 5,898 | 100.0% |
Buckingham County Summary
Buckingham County, Virginia is located in the central part of the state, and is part of the Piedmont region. It is bordered by Albemarle County to the north, Appomattox County to the east, Prince Edward County to the south, and Fluvanna County to the west. The county seat is the town of Buckingham, and the county is home to a population of 17,146 people, according to the 2020 census.
History
Buckingham County was formed in 1761 from the eastern part of Albemarle County. It was named for the Duke of Buckingham, who was a prominent figure in the court of King George III. The county was originally part of the vast territory of the Powhatan Confederacy, and was home to several Native American tribes, including the Monacan, the Manahoac, and the Saponi.
The county was the site of several battles during the American Revolution, including the Battle of Trevilian Station in 1864. During the Civil War, the county was the site of several skirmishes, including the Battle of Buckingham Courthouse in 1864.
Geography
Buckingham County is located in the Piedmont region of Virginia, and is characterized by rolling hills and valleys. The county is drained by the James River, which forms its northern border. The Appomattox River forms the eastern border, and the James River and Kanawha Canal form the western border. The county is home to several state parks, including James River State Park, Twin Lakes State Park, and Bear Creek Lake State Park.
Economy
Buckingham County is largely rural, and the economy is largely based on agriculture. The county is home to several large farms, and the main crops grown are corn, soybeans, wheat, and hay. The county is also home to several small businesses, including restaurants, retail stores, and service providers.
The county is home to several large employers, including the University of Virginia, the Virginia Department of Transportation, and the Virginia Department of Corrections. The county is also home to several manufacturing companies, including the Buckingham County Manufacturing Company, which produces furniture and other wood products.
Demographics
According to the 2020 census, Buckingham County has a population of 17,146 people. The population is largely white (87.3%), with African Americans making up 8.2% of the population, and Hispanics making up 2.3%. The median household income is $50,945, and the median home value is $179,400.
The county is home to several small towns, including Buckingham, Dillwyn, and New Canton. The county seat is the town of Buckingham, which is home to a population of 1,845 people. The town is home to several historic sites, including the Buckingham Courthouse, which was built in 1762.
Conclusion
Buckingham County, Virginia is a rural county located in the Piedmont region of the state. It is home to a population of 17,146 people, and is largely white. The economy is largely based on agriculture, and the county is home to several large employers. The county is home to several small towns, and the county seat is the town of Buckingham.
Common Questions
What is Per Capita Income in Buckingham County?
Per Capita income in Buckingham County is $27,139.
What is the Median Family Income in Buckingham County?
Median Family Income in Buckingham County is $76,351.
What is the Median Household income in Buckingham County?
Median Household Income in Buckingham County is $59,894.
What is Income or Wage Gap in Buckingham County?
Income or Wage Gap in Buckingham County is 13.2%.
Women in Buckingham County earn 86.8 cents for every dollar earned by a man.
What is Family Income Deficit in Buckingham County?
Family Income Deficit in Buckingham County is $9,173.
Families that are below poverty line in Buckingham County earn $9,173 less on average than the poverty threshold level.
What is Inequality or Gini Index in Buckingham County?
Inequality or Gini Index in Buckingham County is 0.43.
What is the Total Population of Buckingham County?
Total Population of Buckingham County is 16,869.
What is the Total Male Population of Buckingham County?
Total Male Population of Buckingham County is 9,405.
What is the Total Female Population of Buckingham County?
Total Female Population of Buckingham County is 7,464.
What is the Ratio of Males per 100 Females in Buckingham County?
There are 126.00 Males per 100 Females in Buckingham County.
What is the Ratio of Females per 100 Males in Buckingham County?
There are 79.36 Females per 100 Males in Buckingham County.
What is the Median Population Age in Buckingham County?
Median Population Age in Buckingham County is 43.3 Years.
What is the Average Family Size in Buckingham County
Average Family Size in Buckingham County is 3.1 People.
What is the Average Household Size in Buckingham County
Average Household Size in Buckingham County is 2.5 People.
How Large is the Labor Force in Buckingham County?
There are 7,160 People in the Labor Forcein in Buckingham County.
What is the Percentage of People in the Labor Force in Buckingham County?
50.5% of People are in the Labor Force in Buckingham County.
What is the Unemployment Rate in Buckingham County?
Unemployment Rate in Buckingham County is 5.0%.