Brunswick County, VA Map & Demographics
Brunswick County Overview
$26,491
PER CAPITA INCOME
$59,133
AVG FAMILY INCOME
$52,678
AVG HOUSEHOLD INCOME
33.3%
WAGE / INCOME GAP [ % ]
66.7¢/ $1
WAGE / INCOME GAP [ $ ]
$11,130
FAMILY INCOME DEFICIT
0.43
INEQUALITY / GINI INDEX
15,965
TOTAL POPULATION
8,513
MALE POPULATION
7,452
FEMALE POPULATION
114.24
MALES / 100 FEMALES
87.54
FEMALES / 100 MALES
44.6
MEDIAN AGE
2.7
AVG FAMILY SIZE
2.2
AVG HOUSEHOLD SIZE
6,836
LABOR FORCE [ PEOPLE ]
50.0%
PERCENT IN LABOR FORCE
5.2%
UNEMPLOYMENT RATE
Income in Brunswick County
Income Overview in Brunswick County
Per Capita Income in Brunswick County is $26,491, while median incomes of families and households are $59,133 and $52,678 respectively.
| Characteristic | Number | Measure |
| Per Capita Income | 15,965 | $26,491 |
| Median Family Income | 3,852 | $59,133 |
| Mean Family Income | 3,852 | $73,739 |
| Median Household Income | 6,165 | $52,678 |
| Mean Household Income | 6,165 | $67,794 |
| Income Deficit | 3,852 | $11,130 |
| Wage / Income Gap (%) | 15,965 | 33.35% |
| Wage / Income Gap ($) | 15,965 | 66.65¢ per $1 |
| Gini / Inequality Index | 15,965 | 0.43 |
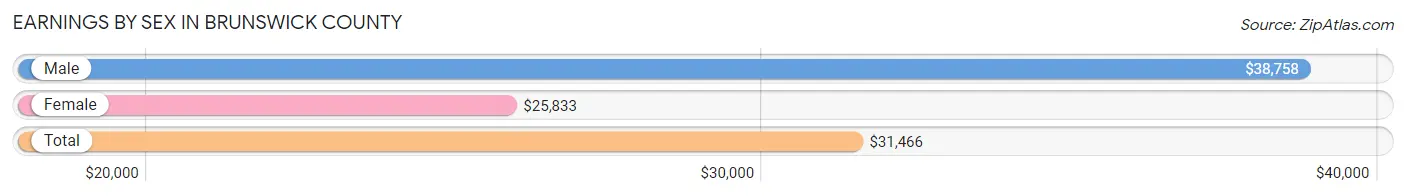
Earnings by Sex in Brunswick County
Average Earnings in Brunswick County are $31,466, $38,758 for men and $25,833 for women, a difference of 33.4%.
| Sex | Number | Average Earnings |
| Male | 3,813 (50.9%) | $38,758 |
| Female | 3,678 (49.1%) | $25,833 |
| Total | 7,491 (100.0%) | $31,466 |
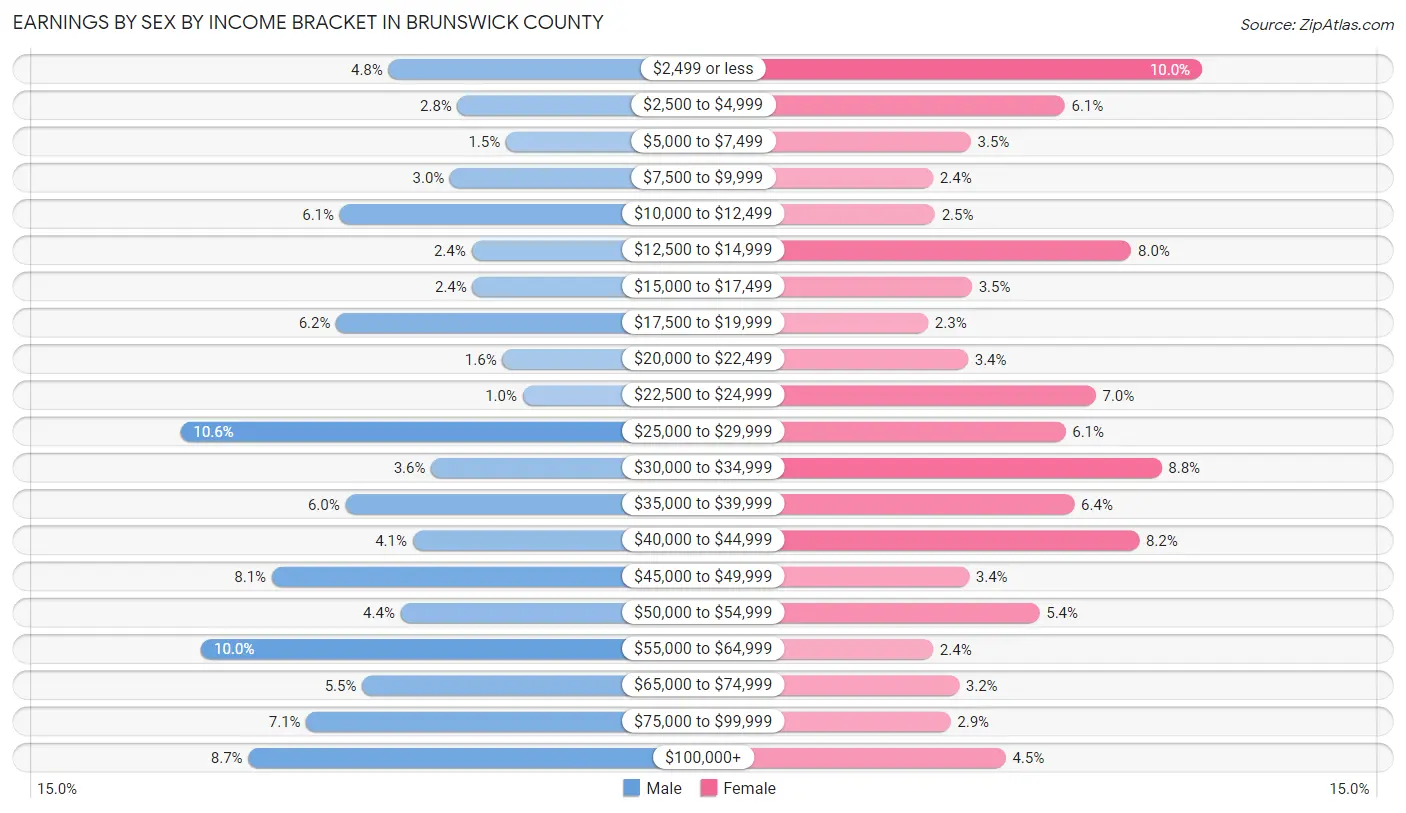
Earnings by Sex by Income Bracket in Brunswick County
The most common earnings brackets in Brunswick County are $25,000 to $29,999 for men (405 | 10.6%) and $2,499 or less for women (367 | 10.0%).
| Income | Male | Female |
| $2,499 or less | 182 (4.8%) | 367 (10.0%) |
| $2,500 to $4,999 | 108 (2.8%) | 225 (6.1%) |
| $5,000 to $7,499 | 56 (1.5%) | 128 (3.5%) |
| $7,500 to $9,999 | 116 (3.0%) | 89 (2.4%) |
| $10,000 to $12,499 | 234 (6.1%) | 91 (2.5%) |
| $12,500 to $14,999 | 93 (2.4%) | 294 (8.0%) |
| $15,000 to $17,499 | 92 (2.4%) | 129 (3.5%) |
| $17,500 to $19,999 | 238 (6.2%) | 84 (2.3%) |
| $20,000 to $22,499 | 60 (1.6%) | 125 (3.4%) |
| $22,500 to $24,999 | 38 (1.0%) | 257 (7.0%) |
| $25,000 to $29,999 | 405 (10.6%) | 226 (6.1%) |
| $30,000 to $34,999 | 136 (3.6%) | 325 (8.8%) |
| $35,000 to $39,999 | 228 (6.0%) | 235 (6.4%) |
| $40,000 to $44,999 | 156 (4.1%) | 302 (8.2%) |
| $45,000 to $49,999 | 307 (8.1%) | 126 (3.4%) |
| $50,000 to $54,999 | 169 (4.4%) | 199 (5.4%) |
| $55,000 to $64,999 | 383 (10.0%) | 89 (2.4%) |
| $65,000 to $74,999 | 210 (5.5%) | 116 (3.2%) |
| $75,000 to $99,999 | 270 (7.1%) | 107 (2.9%) |
| $100,000+ | 332 (8.7%) | 164 (4.5%) |
| Total | 3,813 (100.0%) | 3,678 (100.0%) |
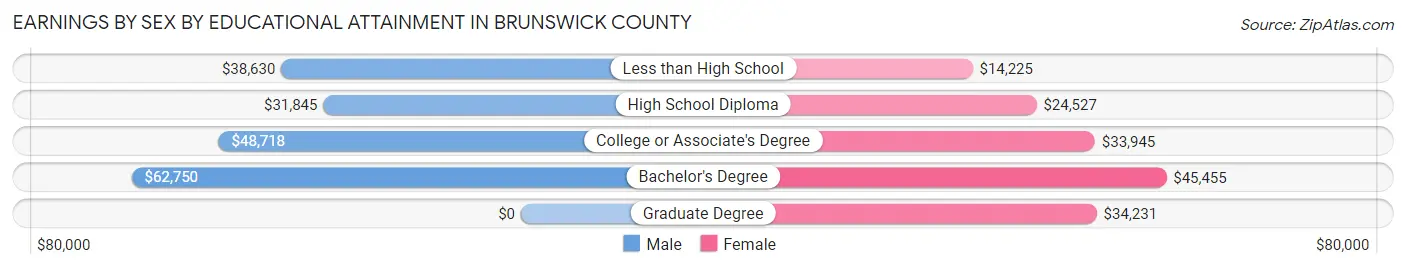
Earnings by Sex by Educational Attainment in Brunswick County
Average earnings in Brunswick County are $46,407 for men and $32,558 for women, a difference of 29.8%. Men with an educational attainment of bachelor's degree enjoy the highest average annual earnings of $62,750, while those with high school diploma education earn the least with $31,845. Women with an educational attainment of bachelor's degree earn the most with the average annual earnings of $45,455, while those with less than high school education have the smallest earnings of $14,225.
| Educational Attainment | Male Income | Female Income |
| Less than High School | $38,630 | $14,225 |
| High School Diploma | $31,845 | $24,527 |
| College or Associate's Degree | $48,718 | $33,945 |
| Bachelor's Degree | $62,750 | $45,455 |
| Graduate Degree | - | - |
| Total | $46,407 | $32,558 |
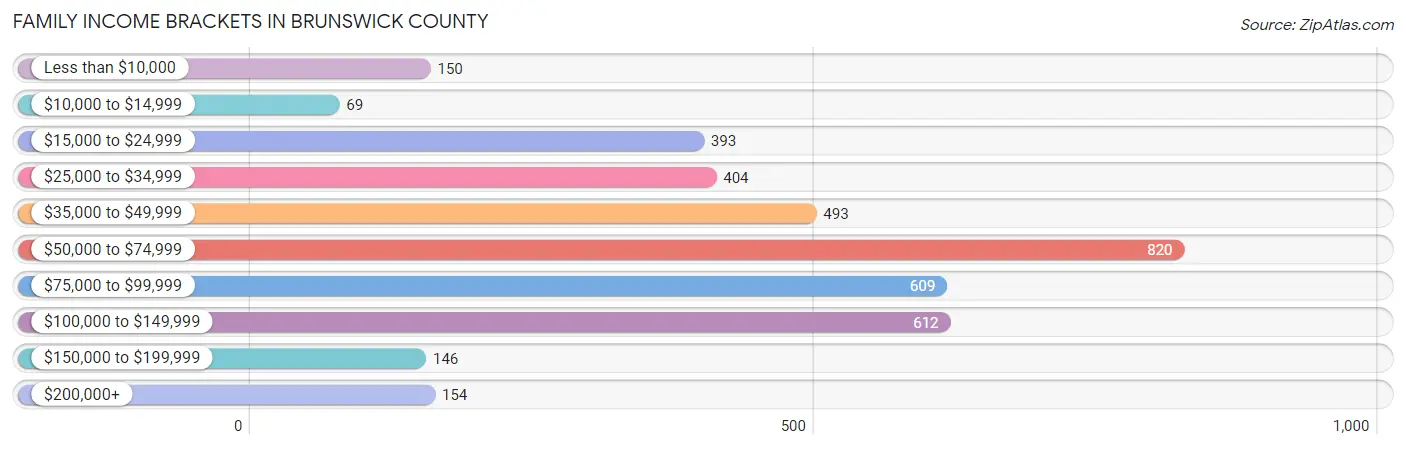
Family Income in Brunswick County
Family Income Brackets in Brunswick County
According to the Brunswick County family income data, there are 820 families falling into the $50,000 to $74,999 income range, which is the most common income bracket and makes up 21.3% of all families. Conversely, the $10,000 to $14,999 income bracket is the least frequent group with only 69 families (1.8%) belonging to this category.
| Income Bracket | # Families | % Families |
| Less than $10,000 | 150 | 3.9% |
| $10,000 to $14,999 | 69 | 1.8% |
| $15,000 to $24,999 | 393 | 10.2% |
| $25,000 to $34,999 | 404 | 10.5% |
| $35,000 to $49,999 | 493 | 12.8% |
| $50,000 to $74,999 | 820 | 21.3% |
| $75,000 to $99,999 | 609 | 15.8% |
| $100,000 to $149,999 | 612 | 15.9% |
| $150,000 to $199,999 | 146 | 3.8% |
| $200,000+ | 154 | 4.0% |
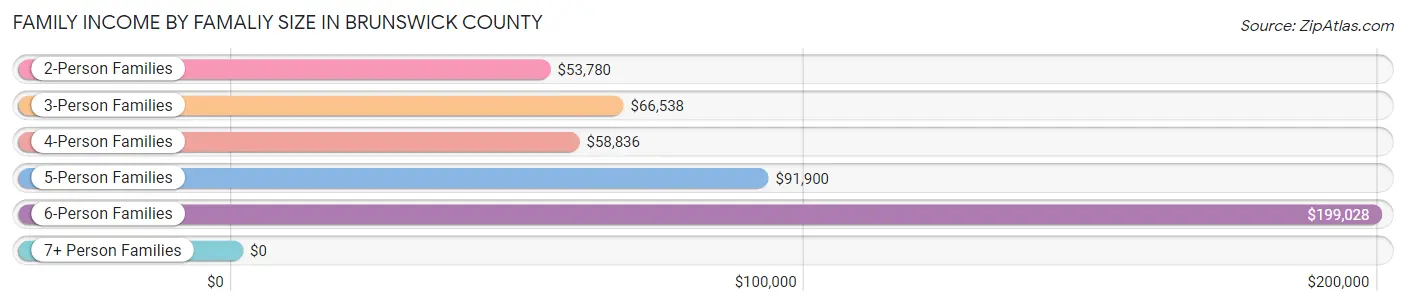
Family Income by Famaliy Size in Brunswick County
6-person families (60 | 1.6%) account for the highest median family income in Brunswick County with $199,028 per family, while 6-person families (60 | 1.6%) have the highest median income of $33,171 per family member.
| Income Bracket | # Families | Median Income |
| 2-Person Families | 1,971 (51.2%) | $53,780 |
| 3-Person Families | 880 (22.9%) | $66,538 |
| 4-Person Families | 510 (13.2%) | $58,836 |
| 5-Person Families | 408 (10.6%) | $91,900 |
| 6-Person Families | 60 (1.6%) | $199,028 |
| 7+ Person Families | 23 (0.6%) | $0 |
| Total | 3,852 (100.0%) | $59,133 |
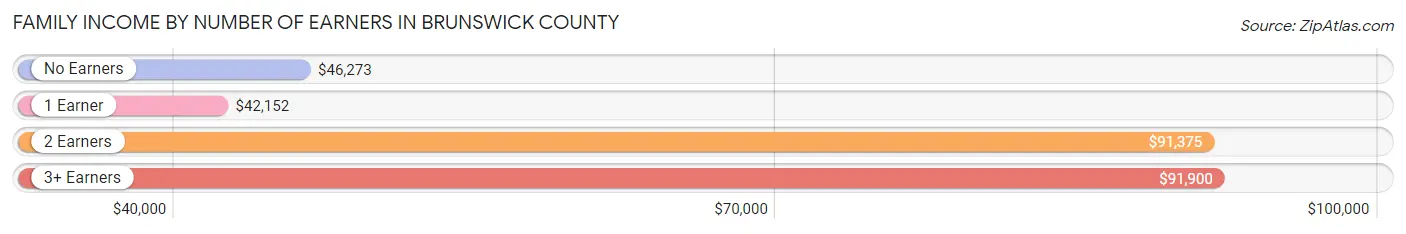
Family Income by Number of Earners in Brunswick County
The median family income in Brunswick County is $59,133, with families comprising 3+ earners (348) having the highest median family income of $91,900, while families with 1 earner (1,461) have the lowest median family income of $42,152, accounting for 9.0% and 37.9% of families, respectively.
| Number of Earners | # Families | Median Income |
| No Earners | 770 (20.0%) | $46,273 |
| 1 Earner | 1,461 (37.9%) | $42,152 |
| 2 Earners | 1,273 (33.1%) | $91,375 |
| 3+ Earners | 348 (9.0%) | $91,900 |
| Total | 3,852 (100.0%) | $59,133 |
Household Income in Brunswick County
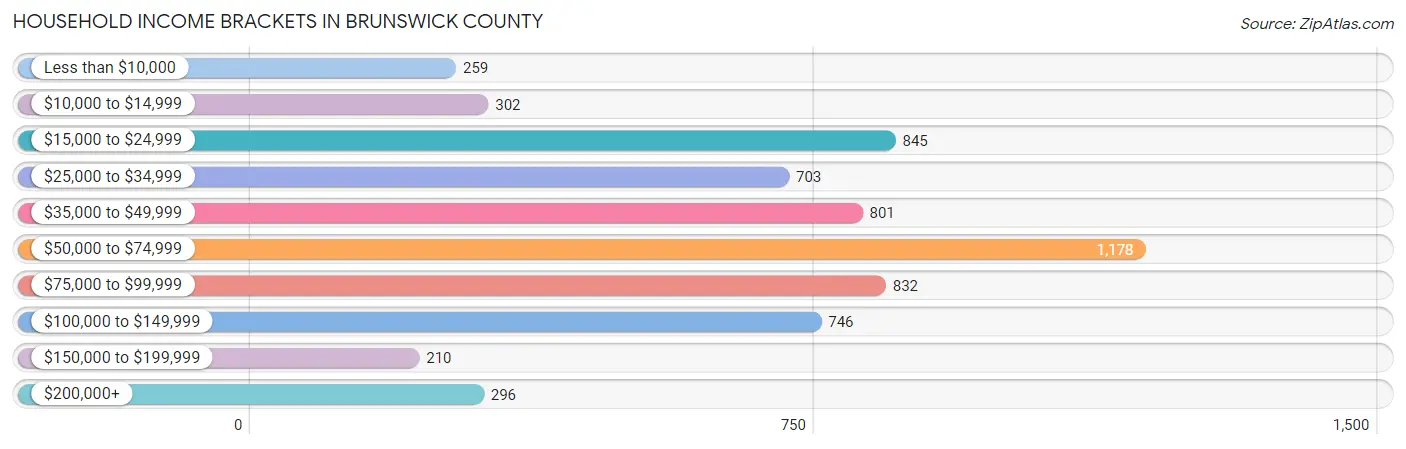
Household Income Brackets in Brunswick County
With 1,178 households falling in the category, the $50,000 to $74,999 income range is the most frequent in Brunswick County, accounting for 19.1% of all households. In contrast, only 210 households (3.4%) fall into the $150,000 to $199,999 income bracket, making it the least populous group.
| Income Bracket | # Households | % Households |
| Less than $10,000 | 259 | 4.2% |
| $10,000 to $14,999 | 302 | 4.9% |
| $15,000 to $24,999 | 845 | 13.7% |
| $25,000 to $34,999 | 703 | 11.4% |
| $35,000 to $49,999 | 801 | 13.0% |
| $50,000 to $74,999 | 1,178 | 19.1% |
| $75,000 to $99,999 | 832 | 13.5% |
| $100,000 to $149,999 | 746 | 12.1% |
| $150,000 to $199,999 | 210 | 3.4% |
| $200,000+ | 296 | 4.8% |
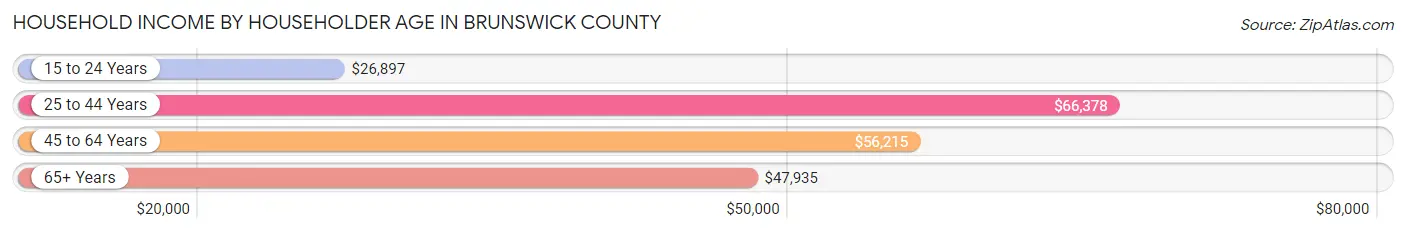
Household Income by Householder Age in Brunswick County
The median household income in Brunswick County is $52,678, with the highest median household income of $66,378 found in the 25 to 44 years age bracket for the primary householder. A total of 1,187 households (19.3%) fall into this category. Meanwhile, the 15 to 24 years age bracket for the primary householder has the lowest median household income of $26,897, with 207 households (3.4%) in this group.
| Income Bracket | # Households | Median Income |
| 15 to 24 Years | 207 (3.4%) | $26,897 |
| 25 to 44 Years | 1,187 (19.3%) | $66,378 |
| 45 to 64 Years | 2,437 (39.5%) | $56,215 |
| 65+ Years | 2,334 (37.9%) | $47,935 |
| Total | 6,165 (100.0%) | $52,678 |
Poverty in Brunswick County
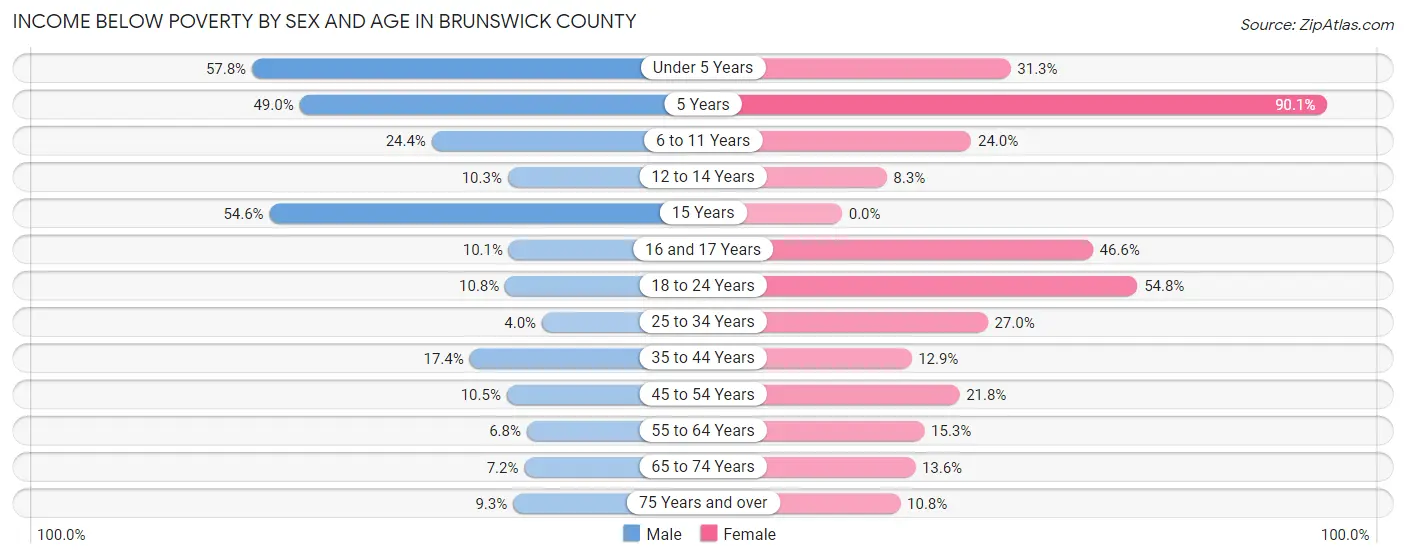
Income Below Poverty by Sex and Age in Brunswick County
With 12.7% poverty level for males and 21.2% for females among the residents of Brunswick County, under 5 year old males and 5 year old females are the most vulnerable to poverty, with 189 males (57.8%) and 91 females (90.1%) in their respective age groups living below the poverty level.
| Age Bracket | Male | Female |
| Under 5 Years | 189 (57.8%) | 102 (31.3%) |
| 5 Years | 24 (49.0%) | 91 (90.1%) |
| 6 to 11 Years | 77 (24.4%) | 125 (24.0%) |
| 12 to 14 Years | 32 (10.3%) | 14 (8.3%) |
| 15 Years | 36 (54.5%) | 0 (0.0%) |
| 16 and 17 Years | 8 (10.1%) | 54 (46.6%) |
| 18 to 24 Years | 73 (10.8%) | 244 (54.8%) |
| 25 to 34 Years | 38 (4.0%) | 179 (27.0%) |
| 35 to 44 Years | 74 (17.4%) | 93 (12.9%) |
| 45 to 54 Years | 87 (10.5%) | 204 (21.8%) |
| 55 to 64 Years | 64 (6.8%) | 185 (15.3%) |
| 65 to 74 Years | 65 (7.2%) | 143 (13.6%) |
| 75 Years and over | 61 (9.3%) | 84 (10.8%) |
| Total | 828 (12.7%) | 1,518 (21.2%) |
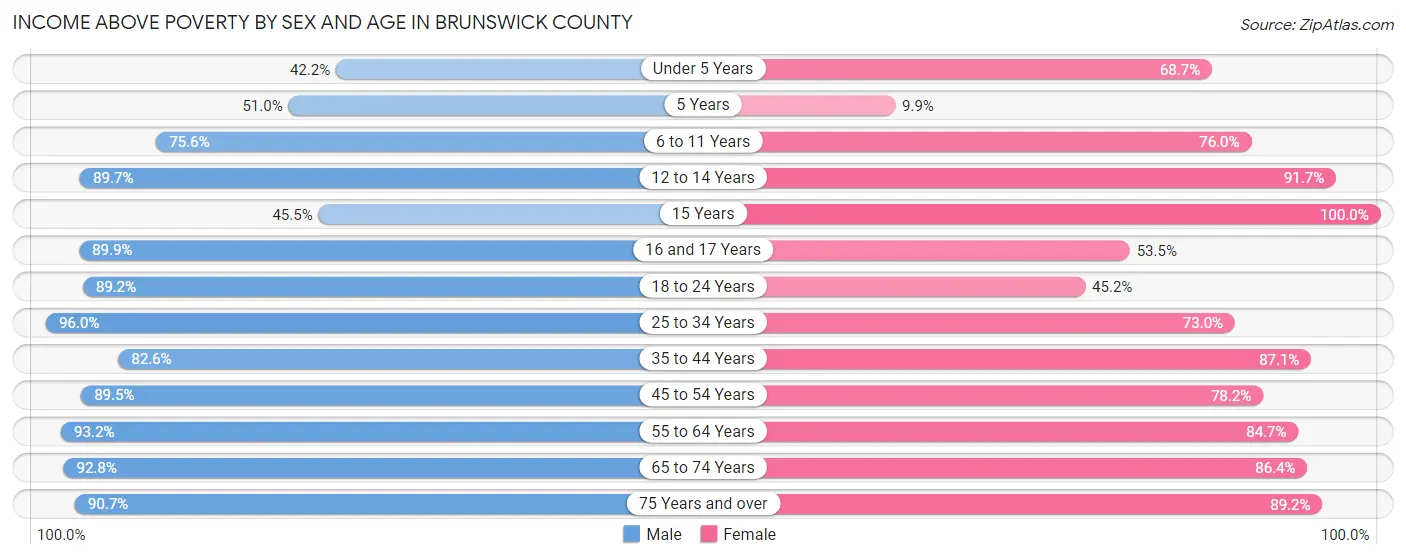
Income Above Poverty by Sex and Age in Brunswick County
According to the poverty statistics in Brunswick County, males aged 25 to 34 years and females aged 15 years are the age groups that are most secure financially, with 96.0% of males and 100.0% of females in these age groups living above the poverty line.
| Age Bracket | Male | Female |
| Under 5 Years | 138 (42.2%) | 224 (68.7%) |
| 5 Years | 25 (51.0%) | 10 (9.9%) |
| 6 to 11 Years | 238 (75.6%) | 396 (76.0%) |
| 12 to 14 Years | 278 (89.7%) | 155 (91.7%) |
| 15 Years | 30 (45.5%) | 105 (100.0%) |
| 16 and 17 Years | 71 (89.9%) | 62 (53.4%) |
| 18 to 24 Years | 602 (89.2%) | 201 (45.2%) |
| 25 to 34 Years | 917 (96.0%) | 483 (73.0%) |
| 35 to 44 Years | 351 (82.6%) | 629 (87.1%) |
| 45 to 54 Years | 741 (89.5%) | 732 (78.2%) |
| 55 to 64 Years | 879 (93.2%) | 1,026 (84.7%) |
| 65 to 74 Years | 833 (92.8%) | 910 (86.4%) |
| 75 Years and over | 592 (90.7%) | 692 (89.2%) |
| Total | 5,695 (87.3%) | 5,625 (78.7%) |
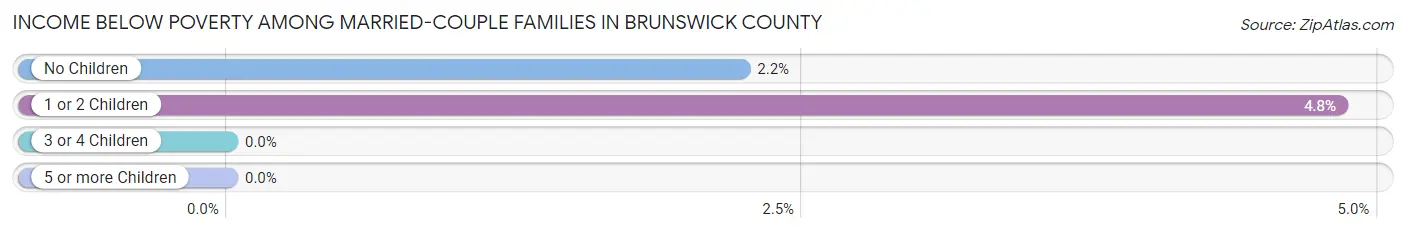
Income Below Poverty Among Married-Couple Families in Brunswick County
The poverty statistics for married-couple families in Brunswick County show that 2.7% or 64 of the total 2,340 families live below the poverty line. Families with 1 or 2 children have the highest poverty rate of 4.8%, comprising of 28 families. On the other hand, families with 3 or 4 children have the lowest poverty rate of 0.0%, which includes 0 families.
| Children | Above Poverty | Below Poverty |
| No Children | 1,581 (97.8%) | 36 (2.2%) |
| 1 or 2 Children | 552 (95.2%) | 28 (4.8%) |
| 3 or 4 Children | 143 (100.0%) | 0 (0.0%) |
| 5 or more Children | 0 (0.0%) | 0 (0.0%) |
| Total | 2,276 (97.3%) | 64 (2.7%) |
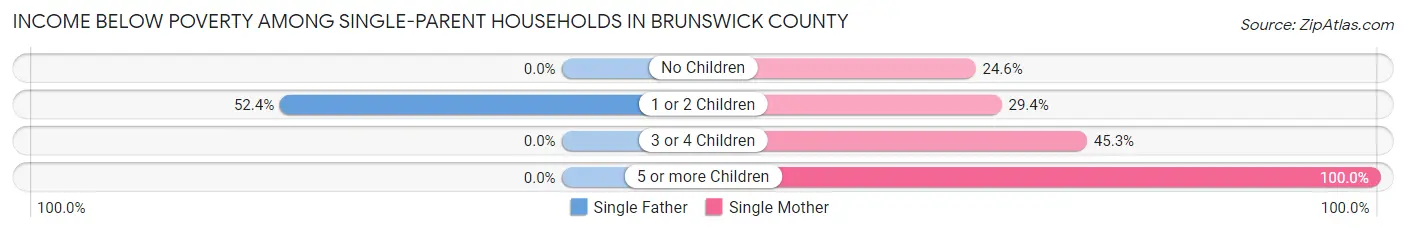
Income Below Poverty Among Single-Parent Households in Brunswick County
According to the poverty data in Brunswick County, 28.8% or 97 single-father households and 31.7% or 373 single-mother households are living below the poverty line. Among single-father households, those with 1 or 2 children have the highest poverty rate, with 97 households (52.4%) experiencing poverty. Likewise, among single-mother households, those with 5 or more children have the highest poverty rate, with 23 households (100.0%) falling below the poverty line.
| Children | Single Father | Single Mother |
| No Children | 0 (0.0%) | 98 (24.6%) |
| 1 or 2 Children | 97 (52.4%) | 165 (29.4%) |
| 3 or 4 Children | 0 (0.0%) | 87 (45.3%) |
| 5 or more Children | 0 (0.0%) | 23 (100.0%) |
| Total | 97 (28.8%) | 373 (31.7%) |
Income Below Poverty Among Married-Couple vs Single-Parent Households in Brunswick County
The poverty data for Brunswick County shows that 64 of the married-couple family households (2.7%) and 470 of the single-parent households (31.1%) are living below the poverty level. Within the married-couple family households, those with 1 or 2 children have the highest poverty rate, with 28 households (4.8%) falling below the poverty line. Among the single-parent households, those with 5 or more children have the highest poverty rate, with 23 household (100.0%) living below poverty.
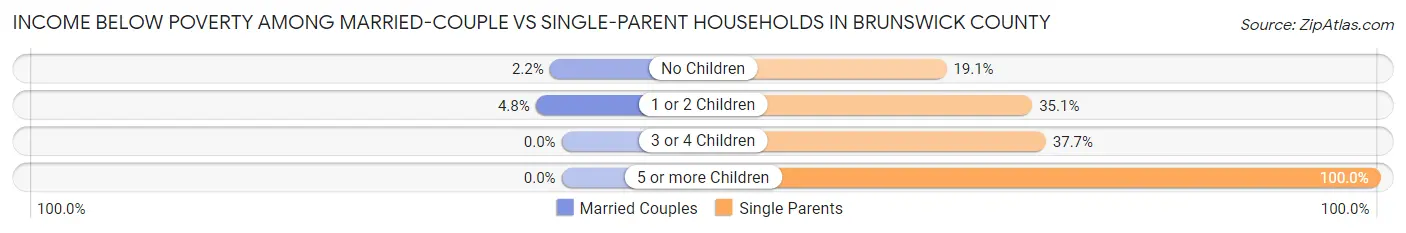
| Children | Married-Couple Families | Single-Parent Households |
| No Children | 36 (2.2%) | 98 (19.1%) |
| 1 or 2 Children | 28 (4.8%) | 262 (35.1%) |
| 3 or 4 Children | 0 (0.0%) | 87 (37.7%) |
| 5 or more Children | 0 (0.0%) | 23 (100.0%) |
| Total | 64 (2.7%) | 470 (31.1%) |
Race in Brunswick County
The most populous races in Brunswick County are Black / African American (8,714 | 54.6%), White / Caucasian (6,596 | 41.3%), and Hispanic or Latino (415 | 2.6%).
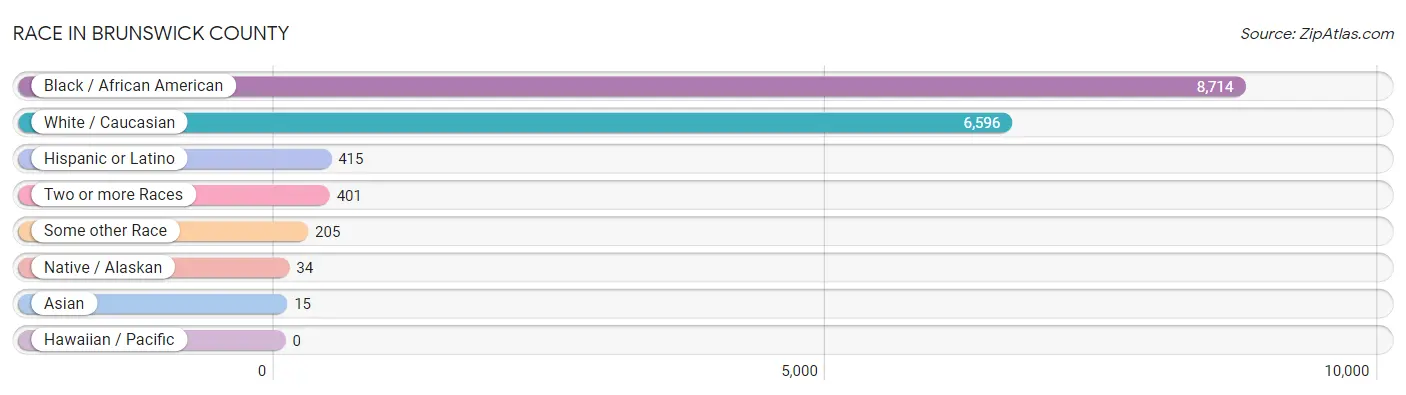
| Race | # Population | % Population |
| Asian | 15 | 0.1% |
| Black / African American | 8,714 | 54.6% |
| Hawaiian / Pacific | 0 | 0.0% |
| Hispanic or Latino | 415 | 2.6% |
| Native / Alaskan | 34 | 0.2% |
| White / Caucasian | 6,596 | 41.3% |
| Two or more Races | 401 | 2.5% |
| Some other Race | 205 | 1.3% |
| Total | 15,965 | 100.0% |
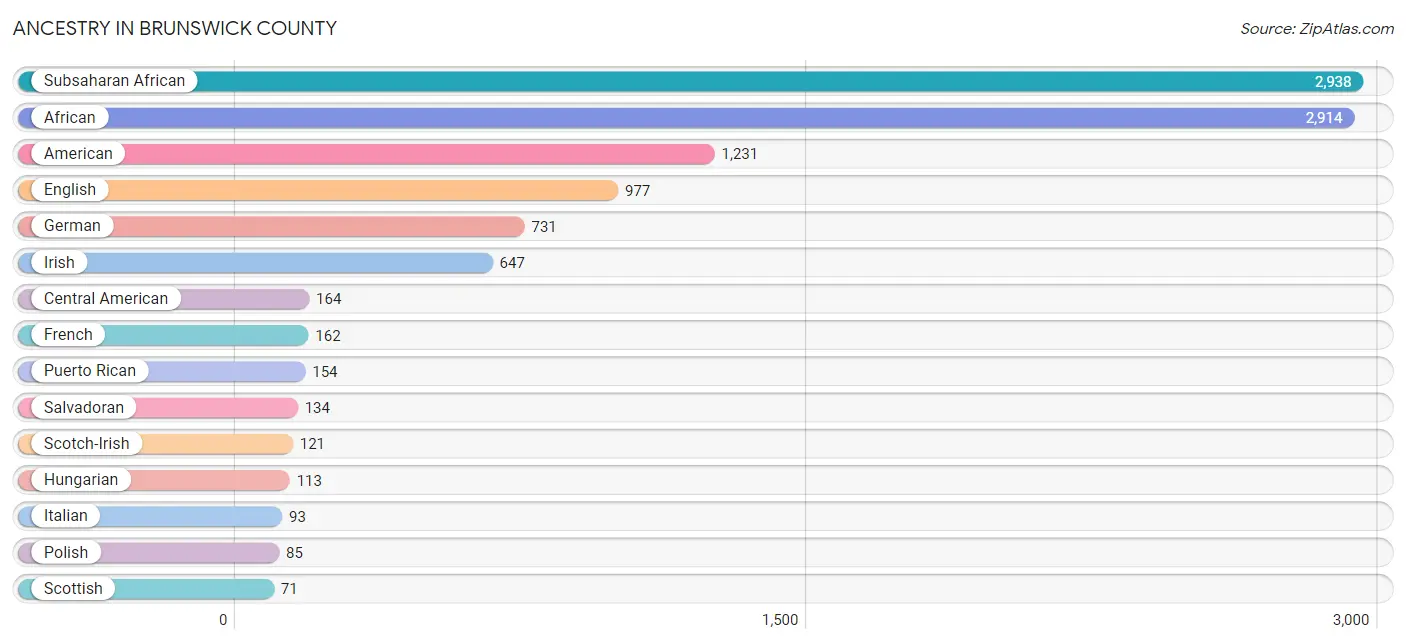
Ancestry in Brunswick County
The most populous ancestries reported in Brunswick County are Subsaharan African (2,938 | 18.4%), African (2,914 | 18.2%), American (1,231 | 7.7%), English (977 | 6.1%), and German (731 | 4.6%), together accounting for 55.1% of all Brunswick County residents.
| Ancestry | # Population | % Population |
| Afghan | 10 | 0.1% |
| African | 2,914 | 18.2% |
| American | 1,231 | 7.7% |
| Apache | 5 | 0.0% |
| Arab | 11 | 0.1% |
| Austrian | 14 | 0.1% |
| Belgian | 4 | 0.0% |
| Bhutanese | 3 | 0.0% |
| Blackfeet | 40 | 0.3% |
| British | 25 | 0.2% |
| Burmese | 9 | 0.1% |
| Canadian | 8 | 0.1% |
| Central American | 164 | 1.0% |
| Cherokee | 60 | 0.4% |
| Chilean | 15 | 0.1% |
| Colombian | 5 | 0.0% |
| Costa Rican | 5 | 0.0% |
| Cuban | 10 | 0.1% |
| Czech | 10 | 0.1% |
| Danish | 6 | 0.0% |
| Dominican | 5 | 0.0% |
| Dutch | 25 | 0.2% |
| English | 977 | 6.1% |
| European | 18 | 0.1% |
| Finnish | 2 | 0.0% |
| French | 162 | 1.0% |
| French Canadian | 20 | 0.1% |
| German | 731 | 4.6% |
| Ghanaian | 17 | 0.1% |
| Greek | 2 | 0.0% |
| Guatemalan | 25 | 0.2% |
| Hungarian | 113 | 0.7% |
| Indian (Asian) | 2 | 0.0% |
| Iranian | 8 | 0.1% |
| Irish | 647 | 4.1% |
| Iroquois | 2 | 0.0% |
| Italian | 93 | 0.6% |
| Jamaican | 10 | 0.1% |
| Korean | 6 | 0.0% |
| Lithuanian | 19 | 0.1% |
| Mexican | 62 | 0.4% |
| Moroccan | 11 | 0.1% |
| Northern European | 46 | 0.3% |
| Norwegian | 23 | 0.1% |
| Polish | 85 | 0.5% |
| Portuguese | 10 | 0.1% |
| Puerto Rican | 154 | 1.0% |
| Russian | 41 | 0.3% |
| Salvadoran | 134 | 0.8% |
| Scandinavian | 15 | 0.1% |
| Scotch-Irish | 121 | 0.8% |
| Scottish | 71 | 0.4% |
| Sioux | 1 | 0.0% |
| Slovak | 5 | 0.0% |
| South American | 20 | 0.1% |
| Subsaharan African | 2,938 | 18.4% |
| Swedish | 2 | 0.0% |
| Ukrainian | 32 | 0.2% |
| Welsh | 30 | 0.2% |
| West Indian | 2 | 0.0% |
| Yaqui | 5 | 0.0% | View All 61 Rows |
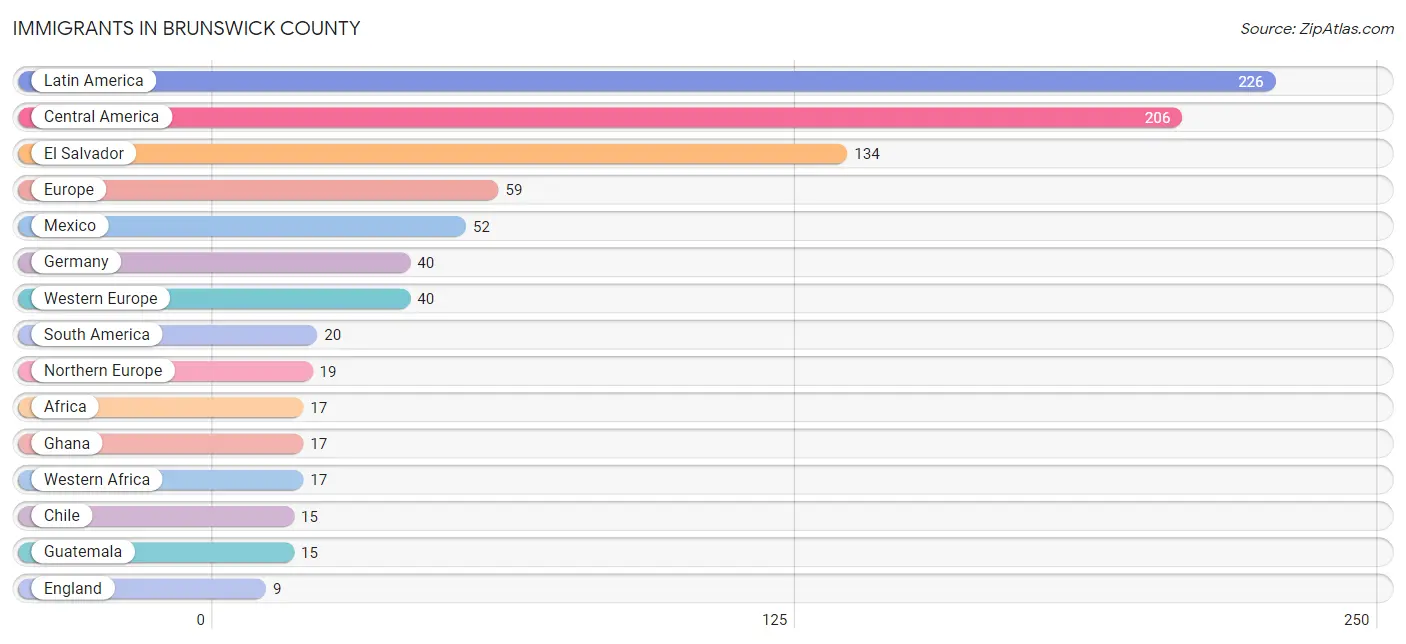
Immigrants in Brunswick County
The most numerous immigrant groups reported in Brunswick County came from Latin America (226 | 1.4%), Central America (206 | 1.3%), El Salvador (134 | 0.8%), Europe (59 | 0.4%), and Mexico (52 | 0.3%), together accounting for 4.2% of all Brunswick County residents.
| Immigration Origin | # Population | % Population |
| Afghanistan | 3 | 0.0% |
| Africa | 17 | 0.1% |
| Asia | 8 | 0.1% |
| Central America | 206 | 1.3% |
| Chile | 15 | 0.1% |
| China | 2 | 0.0% |
| Colombia | 5 | 0.0% |
| Costa Rica | 5 | 0.0% |
| Eastern Asia | 2 | 0.0% |
| El Salvador | 134 | 0.8% |
| England | 9 | 0.1% |
| Europe | 59 | 0.4% |
| Germany | 40 | 0.3% |
| Ghana | 17 | 0.1% |
| Guatemala | 15 | 0.1% |
| Latin America | 226 | 1.4% |
| Mexico | 52 | 0.3% |
| Northern Europe | 19 | 0.1% |
| Philippines | 3 | 0.0% |
| South America | 20 | 0.1% |
| South Central Asia | 3 | 0.0% |
| South Eastern Asia | 3 | 0.0% |
| Western Africa | 17 | 0.1% |
| Western Europe | 40 | 0.3% | View All 24 Rows |
Sex and Age in Brunswick County
Sex and Age in Brunswick County
The most populous age groups in Brunswick County are 25 to 29 Years (804 | 9.4%) for men and 65 to 69 Years (682 | 9.1%) for women.
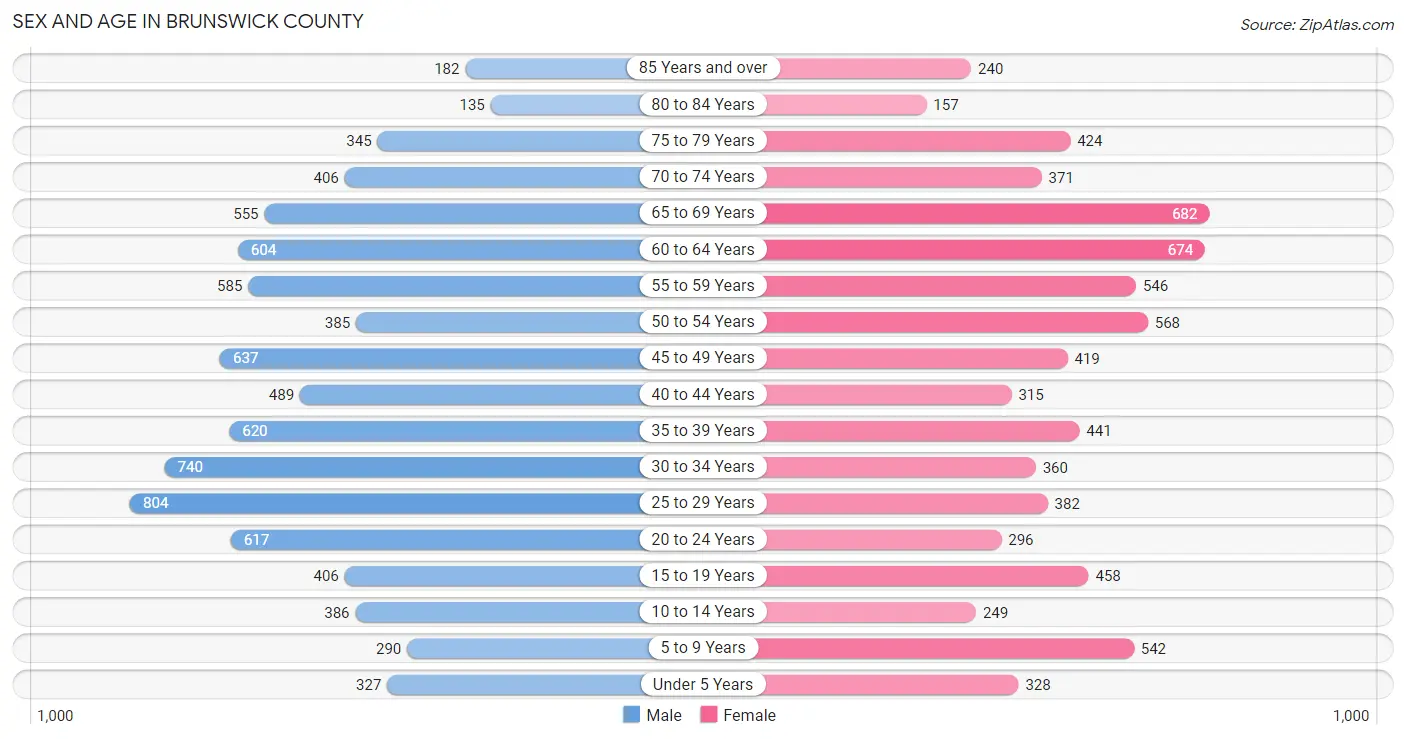
| Age Bracket | Male | Female |
| Under 5 Years | 327 (3.8%) | 328 (4.4%) |
| 5 to 9 Years | 290 (3.4%) | 542 (7.3%) |
| 10 to 14 Years | 386 (4.5%) | 249 (3.3%) |
| 15 to 19 Years | 406 (4.8%) | 458 (6.1%) |
| 20 to 24 Years | 617 (7.2%) | 296 (4.0%) |
| 25 to 29 Years | 804 (9.4%) | 382 (5.1%) |
| 30 to 34 Years | 740 (8.7%) | 360 (4.8%) |
| 35 to 39 Years | 620 (7.3%) | 441 (5.9%) |
| 40 to 44 Years | 489 (5.7%) | 315 (4.2%) |
| 45 to 49 Years | 637 (7.5%) | 419 (5.6%) |
| 50 to 54 Years | 385 (4.5%) | 568 (7.6%) |
| 55 to 59 Years | 585 (6.9%) | 546 (7.3%) |
| 60 to 64 Years | 604 (7.1%) | 674 (9.0%) |
| 65 to 69 Years | 555 (6.5%) | 682 (9.1%) |
| 70 to 74 Years | 406 (4.8%) | 371 (5.0%) |
| 75 to 79 Years | 345 (4.1%) | 424 (5.7%) |
| 80 to 84 Years | 135 (1.6%) | 157 (2.1%) |
| 85 Years and over | 182 (2.1%) | 240 (3.2%) |
| Total | 8,513 (100.0%) | 7,452 (100.0%) |
Families and Households in Brunswick County
Median Family Size in Brunswick County
The median family size in Brunswick County is 2.72 persons per family, with single female/mother families (1,175 | 30.5%) accounting for the largest median family size of 2.96 persons per family. On the other hand, single male/father families (337 | 8.7%) represent the smallest median family size with 2.24 persons per family.
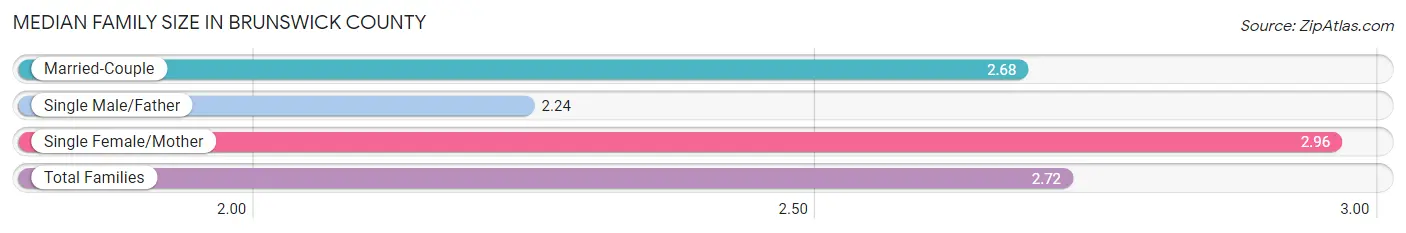
| Family Type | # Families | Family Size |
| Married-Couple | 2,340 (60.8%) | 2.68 |
| Single Male/Father | 337 (8.7%) | 2.24 |
| Single Female/Mother | 1,175 (30.5%) | 2.96 |
| Total Families | 3,852 (100.0%) | 2.72 |
Median Household Size in Brunswick County
The median household size in Brunswick County is 2.21 persons per household, with single female/mother households (1,175 | 19.1%) accounting for the largest median household size of 3.28 persons per household. non-family households (2,313 | 37.5%) represent the smallest median household size with 1.13 persons per household.
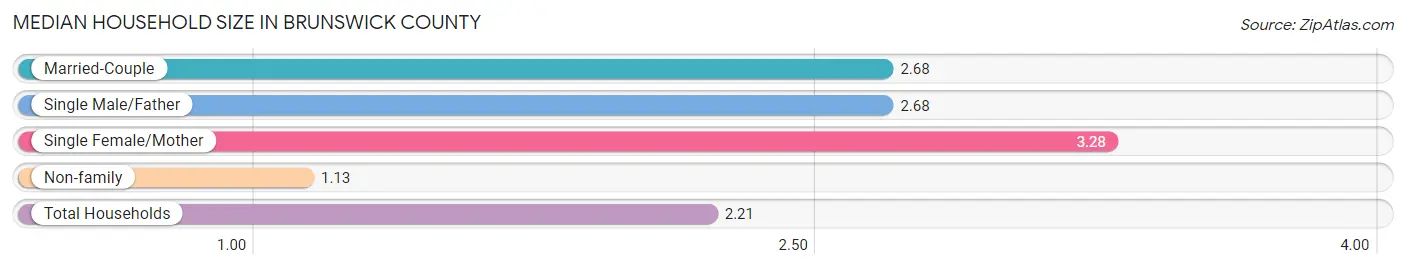
| Household Type | # Households | Household Size |
| Married-Couple | 2,340 (38.0%) | 2.68 |
| Single Male/Father | 337 (5.5%) | 2.68 |
| Single Female/Mother | 1,175 (19.1%) | 3.28 |
| Non-family | 2,313 (37.5%) | 1.13 |
| Total Households | 6,165 (100.0%) | 2.21 |
Household Size by Marriage Status in Brunswick County
Out of a total of 6,165 households in Brunswick County, 3,852 (62.5%) are family households, while 2,313 (37.5%) are nonfamily households. The most numerous type of family households are 2-person households, comprising 1,780, and the most common type of nonfamily households are 1-person households, comprising 2,003.
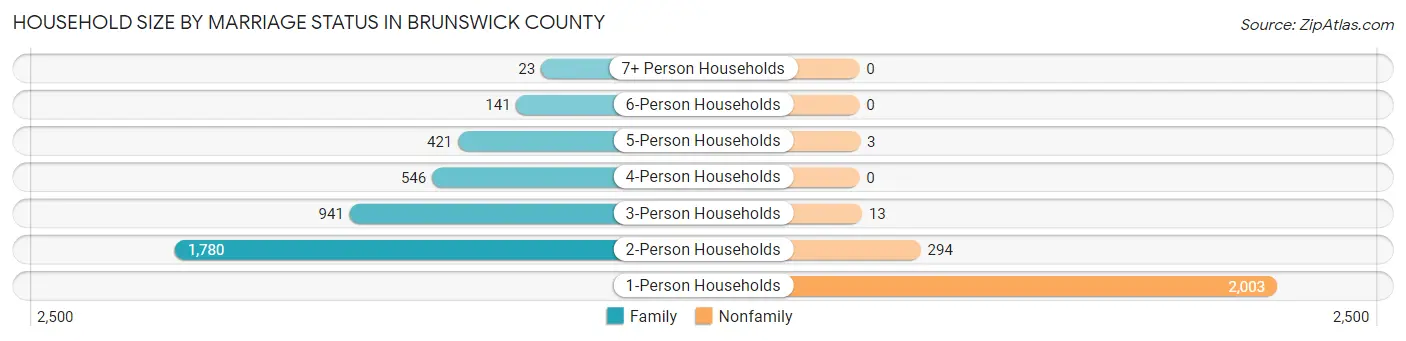
| Household Size | Family Households | Nonfamily Households |
| 1-Person Households | - | 2,003 (32.5%) |
| 2-Person Households | 1,780 (28.9%) | 294 (4.8%) |
| 3-Person Households | 941 (15.3%) | 13 (0.2%) |
| 4-Person Households | 546 (8.9%) | 0 (0.0%) |
| 5-Person Households | 421 (6.8%) | 3 (0.1%) |
| 6-Person Households | 141 (2.3%) | 0 (0.0%) |
| 7+ Person Households | 23 (0.4%) | 0 (0.0%) |
| Total | 3,852 (62.5%) | 2,313 (37.5%) |
Female Fertility in Brunswick County
Fertility by Age in Brunswick County
Average fertility rate in Brunswick County is 45.0 births per 1,000 women. Women in the age bracket of 20 to 34 years have the highest fertility rate with 87.0 births per 1,000 women. Women in the age bracket of 20 to 34 years acount for 73.2% of all women with births.
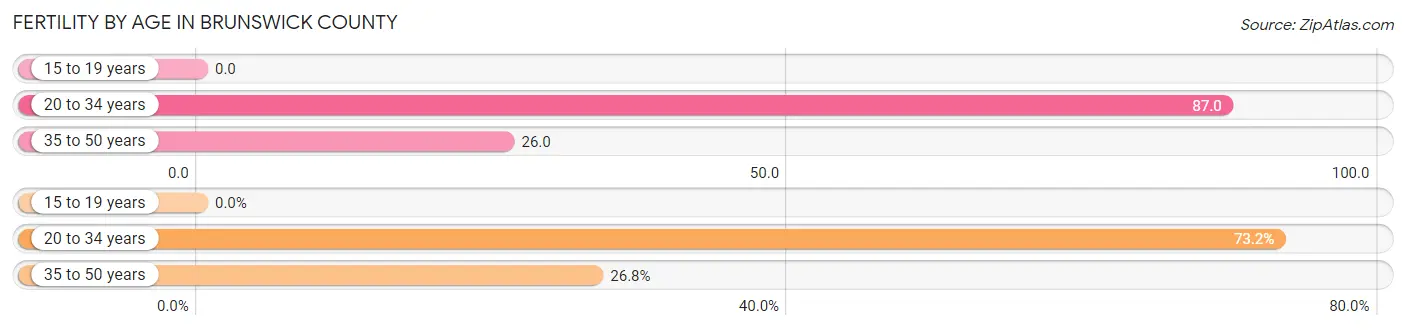
| Age Bracket | Women with Births | Births / 1,000 Women |
| 15 to 19 years | 0 (0.0%) | 0.0 |
| 20 to 34 years | 90 (73.2%) | 87.0 |
| 35 to 50 years | 33 (26.8%) | 26.0 |
| Total | 123 (100.0%) | 45.0 |
Fertility by Age by Marriage Status in Brunswick County
17.9% of women with births (123) in Brunswick County are married. The highest percentage of unmarried women with births falls into 20 to 34 years age bracket with 100.0% of them unmarried at the time of birth, while the lowest percentage of unmarried women with births belong to 35 to 50 years age bracket with 33.3% of them unmarried.
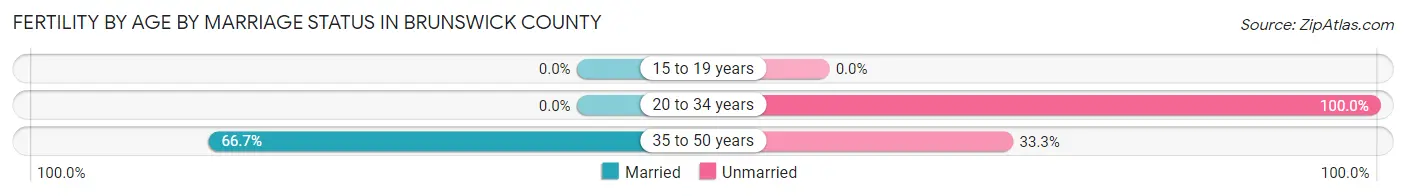
| Age Bracket | Married | Unmarried |
| 15 to 19 years | 0 (0.0%) | 0 (0.0%) |
| 20 to 34 years | 0 (0.0%) | 90 (100.0%) |
| 35 to 50 years | 22 (66.7%) | 11 (33.3%) |
| Total | 22 (17.9%) | 101 (82.1%) |
Fertility by Education in Brunswick County
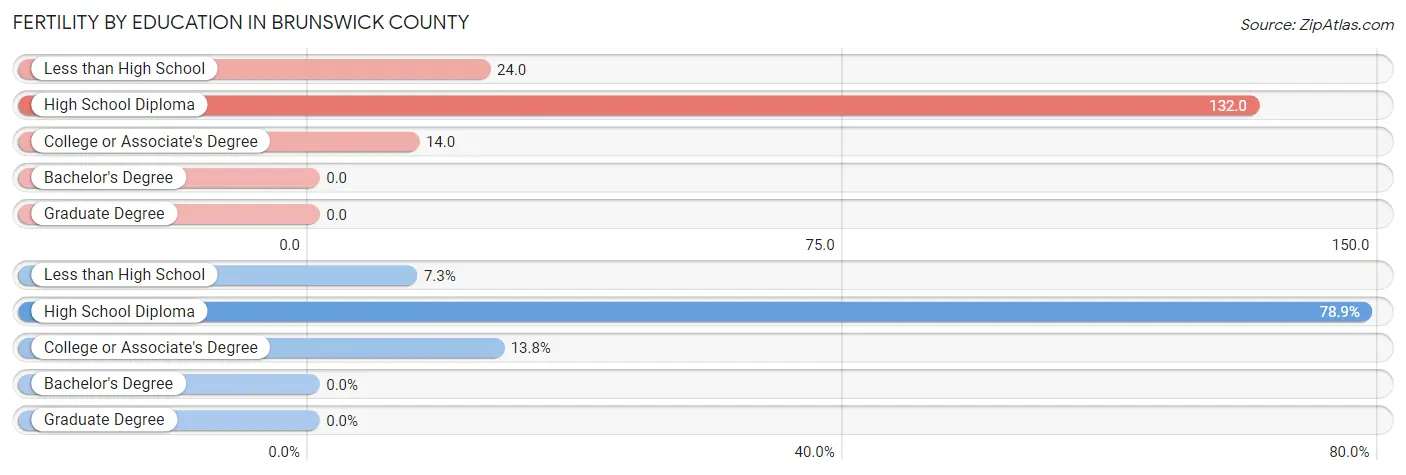
| Educational Attainment | Women with Births | Births / 1,000 Women |
| Less than High School | 9 (7.3%) | 24.0 |
| High School Diploma | 97 (78.9%) | 132.0 |
| College or Associate's Degree | 17 (13.8%) | 14.0 |
| Bachelor's Degree | 0 (0.0%) | 0.0 |
| Graduate Degree | 0 (0.0%) | 0.0 |
| Total | 123 (100.0%) | 45.0 |
Fertility by Education by Marriage Status in Brunswick County
82.1% of women with births in Brunswick County are unmarried. Women with the educational attainment of high school diploma are most likely to be married with 22.7% of them married at childbirth, while women with the educational attainment of less than high school are least likely to be married with 100.0% of them unmarried at childbirth.
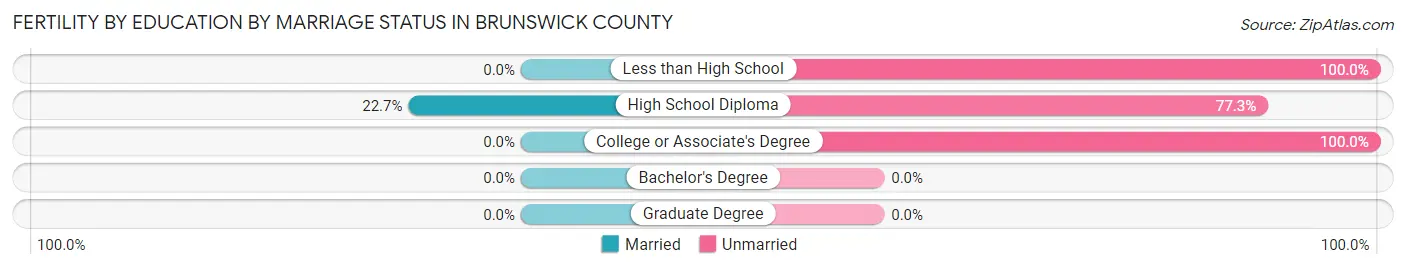
| Educational Attainment | Married | Unmarried |
| Less than High School | 0 (0.0%) | 9 (100.0%) |
| High School Diploma | 22 (22.7%) | 75 (77.3%) |
| College or Associate's Degree | 0 (0.0%) | 17 (100.0%) |
| Bachelor's Degree | 0 (0.0%) | 0 (0.0%) |
| Graduate Degree | 0 (0.0%) | 0 (0.0%) |
| Total | 22 (17.9%) | 101 (82.1%) |
Employment Characteristics in Brunswick County
Employment by Class of Employer in Brunswick County
Among the 6,248 employed individuals in Brunswick County, private company employees (4,051 | 64.8%), local government employees (644 | 10.3%), and state government employees (575 | 9.2%) make up the most common classes of employment.
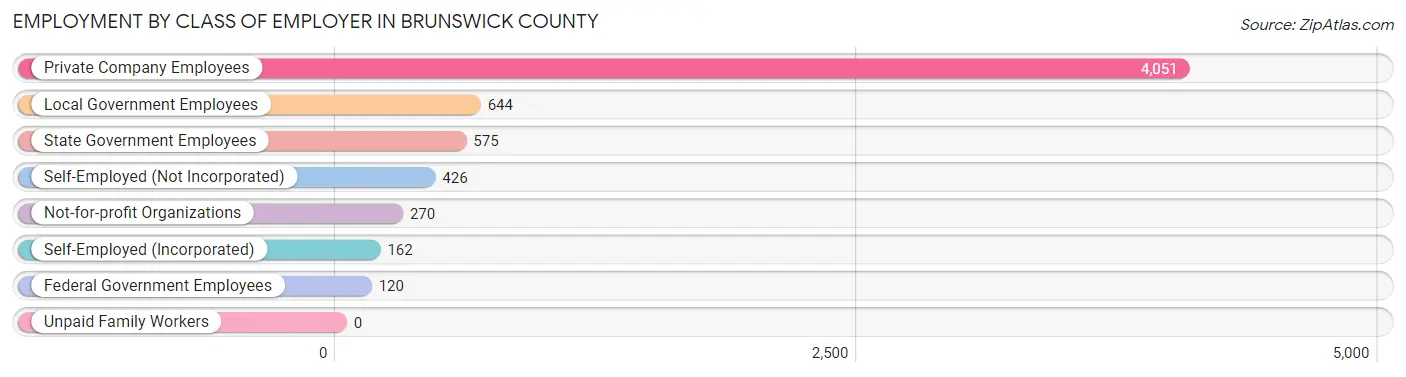
| Employer Class | # Employees | % Employees |
| Private Company Employees | 4,051 | 64.8% |
| Self-Employed (Incorporated) | 162 | 2.6% |
| Self-Employed (Not Incorporated) | 426 | 6.8% |
| Not-for-profit Organizations | 270 | 4.3% |
| Local Government Employees | 644 | 10.3% |
| State Government Employees | 575 | 9.2% |
| Federal Government Employees | 120 | 1.9% |
| Unpaid Family Workers | 0 | 0.0% |
| Total | 6,248 | 100.0% |
Employment Status by Age in Brunswick County
According to the labor force statistics for Brunswick County, out of the total population over 16 years of age (13,672), 50.0% or 6,836 individuals are in the labor force, with 5.2% or 355 of them unemployed. The age group with the highest labor force participation rate is 45 to 54 years, with 74.2% or 1,491 individuals in the labor force. Within the labor force, the 20 to 24 years age range has the highest percentage of unemployed individuals, with 11.3% or 72 of them being unemployed.
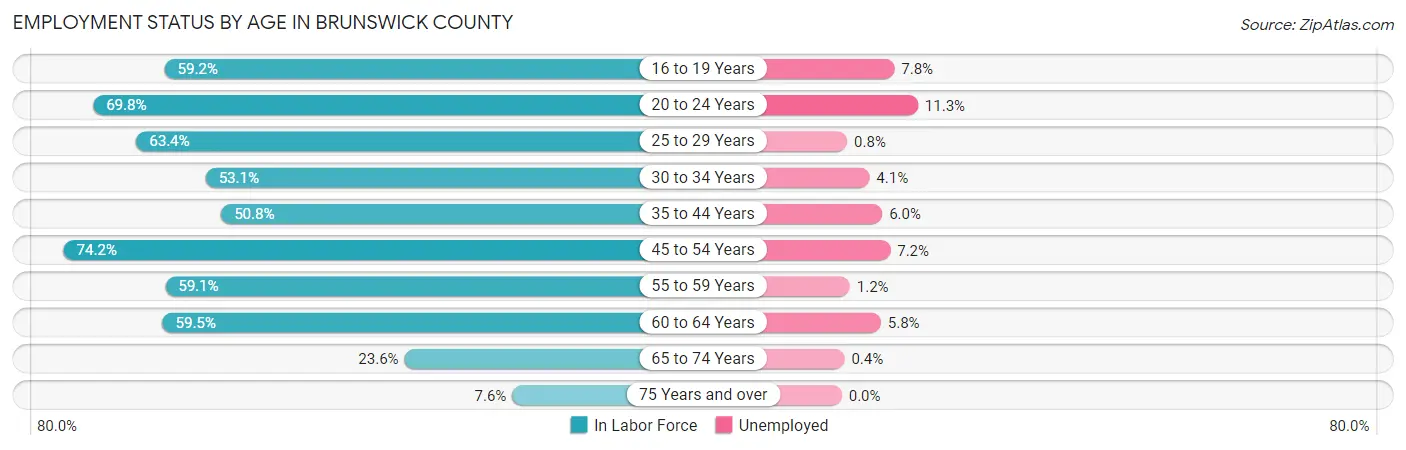
| Age Bracket | In Labor Force | Unemployed |
| 16 to 19 Years | 410 (59.2%) | 32 (7.8%) |
| 20 to 24 Years | 637 (69.8%) | 72 (11.3%) |
| 25 to 29 Years | 752 (63.4%) | 6 (0.8%) |
| 30 to 34 Years | 584 (53.1%) | 24 (4.1%) |
| 35 to 44 Years | 947 (50.8%) | 57 (6.0%) |
| 45 to 54 Years | 1,491 (74.2%) | 107 (7.2%) |
| 55 to 59 Years | 668 (59.1%) | 8 (1.2%) |
| 60 to 64 Years | 760 (59.5%) | 44 (5.8%) |
| 65 to 74 Years | 475 (23.6%) | 2 (0.4%) |
| 75 Years and over | 113 (7.6%) | 0 (0.0%) |
| Total | 6,836 (50.0%) | 355 (5.2%) |
Employment Status by Educational Attainment in Brunswick County
According to labor force statistics for Brunswick County, 60.7% of individuals (5,201) out of the total population between 25 and 64 years of age (8,569) are in the labor force, with 4.7% or 244 of them being unemployed. The group with the highest labor force participation rate are those with the educational attainment of bachelor's degree or higher, with 86.0% or 1,128 individuals in the labor force. Within the labor force, individuals with bachelor's degree or higher education have the highest percentage of unemployment, with 8.0% or 90 of them being unemployed.
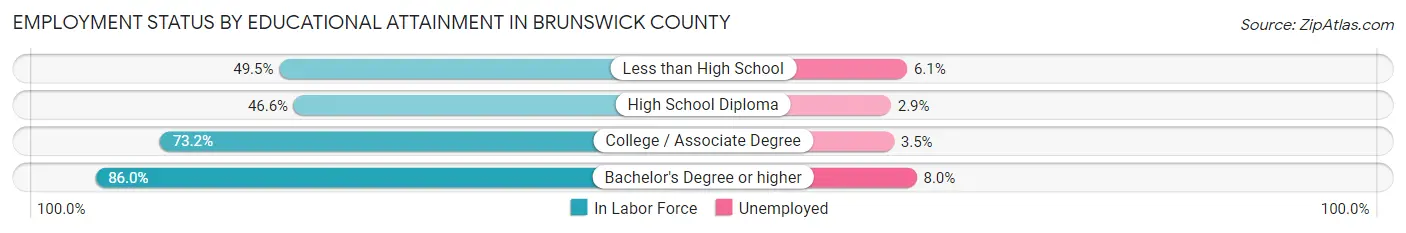
| Educational Attainment | In Labor Force | Unemployed |
| Less than High School | 909 (49.5%) | 112 (6.1%) |
| High School Diploma | 1,401 (46.6%) | 87 (2.9%) |
| College / Associate Degree | 1,766 (73.2%) | 84 (3.5%) |
| Bachelor's Degree or higher | 1,128 (86.0%) | 105 (8.0%) |
| Total | 5,201 (60.7%) | 403 (4.7%) |
Employment Occupations by Sex in Brunswick County
Management, Business, Science and Arts Occupations
The most common Management, Business, Science and Arts occupations in Brunswick County are Community & Social Service (568 | 8.8%), Education Instruction & Library (447 | 6.9%), Management (347 | 5.3%), Health Diagnosing & Treating (298 | 4.6%), and Health Technologists (225 | 3.5%).
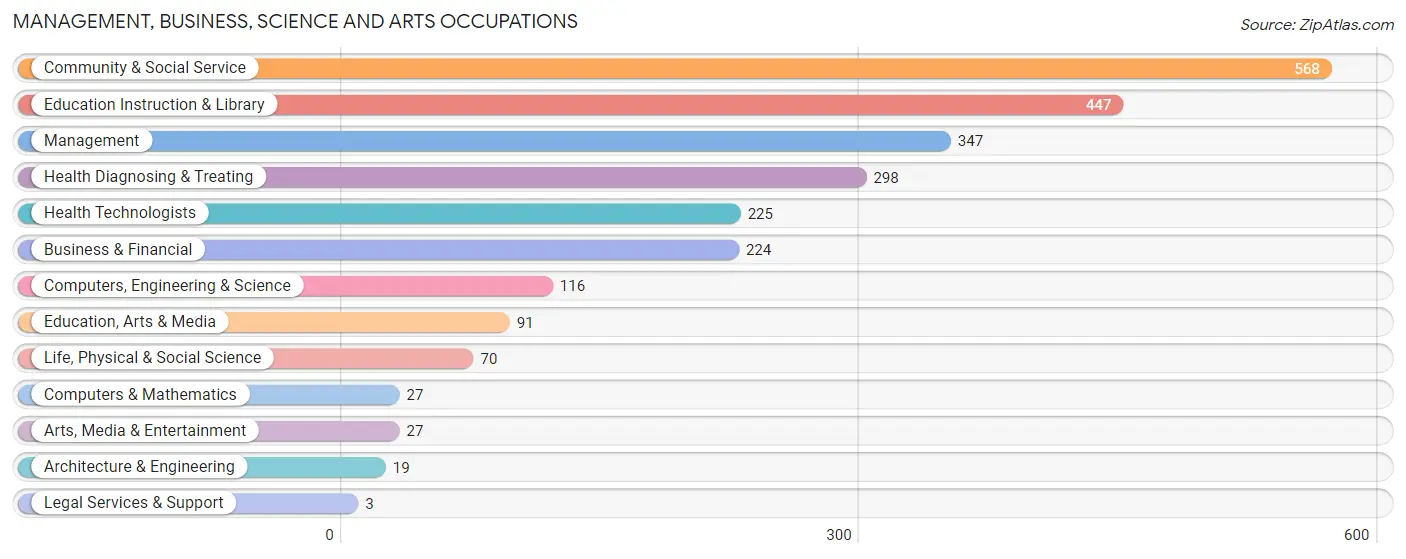
Management, Business, Science and Arts Occupations by Sex
Within the Management, Business, Science and Arts occupations in Brunswick County, the most male-oriented occupations are Architecture & Engineering (100.0%), Life, Physical & Social Science (100.0%), and Computers, Engineering & Science (77.6%), while the most female-oriented occupations are Legal Services & Support (100.0%), Computers & Mathematics (96.3%), and Education Instruction & Library (79.0%).
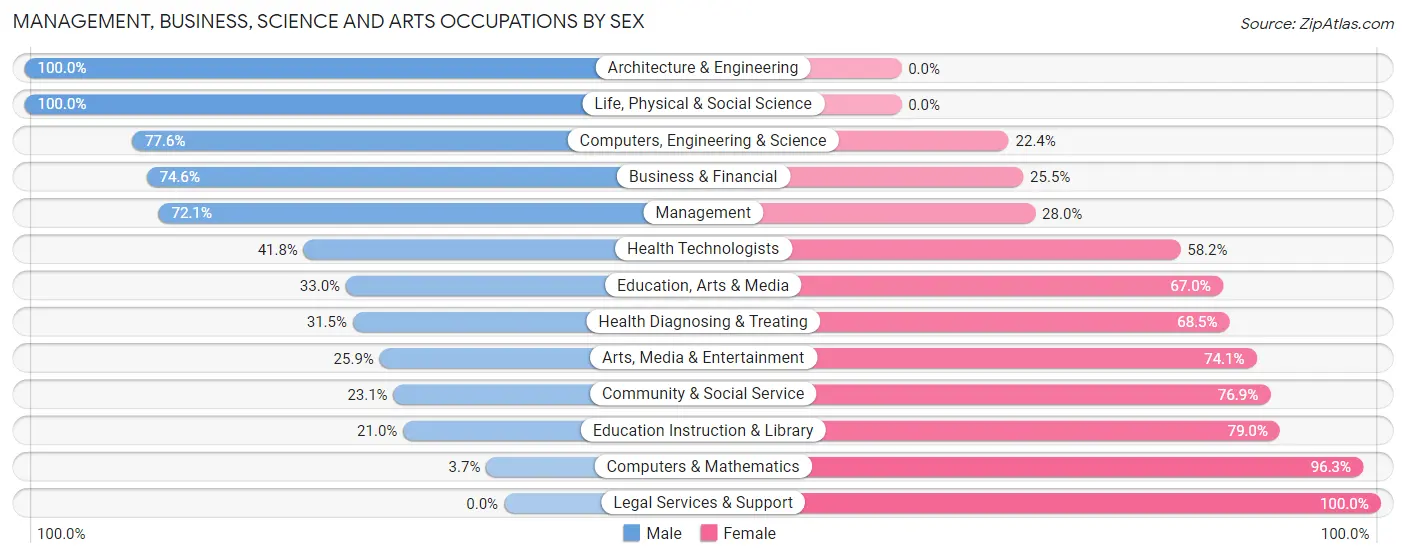
| Occupation | Male | Female |
| Management | 250 (72.1%) | 97 (28.0%) |
| Business & Financial | 167 (74.6%) | 57 (25.5%) |
| Computers, Engineering & Science | 90 (77.6%) | 26 (22.4%) |
| Computers & Mathematics | 1 (3.7%) | 26 (96.3%) |
| Architecture & Engineering | 19 (100.0%) | 0 (0.0%) |
| Life, Physical & Social Science | 70 (100.0%) | 0 (0.0%) |
| Community & Social Service | 131 (23.1%) | 437 (76.9%) |
| Education, Arts & Media | 30 (33.0%) | 61 (67.0%) |
| Legal Services & Support | 0 (0.0%) | 3 (100.0%) |
| Education Instruction & Library | 94 (21.0%) | 353 (79.0%) |
| Arts, Media & Entertainment | 7 (25.9%) | 20 (74.1%) |
| Health Diagnosing & Treating | 94 (31.5%) | 204 (68.5%) |
| Health Technologists | 94 (41.8%) | 131 (58.2%) |
| Total (Category) | 732 (47.1%) | 821 (52.9%) |
| Total (Overall) | 3,315 (51.1%) | 3,170 (48.9%) |
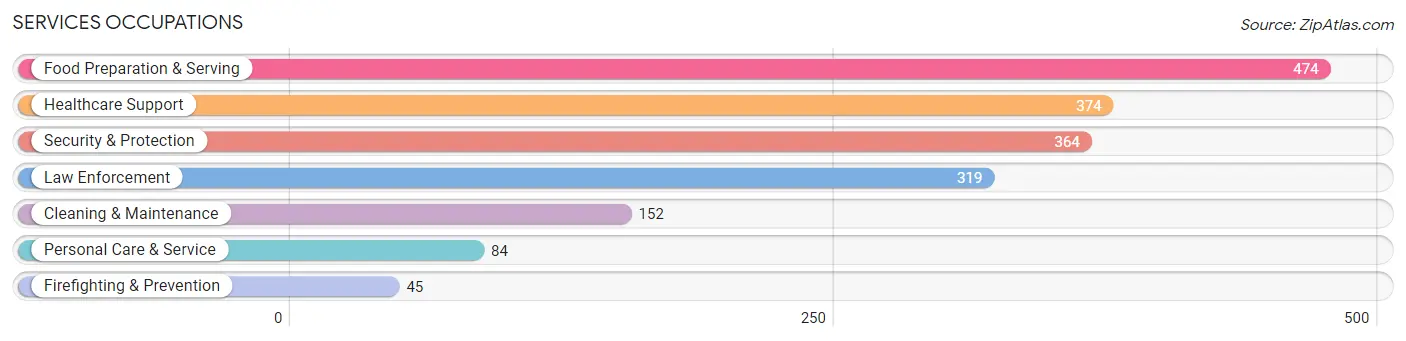
Services Occupations
The most common Services occupations in Brunswick County are Food Preparation & Serving (474 | 7.3%), Healthcare Support (374 | 5.8%), Security & Protection (364 | 5.6%), Law Enforcement (319 | 4.9%), and Cleaning & Maintenance (152 | 2.3%).
Services Occupations by Sex
Within the Services occupations in Brunswick County, the most male-oriented occupations are Firefighting & Prevention (100.0%), Cleaning & Maintenance (75.0%), and Security & Protection (60.2%), while the most female-oriented occupations are Healthcare Support (98.7%), Personal Care & Service (64.3%), and Law Enforcement (45.5%).
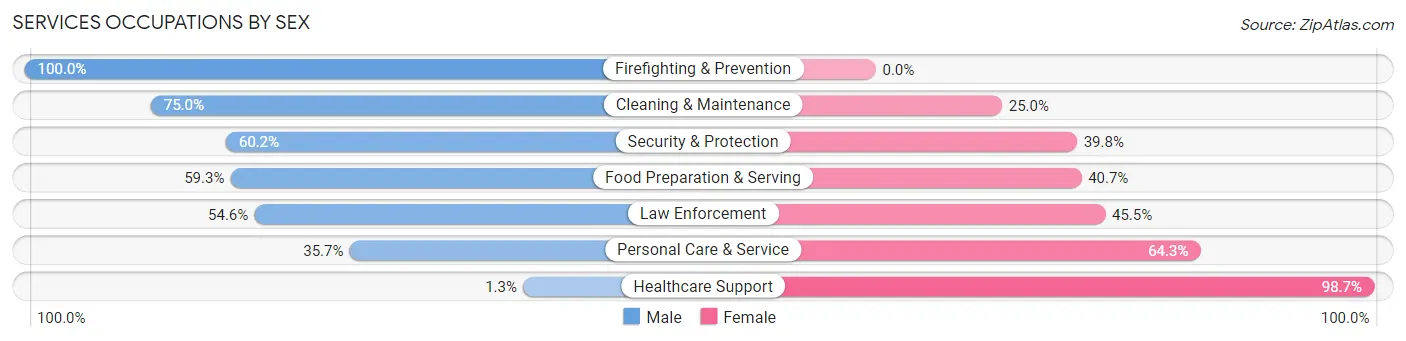
| Occupation | Male | Female |
| Healthcare Support | 5 (1.3%) | 369 (98.7%) |
| Security & Protection | 219 (60.2%) | 145 (39.8%) |
| Firefighting & Prevention | 45 (100.0%) | 0 (0.0%) |
| Law Enforcement | 174 (54.5%) | 145 (45.5%) |
| Food Preparation & Serving | 281 (59.3%) | 193 (40.7%) |
| Cleaning & Maintenance | 114 (75.0%) | 38 (25.0%) |
| Personal Care & Service | 30 (35.7%) | 54 (64.3%) |
| Total (Category) | 649 (44.8%) | 799 (55.2%) |
| Total (Overall) | 3,315 (51.1%) | 3,170 (48.9%) |
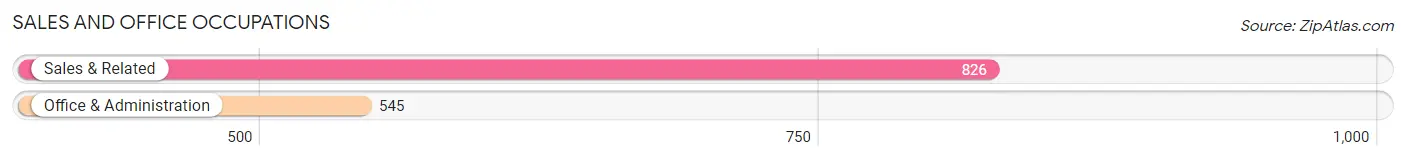
Sales and Office Occupations
The most common Sales and Office occupations in Brunswick County are Sales & Related (826 | 12.7%), and Office & Administration (545 | 8.4%).
Sales and Office Occupations by Sex

| Occupation | Male | Female |
| Sales & Related | 164 (19.9%) | 662 (80.1%) |
| Office & Administration | 172 (31.6%) | 373 (68.4%) |
| Total (Category) | 336 (24.5%) | 1,035 (75.5%) |
| Total (Overall) | 3,315 (51.1%) | 3,170 (48.9%) |
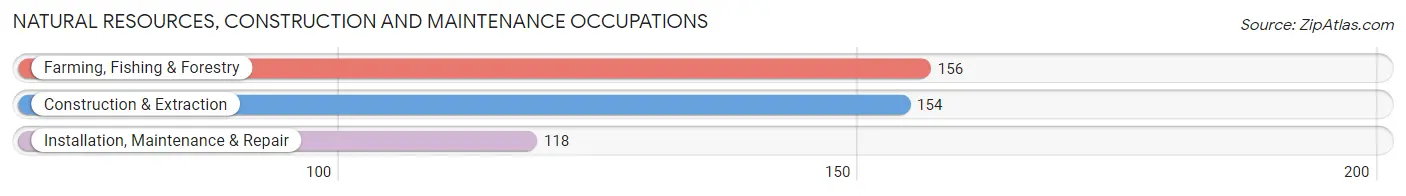
Natural Resources, Construction and Maintenance Occupations
The most common Natural Resources, Construction and Maintenance occupations in Brunswick County are Farming, Fishing & Forestry (156 | 2.4%), Construction & Extraction (154 | 2.4%), and Installation, Maintenance & Repair (118 | 1.8%).
Natural Resources, Construction and Maintenance Occupations by Sex
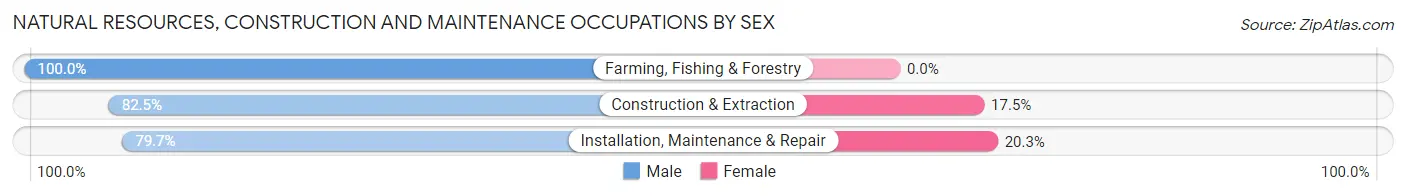
| Occupation | Male | Female |
| Farming, Fishing & Forestry | 156 (100.0%) | 0 (0.0%) |
| Construction & Extraction | 127 (82.5%) | 27 (17.5%) |
| Installation, Maintenance & Repair | 94 (79.7%) | 24 (20.3%) |
| Total (Category) | 377 (88.1%) | 51 (11.9%) |
| Total (Overall) | 3,315 (51.1%) | 3,170 (48.9%) |
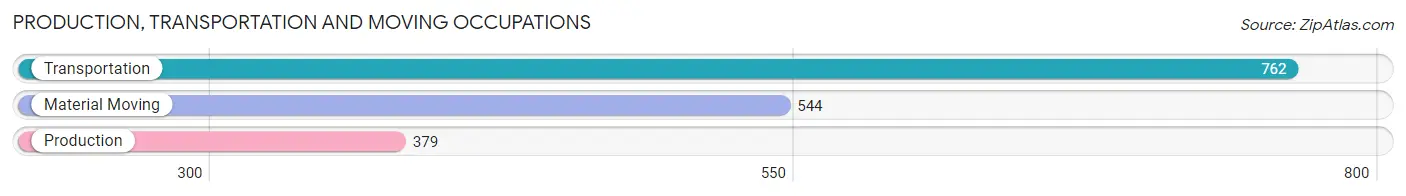
Production, Transportation and Moving Occupations
The most common Production, Transportation and Moving occupations in Brunswick County are Transportation (762 | 11.7%), Material Moving (544 | 8.4%), and Production (379 | 5.8%).
Production, Transportation and Moving Occupations by Sex
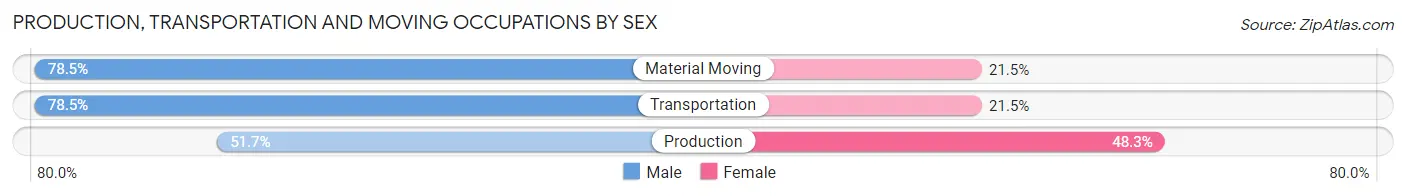
| Occupation | Male | Female |
| Production | 196 (51.7%) | 183 (48.3%) |
| Transportation | 598 (78.5%) | 164 (21.5%) |
| Material Moving | 427 (78.5%) | 117 (21.5%) |
| Total (Category) | 1,221 (72.5%) | 464 (27.5%) |
| Total (Overall) | 3,315 (51.1%) | 3,170 (48.9%) |
Employment Industries by Sex in Brunswick County
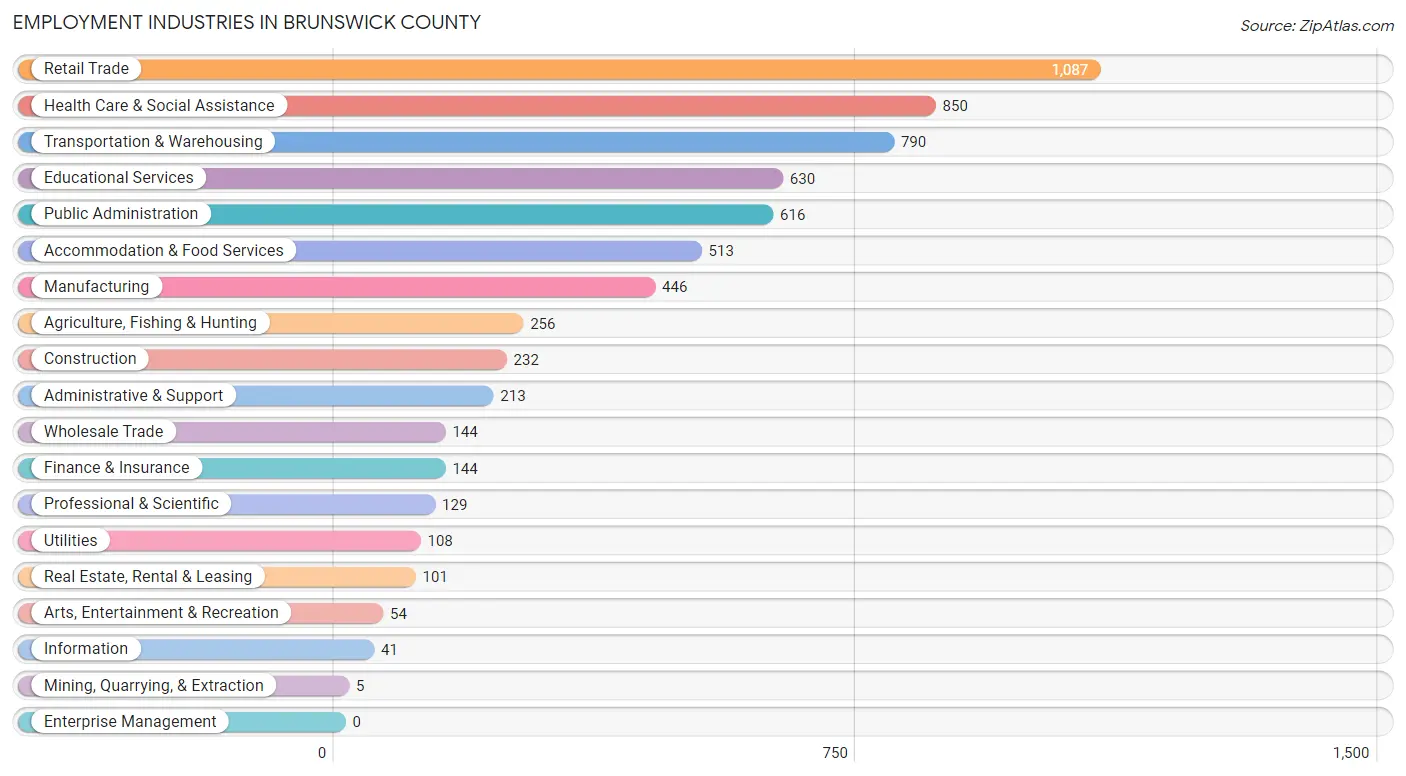
Employment Industries in Brunswick County
The major employment industries in Brunswick County include Retail Trade (1,087 | 16.8%), Health Care & Social Assistance (850 | 13.1%), Transportation & Warehousing (790 | 12.2%), Educational Services (630 | 9.7%), and Public Administration (616 | 9.5%).
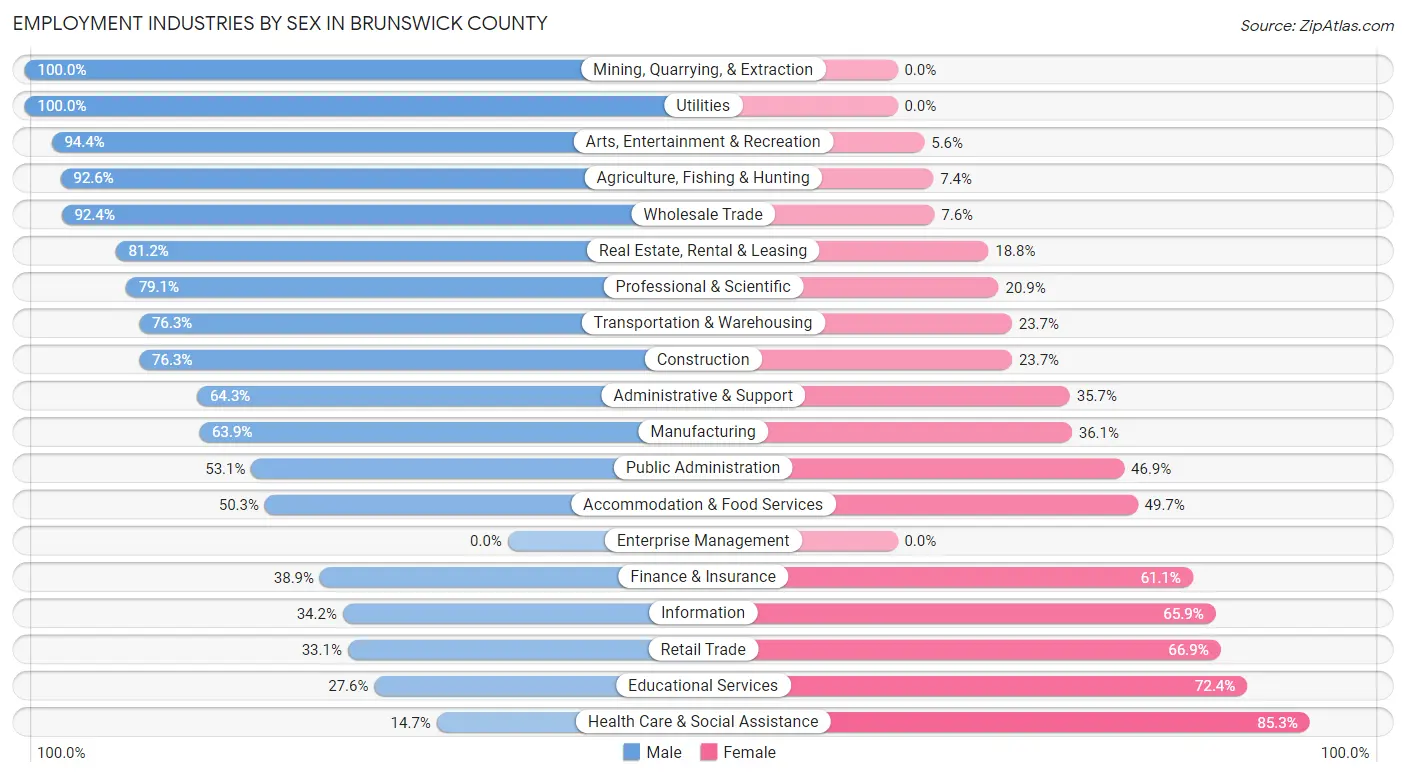
Employment Industries by Sex in Brunswick County
The Brunswick County industries that see more men than women are Mining, Quarrying, & Extraction (100.0%), Utilities (100.0%), and Arts, Entertainment & Recreation (94.4%), whereas the industries that tend to have a higher number of women are Health Care & Social Assistance (85.3%), Educational Services (72.4%), and Retail Trade (66.9%).
| Industry | Male | Female |
| Agriculture, Fishing & Hunting | 237 (92.6%) | 19 (7.4%) |
| Mining, Quarrying, & Extraction | 5 (100.0%) | 0 (0.0%) |
| Construction | 177 (76.3%) | 55 (23.7%) |
| Manufacturing | 285 (63.9%) | 161 (36.1%) |
| Wholesale Trade | 133 (92.4%) | 11 (7.6%) |
| Retail Trade | 360 (33.1%) | 727 (66.9%) |
| Transportation & Warehousing | 603 (76.3%) | 187 (23.7%) |
| Utilities | 108 (100.0%) | 0 (0.0%) |
| Information | 14 (34.2%) | 27 (65.8%) |
| Finance & Insurance | 56 (38.9%) | 88 (61.1%) |
| Real Estate, Rental & Leasing | 82 (81.2%) | 19 (18.8%) |
| Professional & Scientific | 102 (79.1%) | 27 (20.9%) |
| Enterprise Management | 0 (0.0%) | 0 (0.0%) |
| Administrative & Support | 137 (64.3%) | 76 (35.7%) |
| Educational Services | 174 (27.6%) | 456 (72.4%) |
| Health Care & Social Assistance | 125 (14.7%) | 725 (85.3%) |
| Arts, Entertainment & Recreation | 51 (94.4%) | 3 (5.6%) |
| Accommodation & Food Services | 258 (50.3%) | 255 (49.7%) |
| Public Administration | 327 (53.1%) | 289 (46.9%) |
| Total | 3,315 (51.1%) | 3,170 (48.9%) |
Education in Brunswick County
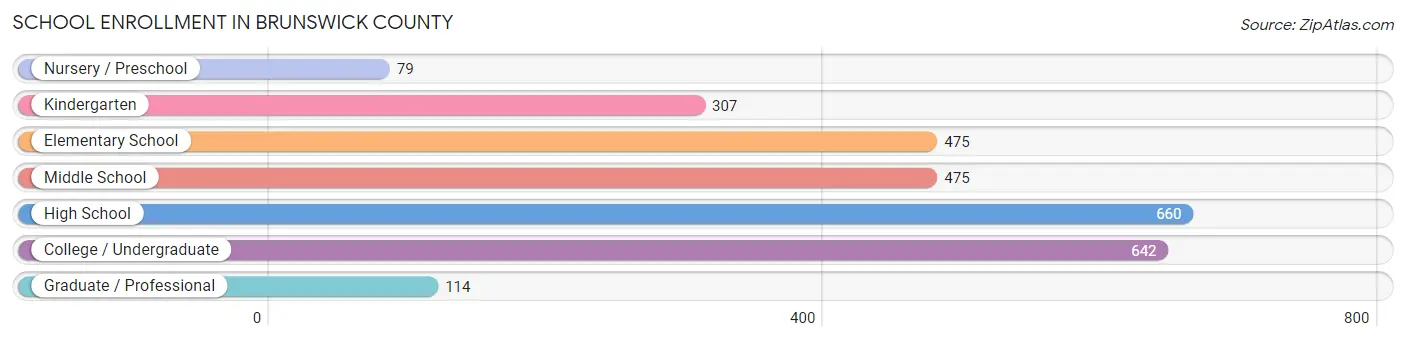
School Enrollment in Brunswick County
The most common levels of schooling among the 2,752 students in Brunswick County are high school (660 | 24.0%), college / undergraduate (642 | 23.3%), and elementary school (475 | 17.3%).
| School Level | # Students | % Students |
| Nursery / Preschool | 79 | 2.9% |
| Kindergarten | 307 | 11.2% |
| Elementary School | 475 | 17.3% |
| Middle School | 475 | 17.3% |
| High School | 660 | 24.0% |
| College / Undergraduate | 642 | 23.3% |
| Graduate / Professional | 114 | 4.1% |
| Total | 2,752 | 100.0% |
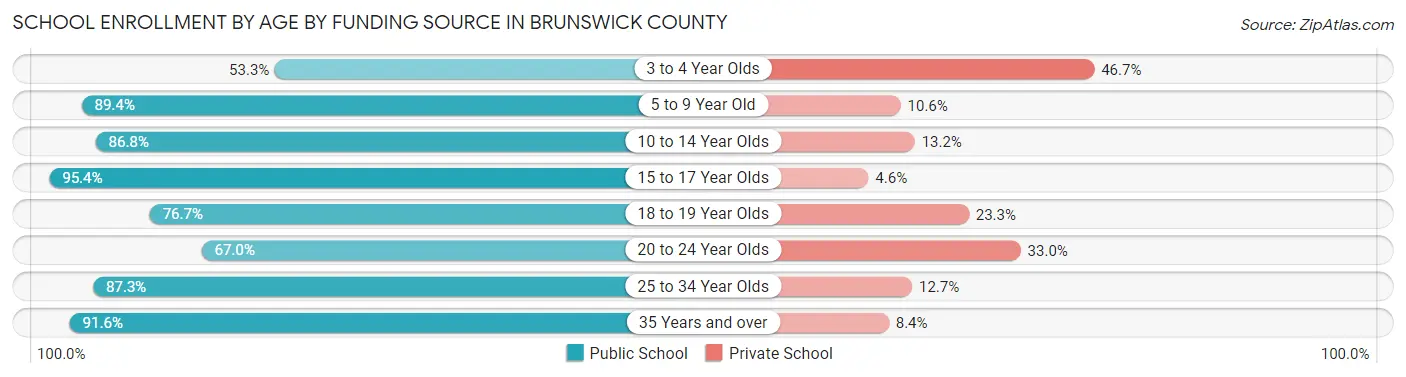
School Enrollment by Age by Funding Source in Brunswick County
Out of a total of 2,752 students who are enrolled in schools in Brunswick County, 391 (14.2%) attend a private institution, while the remaining 2,361 (85.8%) are enrolled in public schools. The age group of 3 to 4 year olds has the highest likelihood of being enrolled in private schools, with 28 (46.7% in the age bracket) enrolled. Conversely, the age group of 15 to 17 year olds has the lowest likelihood of being enrolled in a private school, with 290 (95.4% in the age bracket) attending a public institution.
| Age Bracket | Public School | Private School |
| 3 to 4 Year Olds | 32 (53.3%) | 28 (46.7%) |
| 5 to 9 Year Old | 674 (89.4%) | 80 (10.6%) |
| 10 to 14 Year Olds | 551 (86.8%) | 84 (13.2%) |
| 15 to 17 Year Olds | 290 (95.4%) | 14 (4.6%) |
| 18 to 19 Year Olds | 227 (76.7%) | 69 (23.3%) |
| 20 to 24 Year Olds | 122 (67.0%) | 60 (33.0%) |
| 25 to 34 Year Olds | 226 (87.3%) | 33 (12.7%) |
| 35 Years and over | 240 (91.6%) | 22 (8.4%) |
| Total | 2,361 (85.8%) | 391 (14.2%) |
Educational Attainment by Field of Study in Brunswick County
Business (528 | 26.7%), education (408 | 20.6%), liberal arts & history (190 | 9.6%), arts & humanities (190 | 9.6%), and psychology (181 | 9.1%) are the most common fields of study among 1,981 individuals in Brunswick County who have obtained a bachelor's degree or higher.
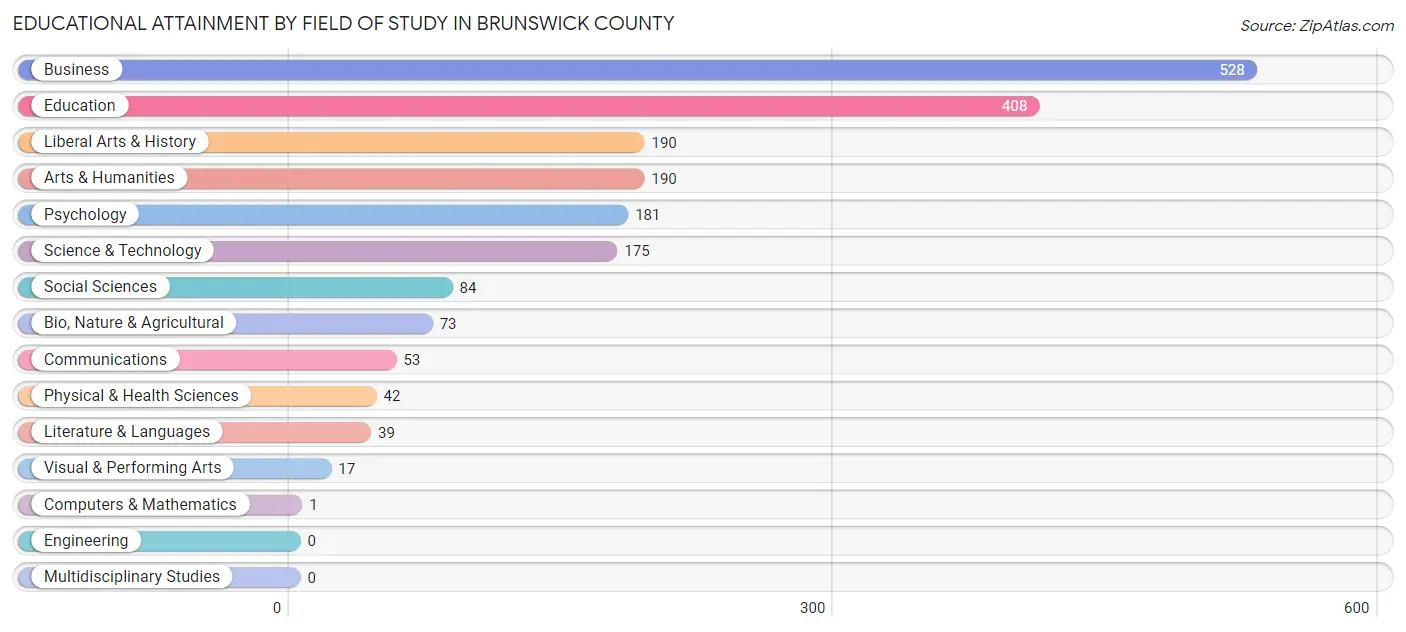
| Field of Study | # Graduates | % Graduates |
| Computers & Mathematics | 1 | 0.1% |
| Bio, Nature & Agricultural | 73 | 3.7% |
| Physical & Health Sciences | 42 | 2.1% |
| Psychology | 181 | 9.1% |
| Social Sciences | 84 | 4.2% |
| Engineering | 0 | 0.0% |
| Multidisciplinary Studies | 0 | 0.0% |
| Science & Technology | 175 | 8.8% |
| Business | 528 | 26.7% |
| Education | 408 | 20.6% |
| Literature & Languages | 39 | 2.0% |
| Liberal Arts & History | 190 | 9.6% |
| Visual & Performing Arts | 17 | 0.9% |
| Communications | 53 | 2.7% |
| Arts & Humanities | 190 | 9.6% |
| Total | 1,981 | 100.0% |
Transportation & Commute in Brunswick County
Vehicle Availability by Sex in Brunswick County
The most prevalent vehicle ownership categories in Brunswick County are males with 3 vehicles (981, accounting for 30.7%) and females with 3 vehicles (672, making up 32.8%).
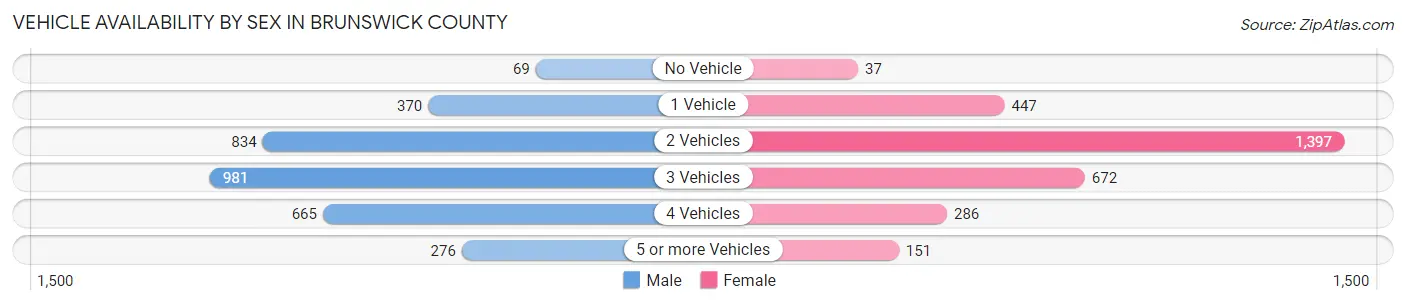
| Vehicles Available | Male | Female |
| No Vehicle | 69 (2.2%) | 37 (1.2%) |
| 1 Vehicle | 370 (11.6%) | 447 (14.9%) |
| 2 Vehicles | 834 (26.1%) | 1,397 (46.7%) |
| 3 Vehicles | 981 (30.7%) | 672 (22.5%) |
| 4 Vehicles | 665 (20.8%) | 286 (9.6%) |
| 5 or more Vehicles | 276 (8.6%) | 151 (5.1%) |
| Total | 3,195 (100.0%) | 2,990 (100.0%) |
Commute Time in Brunswick County
The most frequently occuring commute durations in Brunswick County are 30 to 34 minutes (753 commuters, 12.6%), 45 to 59 minutes (739 commuters, 12.4%), and 15 to 19 minutes (738 commuters, 12.3%).
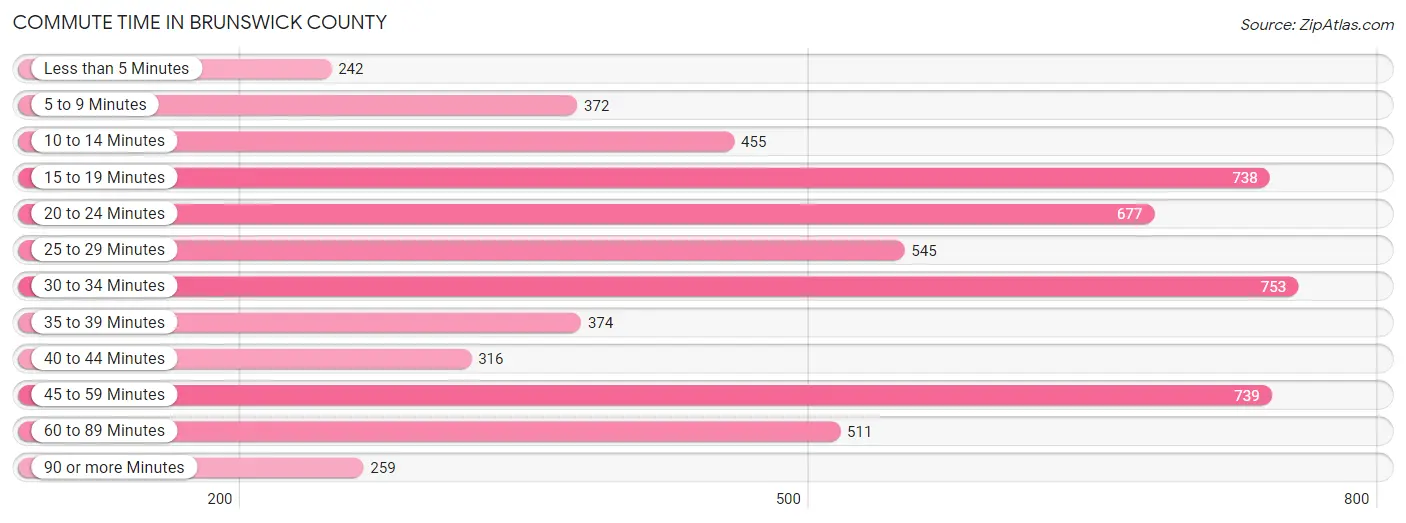
| Commute Time | # Commuters | % Commuters |
| Less than 5 Minutes | 242 | 4.1% |
| 5 to 9 Minutes | 372 | 6.2% |
| 10 to 14 Minutes | 455 | 7.6% |
| 15 to 19 Minutes | 738 | 12.3% |
| 20 to 24 Minutes | 677 | 11.3% |
| 25 to 29 Minutes | 545 | 9.1% |
| 30 to 34 Minutes | 753 | 12.6% |
| 35 to 39 Minutes | 374 | 6.2% |
| 40 to 44 Minutes | 316 | 5.3% |
| 45 to 59 Minutes | 739 | 12.4% |
| 60 to 89 Minutes | 511 | 8.5% |
| 90 or more Minutes | 259 | 4.3% |
Commute Time by Sex in Brunswick County
The most common commute times in Brunswick County are 45 to 59 minutes (539 commuters, 17.2%) for males and 15 to 19 minutes (492 commuters, 17.2%) for females.
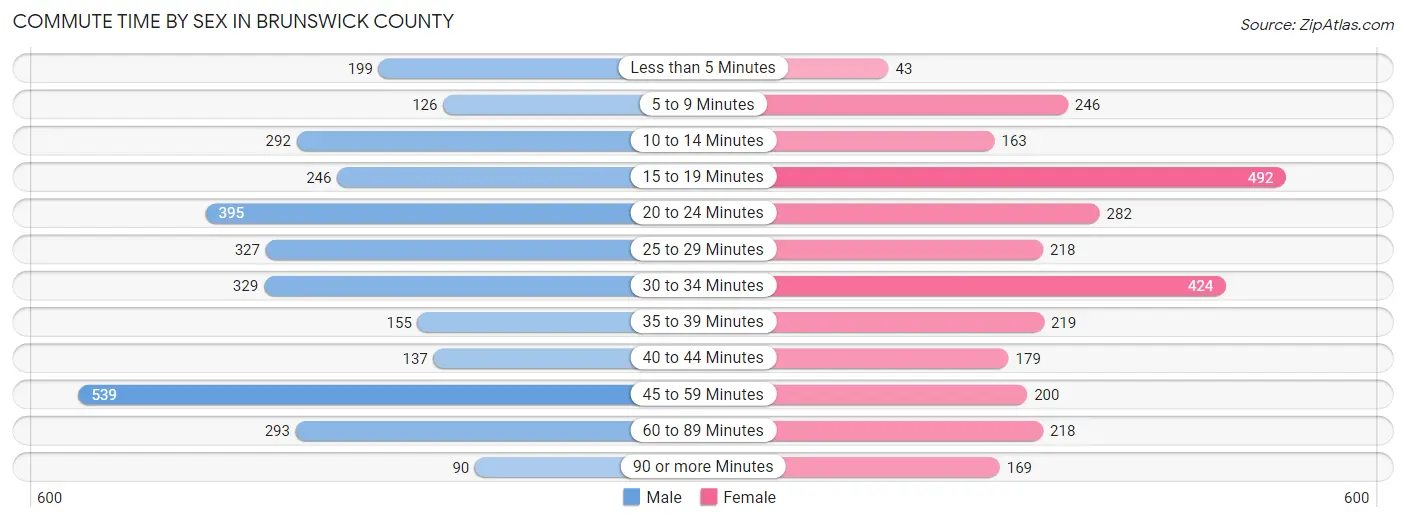
| Commute Time | Male | Female |
| Less than 5 Minutes | 199 (6.4%) | 43 (1.5%) |
| 5 to 9 Minutes | 126 (4.0%) | 246 (8.6%) |
| 10 to 14 Minutes | 292 (9.3%) | 163 (5.7%) |
| 15 to 19 Minutes | 246 (7.9%) | 492 (17.2%) |
| 20 to 24 Minutes | 395 (12.6%) | 282 (9.9%) |
| 25 to 29 Minutes | 327 (10.4%) | 218 (7.6%) |
| 30 to 34 Minutes | 329 (10.5%) | 424 (14.9%) |
| 35 to 39 Minutes | 155 (5.0%) | 219 (7.7%) |
| 40 to 44 Minutes | 137 (4.4%) | 179 (6.3%) |
| 45 to 59 Minutes | 539 (17.2%) | 200 (7.0%) |
| 60 to 89 Minutes | 293 (9.4%) | 218 (7.6%) |
| 90 or more Minutes | 90 (2.9%) | 169 (5.9%) |
Time of Departure to Work by Sex in Brunswick County
The most frequent times of departure to work in Brunswick County are 6:00 AM to 6:29 AM (560, 17.9%) for males and 8:00 AM to 8:29 AM (564, 19.8%) for females.
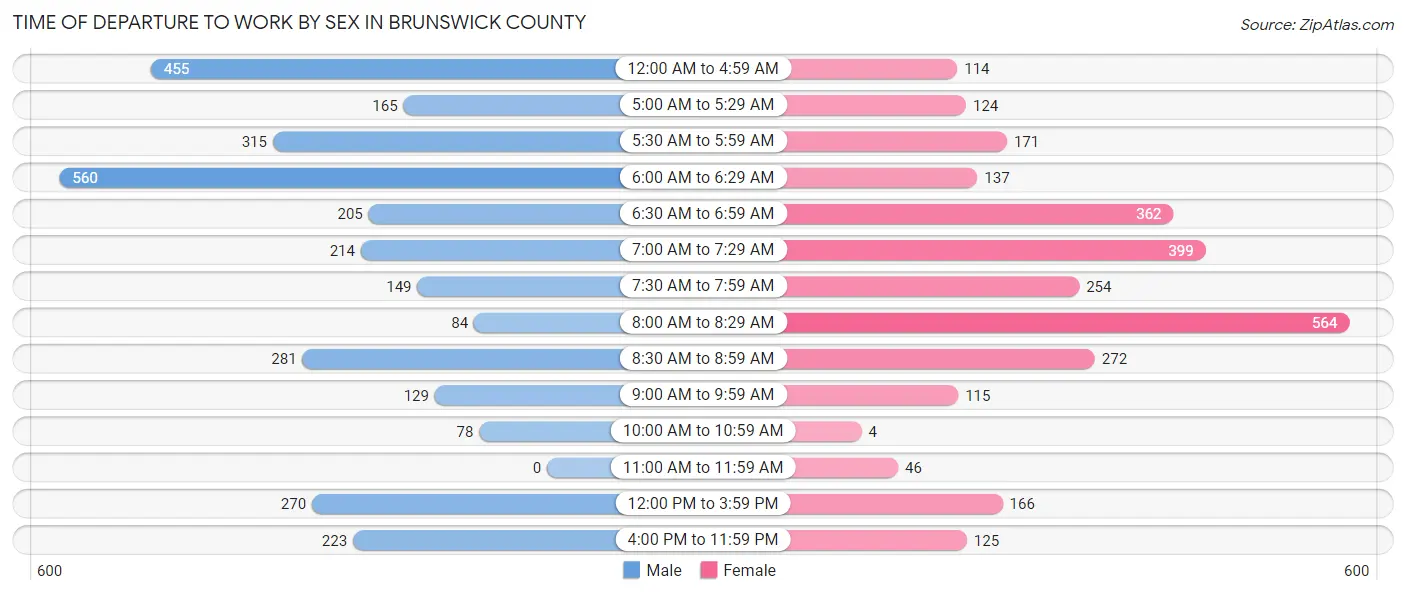
| Time of Departure | Male | Female |
| 12:00 AM to 4:59 AM | 455 (14.5%) | 114 (4.0%) |
| 5:00 AM to 5:29 AM | 165 (5.3%) | 124 (4.3%) |
| 5:30 AM to 5:59 AM | 315 (10.1%) | 171 (6.0%) |
| 6:00 AM to 6:29 AM | 560 (17.9%) | 137 (4.8%) |
| 6:30 AM to 6:59 AM | 205 (6.6%) | 362 (12.7%) |
| 7:00 AM to 7:29 AM | 214 (6.8%) | 399 (14.0%) |
| 7:30 AM to 7:59 AM | 149 (4.8%) | 254 (8.9%) |
| 8:00 AM to 8:29 AM | 84 (2.7%) | 564 (19.8%) |
| 8:30 AM to 8:59 AM | 281 (9.0%) | 272 (9.5%) |
| 9:00 AM to 9:59 AM | 129 (4.1%) | 115 (4.0%) |
| 10:00 AM to 10:59 AM | 78 (2.5%) | 4 (0.1%) |
| 11:00 AM to 11:59 AM | 0 (0.0%) | 46 (1.6%) |
| 12:00 PM to 3:59 PM | 270 (8.6%) | 166 (5.8%) |
| 4:00 PM to 11:59 PM | 223 (7.1%) | 125 (4.4%) |
| Total | 3,128 (100.0%) | 2,853 (100.0%) |
Housing Occupancy in Brunswick County
Occupancy by Ownership in Brunswick County
Of the total 6,165 dwellings in Brunswick County, owner-occupied units account for 4,514 (73.2%), while renter-occupied units make up 1,651 (26.8%).
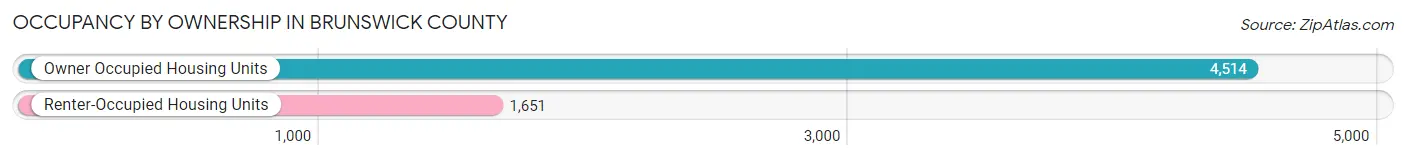
| Occupancy | # Housing Units | % Housing Units |
| Owner Occupied Housing Units | 4,514 | 73.2% |
| Renter-Occupied Housing Units | 1,651 | 26.8% |
| Total Occupied Housing Units | 6,165 | 100.0% |
Occupancy by Household Size in Brunswick County
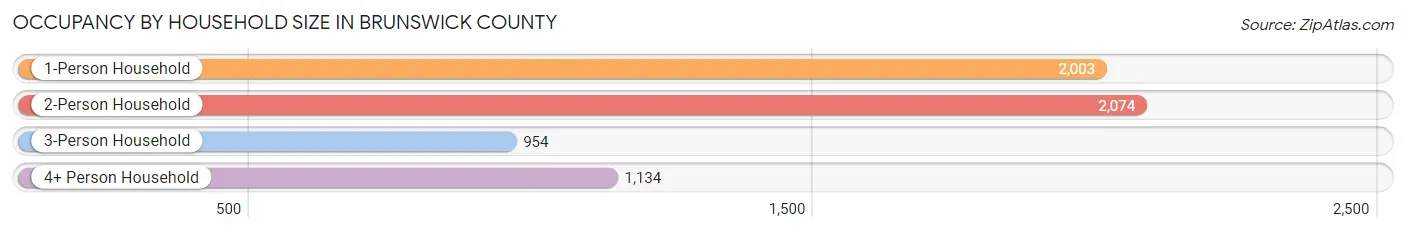
| Household Size | # Housing Units | % Housing Units |
| 1-Person Household | 2,003 | 32.5% |
| 2-Person Household | 2,074 | 33.6% |
| 3-Person Household | 954 | 15.5% |
| 4+ Person Household | 1,134 | 18.4% |
| Total Housing Units | 6,165 | 100.0% |
Occupancy by Ownership by Household Size in Brunswick County
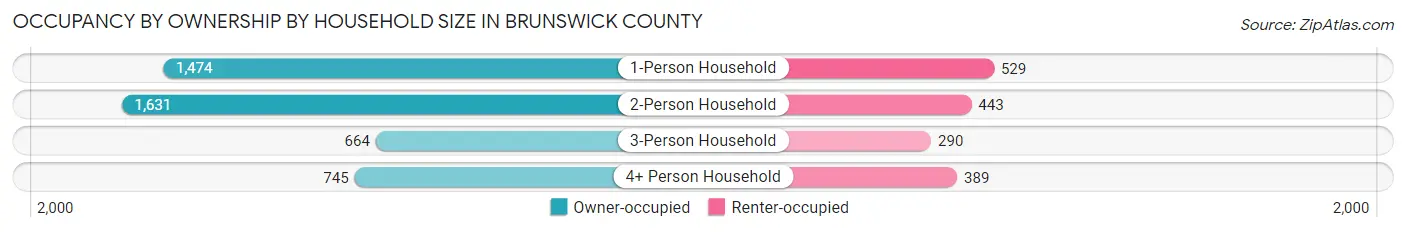
| Household Size | Owner-occupied | Renter-occupied |
| 1-Person Household | 1,474 (73.6%) | 529 (26.4%) |
| 2-Person Household | 1,631 (78.6%) | 443 (21.4%) |
| 3-Person Household | 664 (69.6%) | 290 (30.4%) |
| 4+ Person Household | 745 (65.7%) | 389 (34.3%) |
| Total Housing Units | 4,514 (73.2%) | 1,651 (26.8%) |
Occupancy by Educational Attainment in Brunswick County
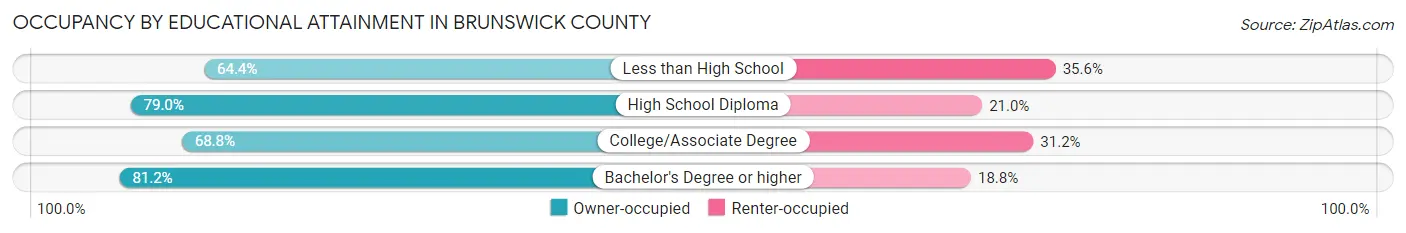
| Household Size | Owner-occupied | Renter-occupied |
| Less than High School | 861 (64.4%) | 476 (35.6%) |
| High School Diploma | 1,488 (79.0%) | 396 (21.0%) |
| College/Associate Degree | 1,254 (68.8%) | 568 (31.2%) |
| Bachelor's Degree or higher | 911 (81.2%) | 211 (18.8%) |
Occupancy by Age of Householder in Brunswick County
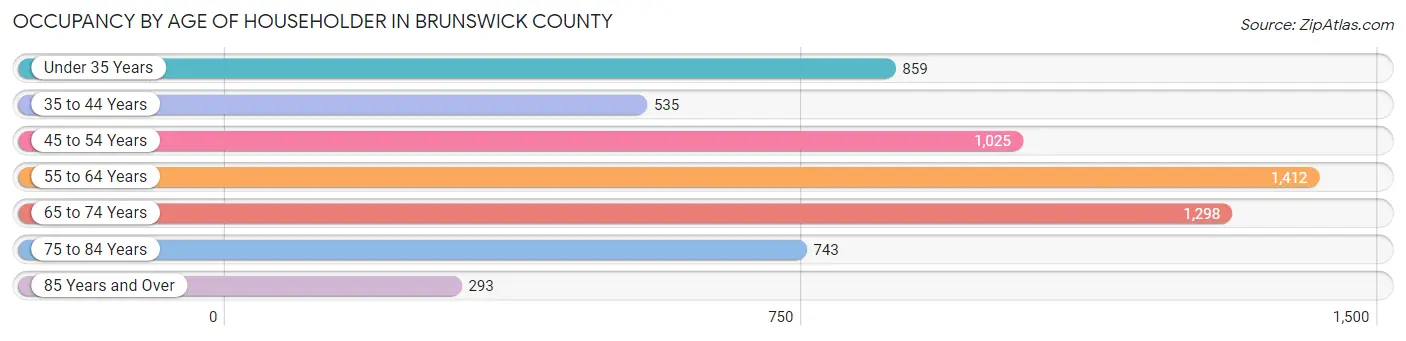
| Age Bracket | # Households | % Households |
| Under 35 Years | 859 | 13.9% |
| 35 to 44 Years | 535 | 8.7% |
| 45 to 54 Years | 1,025 | 16.6% |
| 55 to 64 Years | 1,412 | 22.9% |
| 65 to 74 Years | 1,298 | 21.0% |
| 75 to 84 Years | 743 | 12.0% |
| 85 Years and Over | 293 | 4.8% |
| Total | 6,165 | 100.0% |
Housing Finances in Brunswick County
Median Income by Occupancy in Brunswick County
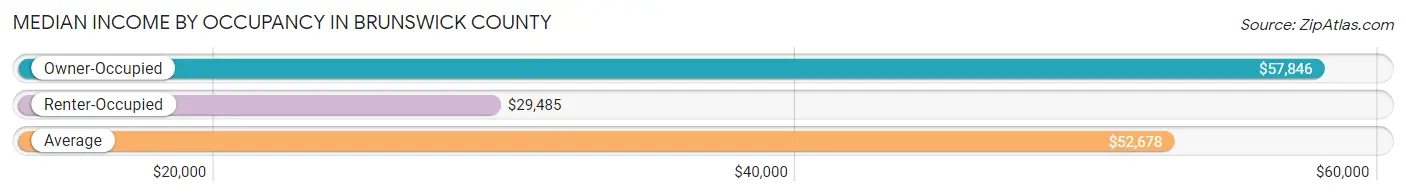
| Occupancy Type | # Households | Median Income |
| Owner-Occupied | 4,514 (73.2%) | $57,846 |
| Renter-Occupied | 1,651 (26.8%) | $29,485 |
| Average | 6,165 (100.0%) | $52,678 |
Occupancy by Householder Income Bracket in Brunswick County
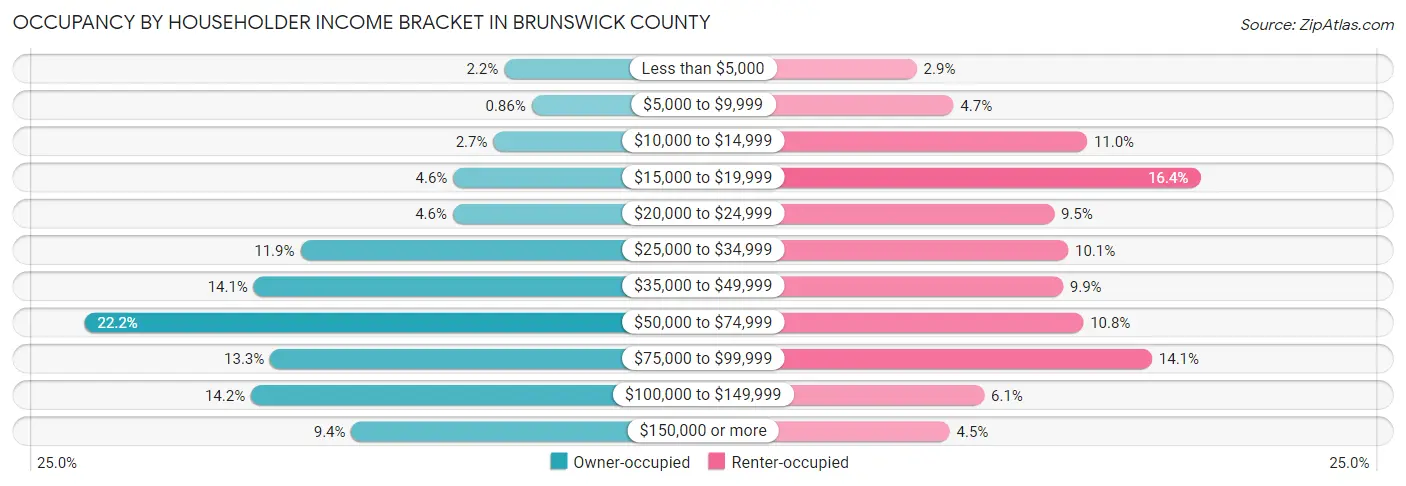
| Income Bracket | Owner-occupied | Renter-occupied |
| Less than $5,000 | 98 (2.2%) | 48 (2.9%) |
| $5,000 to $9,999 | 39 (0.9%) | 77 (4.7%) |
| $10,000 to $14,999 | 121 (2.7%) | 182 (11.0%) |
| $15,000 to $19,999 | 207 (4.6%) | 271 (16.4%) |
| $20,000 to $24,999 | 208 (4.6%) | 156 (9.5%) |
| $25,000 to $34,999 | 536 (11.9%) | 167 (10.1%) |
| $35,000 to $49,999 | 636 (14.1%) | 163 (9.9%) |
| $50,000 to $74,999 | 1,000 (22.2%) | 179 (10.8%) |
| $75,000 to $99,999 | 601 (13.3%) | 233 (14.1%) |
| $100,000 to $149,999 | 642 (14.2%) | 101 (6.1%) |
| $150,000 or more | 426 (9.4%) | 74 (4.5%) |
| Total | 4,514 (100.0%) | 1,651 (100.0%) |
Monthly Housing Cost Tiers in Brunswick County
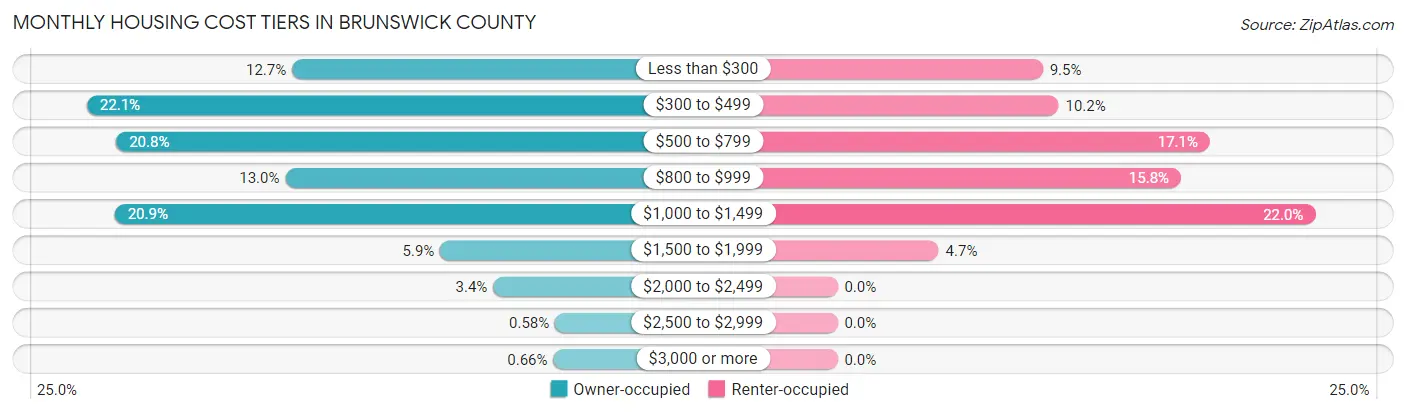
| Monthly Cost | Owner-occupied | Renter-occupied |
| Less than $300 | 573 (12.7%) | 156 (9.5%) |
| $300 to $499 | 999 (22.1%) | 168 (10.2%) |
| $500 to $799 | 938 (20.8%) | 283 (17.1%) |
| $800 to $999 | 587 (13.0%) | 261 (15.8%) |
| $1,000 to $1,499 | 941 (20.8%) | 363 (22.0%) |
| $1,500 to $1,999 | 265 (5.9%) | 77 (4.7%) |
| $2,000 to $2,499 | 155 (3.4%) | 0 (0.0%) |
| $2,500 to $2,999 | 26 (0.6%) | 0 (0.0%) |
| $3,000 or more | 30 (0.7%) | 0 (0.0%) |
| Total | 4,514 (100.0%) | 1,651 (100.0%) |
Physical Housing Characteristics in Brunswick County
Housing Structures in Brunswick County
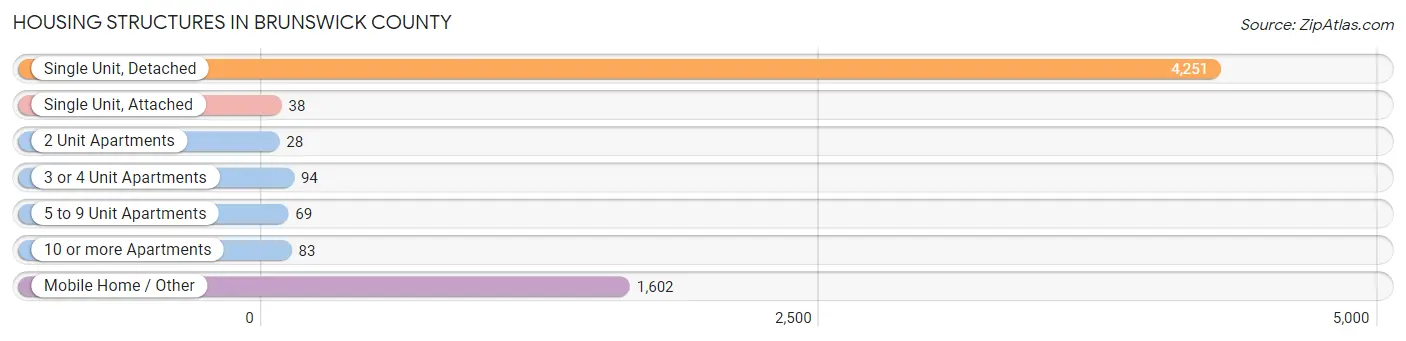
| Structure Type | # Housing Units | % Housing Units |
| Single Unit, Detached | 4,251 | 69.0% |
| Single Unit, Attached | 38 | 0.6% |
| 2 Unit Apartments | 28 | 0.4% |
| 3 or 4 Unit Apartments | 94 | 1.5% |
| 5 to 9 Unit Apartments | 69 | 1.1% |
| 10 or more Apartments | 83 | 1.3% |
| Mobile Home / Other | 1,602 | 26.0% |
| Total | 6,165 | 100.0% |
Housing Structures by Occupancy in Brunswick County
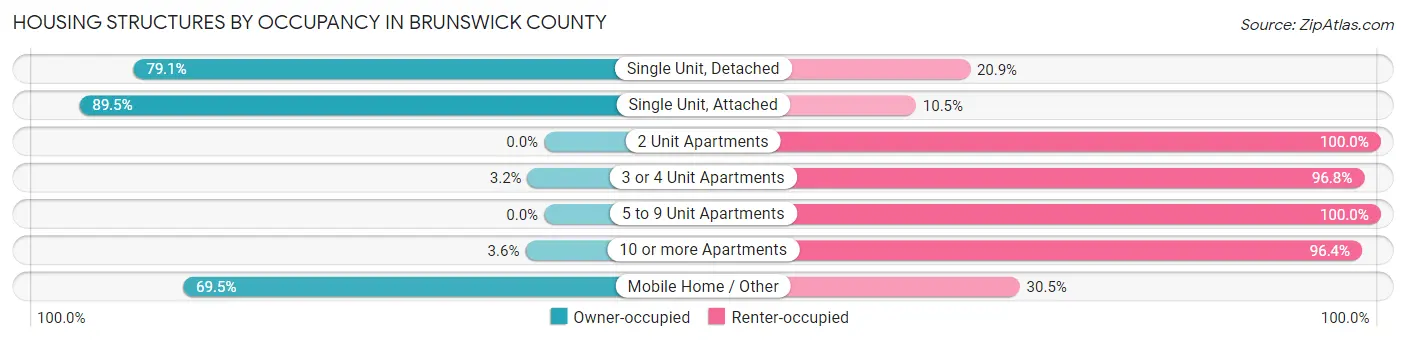
| Structure Type | Owner-occupied | Renter-occupied |
| Single Unit, Detached | 3,361 (79.1%) | 890 (20.9%) |
| Single Unit, Attached | 34 (89.5%) | 4 (10.5%) |
| 2 Unit Apartments | 0 (0.0%) | 28 (100.0%) |
| 3 or 4 Unit Apartments | 3 (3.2%) | 91 (96.8%) |
| 5 to 9 Unit Apartments | 0 (0.0%) | 69 (100.0%) |
| 10 or more Apartments | 3 (3.6%) | 80 (96.4%) |
| Mobile Home / Other | 1,113 (69.5%) | 489 (30.5%) |
| Total | 4,514 (73.2%) | 1,651 (26.8%) |
Housing Structures by Number of Rooms in Brunswick County
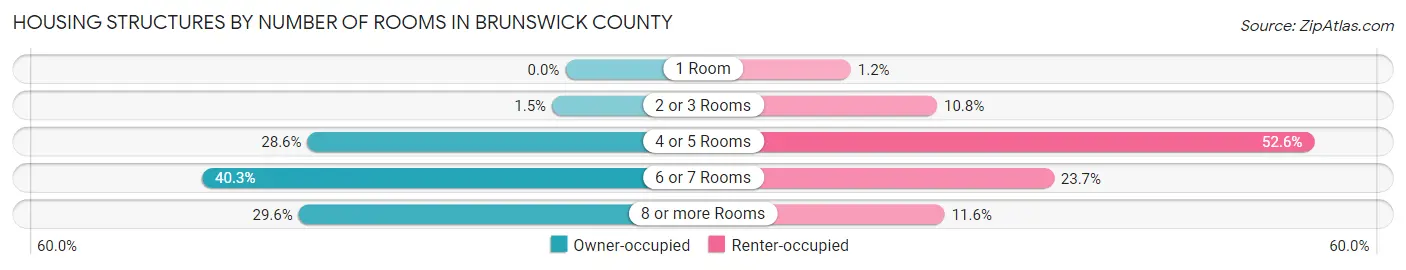
| Number of Rooms | Owner-occupied | Renter-occupied |
| 1 Room | 0 (0.0%) | 20 (1.2%) |
| 2 or 3 Rooms | 67 (1.5%) | 178 (10.8%) |
| 4 or 5 Rooms | 1,292 (28.6%) | 869 (52.6%) |
| 6 or 7 Rooms | 1,819 (40.3%) | 392 (23.7%) |
| 8 or more Rooms | 1,336 (29.6%) | 192 (11.6%) |
| Total | 4,514 (100.0%) | 1,651 (100.0%) |
Housing Structure by Heating Type in Brunswick County
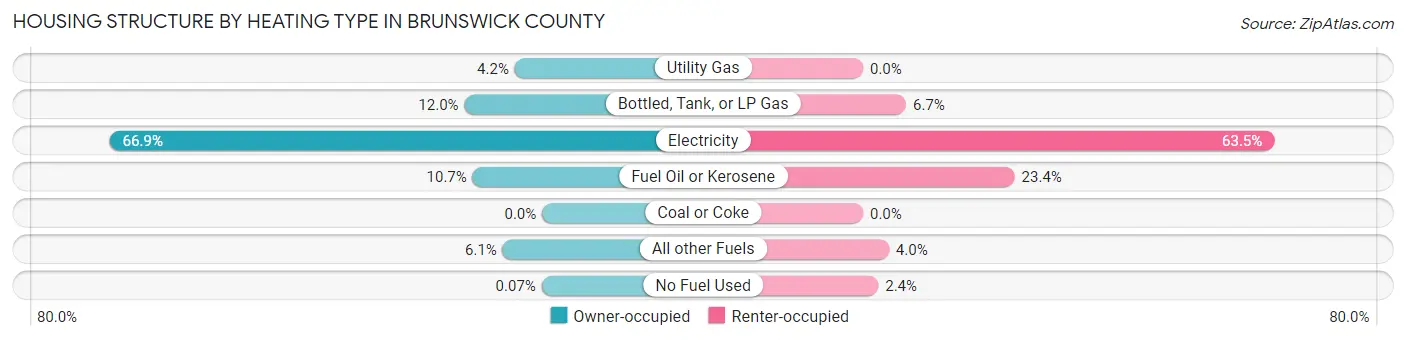
| Heating Type | Owner-occupied | Renter-occupied |
| Utility Gas | 191 (4.2%) | 0 (0.0%) |
| Bottled, Tank, or LP Gas | 542 (12.0%) | 110 (6.7%) |
| Electricity | 3,018 (66.9%) | 1,049 (63.5%) |
| Fuel Oil or Kerosene | 485 (10.7%) | 387 (23.4%) |
| Coal or Coke | 0 (0.0%) | 0 (0.0%) |
| All other Fuels | 275 (6.1%) | 66 (4.0%) |
| No Fuel Used | 3 (0.1%) | 39 (2.4%) |
| Total | 4,514 (100.0%) | 1,651 (100.0%) |
Household Vehicle Usage in Brunswick County
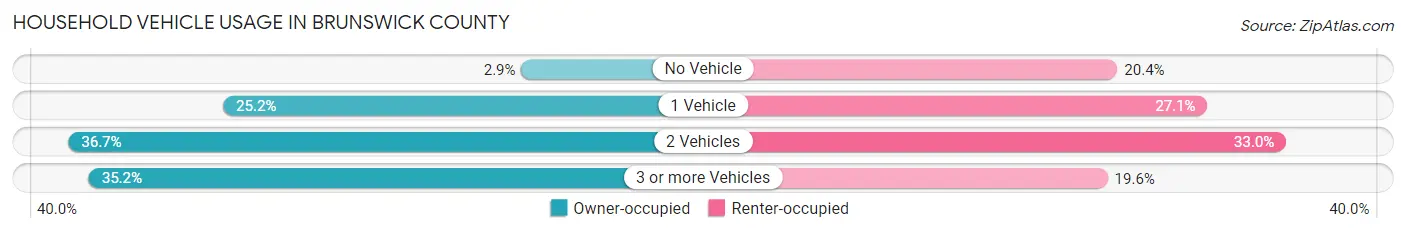
| Vehicles per Household | Owner-occupied | Renter-occupied |
| No Vehicle | 131 (2.9%) | 336 (20.3%) |
| 1 Vehicle | 1,136 (25.2%) | 447 (27.1%) |
| 2 Vehicles | 1,658 (36.7%) | 544 (33.0%) |
| 3 or more Vehicles | 1,589 (35.2%) | 324 (19.6%) |
| Total | 4,514 (100.0%) | 1,651 (100.0%) |
Real Estate & Mortgages in Brunswick County
Real Estate and Mortgage Overview in Brunswick County
| Characteristic | Without Mortgage | With Mortgage |
| Housing Units | 2,247 | 2,267 |
| Median Property Value | $97,000 | $157,400 |
| Median Household Income | $46,847 | $158 |
| Monthly Housing Costs | $382 | $23 |
| Real Estate Taxes | $576 | $64 |
Property Value by Mortgage Status in Brunswick County
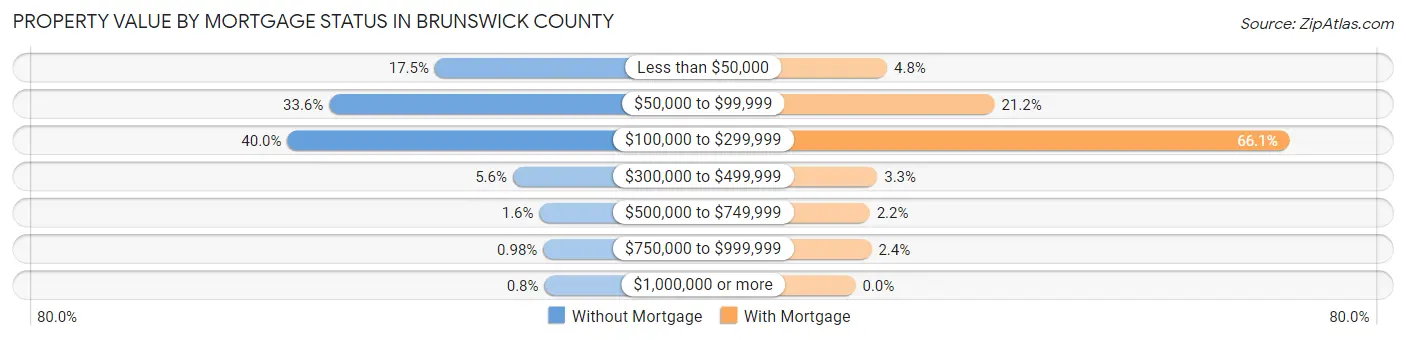
| Property Value | Without Mortgage | With Mortgage |
| Less than $50,000 | 393 (17.5%) | 109 (4.8%) |
| $50,000 to $99,999 | 755 (33.6%) | 480 (21.2%) |
| $100,000 to $299,999 | 898 (40.0%) | 1,499 (66.1%) |
| $300,000 to $499,999 | 126 (5.6%) | 75 (3.3%) |
| $500,000 to $749,999 | 35 (1.6%) | 49 (2.2%) |
| $750,000 to $999,999 | 22 (1.0%) | 55 (2.4%) |
| $1,000,000 or more | 18 (0.8%) | 0 (0.0%) |
| Total | 2,247 (100.0%) | 2,267 (100.0%) |
Household Income by Mortgage Status in Brunswick County
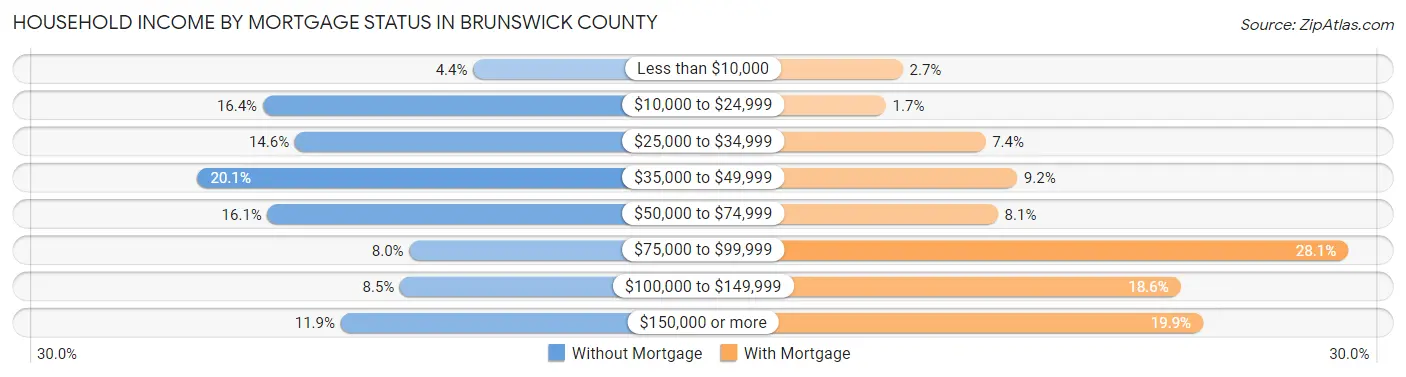
| Household Income | Without Mortgage | With Mortgage |
| Less than $10,000 | 98 (4.4%) | 61 (2.7%) |
| $10,000 to $24,999 | 368 (16.4%) | 39 (1.7%) |
| $25,000 to $34,999 | 327 (14.5%) | 168 (7.4%) |
| $35,000 to $49,999 | 452 (20.1%) | 209 (9.2%) |
| $50,000 to $74,999 | 362 (16.1%) | 184 (8.1%) |
| $75,000 to $99,999 | 180 (8.0%) | 638 (28.1%) |
| $100,000 to $149,999 | 192 (8.5%) | 421 (18.6%) |
| $150,000 or more | 268 (11.9%) | 450 (19.9%) |
| Total | 2,247 (100.0%) | 2,267 (100.0%) |
Property Value to Household Income Ratio in Brunswick County
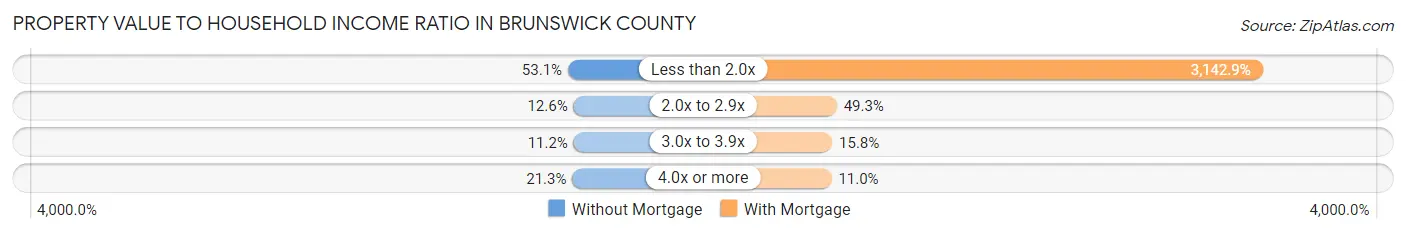
| Value-to-Income Ratio | Without Mortgage | With Mortgage |
| Less than 2.0x | 1,193 (53.1%) | 71,250 (3,142.9%) |
| 2.0x to 2.9x | 284 (12.6%) | 1,117 (49.3%) |
| 3.0x to 3.9x | 251 (11.2%) | 357 (15.8%) |
| 4.0x or more | 478 (21.3%) | 249 (11.0%) |
| Total | 2,247 (100.0%) | 2,267 (100.0%) |
Real Estate Taxes by Mortgage Status in Brunswick County
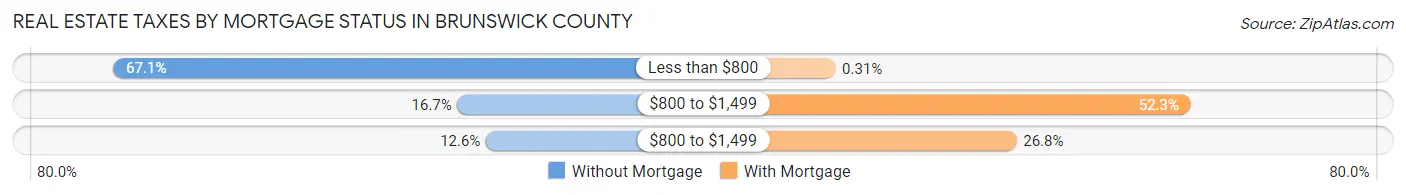
| Property Taxes | Without Mortgage | With Mortgage |
| Less than $800 | 1,507 (67.1%) | 7 (0.3%) |
| $800 to $1,499 | 376 (16.7%) | 1,185 (52.3%) |
| $800 to $1,499 | 282 (12.6%) | 607 (26.8%) |
| Total | 2,247 (100.0%) | 2,267 (100.0%) |
Health & Disability in Brunswick County
Health Insurance Coverage by Age in Brunswick County
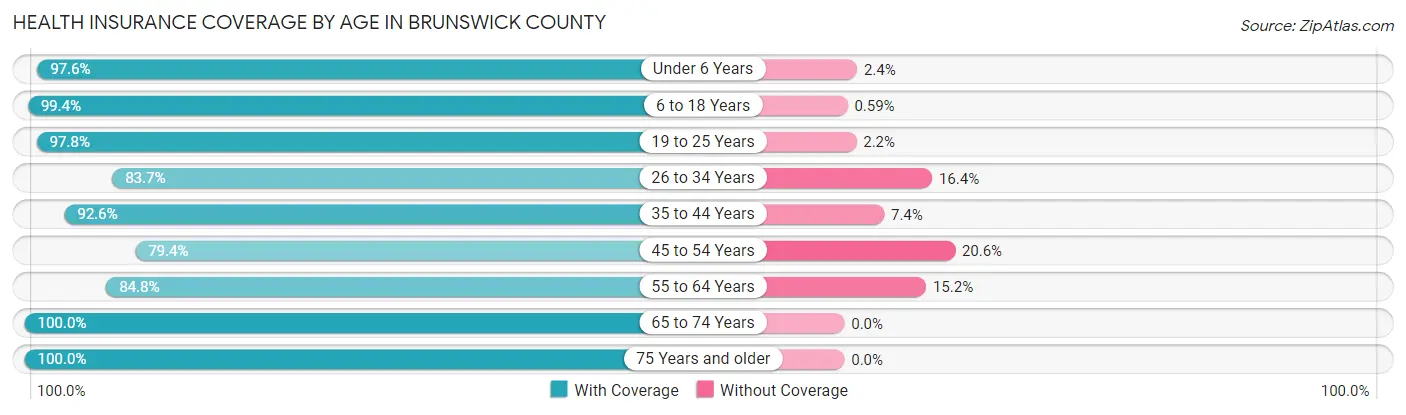
| Age Bracket | With Coverage | Without Coverage |
| Under 6 Years | 786 (97.6%) | 19 (2.4%) |
| 6 to 18 Years | 1,866 (99.4%) | 11 (0.6%) |
| 19 to 25 Years | 1,142 (97.8%) | 26 (2.2%) |
| 26 to 34 Years | 1,305 (83.7%) | 255 (16.4%) |
| 35 to 44 Years | 1,062 (92.6%) | 85 (7.4%) |
| 45 to 54 Years | 1,400 (79.4%) | 364 (20.6%) |
| 55 to 64 Years | 1,826 (84.8%) | 328 (15.2%) |
| 65 to 74 Years | 1,951 (100.0%) | 0 (0.0%) |
| 75 Years and older | 1,429 (100.0%) | 0 (0.0%) |
| Total | 12,767 (92.1%) | 1,088 (7.9%) |
Health Insurance Coverage by Citizenship Status in Brunswick County
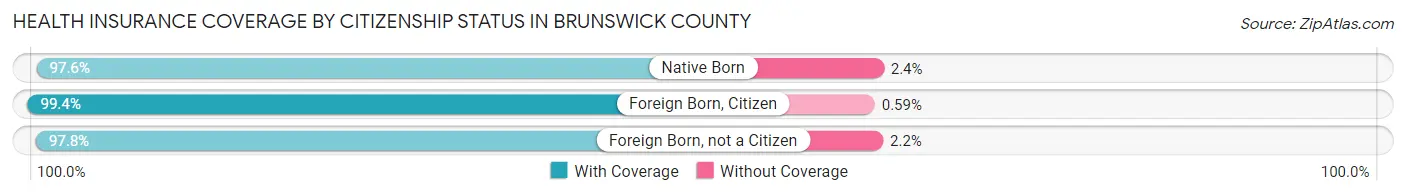
| Citizenship Status | With Coverage | Without Coverage |
| Native Born | 786 (97.6%) | 19 (2.4%) |
| Foreign Born, Citizen | 1,866 (99.4%) | 11 (0.6%) |
| Foreign Born, not a Citizen | 1,142 (97.8%) | 26 (2.2%) |
Health Insurance Coverage by Household Income in Brunswick County
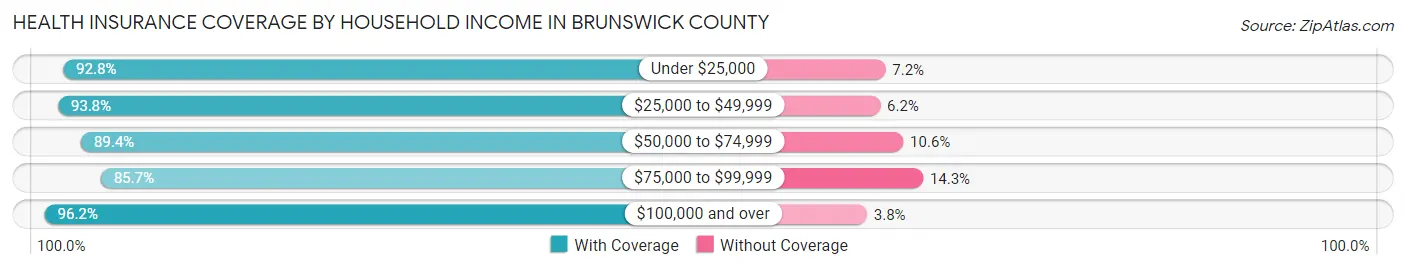
| Household Income | With Coverage | Without Coverage |
| Under $25,000 | 2,118 (92.8%) | 165 (7.2%) |
| $25,000 to $49,999 | 2,782 (93.8%) | 185 (6.2%) |
| $50,000 to $74,999 | 2,472 (89.4%) | 292 (10.6%) |
| $75,000 to $99,999 | 1,874 (85.7%) | 312 (14.3%) |
| $100,000 and over | 3,323 (96.2%) | 130 (3.8%) |
Public vs Private Health Insurance Coverage by Age in Brunswick County
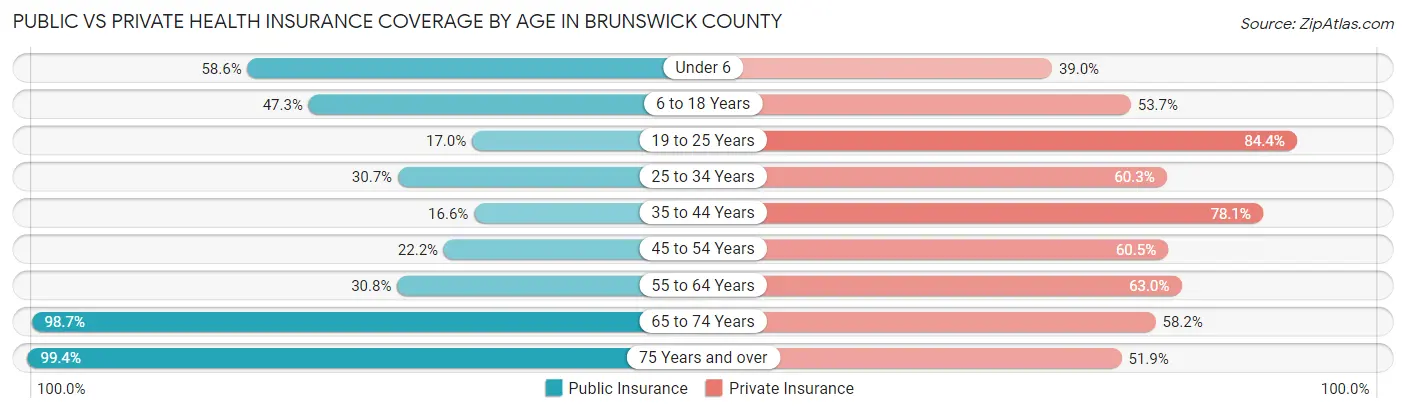
| Age Bracket | Public Insurance | Private Insurance |
| Under 6 | 472 (58.6%) | 314 (39.0%) |
| 6 to 18 Years | 887 (47.3%) | 1,007 (53.6%) |
| 19 to 25 Years | 198 (17.0%) | 986 (84.4%) |
| 25 to 34 Years | 479 (30.7%) | 940 (60.3%) |
| 35 to 44 Years | 190 (16.6%) | 896 (78.1%) |
| 45 to 54 Years | 391 (22.2%) | 1,068 (60.5%) |
| 55 to 64 Years | 664 (30.8%) | 1,357 (63.0%) |
| 65 to 74 Years | 1,926 (98.7%) | 1,136 (58.2%) |
| 75 Years and over | 1,421 (99.4%) | 742 (51.9%) |
| Total | 6,628 (47.8%) | 8,446 (61.0%) |
Disability Status by Sex by Age in Brunswick County
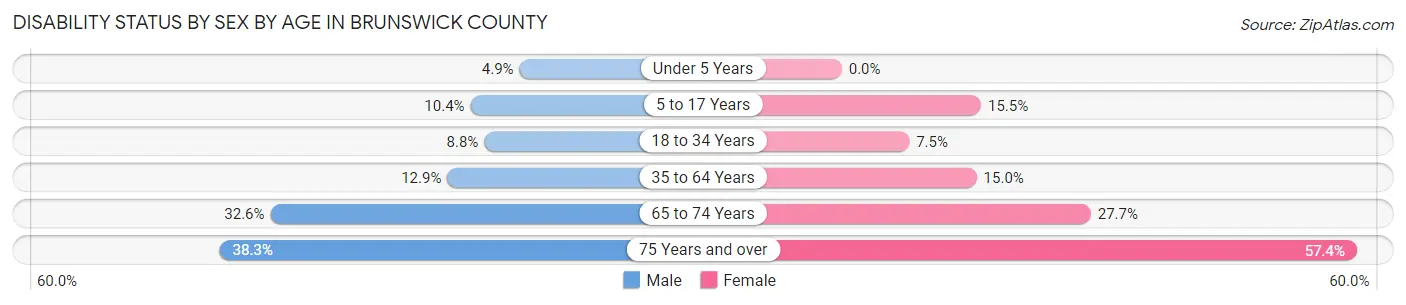
| Age Bracket | Male | Female |
| Under 5 Years | 16 (4.9%) | 0 (0.0%) |
| 5 to 17 Years | 85 (10.3%) | 157 (15.5%) |
| 18 to 34 Years | 152 (8.8%) | 90 (7.5%) |
| 35 to 64 Years | 284 (12.9%) | 431 (15.0%) |
| 65 to 74 Years | 293 (32.6%) | 292 (27.7%) |
| 75 Years and over | 250 (38.3%) | 445 (57.4%) |
Disability Class by Sex by Age in Brunswick County
Disability Class: Hearing Difficulty
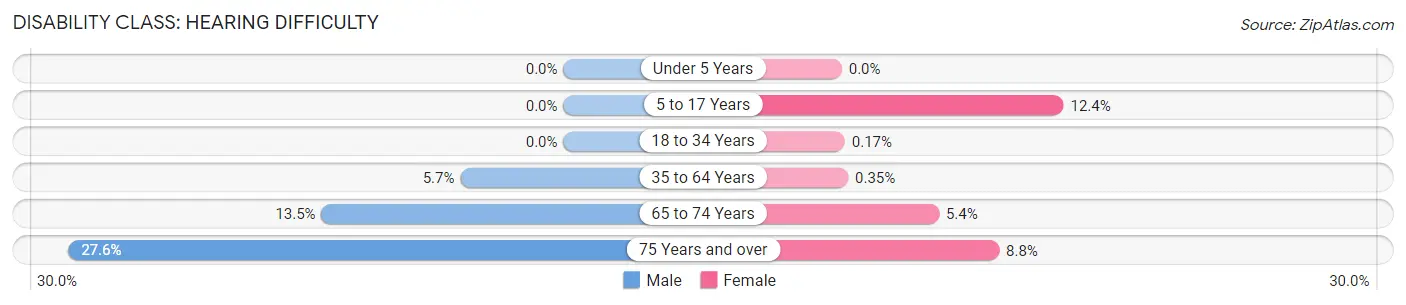
| Age Bracket | Male | Female |
| Under 5 Years | 0 (0.0%) | 0 (0.0%) |
| 5 to 17 Years | 0 (0.0%) | 125 (12.3%) |
| 18 to 34 Years | 0 (0.0%) | 2 (0.2%) |
| 35 to 64 Years | 126 (5.7%) | 10 (0.4%) |
| 65 to 74 Years | 121 (13.5%) | 57 (5.4%) |
| 75 Years and over | 180 (27.6%) | 68 (8.8%) |
Disability Class: Vision Difficulty
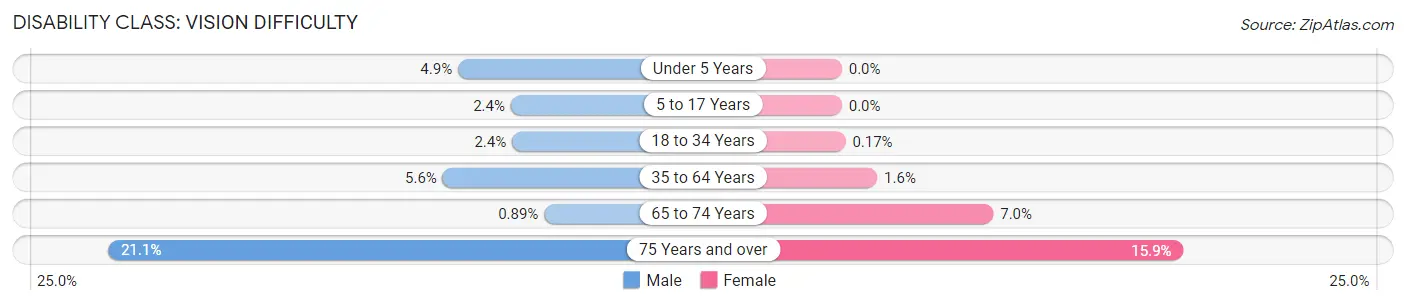
| Age Bracket | Male | Female |
| Under 5 Years | 16 (4.9%) | 0 (0.0%) |
| 5 to 17 Years | 20 (2.4%) | 0 (0.0%) |
| 18 to 34 Years | 41 (2.4%) | 2 (0.2%) |
| 35 to 64 Years | 123 (5.6%) | 47 (1.6%) |
| 65 to 74 Years | 8 (0.9%) | 74 (7.0%) |
| 75 Years and over | 138 (21.1%) | 123 (15.9%) |
Disability Class: Cognitive Difficulty
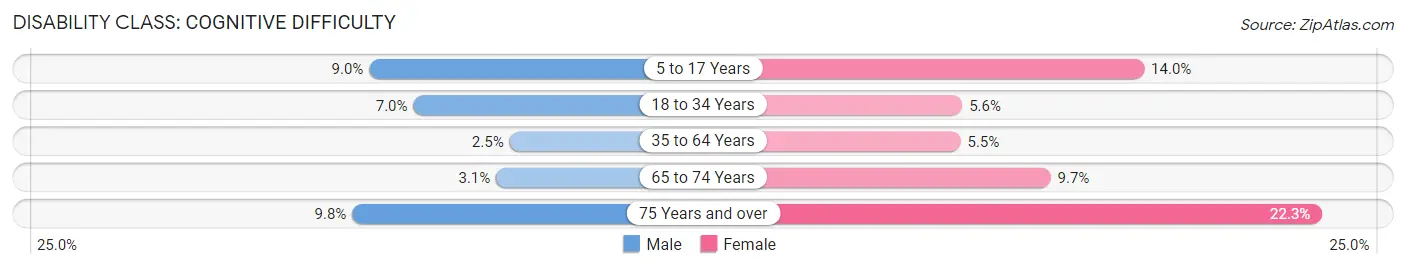
| Age Bracket | Male | Female |
| 5 to 17 Years | 74 (9.0%) | 142 (14.0%) |
| 18 to 34 Years | 120 (7.0%) | 67 (5.6%) |
| 35 to 64 Years | 55 (2.5%) | 158 (5.5%) |
| 65 to 74 Years | 28 (3.1%) | 102 (9.7%) |
| 75 Years and over | 64 (9.8%) | 173 (22.3%) |
Disability Class: Ambulatory Difficulty
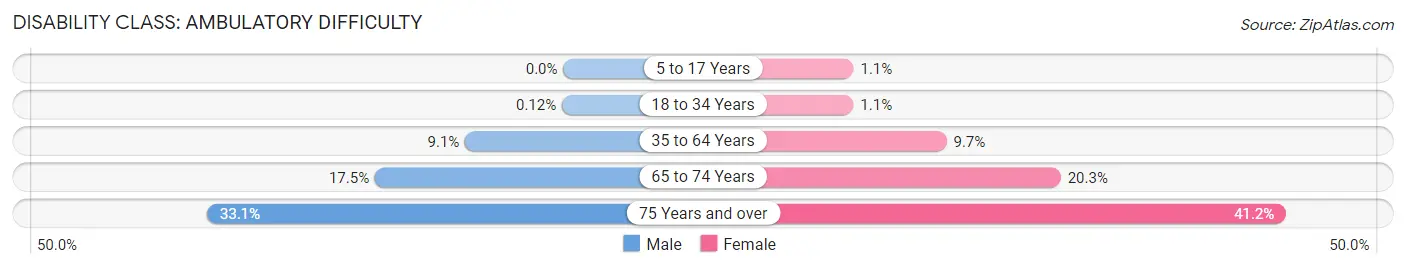
| Age Bracket | Male | Female |
| 5 to 17 Years | 0 (0.0%) | 11 (1.1%) |
| 18 to 34 Years | 2 (0.1%) | 13 (1.1%) |
| 35 to 64 Years | 200 (9.1%) | 279 (9.7%) |
| 65 to 74 Years | 157 (17.5%) | 214 (20.3%) |
| 75 Years and over | 216 (33.1%) | 320 (41.2%) |
Disability Class: Self-Care Difficulty
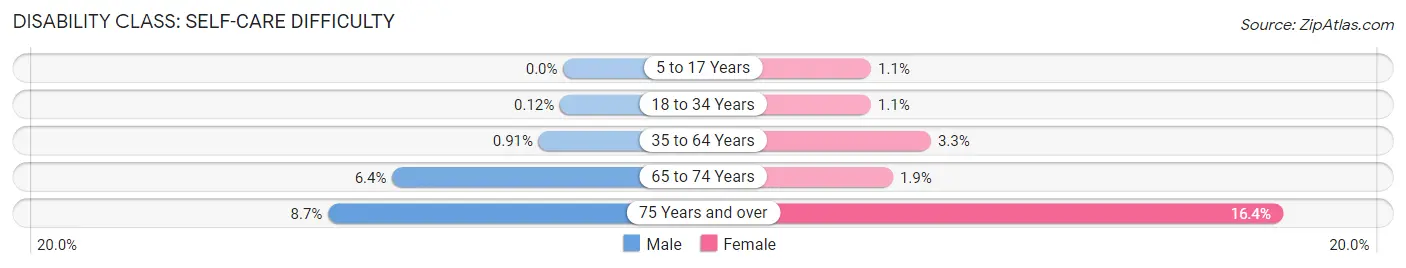
| Age Bracket | Male | Female |
| 5 to 17 Years | 0 (0.0%) | 11 (1.1%) |
| 18 to 34 Years | 2 (0.1%) | 13 (1.1%) |
| 35 to 64 Years | 20 (0.9%) | 95 (3.3%) |
| 65 to 74 Years | 57 (6.4%) | 20 (1.9%) |
| 75 Years and over | 57 (8.7%) | 127 (16.4%) |
Technology Access in Brunswick County
Computing Device Access in Brunswick County
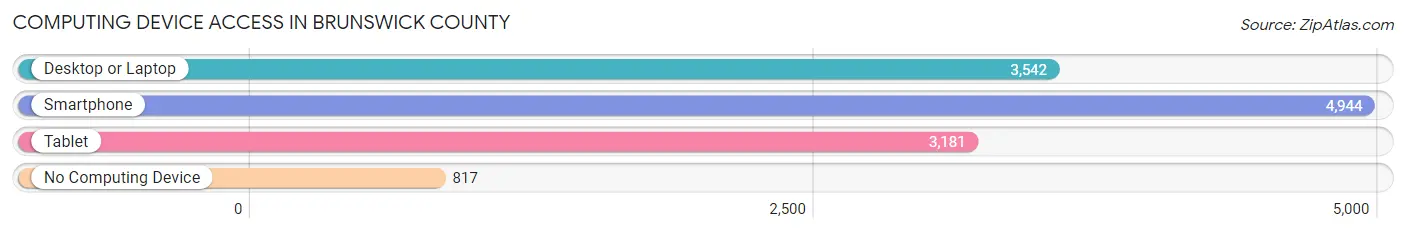
| Device Type | # Households | % Households |
| Desktop or Laptop | 3,542 | 57.5% |
| Smartphone | 4,944 | 80.2% |
| Tablet | 3,181 | 51.6% |
| No Computing Device | 817 | 13.3% |
| Total | 6,165 | 100.0% |
Internet Access in Brunswick County
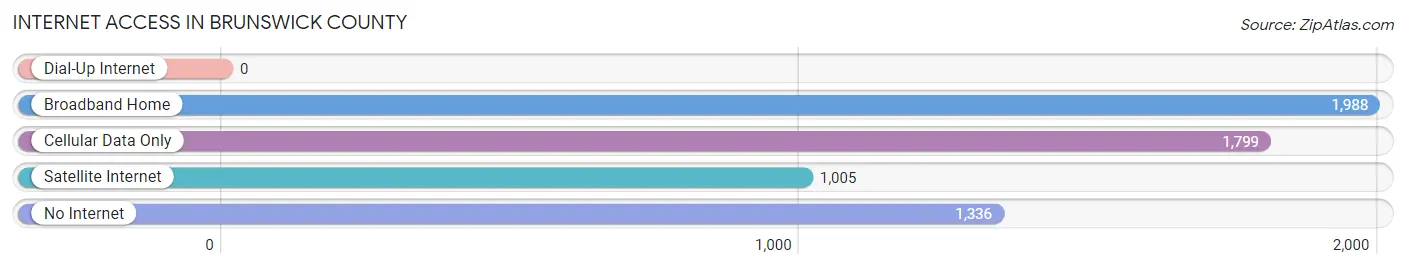
| Internet Type | # Households | % Households |
| Dial-Up Internet | 0 | 0.0% |
| Broadband Home | 1,988 | 32.3% |
| Cellular Data Only | 1,799 | 29.2% |
| Satellite Internet | 1,005 | 16.3% |
| No Internet | 1,336 | 21.7% |
| Total | 6,165 | 100.0% |
Brunswick County Summary
Brunswick County is a county located in the Commonwealth of Virginia. It is located in the south-central portion of the state, and is part of the Greater Richmond Region. As of the 2010 census, the population was 17,434. The county seat is Lawrenceville.
History
Brunswick County was formed in 1720 from Prince George County. It was named for the House of Brunswick, a German royal dynasty. The county was originally part of the vast area of Virginia known as the Southside, which was settled by English colonists in the early 17th century. The county was the site of several battles during the American Revolutionary War, including the Battle of Petersburg in 1781.
Geography
Brunswick County is located in south-central Virginia, and is bordered by Lunenburg County to the north, Mecklenburg County to the east, Greensville County to the south, and Nottoway County to the west. The county is located in the Piedmont region of Virginia, and is characterized by rolling hills and valleys. The Appomattox River forms the northern border of the county, and the Nottoway River forms the southern border.
The county has a total area of 441 square miles, of which 437 square miles is land and 4.2 square miles is water. The county is home to several state parks, including Staunton River State Park and Twin Lakes State Park.
Economy
Brunswick County has a diversified economy, with a mix of agriculture, manufacturing, and services. The county is home to several large employers, including the Brunswick County Public Schools, Brunswick County Hospital, and the Brunswick County Sheriff's Office.
Agriculture is an important part of the county's economy, with the county's farms producing a variety of crops, including corn, soybeans, wheat, and hay. The county is also home to several large poultry farms, which produce eggs and poultry products for the local market.
Manufacturing is also an important part of the county's economy, with several large factories located in the county. The largest employer in the county is the Brunswick County Industrial Park, which is home to several large manufacturing companies, including Brunswick Corporation, which produces recreational boats and marine engines.
Demographics
As of the 2010 census, there were 17,434 people, 6,845 households, and 4,845 families residing in the county. The population density was 39.7 people per square mile. The racial makeup of the county was 68.3% White, 28.2% African American, 0.4% Native American, 0.5% Asian, 0.1% Pacific Islander, 0.7% from other races, and 1.8% from two or more races. Hispanic or Latino of any race were 2.2% of the population.
The median income for a household in the county was $41,945, and the median income for a family was $50,945. The per capita income for the county was $20,945. About 11.3% of families and 14.2% of the population were below the poverty line, including 19.2% of those under age 18 and 11.2% of those age 65 or over.
Common Questions
What is Per Capita Income in Brunswick County?
Per Capita income in Brunswick County is $26,491.
What is the Median Family Income in Brunswick County?
Median Family Income in Brunswick County is $59,133.
What is the Median Household income in Brunswick County?
Median Household Income in Brunswick County is $52,678.
What is Income or Wage Gap in Brunswick County?
Income or Wage Gap in Brunswick County is 33.3%.
Women in Brunswick County earn 66.7 cents for every dollar earned by a man.
What is Family Income Deficit in Brunswick County?
Family Income Deficit in Brunswick County is $11,130.
Families that are below poverty line in Brunswick County earn $11,130 less on average than the poverty threshold level.
What is Inequality or Gini Index in Brunswick County?
Inequality or Gini Index in Brunswick County is 0.43.
What is the Total Population of Brunswick County?
Total Population of Brunswick County is 15,965.
What is the Total Male Population of Brunswick County?
Total Male Population of Brunswick County is 8,513.
What is the Total Female Population of Brunswick County?
Total Female Population of Brunswick County is 7,452.
What is the Ratio of Males per 100 Females in Brunswick County?
There are 114.24 Males per 100 Females in Brunswick County.
What is the Ratio of Females per 100 Males in Brunswick County?
There are 87.54 Females per 100 Males in Brunswick County.
What is the Median Population Age in Brunswick County?
Median Population Age in Brunswick County is 44.6 Years.
What is the Average Family Size in Brunswick County
Average Family Size in Brunswick County is 2.7 People.
What is the Average Household Size in Brunswick County
Average Household Size in Brunswick County is 2.2 People.
How Large is the Labor Force in Brunswick County?
There are 6,836 People in the Labor Forcein in Brunswick County.
What is the Percentage of People in the Labor Force in Brunswick County?
50.0% of People are in the Labor Force in Brunswick County.
What is the Unemployment Rate in Brunswick County?
Unemployment Rate in Brunswick County is 5.2%.