Bedford County, VA Map & Demographics
Bedford County Map
Bedford County Overview
$40,552
PER CAPITA INCOME
$87,064
AVG FAMILY INCOME
$74,773
AVG HOUSEHOLD INCOME
31.8%
WAGE / INCOME GAP [ % ]
68.2¢/ $1
WAGE / INCOME GAP [ $ ]
$9,488
FAMILY INCOME DEFICIT
0.44
INEQUALITY / GINI INDEX
79,761
TOTAL POPULATION
39,452
MALE POPULATION
40,309
FEMALE POPULATION
97.87
MALES / 100 FEMALES
102.17
FEMALES / 100 MALES
46.8
MEDIAN AGE
2.9
AVG FAMILY SIZE
2.4
AVG HOUSEHOLD SIZE
38,348
LABOR FORCE [ PEOPLE ]
57.9%
PERCENT IN LABOR FORCE
2.9%
UNEMPLOYMENT RATE
Income in Bedford County
Income Overview in Bedford County
Per Capita Income in Bedford County is $40,552, while median incomes of families and households are $87,064 and $74,773 respectively.
| Characteristic | Number | Measure |
| Per Capita Income | 79,761 | $40,552 |
| Median Family Income | 22,911 | $87,064 |
| Mean Family Income | 22,911 | $110,137 |
| Median Household Income | 32,510 | $74,773 |
| Mean Household Income | 32,510 | $98,237 |
| Income Deficit | 22,911 | $9,488 |
| Wage / Income Gap (%) | 79,761 | 31.83% |
| Wage / Income Gap ($) | 79,761 | 68.17¢ per $1 |
| Gini / Inequality Index | 79,761 | 0.44 |
Earnings by Sex in Bedford County
Average Earnings in Bedford County are $44,508, $51,730 for men and $35,262 for women, a difference of 31.8%.

| Sex | Number | Average Earnings |
| Male | 22,134 (55.2%) | $51,730 |
| Female | 17,961 (44.8%) | $35,262 |
| Total | 40,095 (100.0%) | $44,508 |
Earnings by Sex by Income Bracket in Bedford County
The most common earnings brackets in Bedford County are $100,000+ for men (4,007 | 18.1%) and $75,000 to $99,999 for women (1,375 | 7.7%).
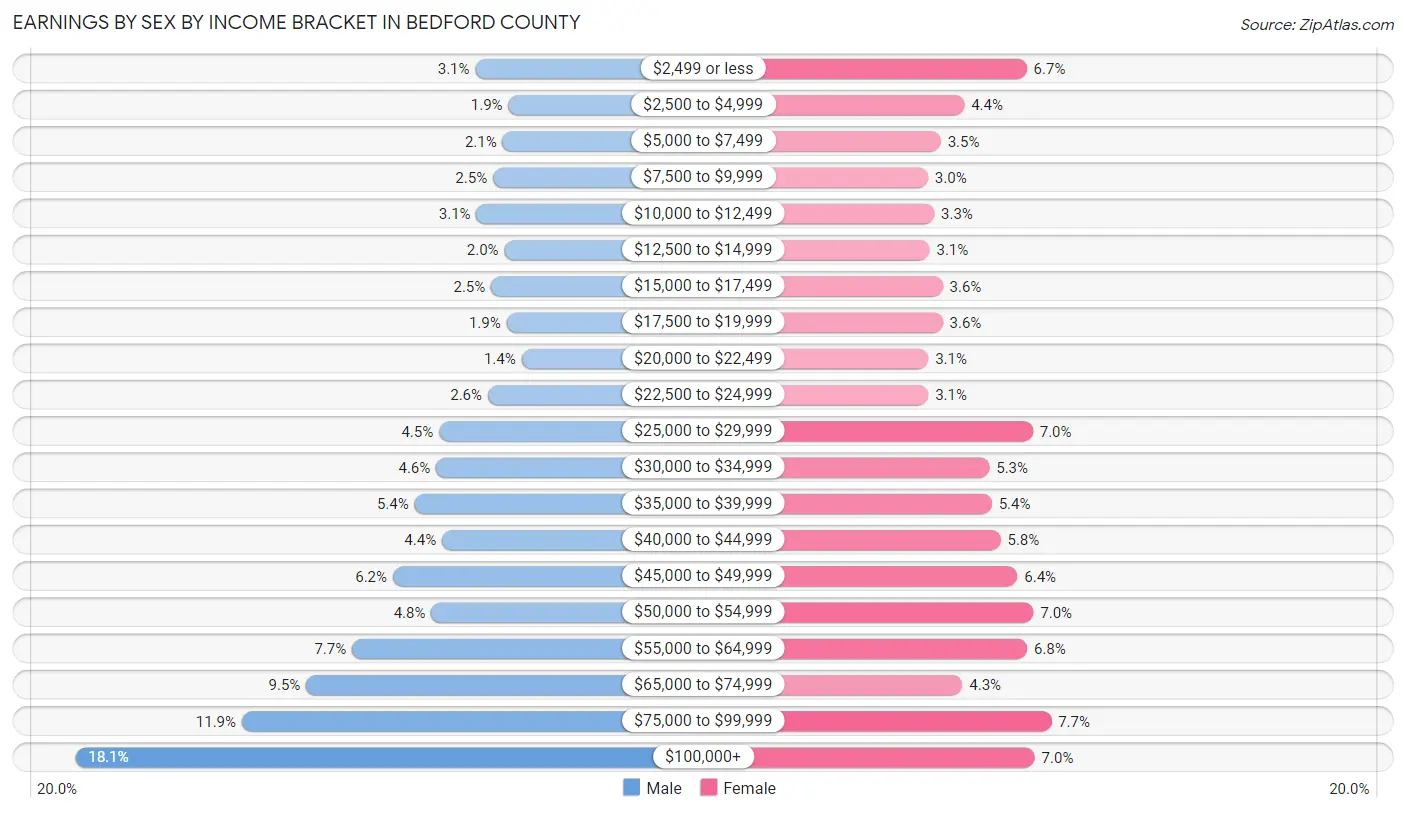
| Income | Male | Female |
| $2,499 or less | 688 (3.1%) | 1,211 (6.7%) |
| $2,500 to $4,999 | 415 (1.9%) | 791 (4.4%) |
| $5,000 to $7,499 | 463 (2.1%) | 632 (3.5%) |
| $7,500 to $9,999 | 543 (2.5%) | 546 (3.0%) |
| $10,000 to $12,499 | 680 (3.1%) | 588 (3.3%) |
| $12,500 to $14,999 | 447 (2.0%) | 556 (3.1%) |
| $15,000 to $17,499 | 558 (2.5%) | 645 (3.6%) |
| $17,500 to $19,999 | 430 (1.9%) | 645 (3.6%) |
| $20,000 to $22,499 | 306 (1.4%) | 547 (3.0%) |
| $22,500 to $24,999 | 584 (2.6%) | 548 (3.0%) |
| $25,000 to $29,999 | 989 (4.5%) | 1,252 (7.0%) |
| $30,000 to $34,999 | 1,014 (4.6%) | 960 (5.3%) |
| $35,000 to $39,999 | 1,193 (5.4%) | 976 (5.4%) |
| $40,000 to $44,999 | 965 (4.4%) | 1,034 (5.8%) |
| $45,000 to $49,999 | 1,372 (6.2%) | 1,147 (6.4%) |
| $50,000 to $54,999 | 1,054 (4.8%) | 1,255 (7.0%) |
| $55,000 to $64,999 | 1,711 (7.7%) | 1,212 (6.8%) |
| $65,000 to $74,999 | 2,091 (9.5%) | 777 (4.3%) |
| $75,000 to $99,999 | 2,624 (11.9%) | 1,375 (7.7%) |
| $100,000+ | 4,007 (18.1%) | 1,264 (7.0%) |
| Total | 22,134 (100.0%) | 17,961 (100.0%) |
Earnings by Sex by Educational Attainment in Bedford County
Average earnings in Bedford County are $60,346 for men and $40,244 for women, a difference of 33.3%. Men with an educational attainment of graduate degree enjoy the highest average annual earnings of $86,364, while those with less than high school education earn the least with $39,659. Women with an educational attainment of graduate degree earn the most with the average annual earnings of $59,087, while those with less than high school education have the smallest earnings of $20,841.
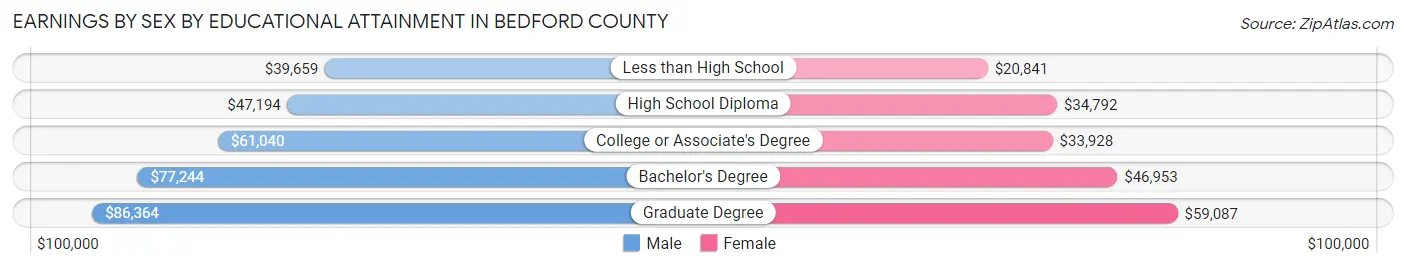
| Educational Attainment | Male Income | Female Income |
| Less than High School | $39,659 | $20,841 |
| High School Diploma | $47,194 | $34,792 |
| College or Associate's Degree | $61,040 | $33,928 |
| Bachelor's Degree | $77,244 | $46,953 |
| Graduate Degree | $86,364 | $59,087 |
| Total | $60,346 | $40,244 |
Family Income in Bedford County
Family Income Brackets in Bedford County
According to the Bedford County family income data, there are 4,926 families falling into the $100,000 to $149,999 income range, which is the most common income bracket and makes up 21.5% of all families. Conversely, the $10,000 to $14,999 income bracket is the least frequent group with only 252 families (1.1%) belonging to this category.
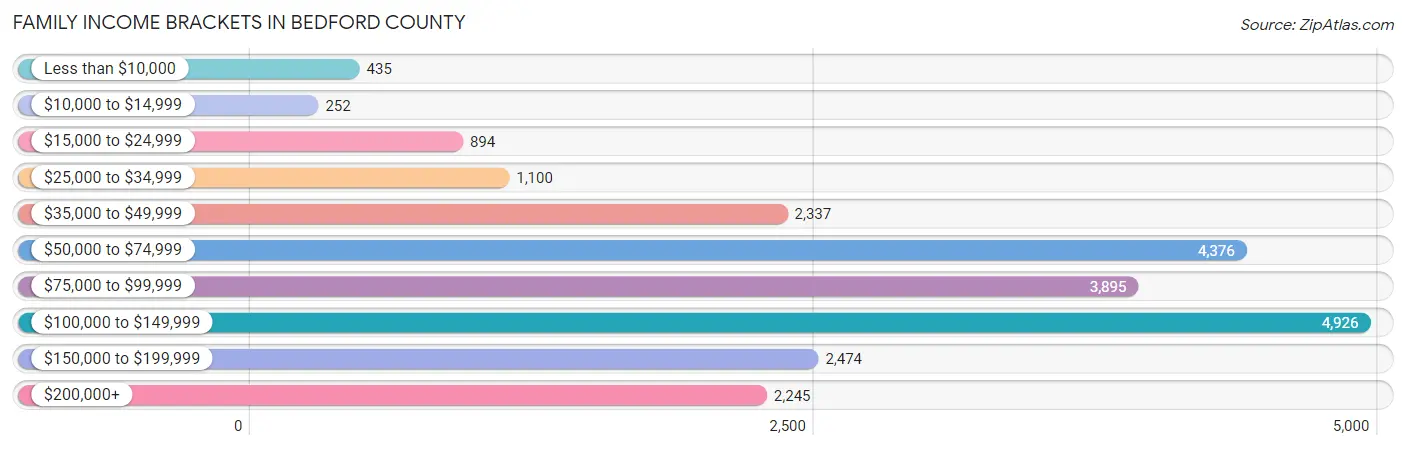
| Income Bracket | # Families | % Families |
| Less than $10,000 | 435 | 1.9% |
| $10,000 to $14,999 | 252 | 1.1% |
| $15,000 to $24,999 | 894 | 3.9% |
| $25,000 to $34,999 | 1,100 | 4.8% |
| $35,000 to $49,999 | 2,337 | 10.2% |
| $50,000 to $74,999 | 4,376 | 19.1% |
| $75,000 to $99,999 | 3,895 | 17.0% |
| $100,000 to $149,999 | 4,926 | 21.5% |
| $150,000 to $199,999 | 2,474 | 10.8% |
| $200,000+ | 2,245 | 9.8% |
Family Income by Famaliy Size in Bedford County
6-person families (620 | 2.7%) account for the highest median family income in Bedford County with $122,623 per family, while 2-person families (13,047 | 57.0%) have the highest median income of $40,402 per family member.
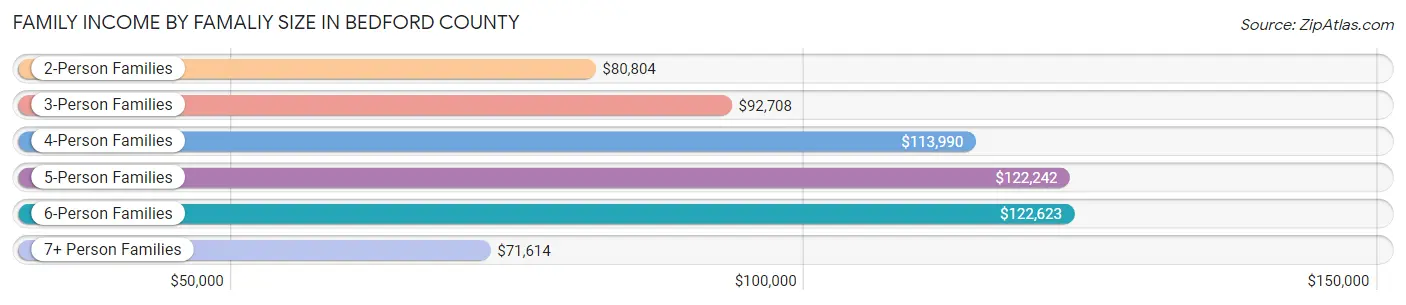
| Income Bracket | # Families | Median Income |
| 2-Person Families | 13,047 (57.0%) | $80,804 |
| 3-Person Families | 4,091 (17.9%) | $92,708 |
| 4-Person Families | 3,364 (14.7%) | $113,990 |
| 5-Person Families | 1,303 (5.7%) | $122,242 |
| 6-Person Families | 620 (2.7%) | $122,623 |
| 7+ Person Families | 486 (2.1%) | $71,614 |
| Total | 22,911 (100.0%) | $87,064 |
Family Income by Number of Earners in Bedford County
The median family income in Bedford County is $87,064, with families comprising 3+ earners (2,101) having the highest median family income of $142,587, while families with no earners (4,849) have the lowest median family income of $57,910, accounting for 9.2% and 21.2% of families, respectively.
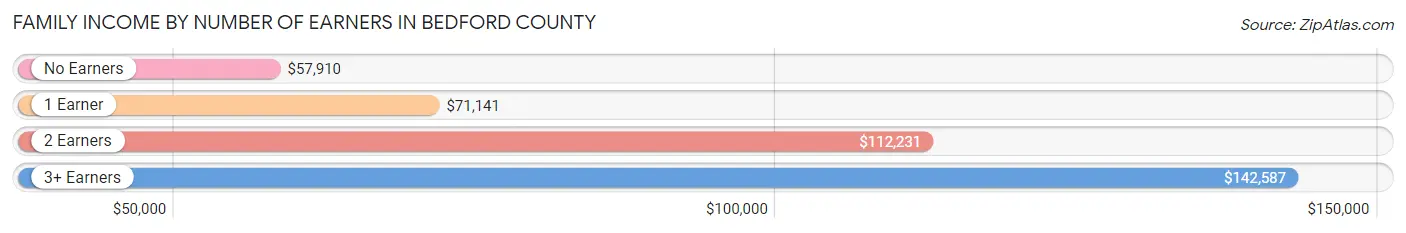
| Number of Earners | # Families | Median Income |
| No Earners | 4,849 (21.2%) | $57,910 |
| 1 Earner | 6,978 (30.5%) | $71,141 |
| 2 Earners | 8,983 (39.2%) | $112,231 |
| 3+ Earners | 2,101 (9.2%) | $142,587 |
| Total | 22,911 (100.0%) | $87,064 |
Household Income in Bedford County
Household Income Brackets in Bedford County
With 6,144 households falling in the category, the $100,000 to $149,999 income range is the most frequent in Bedford County, accounting for 18.9% of all households. In contrast, only 975 households (3.0%) fall into the less than $10,000 income bracket, making it the least populous group.
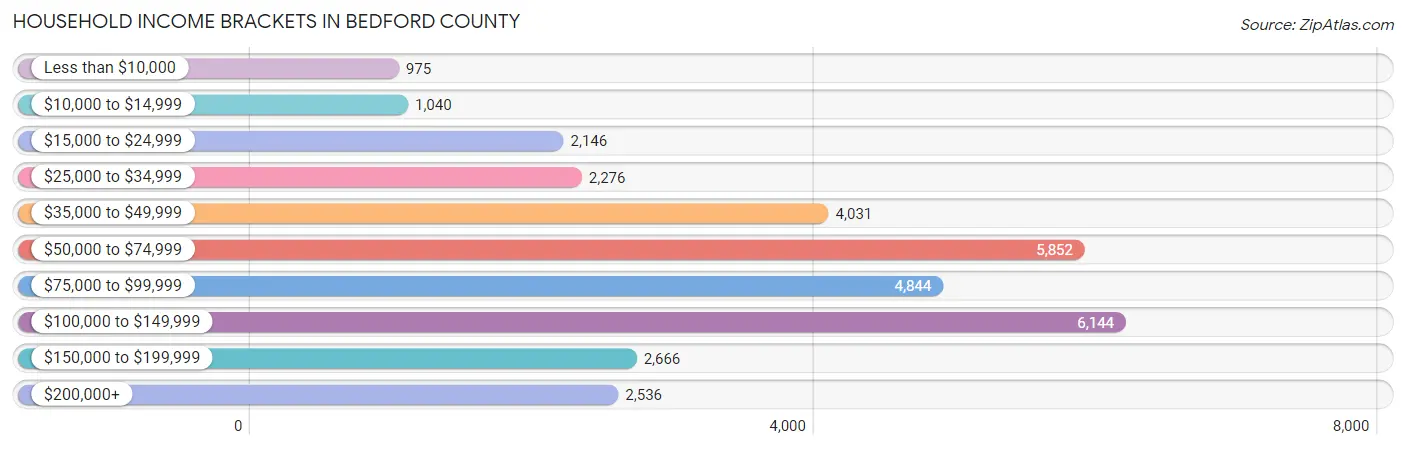
| Income Bracket | # Households | % Households |
| Less than $10,000 | 975 | 3.0% |
| $10,000 to $14,999 | 1,040 | 3.2% |
| $15,000 to $24,999 | 2,146 | 6.6% |
| $25,000 to $34,999 | 2,276 | 7.0% |
| $35,000 to $49,999 | 4,031 | 12.4% |
| $50,000 to $74,999 | 5,852 | 18.0% |
| $75,000 to $99,999 | 4,844 | 14.9% |
| $100,000 to $149,999 | 6,144 | 18.9% |
| $150,000 to $199,999 | 2,666 | 8.2% |
| $200,000+ | 2,536 | 7.8% |
Household Income by Householder Age in Bedford County
The median household income in Bedford County is $74,773, with the highest median household income of $88,961 found in the 25 to 44 years age bracket for the primary householder. A total of 7,649 households (23.5%) fall into this category. Meanwhile, the 15 to 24 years age bracket for the primary householder has the lowest median household income of $48,789, with 885 households (2.7%) in this group.
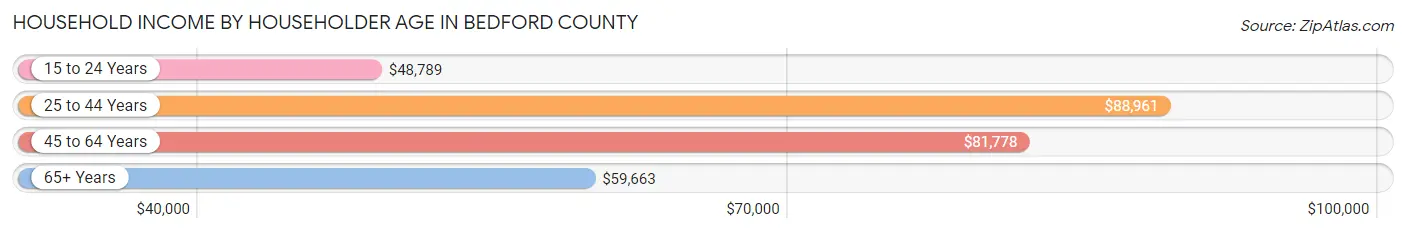
| Income Bracket | # Households | Median Income |
| 15 to 24 Years | 885 (2.7%) | $48,789 |
| 25 to 44 Years | 7,649 (23.5%) | $88,961 |
| 45 to 64 Years | 13,199 (40.6%) | $81,778 |
| 65+ Years | 10,777 (33.2%) | $59,663 |
| Total | 32,510 (100.0%) | $74,773 |
Poverty in Bedford County
Income Below Poverty by Sex and Age in Bedford County
With 8.3% poverty level for males and 9.8% for females among the residents of Bedford County, 15 year old males and 12 to 14 year old females are the most vulnerable to poverty, with 85 males (18.5%) and 236 females (17.3%) in their respective age groups living below the poverty level.
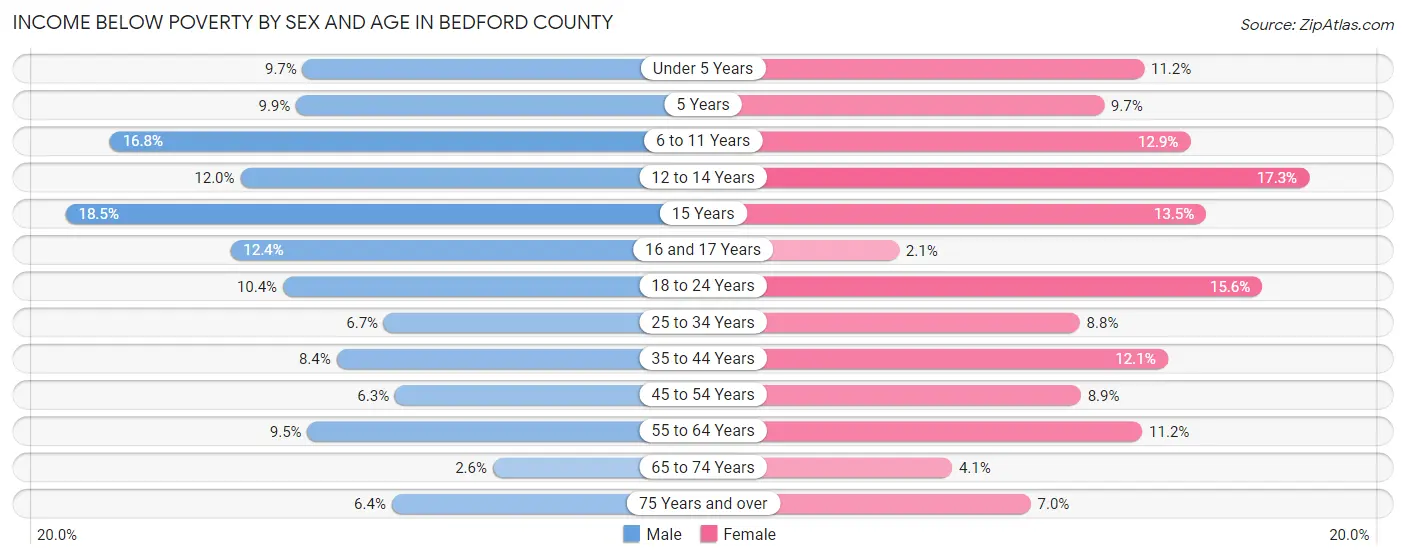
| Age Bracket | Male | Female |
| Under 5 Years | 161 (9.7%) | 201 (11.2%) |
| 5 Years | 79 (9.9%) | 44 (9.7%) |
| 6 to 11 Years | 454 (16.8%) | 310 (12.9%) |
| 12 to 14 Years | 132 (12.0%) | 236 (17.3%) |
| 15 Years | 85 (18.5%) | 63 (13.5%) |
| 16 and 17 Years | 124 (12.4%) | 23 (2.1%) |
| 18 to 24 Years | 319 (10.4%) | 459 (15.6%) |
| 25 to 34 Years | 274 (6.7%) | 350 (8.8%) |
| 35 to 44 Years | 355 (8.4%) | 509 (12.1%) |
| 45 to 54 Years | 329 (6.2%) | 484 (8.9%) |
| 55 to 64 Years | 619 (9.5%) | 734 (11.2%) |
| 65 to 74 Years | 135 (2.6%) | 219 (4.1%) |
| 75 Years and over | 197 (6.4%) | 266 (7.0%) |
| Total | 3,263 (8.3%) | 3,898 (9.8%) |
Income Above Poverty by Sex and Age in Bedford County
According to the poverty statistics in Bedford County, males aged 65 to 74 years and females aged 16 and 17 years are the age groups that are most secure financially, with 97.4% of males and 97.9% of females in these age groups living above the poverty line.
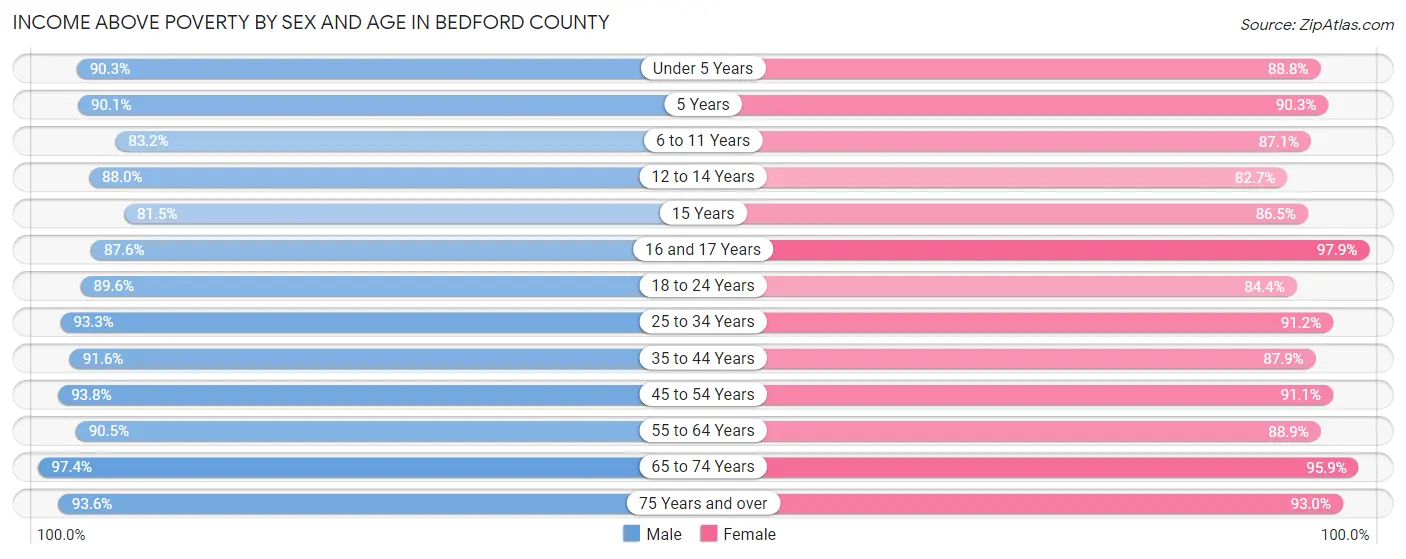
| Age Bracket | Male | Female |
| Under 5 Years | 1,502 (90.3%) | 1,590 (88.8%) |
| 5 Years | 717 (90.1%) | 408 (90.3%) |
| 6 to 11 Years | 2,242 (83.2%) | 2,088 (87.1%) |
| 12 to 14 Years | 969 (88.0%) | 1,125 (82.7%) |
| 15 Years | 375 (81.5%) | 403 (86.5%) |
| 16 and 17 Years | 879 (87.6%) | 1,063 (97.9%) |
| 18 to 24 Years | 2,744 (89.6%) | 2,483 (84.4%) |
| 25 to 34 Years | 3,838 (93.3%) | 3,615 (91.2%) |
| 35 to 44 Years | 3,859 (91.6%) | 3,702 (87.9%) |
| 45 to 54 Years | 4,933 (93.8%) | 4,970 (91.1%) |
| 55 to 64 Years | 5,896 (90.5%) | 5,849 (88.8%) |
| 65 to 74 Years | 5,013 (97.4%) | 5,135 (95.9%) |
| 75 Years and over | 2,895 (93.6%) | 3,531 (93.0%) |
| Total | 35,862 (91.7%) | 35,962 (90.2%) |
Income Below Poverty Among Married-Couple Families in Bedford County
The poverty statistics for married-couple families in Bedford County show that 3.7% or 717 of the total 19,222 families live below the poverty line. Families with 5 or more children have the highest poverty rate of 33.0%, comprising of 116 families. On the other hand, families with no children have the lowest poverty rate of 2.9%, which includes 382 families.
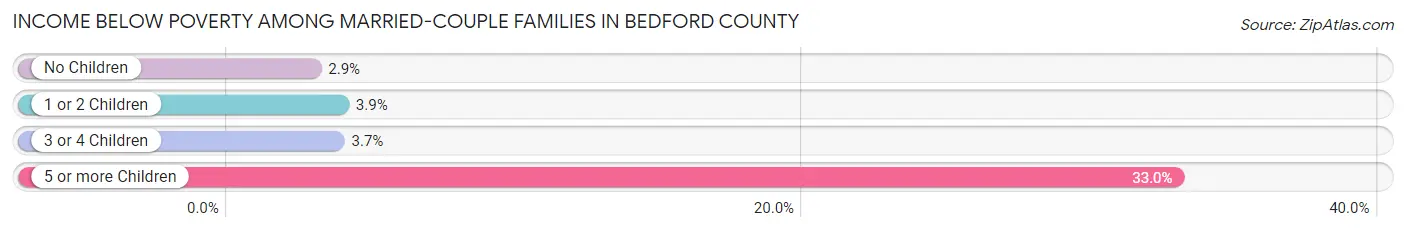
| Children | Above Poverty | Below Poverty |
| No Children | 12,771 (97.1%) | 382 (2.9%) |
| 1 or 2 Children | 4,461 (96.1%) | 179 (3.9%) |
| 3 or 4 Children | 1,037 (96.3%) | 40 (3.7%) |
| 5 or more Children | 236 (67.0%) | 116 (33.0%) |
| Total | 18,505 (96.3%) | 717 (3.7%) |
Income Below Poverty Among Single-Parent Households in Bedford County
According to the poverty data in Bedford County, 10.1% or 130 single-father households and 20.7% or 495 single-mother households are living below the poverty line. Among single-father households, those with 3 or 4 children have the highest poverty rate, with 20 households (33.9%) experiencing poverty. Likewise, among single-mother households, those with 1 or 2 children have the highest poverty rate, with 361 households (29.7%) falling below the poverty line.
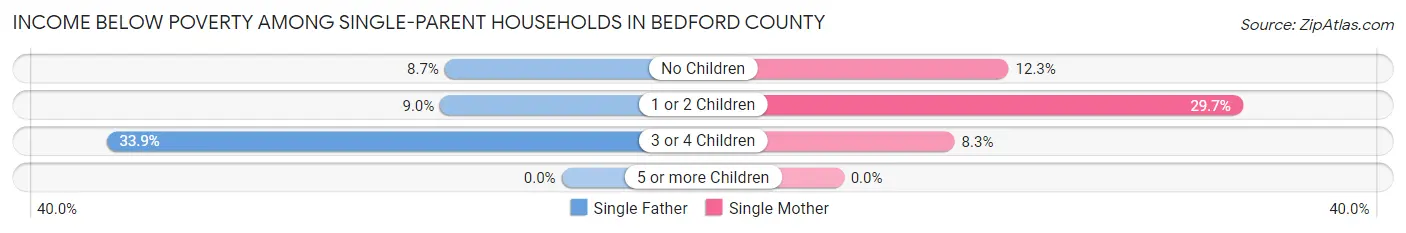
| Children | Single Father | Single Mother |
| No Children | 40 (8.7%) | 111 (12.3%) |
| 1 or 2 Children | 70 (9.0%) | 361 (29.7%) |
| 3 or 4 Children | 20 (33.9%) | 23 (8.3%) |
| 5 or more Children | 0 (0.0%) | 0 (0.0%) |
| Total | 130 (10.1%) | 495 (20.7%) |
Income Below Poverty Among Married-Couple vs Single-Parent Households in Bedford County
The poverty data for Bedford County shows that 717 of the married-couple family households (3.7%) and 625 of the single-parent households (16.9%) are living below the poverty level. Within the married-couple family households, those with 5 or more children have the highest poverty rate, with 116 households (33.0%) falling below the poverty line. Among the single-parent households, those with 1 or 2 children have the highest poverty rate, with 431 household (21.7%) living below poverty.
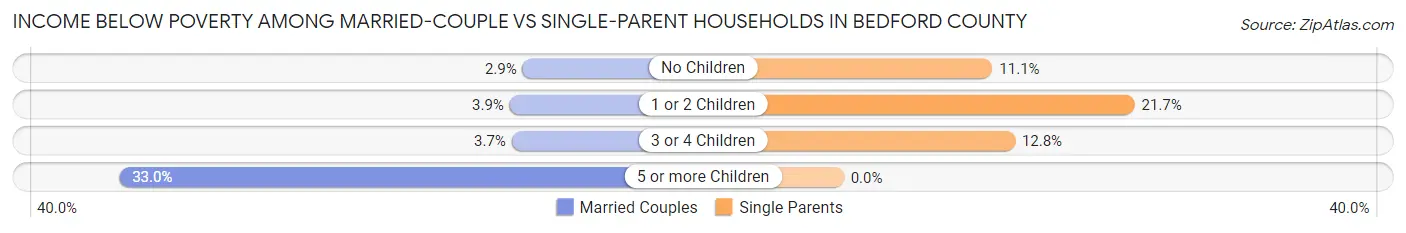
| Children | Married-Couple Families | Single-Parent Households |
| No Children | 382 (2.9%) | 151 (11.1%) |
| 1 or 2 Children | 179 (3.9%) | 431 (21.7%) |
| 3 or 4 Children | 40 (3.7%) | 43 (12.8%) |
| 5 or more Children | 116 (33.0%) | 0 (0.0%) |
| Total | 717 (3.7%) | 625 (16.9%) |
Race in Bedford County
The most populous races in Bedford County are White / Caucasian (69,564 | 87.2%), Black / African American (4,925 | 6.2%), and Two or more Races (3,228 | 4.1%).
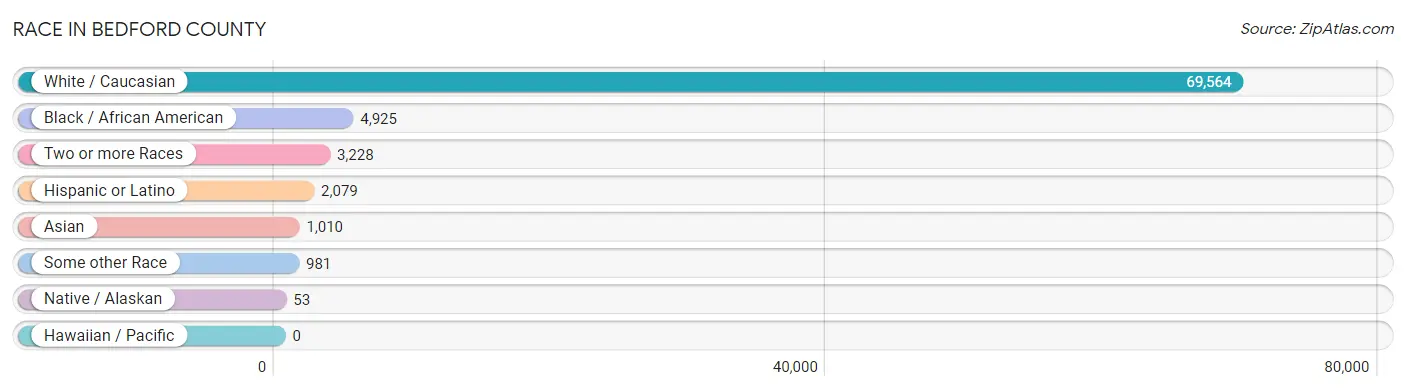
| Race | # Population | % Population |
| Asian | 1,010 | 1.3% |
| Black / African American | 4,925 | 6.2% |
| Hawaiian / Pacific | 0 | 0.0% |
| Hispanic or Latino | 2,079 | 2.6% |
| Native / Alaskan | 53 | 0.1% |
| White / Caucasian | 69,564 | 87.2% |
| Two or more Races | 3,228 | 4.1% |
| Some other Race | 981 | 1.2% |
| Total | 79,761 | 100.0% |
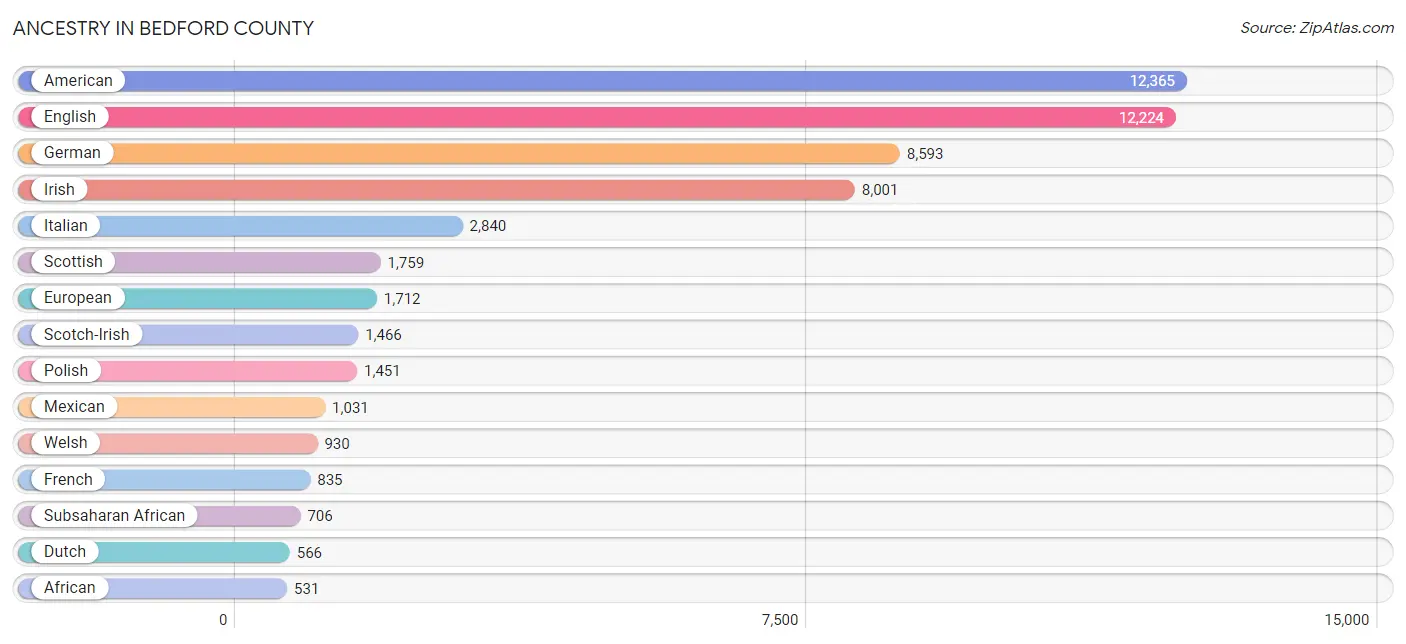
Ancestry in Bedford County
The most populous ancestries reported in Bedford County are American (12,365 | 15.5%), English (12,224 | 15.3%), German (8,593 | 10.8%), Irish (8,001 | 10.0%), and Italian (2,840 | 3.6%), together accounting for 55.2% of all Bedford County residents.
| Ancestry | # Population | % Population |
| Afghan | 5 | 0.0% |
| African | 531 | 0.7% |
| American | 12,365 | 15.5% |
| Arab | 186 | 0.2% |
| Argentinean | 7 | 0.0% |
| Armenian | 19 | 0.0% |
| Austrian | 81 | 0.1% |
| Bahamian | 3 | 0.0% |
| Basque | 15 | 0.0% |
| Belgian | 40 | 0.1% |
| Bhutanese | 235 | 0.3% |
| Blackfeet | 16 | 0.0% |
| Brazilian | 24 | 0.0% |
| British | 523 | 0.7% |
| Bulgarian | 20 | 0.0% |
| Burmese | 50 | 0.1% |
| Canadian | 87 | 0.1% |
| Cape Verdean | 11 | 0.0% |
| Central American | 203 | 0.3% |
| Cherokee | 245 | 0.3% |
| Chilean | 5 | 0.0% |
| Choctaw | 24 | 0.0% |
| Colombian | 152 | 0.2% |
| Costa Rican | 7 | 0.0% |
| Cuban | 75 | 0.1% |
| Czech | 207 | 0.3% |
| Czechoslovakian | 37 | 0.1% |
| Danish | 118 | 0.2% |
| Dutch | 566 | 0.7% |
| Eastern European | 158 | 0.2% |
| Egyptian | 16 | 0.0% |
| English | 12,224 | 15.3% |
| Ethiopian | 14 | 0.0% |
| European | 1,712 | 2.1% |
| Finnish | 45 | 0.1% |
| French | 835 | 1.1% |
| French Canadian | 249 | 0.3% |
| German | 8,593 | 10.8% |
| Greek | 117 | 0.2% |
| Guatemalan | 19 | 0.0% |
| Haitian | 63 | 0.1% |
| Honduran | 63 | 0.1% |
| Hungarian | 171 | 0.2% |
| Indian (Asian) | 162 | 0.2% |
| Iranian | 4 | 0.0% |
| Irish | 8,001 | 10.0% |
| Iroquois | 6 | 0.0% |
| Italian | 2,840 | 3.6% |
| Jamaican | 39 | 0.1% |
| Japanese | 54 | 0.1% |
| Kenyan | 29 | 0.0% |
| Korean | 500 | 0.6% |
| Laotian | 3 | 0.0% |
| Latvian | 26 | 0.0% |
| Lebanese | 137 | 0.2% |
| Lithuanian | 80 | 0.1% |
| Luxembourger | 57 | 0.1% |
| Mexican | 1,031 | 1.3% |
| Native Hawaiian | 28 | 0.0% |
| Navajo | 5 | 0.0% |
| Nicaraguan | 8 | 0.0% |
| Nigerian | 18 | 0.0% |
| Northern European | 57 | 0.1% |
| Norwegian | 407 | 0.5% |
| Okinawan | 7 | 0.0% |
| Pakistani | 50 | 0.1% |
| Pennsylvania German | 48 | 0.1% |
| Peruvian | 172 | 0.2% |
| Polish | 1,451 | 1.8% |
| Portuguese | 166 | 0.2% |
| Puerto Rican | 277 | 0.4% |
| Romanian | 30 | 0.0% |
| Russian | 197 | 0.3% |
| Salvadoran | 106 | 0.1% |
| Samoan | 9 | 0.0% |
| Scandinavian | 149 | 0.2% |
| Scotch-Irish | 1,466 | 1.8% |
| Scottish | 1,759 | 2.2% |
| Sioux | 19 | 0.0% |
| Slavic | 15 | 0.0% |
| Slovak | 128 | 0.2% |
| South African | 53 | 0.1% |
| South American | 390 | 0.5% |
| Spaniard | 15 | 0.0% |
| Spanish | 10 | 0.0% |
| Sri Lankan | 108 | 0.1% |
| Subsaharan African | 706 | 0.9% |
| Swedish | 252 | 0.3% |
| Swiss | 64 | 0.1% |
| Syrian | 33 | 0.0% |
| Thai | 152 | 0.2% |
| Turkish | 14 | 0.0% |
| Ukrainian | 99 | 0.1% |
| Uruguayan | 6 | 0.0% |
| Venezuelan | 48 | 0.1% |
| Welsh | 930 | 1.2% |
| Zimbabwean | 18 | 0.0% | View All 97 Rows |
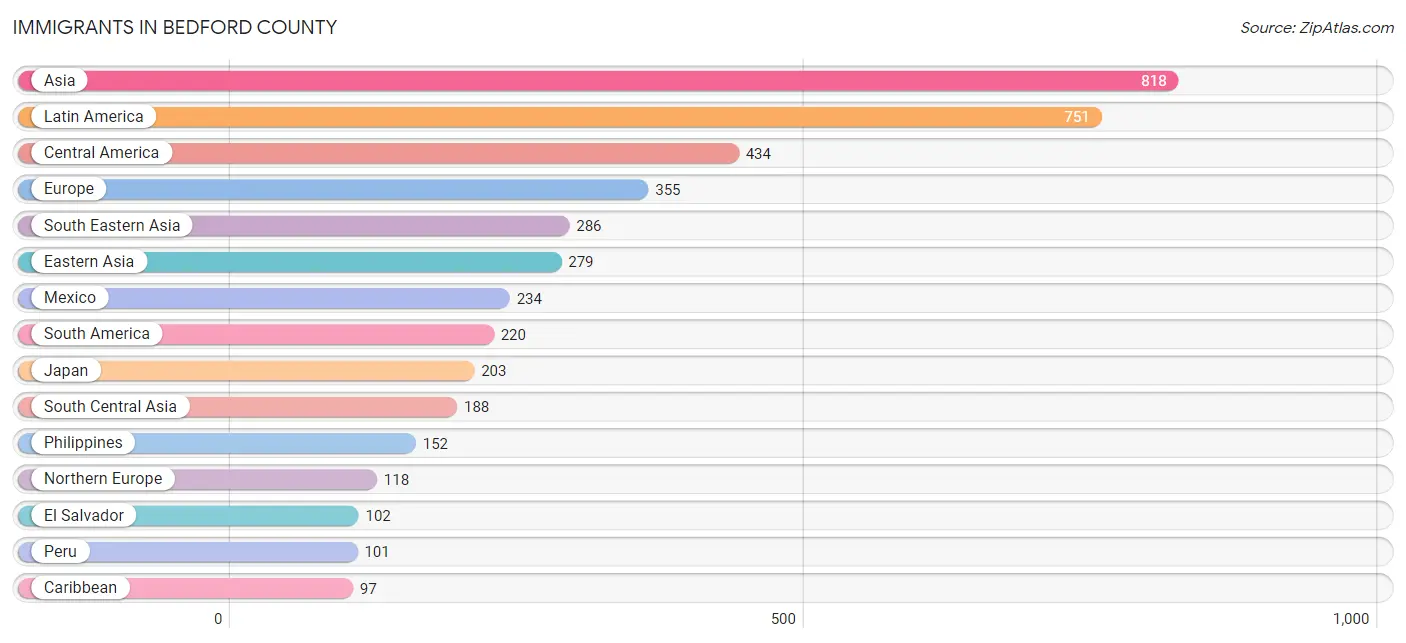
Immigrants in Bedford County
The most numerous immigrant groups reported in Bedford County came from Asia (818 | 1.0%), Latin America (751 | 0.9%), Central America (434 | 0.5%), Europe (355 | 0.4%), and South Eastern Asia (286 | 0.4%), together accounting for 3.3% of all Bedford County residents.
| Immigration Origin | # Population | % Population |
| Afghanistan | 5 | 0.0% |
| Africa | 90 | 0.1% |
| Asia | 818 | 1.0% |
| Australia | 15 | 0.0% |
| Azores | 13 | 0.0% |
| Bahamas | 24 | 0.0% |
| Bangladesh | 7 | 0.0% |
| Brazil | 24 | 0.0% |
| Bulgaria | 14 | 0.0% |
| Cambodia | 14 | 0.0% |
| Canada | 95 | 0.1% |
| Caribbean | 97 | 0.1% |
| Central America | 434 | 0.5% |
| China | 43 | 0.1% |
| Colombia | 29 | 0.0% |
| Costa Rica | 7 | 0.0% |
| Cuba | 18 | 0.0% |
| Denmark | 44 | 0.1% |
| Eastern Africa | 41 | 0.1% |
| Eastern Asia | 279 | 0.4% |
| Eastern Europe | 89 | 0.1% |
| Egypt | 17 | 0.0% |
| El Salvador | 102 | 0.1% |
| England | 65 | 0.1% |
| Ethiopia | 14 | 0.0% |
| Europe | 355 | 0.4% |
| Germany | 56 | 0.1% |
| Guatemala | 19 | 0.0% |
| Haiti | 16 | 0.0% |
| Honduras | 63 | 0.1% |
| Hungary | 7 | 0.0% |
| India | 71 | 0.1% |
| Iran | 4 | 0.0% |
| Italy | 23 | 0.0% |
| Jamaica | 39 | 0.1% |
| Japan | 203 | 0.3% |
| Korea | 33 | 0.0% |
| Latin America | 751 | 0.9% |
| Latvia | 13 | 0.0% |
| Lebanon | 37 | 0.1% |
| Lithuania | 8 | 0.0% |
| Mexico | 234 | 0.3% |
| Nepal | 84 | 0.1% |
| Nigeria | 5 | 0.0% |
| Northern Africa | 17 | 0.0% |
| Northern Europe | 118 | 0.2% |
| Oceania | 15 | 0.0% |
| Pakistan | 17 | 0.0% |
| Panama | 9 | 0.0% |
| Peru | 101 | 0.1% |
| Philippines | 152 | 0.2% |
| Portugal | 34 | 0.0% |
| Russia | 29 | 0.0% |
| Singapore | 7 | 0.0% |
| South America | 220 | 0.3% |
| South Central Asia | 188 | 0.2% |
| South Eastern Asia | 286 | 0.4% |
| Southern Europe | 57 | 0.1% |
| Switzerland | 35 | 0.0% |
| Syria | 11 | 0.0% |
| Thailand | 50 | 0.1% |
| Ukraine | 18 | 0.0% |
| Uruguay | 6 | 0.0% |
| Venezuela | 48 | 0.1% |
| Vietnam | 63 | 0.1% |
| Western Africa | 5 | 0.0% |
| Western Asia | 65 | 0.1% |
| Western Europe | 91 | 0.1% |
| Zimbabwe | 27 | 0.0% | View All 69 Rows |
Sex and Age in Bedford County
Sex and Age in Bedford County
The most populous age groups in Bedford County are 60 to 64 Years (3,293 | 8.4%) for men and 55 to 59 Years (3,494 | 8.7%) for women.
| Age Bracket | Male | Female |
| Under 5 Years | 1,697 (4.3%) | 1,841 (4.6%) |
| 5 to 9 Years | 2,768 (7.0%) | 2,167 (5.4%) |
| 10 to 14 Years | 1,894 (4.8%) | 2,236 (5.6%) |
| 15 to 19 Years | 2,348 (5.9%) | 2,315 (5.7%) |
| 20 to 24 Years | 2,211 (5.6%) | 2,185 (5.4%) |
| 25 to 29 Years | 2,094 (5.3%) | 1,951 (4.8%) |
| 30 to 34 Years | 2,048 (5.2%) | 2,016 (5.0%) |
| 35 to 39 Years | 1,892 (4.8%) | 2,087 (5.2%) |
| 40 to 44 Years | 2,339 (5.9%) | 2,125 (5.3%) |
| 45 to 49 Years | 2,481 (6.3%) | 2,553 (6.3%) |
| 50 to 54 Years | 2,805 (7.1%) | 2,901 (7.2%) |
| 55 to 59 Years | 3,246 (8.2%) | 3,494 (8.7%) |
| 60 to 64 Years | 3,293 (8.4%) | 3,093 (7.7%) |
| 65 to 69 Years | 2,830 (7.2%) | 3,173 (7.9%) |
| 70 to 74 Years | 2,335 (5.9%) | 2,201 (5.5%) |
| 75 to 79 Years | 1,430 (3.6%) | 1,912 (4.7%) |
| 80 to 84 Years | 955 (2.4%) | 1,083 (2.7%) |
| 85 Years and over | 786 (2.0%) | 976 (2.4%) |
| Total | 39,452 (100.0%) | 40,309 (100.0%) |
Families and Households in Bedford County
Median Family Size in Bedford County
The median family size in Bedford County is 2.88 persons per family, with married-couple families (19,222 | 83.9%) accounting for the largest median family size of 2.92 persons per family. On the other hand, single male/father families (1,293 | 5.6%) represent the smallest median family size with 2.23 persons per family.
| Family Type | # Families | Family Size |
| Married-Couple | 19,222 (83.9%) | 2.92 |
| Single Male/Father | 1,293 (5.6%) | 2.23 |
| Single Female/Mother | 2,396 (10.5%) | 2.89 |
| Total Families | 22,911 (100.0%) | 2.88 |
Median Household Size in Bedford County
The median household size in Bedford County is 2.44 persons per household, with single female/mother households (2,396 | 7.4%) accounting for the largest median household size of 3.13 persons per household. non-family households (9,599 | 29.5%) represent the smallest median household size with 1.21 persons per household.
| Household Type | # Households | Household Size |
| Married-Couple | 19,222 (59.1%) | 2.94 |
| Single Male/Father | 1,293 (4.0%) | 2.76 |
| Single Female/Mother | 2,396 (7.4%) | 3.13 |
| Non-family | 9,599 (29.5%) | 1.21 |
| Total Households | 32,510 (100.0%) | 2.44 |
Household Size by Marriage Status in Bedford County
Out of a total of 32,510 households in Bedford County, 22,911 (70.5%) are family households, while 9,599 (29.5%) are nonfamily households. The most numerous type of family households are 2-person households, comprising 12,371, and the most common type of nonfamily households are 1-person households, comprising 8,139.
| Household Size | Family Households | Nonfamily Households |
| 1-Person Households | - | 8,139 (25.0%) |
| 2-Person Households | 12,371 (38.1%) | 1,223 (3.8%) |
| 3-Person Households | 4,244 (13.1%) | 213 (0.7%) |
| 4-Person Households | 3,627 (11.2%) | 9 (0.0%) |
| 5-Person Households | 1,451 (4.5%) | 0 (0.0%) |
| 6-Person Households | 622 (1.9%) | 7 (0.0%) |
| 7+ Person Households | 596 (1.8%) | 8 (0.0%) |
| Total | 22,911 (70.5%) | 9,599 (29.5%) |
Female Fertility in Bedford County
Fertility by Age in Bedford County
Average fertility rate in Bedford County is 59.0 births per 1,000 women. Women in the age bracket of 20 to 34 years have the highest fertility rate with 118.0 births per 1,000 women. Women in the age bracket of 20 to 34 years acount for 77.7% of all women with births.
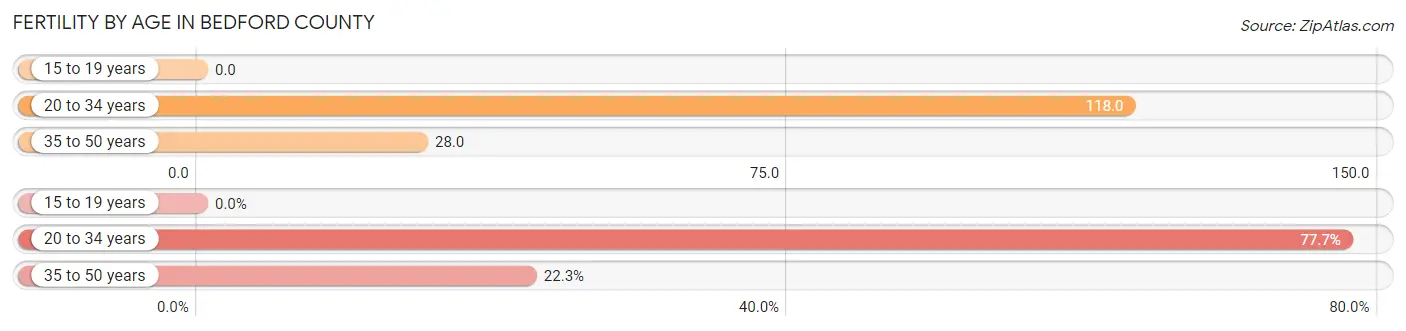
| Age Bracket | Women with Births | Births / 1,000 Women |
| 15 to 19 years | 0 (0.0%) | 0.0 |
| 20 to 34 years | 724 (77.7%) | 118.0 |
| 35 to 50 years | 208 (22.3%) | 28.0 |
| Total | 932 (100.0%) | 59.0 |
Fertility by Age by Marriage Status in Bedford County
79.2% of women with births (932) in Bedford County are married. The highest percentage of unmarried women with births falls into 20 to 34 years age bracket with 26.8% of them unmarried at the time of birth, while the lowest percentage of unmarried women with births belong to 35 to 50 years age bracket with 0.0% of them unmarried.

| Age Bracket | Married | Unmarried |
| 15 to 19 years | 0 (0.0%) | 0 (0.0%) |
| 20 to 34 years | 530 (73.2%) | 194 (26.8%) |
| 35 to 50 years | 208 (100.0%) | 0 (0.0%) |
| Total | 738 (79.2%) | 194 (20.8%) |
Fertility by Education in Bedford County
Average fertility rate in Bedford County is 59.0 births per 1,000 women. Women with the education attainment of bachelor's degree have the highest fertility rate of 82.0 births per 1,000 women, while women with the education attainment of less than high school have the lowest fertility at 3.0 births per 1,000 women. Women with the education attainment of bachelor's degree represent 36.5% of all women with births.
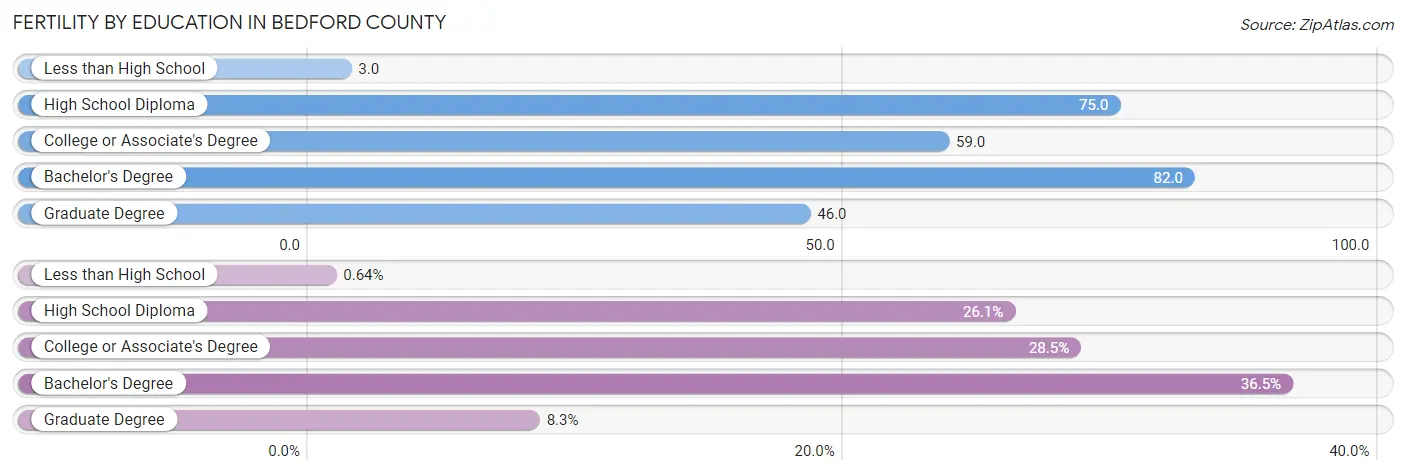
| Educational Attainment | Women with Births | Births / 1,000 Women |
| Less than High School | 6 (0.6%) | 3.0 |
| High School Diploma | 243 (26.1%) | 75.0 |
| College or Associate's Degree | 266 (28.5%) | 59.0 |
| Bachelor's Degree | 340 (36.5%) | 82.0 |
| Graduate Degree | 77 (8.3%) | 46.0 |
| Total | 932 (100.0%) | 59.0 |
Fertility by Education by Marriage Status in Bedford County
20.8% of women with births in Bedford County are unmarried. Women with the educational attainment of less than high school are most likely to be married with 100.0% of them married at childbirth, while women with the educational attainment of college or associate's degree are least likely to be married with 31.2% of them unmarried at childbirth.
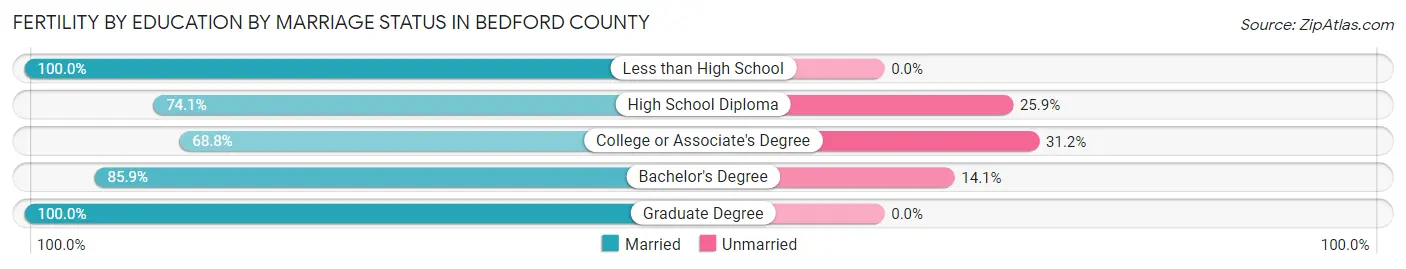
| Educational Attainment | Married | Unmarried |
| Less than High School | 6 (100.0%) | 0 (0.0%) |
| High School Diploma | 180 (74.1%) | 63 (25.9%) |
| College or Associate's Degree | 183 (68.8%) | 83 (31.2%) |
| Bachelor's Degree | 292 (85.9%) | 48 (14.1%) |
| Graduate Degree | 77 (100.0%) | 0 (0.0%) |
| Total | 738 (79.2%) | 194 (20.8%) |
Employment Characteristics in Bedford County
Employment by Class of Employer in Bedford County
Among the 36,473 employed individuals in Bedford County, private company employees (23,217 | 63.7%), not-for-profit organizations (3,997 | 11.0%), and local government employees (3,284 | 9.0%) make up the most common classes of employment.
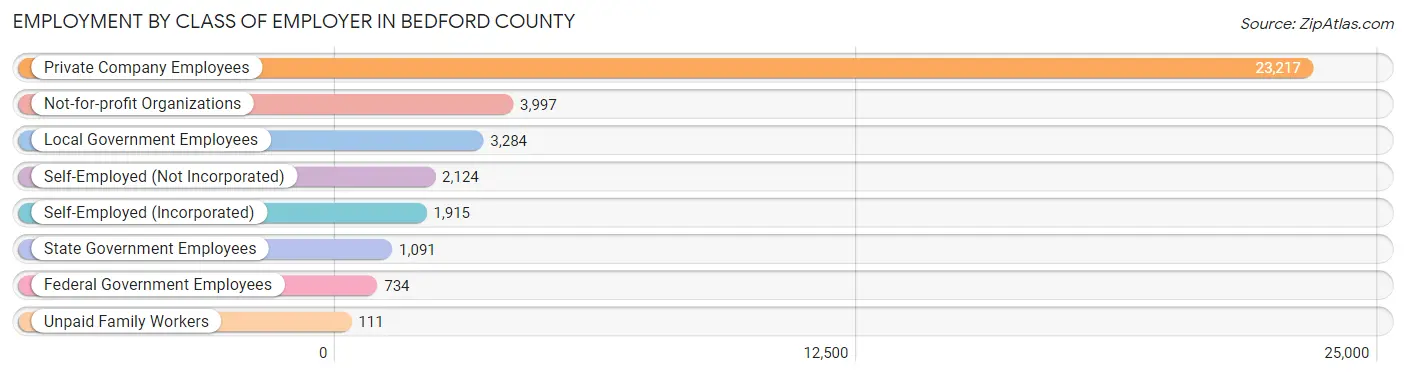
| Employer Class | # Employees | % Employees |
| Private Company Employees | 23,217 | 63.7% |
| Self-Employed (Incorporated) | 1,915 | 5.2% |
| Self-Employed (Not Incorporated) | 2,124 | 5.8% |
| Not-for-profit Organizations | 3,997 | 11.0% |
| Local Government Employees | 3,284 | 9.0% |
| State Government Employees | 1,091 | 3.0% |
| Federal Government Employees | 734 | 2.0% |
| Unpaid Family Workers | 111 | 0.3% |
| Total | 36,473 | 100.0% |
Employment Status by Age in Bedford County
According to the labor force statistics for Bedford County, out of the total population over 16 years of age (66,231), 57.9% or 38,348 individuals are in the labor force, with 2.9% or 1,112 of them unemployed. The age group with the highest labor force participation rate is 25 to 29 years, with 87.0% or 3,519 individuals in the labor force. Within the labor force, the 20 to 24 years age range has the highest percentage of unemployed individuals, with 8.2% or 294 of them being unemployed.
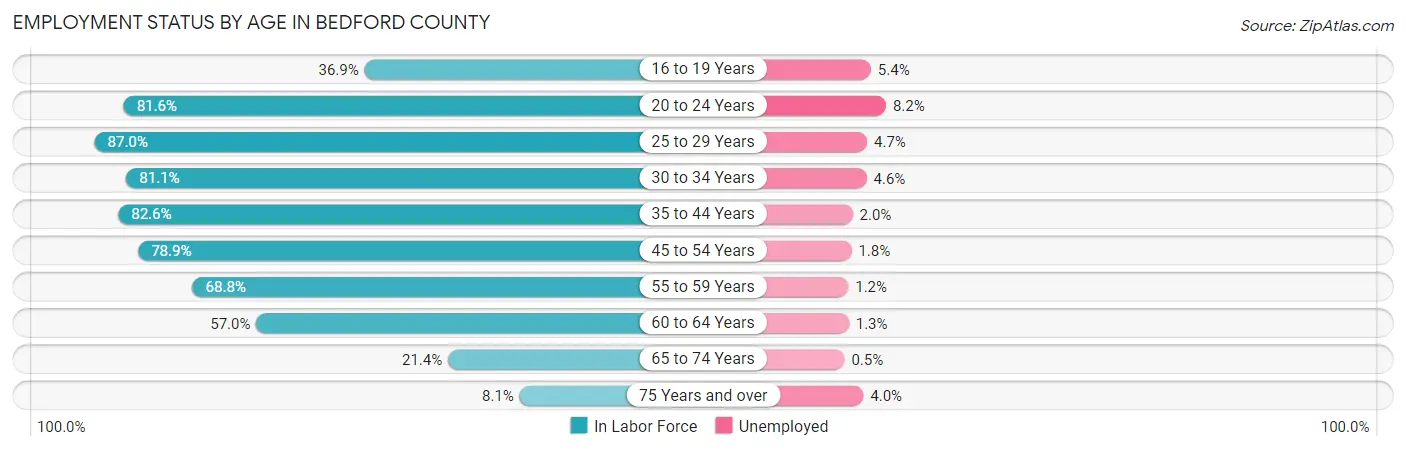
| Age Bracket | In Labor Force | Unemployed |
| 16 to 19 Years | 1,379 (36.9%) | 74 (5.4%) |
| 20 to 24 Years | 3,587 (81.6%) | 294 (8.2%) |
| 25 to 29 Years | 3,519 (87.0%) | 165 (4.7%) |
| 30 to 34 Years | 3,296 (81.1%) | 152 (4.6%) |
| 35 to 44 Years | 6,974 (82.6%) | 139 (2.0%) |
| 45 to 54 Years | 8,474 (78.9%) | 153 (1.8%) |
| 55 to 59 Years | 4,637 (68.8%) | 56 (1.2%) |
| 60 to 64 Years | 3,640 (57.0%) | 47 (1.3%) |
| 65 to 74 Years | 2,255 (21.4%) | 11 (0.5%) |
| 75 Years and over | 579 (8.1%) | 23 (4.0%) |
| Total | 38,348 (57.9%) | 1,112 (2.9%) |
Employment Status by Educational Attainment in Bedford County
According to labor force statistics for Bedford County, 75.6% of individuals (30,556) out of the total population between 25 and 64 years of age (40,418) are in the labor force, with 2.3% or 703 of them being unemployed. The group with the highest labor force participation rate are those with the educational attainment of bachelor's degree or higher, with 83.7% or 11,581 individuals in the labor force. Within the labor force, individuals with less than high school education have the highest percentage of unemployment, with 4.5% or 59 of them being unemployed.
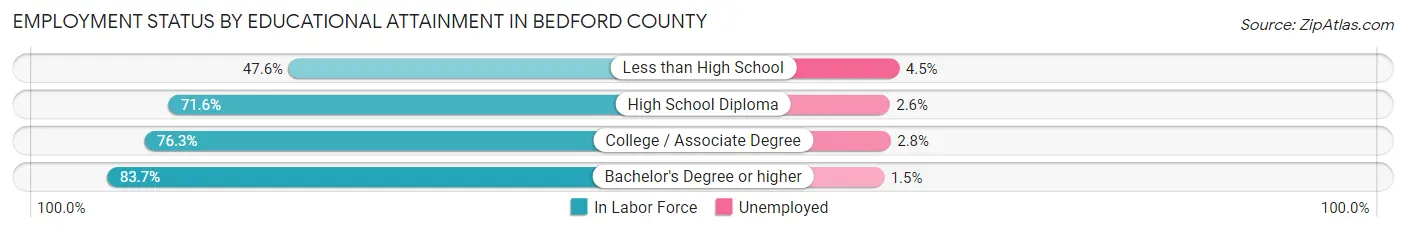
| Educational Attainment | In Labor Force | Unemployed |
| Less than High School | 1,322 (47.6%) | 125 (4.5%) |
| High School Diploma | 8,005 (71.6%) | 291 (2.6%) |
| College / Associate Degree | 9,633 (76.3%) | 354 (2.8%) |
| Bachelor's Degree or higher | 11,581 (83.7%) | 208 (1.5%) |
| Total | 30,556 (75.6%) | 930 (2.3%) |
Employment Occupations by Sex in Bedford County
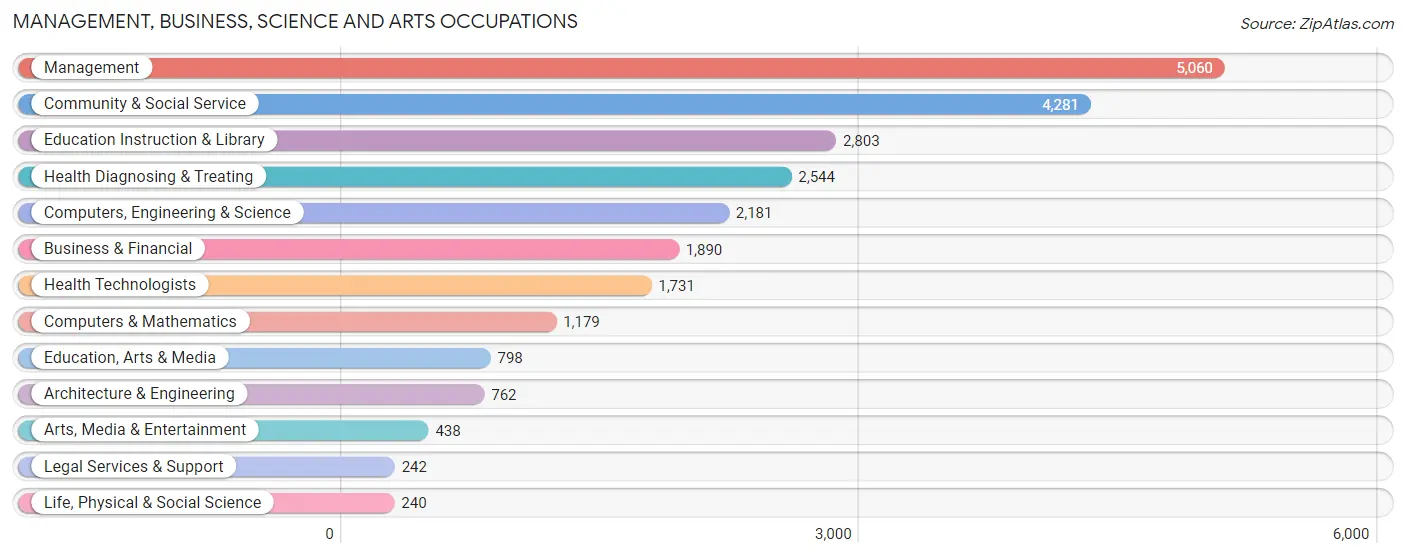
Management, Business, Science and Arts Occupations
The most common Management, Business, Science and Arts occupations in Bedford County are Management (5,060 | 13.6%), Community & Social Service (4,281 | 11.5%), Education Instruction & Library (2,803 | 7.5%), Health Diagnosing & Treating (2,544 | 6.8%), and Computers, Engineering & Science (2,181 | 5.9%).
Management, Business, Science and Arts Occupations by Sex
Within the Management, Business, Science and Arts occupations in Bedford County, the most male-oriented occupations are Architecture & Engineering (80.8%), Life, Physical & Social Science (73.8%), and Computers, Engineering & Science (72.7%), while the most female-oriented occupations are Legal Services & Support (74.8%), Health Diagnosing & Treating (74.6%), and Education Instruction & Library (74.6%).
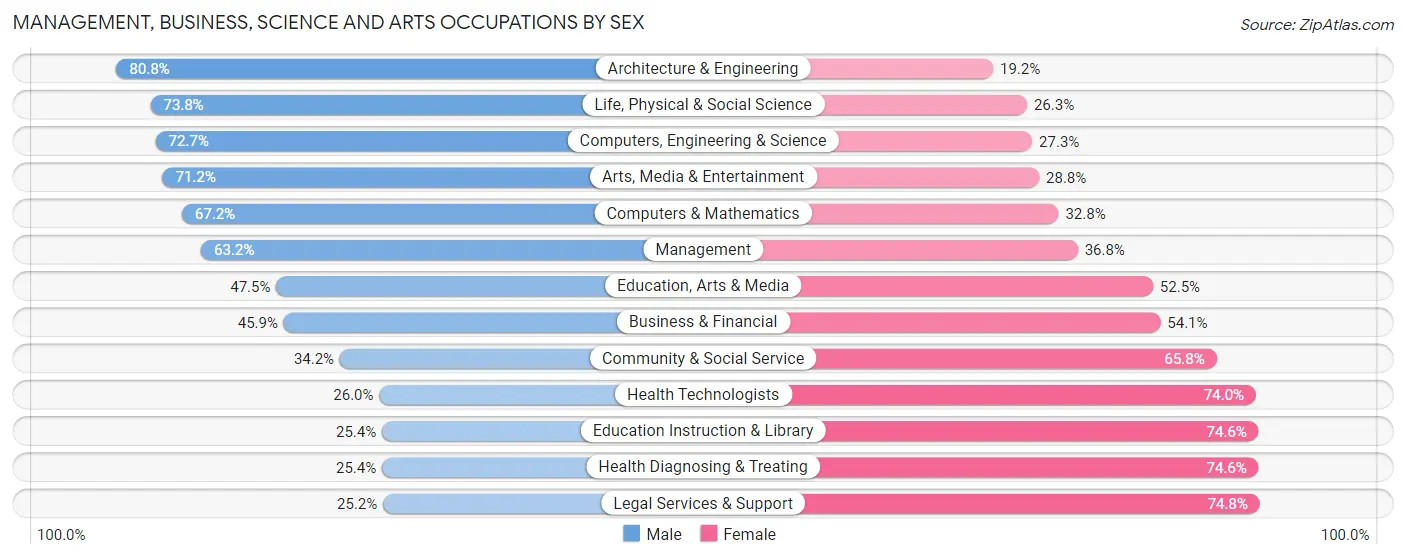
| Occupation | Male | Female |
| Management | 3,197 (63.2%) | 1,863 (36.8%) |
| Business & Financial | 868 (45.9%) | 1,022 (54.1%) |
| Computers, Engineering & Science | 1,585 (72.7%) | 596 (27.3%) |
| Computers & Mathematics | 792 (67.2%) | 387 (32.8%) |
| Architecture & Engineering | 616 (80.8%) | 146 (19.2%) |
| Life, Physical & Social Science | 177 (73.8%) | 63 (26.3%) |
| Community & Social Service | 1,465 (34.2%) | 2,816 (65.8%) |
| Education, Arts & Media | 379 (47.5%) | 419 (52.5%) |
| Legal Services & Support | 61 (25.2%) | 181 (74.8%) |
| Education Instruction & Library | 713 (25.4%) | 2,090 (74.6%) |
| Arts, Media & Entertainment | 312 (71.2%) | 126 (28.8%) |
| Health Diagnosing & Treating | 647 (25.4%) | 1,897 (74.6%) |
| Health Technologists | 450 (26.0%) | 1,281 (74.0%) |
| Total (Category) | 7,762 (48.6%) | 8,194 (51.3%) |
| Total (Overall) | 20,799 (55.9%) | 16,372 (44.1%) |
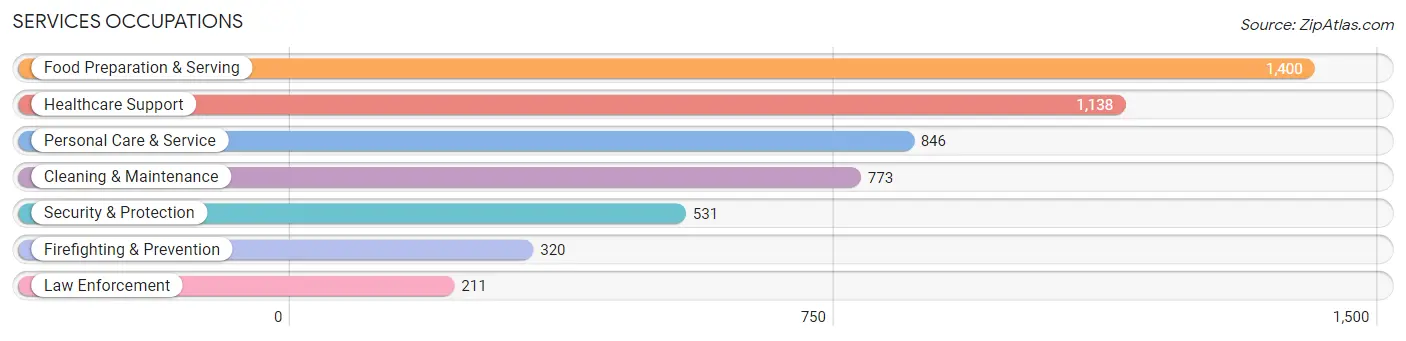
Services Occupations
The most common Services occupations in Bedford County are Food Preparation & Serving (1,400 | 3.8%), Healthcare Support (1,138 | 3.1%), Personal Care & Service (846 | 2.3%), Cleaning & Maintenance (773 | 2.1%), and Security & Protection (531 | 1.4%).
Services Occupations by Sex
Within the Services occupations in Bedford County, the most male-oriented occupations are Firefighting & Prevention (88.7%), Security & Protection (86.3%), and Law Enforcement (82.5%), while the most female-oriented occupations are Healthcare Support (81.9%), Personal Care & Service (62.9%), and Food Preparation & Serving (52.2%).
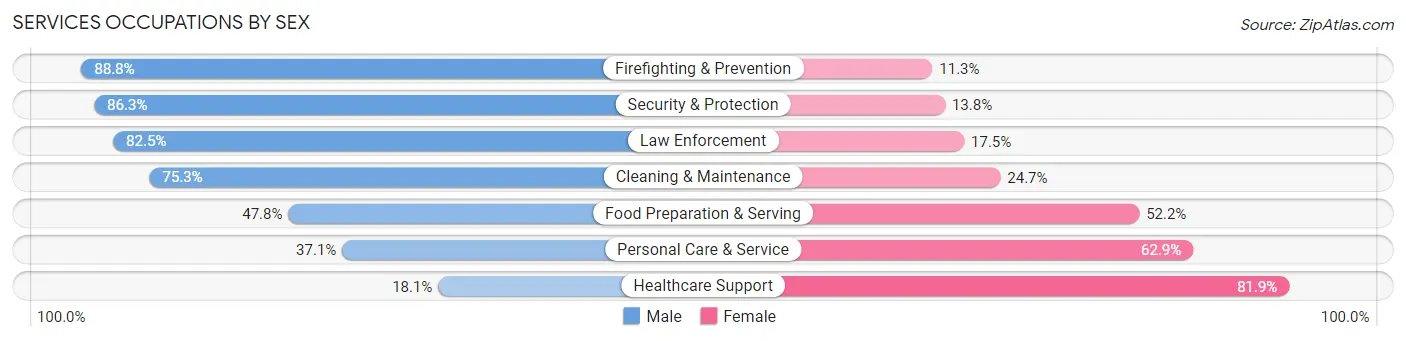
| Occupation | Male | Female |
| Healthcare Support | 206 (18.1%) | 932 (81.9%) |
| Security & Protection | 458 (86.3%) | 73 (13.8%) |
| Firefighting & Prevention | 284 (88.7%) | 36 (11.3%) |
| Law Enforcement | 174 (82.5%) | 37 (17.5%) |
| Food Preparation & Serving | 669 (47.8%) | 731 (52.2%) |
| Cleaning & Maintenance | 582 (75.3%) | 191 (24.7%) |
| Personal Care & Service | 314 (37.1%) | 532 (62.9%) |
| Total (Category) | 2,229 (47.5%) | 2,459 (52.4%) |
| Total (Overall) | 20,799 (55.9%) | 16,372 (44.1%) |
Sales and Office Occupations
The most common Sales and Office occupations in Bedford County are Office & Administration (3,860 | 10.4%), and Sales & Related (3,803 | 10.2%).

Sales and Office Occupations by Sex
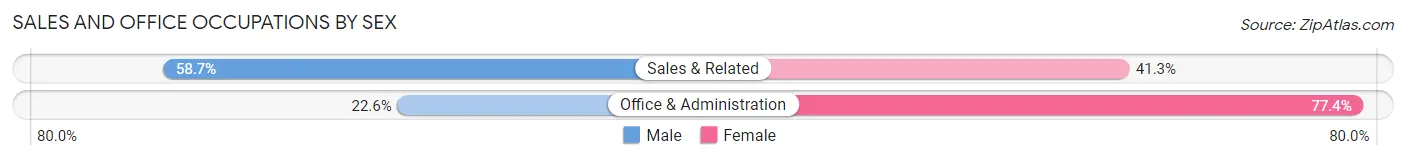
| Occupation | Male | Female |
| Sales & Related | 2,233 (58.7%) | 1,570 (41.3%) |
| Office & Administration | 873 (22.6%) | 2,987 (77.4%) |
| Total (Category) | 3,106 (40.5%) | 4,557 (59.5%) |
| Total (Overall) | 20,799 (55.9%) | 16,372 (44.1%) |
Natural Resources, Construction and Maintenance Occupations
The most common Natural Resources, Construction and Maintenance occupations in Bedford County are Installation, Maintenance & Repair (1,727 | 4.6%), Construction & Extraction (1,694 | 4.6%), and Farming, Fishing & Forestry (181 | 0.5%).
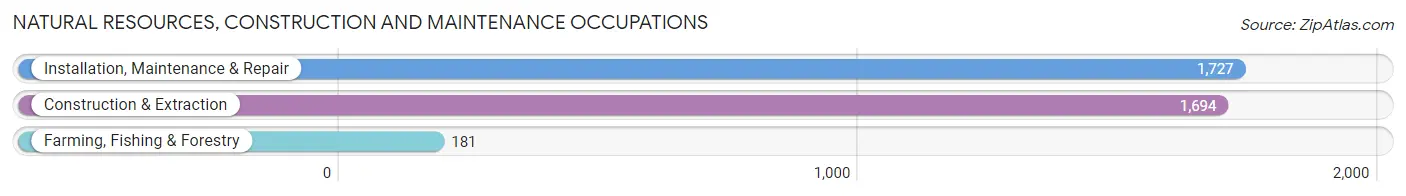
Natural Resources, Construction and Maintenance Occupations by Sex
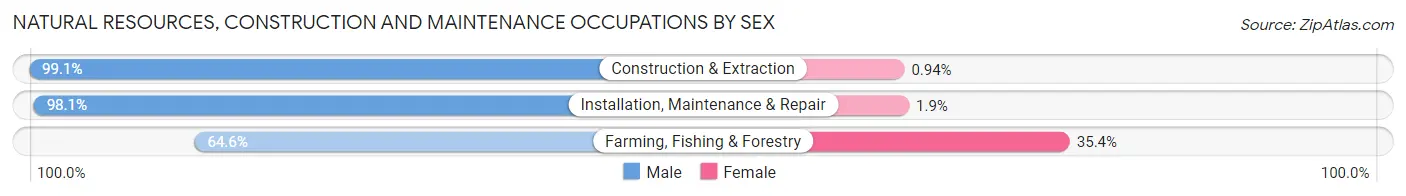
| Occupation | Male | Female |
| Farming, Fishing & Forestry | 117 (64.6%) | 64 (35.4%) |
| Construction & Extraction | 1,678 (99.1%) | 16 (0.9%) |
| Installation, Maintenance & Repair | 1,694 (98.1%) | 33 (1.9%) |
| Total (Category) | 3,489 (96.9%) | 113 (3.1%) |
| Total (Overall) | 20,799 (55.9%) | 16,372 (44.1%) |
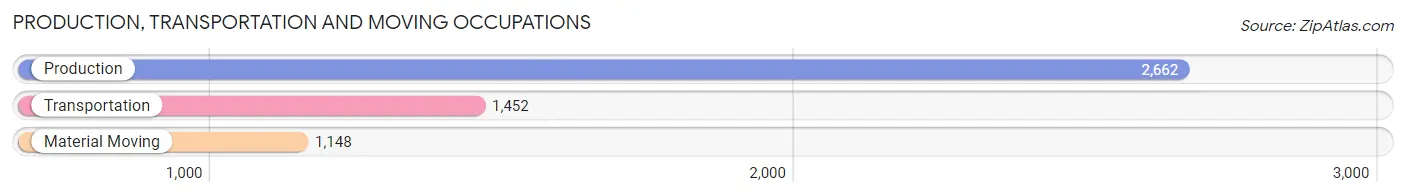
Production, Transportation and Moving Occupations
The most common Production, Transportation and Moving occupations in Bedford County are Production (2,662 | 7.2%), Transportation (1,452 | 3.9%), and Material Moving (1,148 | 3.1%).
Production, Transportation and Moving Occupations by Sex
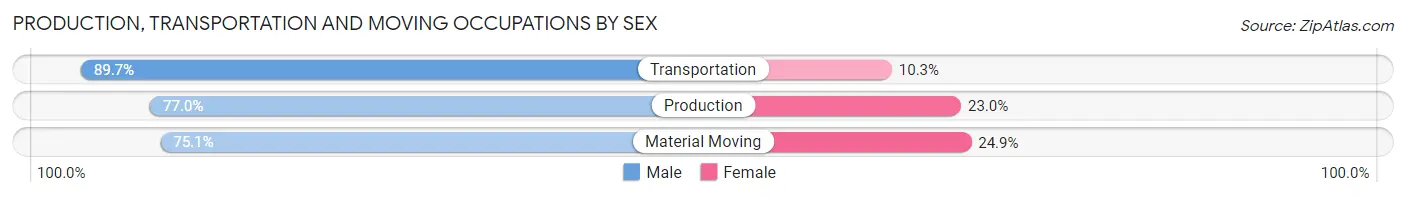
| Occupation | Male | Female |
| Production | 2,049 (77.0%) | 613 (23.0%) |
| Transportation | 1,302 (89.7%) | 150 (10.3%) |
| Material Moving | 862 (75.1%) | 286 (24.9%) |
| Total (Category) | 4,213 (80.1%) | 1,049 (19.9%) |
| Total (Overall) | 20,799 (55.9%) | 16,372 (44.1%) |
Employment Industries by Sex in Bedford County
Employment Industries in Bedford County
The major employment industries in Bedford County include Health Care & Social Assistance (5,040 | 13.6%), Manufacturing (4,819 | 13.0%), Educational Services (4,320 | 11.6%), Retail Trade (4,276 | 11.5%), and Construction (2,710 | 7.3%).
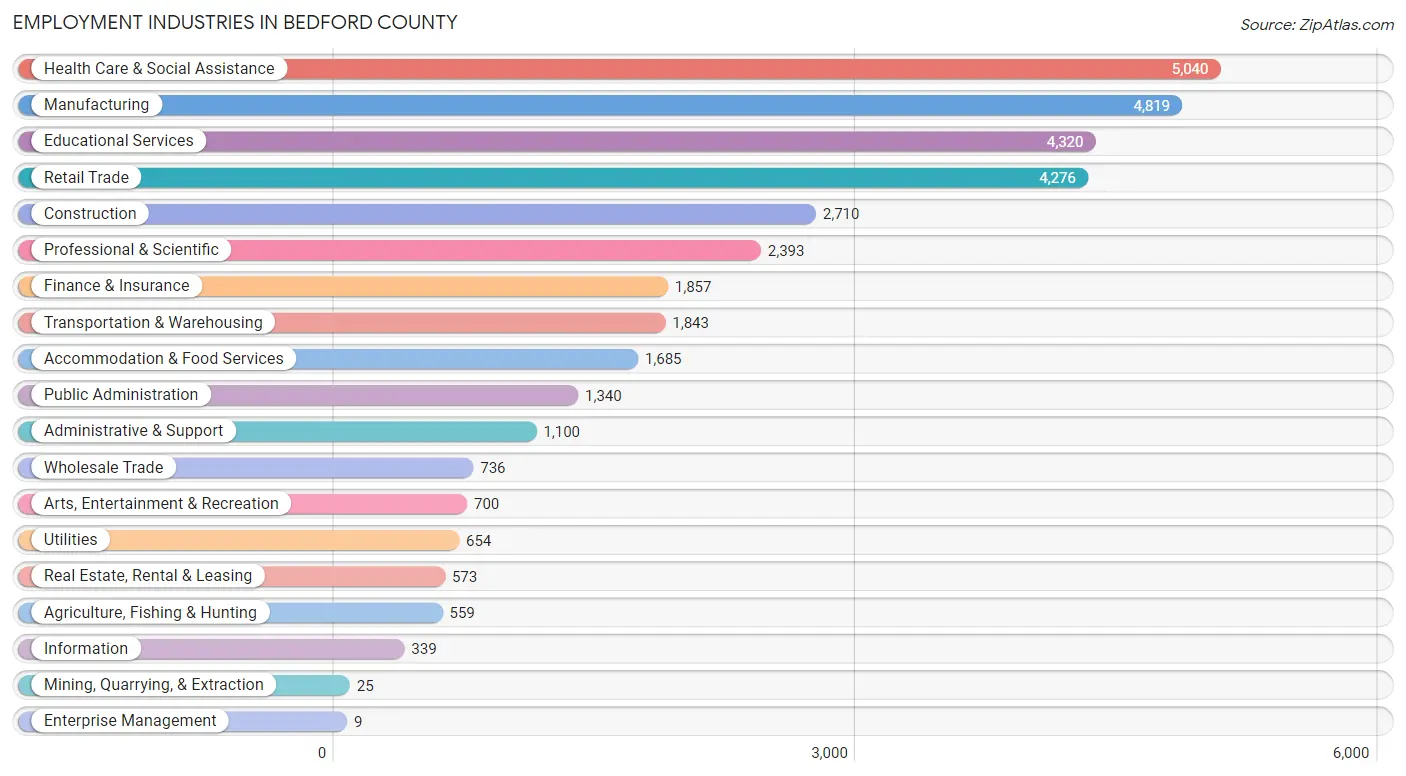
Employment Industries by Sex in Bedford County
The Bedford County industries that see more men than women are Mining, Quarrying, & Extraction (100.0%), Construction (92.2%), and Wholesale Trade (89.4%), whereas the industries that tend to have a higher number of women are Enterprise Management (100.0%), Health Care & Social Assistance (74.5%), and Educational Services (67.4%).
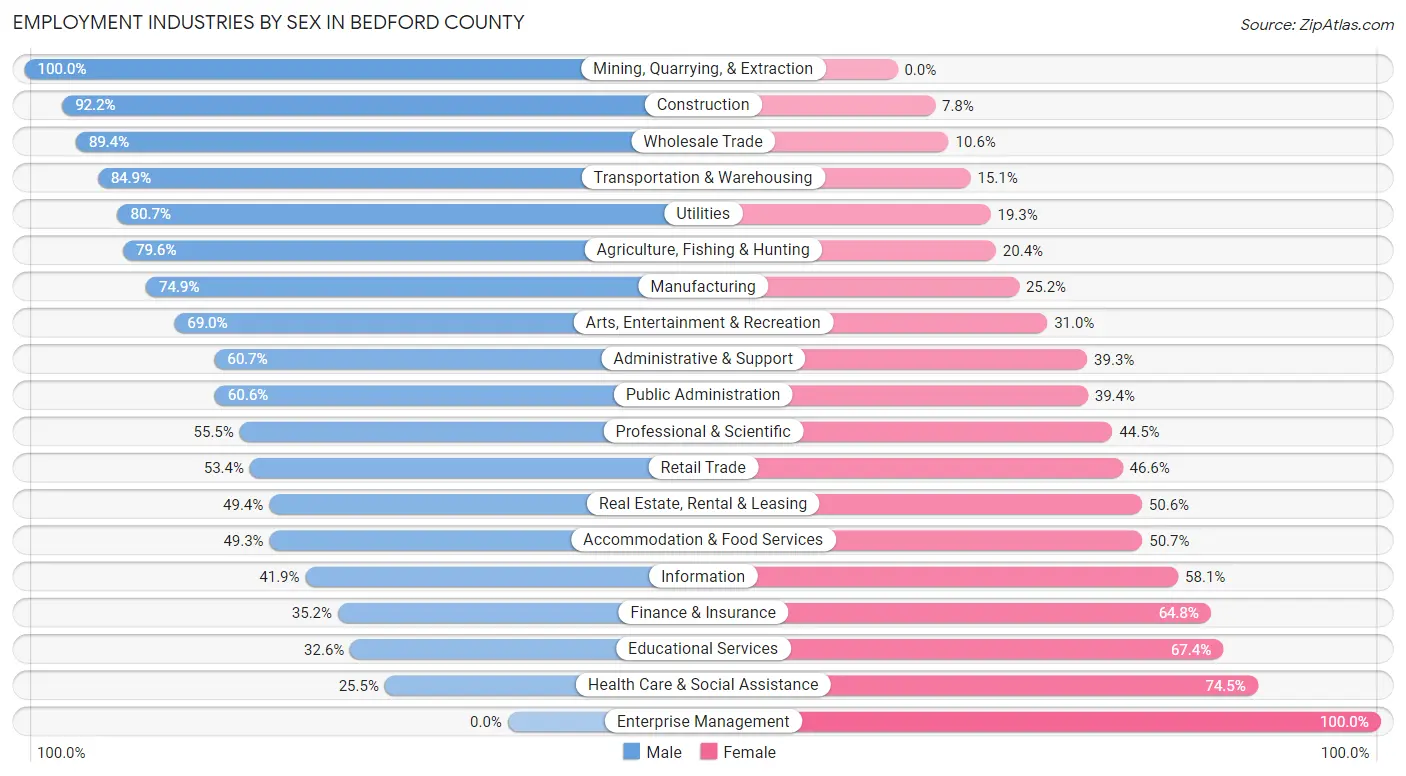
| Industry | Male | Female |
| Agriculture, Fishing & Hunting | 445 (79.6%) | 114 (20.4%) |
| Mining, Quarrying, & Extraction | 25 (100.0%) | 0 (0.0%) |
| Construction | 2,499 (92.2%) | 211 (7.8%) |
| Manufacturing | 3,607 (74.9%) | 1,212 (25.2%) |
| Wholesale Trade | 658 (89.4%) | 78 (10.6%) |
| Retail Trade | 2,283 (53.4%) | 1,993 (46.6%) |
| Transportation & Warehousing | 1,564 (84.9%) | 279 (15.1%) |
| Utilities | 528 (80.7%) | 126 (19.3%) |
| Information | 142 (41.9%) | 197 (58.1%) |
| Finance & Insurance | 653 (35.2%) | 1,204 (64.8%) |
| Real Estate, Rental & Leasing | 283 (49.4%) | 290 (50.6%) |
| Professional & Scientific | 1,328 (55.5%) | 1,065 (44.5%) |
| Enterprise Management | 0 (0.0%) | 9 (100.0%) |
| Administrative & Support | 668 (60.7%) | 432 (39.3%) |
| Educational Services | 1,409 (32.6%) | 2,911 (67.4%) |
| Health Care & Social Assistance | 1,283 (25.5%) | 3,757 (74.5%) |
| Arts, Entertainment & Recreation | 483 (69.0%) | 217 (31.0%) |
| Accommodation & Food Services | 831 (49.3%) | 854 (50.7%) |
| Public Administration | 812 (60.6%) | 528 (39.4%) |
| Total | 20,799 (55.9%) | 16,372 (44.1%) |
Education in Bedford County
School Enrollment in Bedford County
The most common levels of schooling among the 17,028 students in Bedford County are high school (3,871 | 22.7%), elementary school (3,643 | 21.4%), and middle school (3,208 | 18.8%).
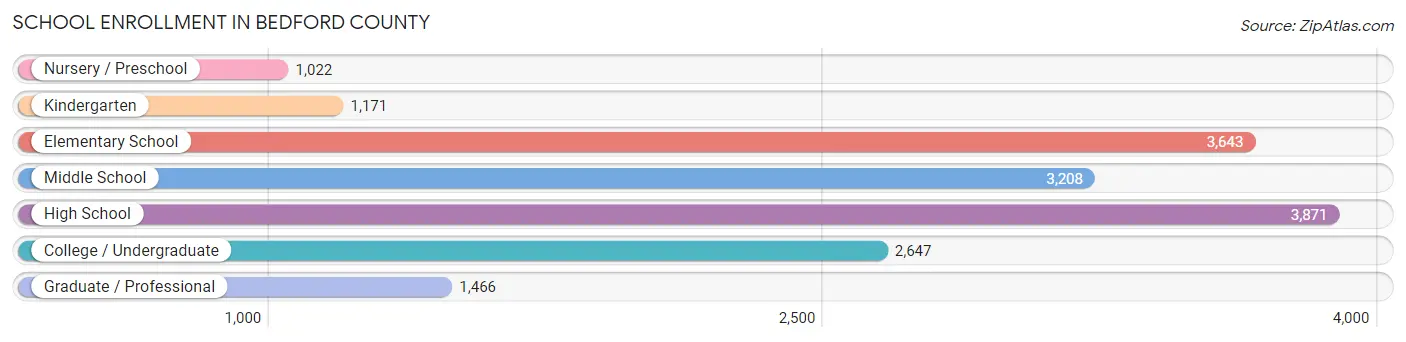
| School Level | # Students | % Students |
| Nursery / Preschool | 1,022 | 6.0% |
| Kindergarten | 1,171 | 6.9% |
| Elementary School | 3,643 | 21.4% |
| Middle School | 3,208 | 18.8% |
| High School | 3,871 | 22.7% |
| College / Undergraduate | 2,647 | 15.5% |
| Graduate / Professional | 1,466 | 8.6% |
| Total | 17,028 | 100.0% |
School Enrollment by Age by Funding Source in Bedford County
Out of a total of 17,028 students who are enrolled in schools in Bedford County, 5,245 (30.8%) attend a private institution, while the remaining 11,783 (69.2%) are enrolled in public schools. The age group of 25 to 34 year olds has the highest likelihood of being enrolled in private schools, with 671 (62.2% in the age bracket) enrolled. Conversely, the age group of 5 to 9 year old has the lowest likelihood of being enrolled in a private school, with 3,658 (79.7% in the age bracket) attending a public institution.
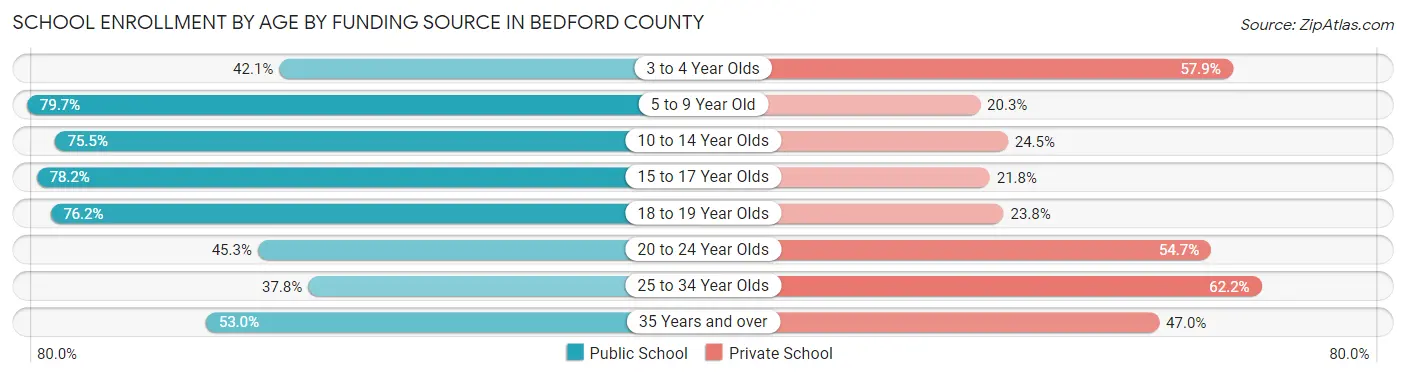
| Age Bracket | Public School | Private School |
| 3 to 4 Year Olds | 334 (42.1%) | 460 (57.9%) |
| 5 to 9 Year Old | 3,658 (79.7%) | 934 (20.3%) |
| 10 to 14 Year Olds | 3,066 (75.5%) | 993 (24.5%) |
| 15 to 17 Year Olds | 2,311 (78.2%) | 643 (21.8%) |
| 18 to 19 Year Olds | 806 (76.2%) | 252 (23.8%) |
| 20 to 24 Year Olds | 697 (45.3%) | 843 (54.7%) |
| 25 to 34 Year Olds | 407 (37.8%) | 671 (62.2%) |
| 35 Years and over | 505 (53.0%) | 448 (47.0%) |
| Total | 11,783 (69.2%) | 5,245 (30.8%) |
Educational Attainment by Field of Study in Bedford County
Business (3,295 | 16.1%), education (2,810 | 13.7%), science & technology (2,235 | 10.9%), psychology (1,549 | 7.6%), and social sciences (1,473 | 7.2%) are the most common fields of study among 20,451 individuals in Bedford County who have obtained a bachelor's degree or higher.
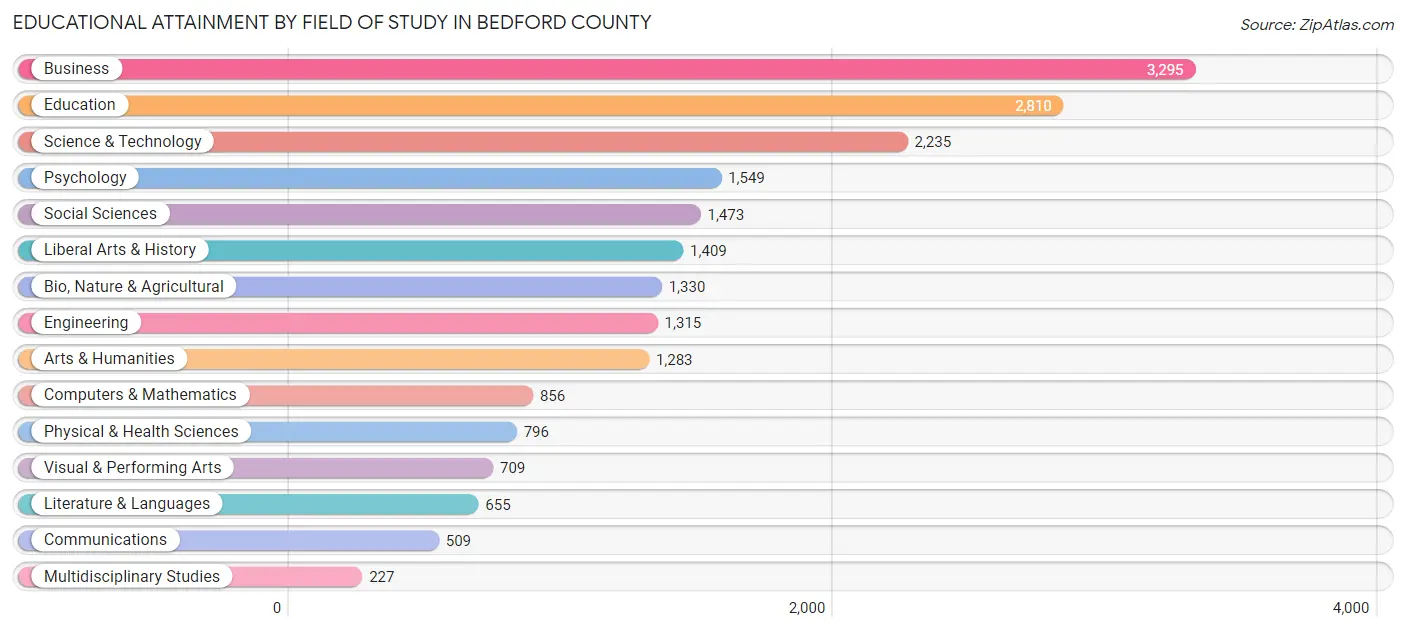
| Field of Study | # Graduates | % Graduates |
| Computers & Mathematics | 856 | 4.2% |
| Bio, Nature & Agricultural | 1,330 | 6.5% |
| Physical & Health Sciences | 796 | 3.9% |
| Psychology | 1,549 | 7.6% |
| Social Sciences | 1,473 | 7.2% |
| Engineering | 1,315 | 6.4% |
| Multidisciplinary Studies | 227 | 1.1% |
| Science & Technology | 2,235 | 10.9% |
| Business | 3,295 | 16.1% |
| Education | 2,810 | 13.7% |
| Literature & Languages | 655 | 3.2% |
| Liberal Arts & History | 1,409 | 6.9% |
| Visual & Performing Arts | 709 | 3.5% |
| Communications | 509 | 2.5% |
| Arts & Humanities | 1,283 | 6.3% |
| Total | 20,451 | 100.0% |
Transportation & Commute in Bedford County
Vehicle Availability by Sex in Bedford County
The most prevalent vehicle ownership categories in Bedford County are males with 3 vehicles (6,808, accounting for 33.5%) and females with 3 vehicles (4,781, making up 42.3%).
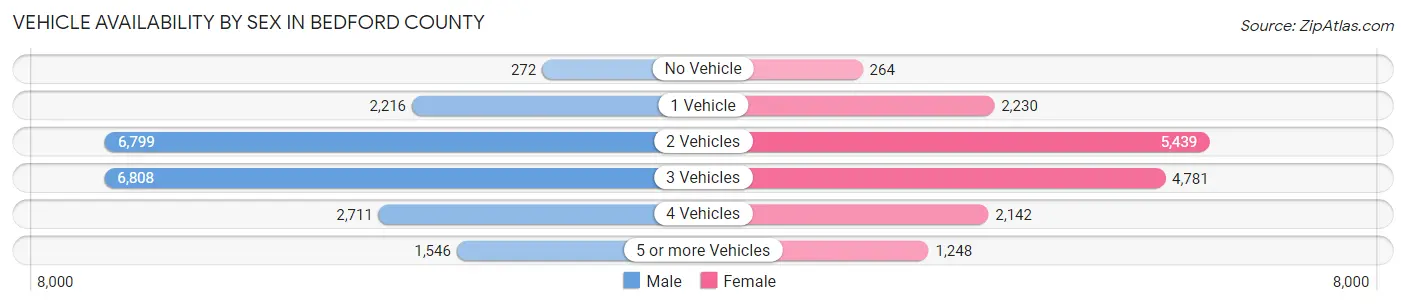
| Vehicles Available | Male | Female |
| No Vehicle | 272 (1.3%) | 264 (1.6%) |
| 1 Vehicle | 2,216 (10.9%) | 2,230 (13.9%) |
| 2 Vehicles | 6,799 (33.4%) | 5,439 (33.8%) |
| 3 Vehicles | 6,808 (33.5%) | 4,781 (29.7%) |
| 4 Vehicles | 2,711 (13.3%) | 2,142 (13.3%) |
| 5 or more Vehicles | 1,546 (7.6%) | 1,248 (7.7%) |
| Total | 20,352 (100.0%) | 16,104 (100.0%) |
Commute Time in Bedford County
The most frequently occuring commute durations in Bedford County are 30 to 34 minutes (5,645 commuters, 17.0%), 15 to 19 minutes (5,350 commuters, 16.1%), and 20 to 24 minutes (5,000 commuters, 15.1%).
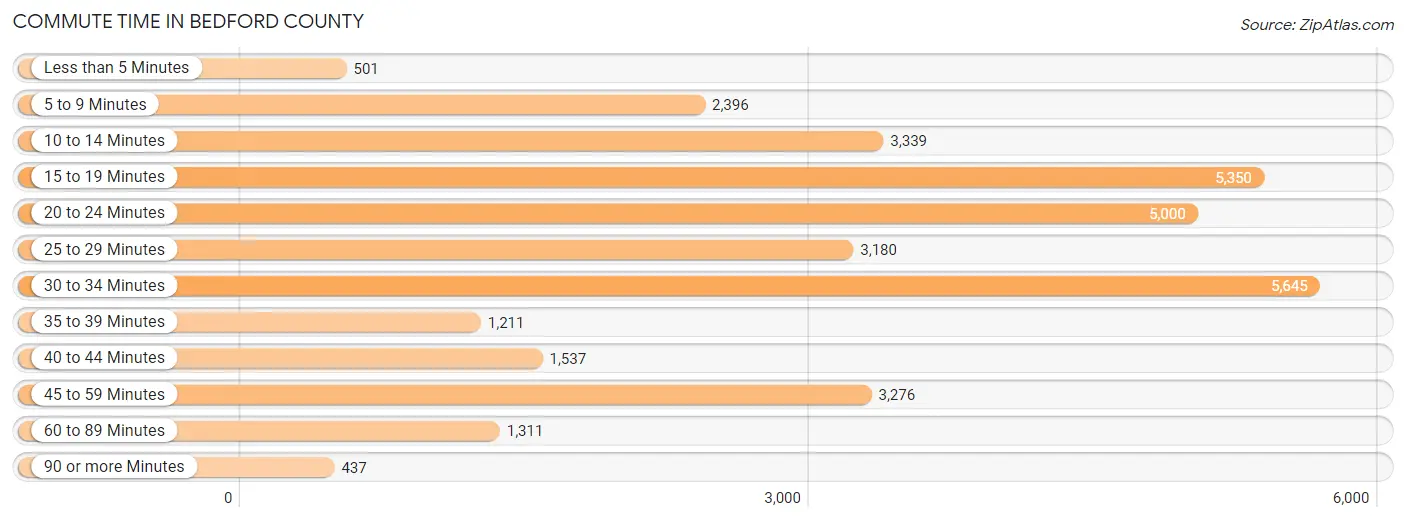
| Commute Time | # Commuters | % Commuters |
| Less than 5 Minutes | 501 | 1.5% |
| 5 to 9 Minutes | 2,396 | 7.2% |
| 10 to 14 Minutes | 3,339 | 10.1% |
| 15 to 19 Minutes | 5,350 | 16.1% |
| 20 to 24 Minutes | 5,000 | 15.1% |
| 25 to 29 Minutes | 3,180 | 9.6% |
| 30 to 34 Minutes | 5,645 | 17.0% |
| 35 to 39 Minutes | 1,211 | 3.6% |
| 40 to 44 Minutes | 1,537 | 4.6% |
| 45 to 59 Minutes | 3,276 | 9.9% |
| 60 to 89 Minutes | 1,311 | 4.0% |
| 90 or more Minutes | 437 | 1.3% |
Commute Time by Sex in Bedford County
The most common commute times in Bedford County are 30 to 34 minutes (3,432 commuters, 18.3%) for males and 15 to 19 minutes (2,318 commuters, 16.1%) for females.
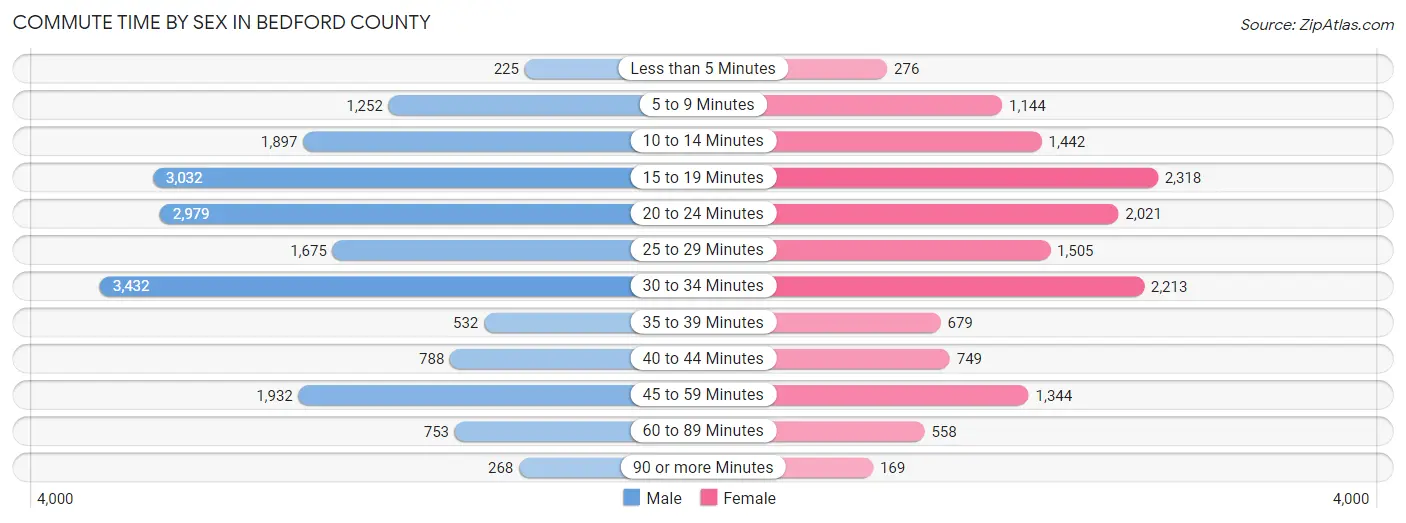
| Commute Time | Male | Female |
| Less than 5 Minutes | 225 (1.2%) | 276 (1.9%) |
| 5 to 9 Minutes | 1,252 (6.7%) | 1,144 (7.9%) |
| 10 to 14 Minutes | 1,897 (10.1%) | 1,442 (10.0%) |
| 15 to 19 Minutes | 3,032 (16.2%) | 2,318 (16.1%) |
| 20 to 24 Minutes | 2,979 (15.9%) | 2,021 (14.0%) |
| 25 to 29 Minutes | 1,675 (8.9%) | 1,505 (10.4%) |
| 30 to 34 Minutes | 3,432 (18.3%) | 2,213 (15.3%) |
| 35 to 39 Minutes | 532 (2.8%) | 679 (4.7%) |
| 40 to 44 Minutes | 788 (4.2%) | 749 (5.2%) |
| 45 to 59 Minutes | 1,932 (10.3%) | 1,344 (9.3%) |
| 60 to 89 Minutes | 753 (4.0%) | 558 (3.9%) |
| 90 or more Minutes | 268 (1.4%) | 169 (1.2%) |
Time of Departure to Work by Sex in Bedford County
The most frequent times of departure to work in Bedford County are 7:00 AM to 7:29 AM (2,911, 15.5%) for males and 7:00 AM to 7:29 AM (2,380, 16.5%) for females.
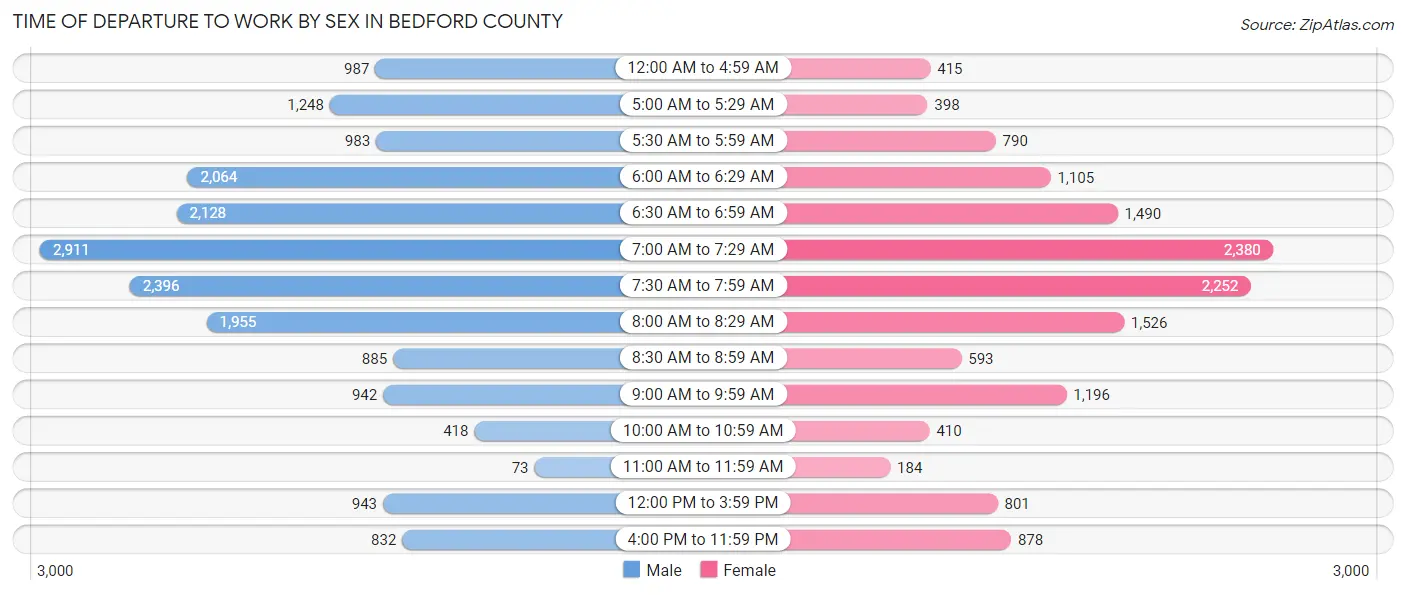
| Time of Departure | Male | Female |
| 12:00 AM to 4:59 AM | 987 (5.3%) | 415 (2.9%) |
| 5:00 AM to 5:29 AM | 1,248 (6.7%) | 398 (2.8%) |
| 5:30 AM to 5:59 AM | 983 (5.2%) | 790 (5.5%) |
| 6:00 AM to 6:29 AM | 2,064 (11.0%) | 1,105 (7.7%) |
| 6:30 AM to 6:59 AM | 2,128 (11.3%) | 1,490 (10.3%) |
| 7:00 AM to 7:29 AM | 2,911 (15.5%) | 2,380 (16.5%) |
| 7:30 AM to 7:59 AM | 2,396 (12.8%) | 2,252 (15.6%) |
| 8:00 AM to 8:29 AM | 1,955 (10.4%) | 1,526 (10.6%) |
| 8:30 AM to 8:59 AM | 885 (4.7%) | 593 (4.1%) |
| 9:00 AM to 9:59 AM | 942 (5.0%) | 1,196 (8.3%) |
| 10:00 AM to 10:59 AM | 418 (2.2%) | 410 (2.8%) |
| 11:00 AM to 11:59 AM | 73 (0.4%) | 184 (1.3%) |
| 12:00 PM to 3:59 PM | 943 (5.0%) | 801 (5.6%) |
| 4:00 PM to 11:59 PM | 832 (4.4%) | 878 (6.1%) |
| Total | 18,765 (100.0%) | 14,418 (100.0%) |
Housing Occupancy in Bedford County
Occupancy by Ownership in Bedford County
Of the total 32,510 dwellings in Bedford County, owner-occupied units account for 27,390 (84.3%), while renter-occupied units make up 5,120 (15.8%).
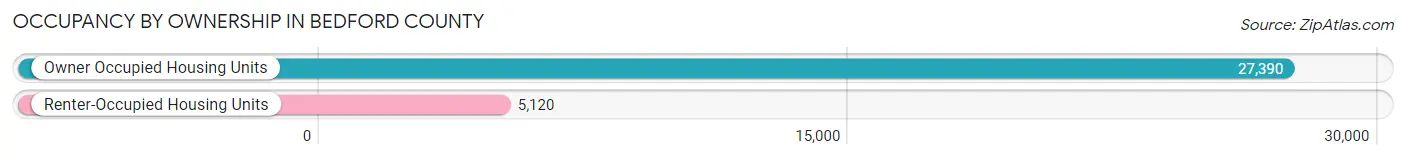
| Occupancy | # Housing Units | % Housing Units |
| Owner Occupied Housing Units | 27,390 | 84.3% |
| Renter-Occupied Housing Units | 5,120 | 15.8% |
| Total Occupied Housing Units | 32,510 | 100.0% |
Occupancy by Household Size in Bedford County
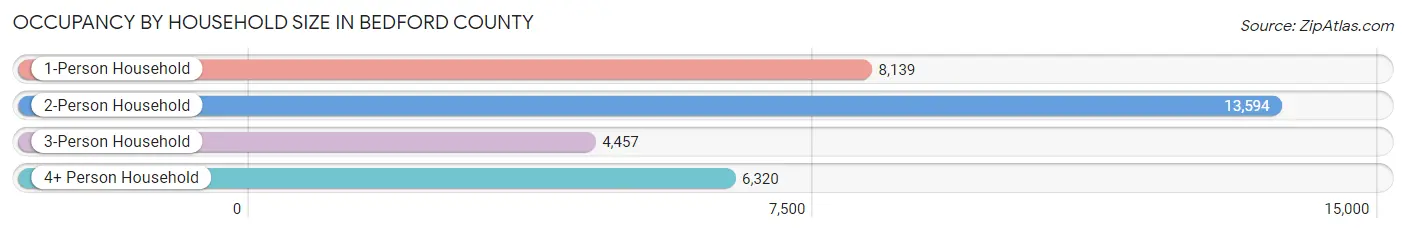
| Household Size | # Housing Units | % Housing Units |
| 1-Person Household | 8,139 | 25.0% |
| 2-Person Household | 13,594 | 41.8% |
| 3-Person Household | 4,457 | 13.7% |
| 4+ Person Household | 6,320 | 19.4% |
| Total Housing Units | 32,510 | 100.0% |
Occupancy by Ownership by Household Size in Bedford County
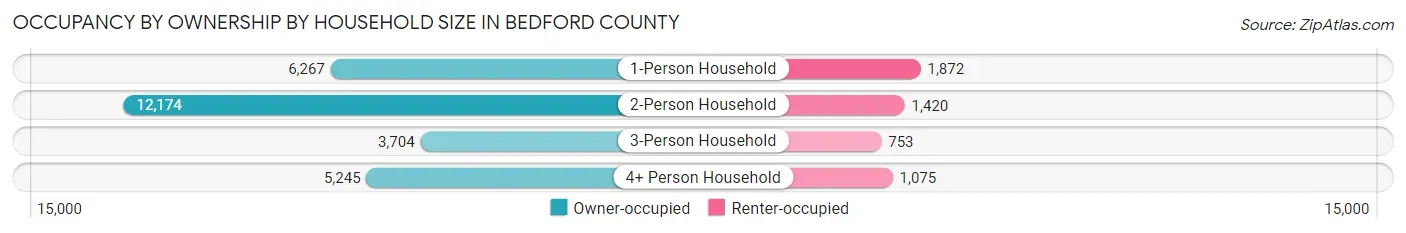
| Household Size | Owner-occupied | Renter-occupied |
| 1-Person Household | 6,267 (77.0%) | 1,872 (23.0%) |
| 2-Person Household | 12,174 (89.5%) | 1,420 (10.4%) |
| 3-Person Household | 3,704 (83.1%) | 753 (16.9%) |
| 4+ Person Household | 5,245 (83.0%) | 1,075 (17.0%) |
| Total Housing Units | 27,390 (84.3%) | 5,120 (15.8%) |
Occupancy by Educational Attainment in Bedford County
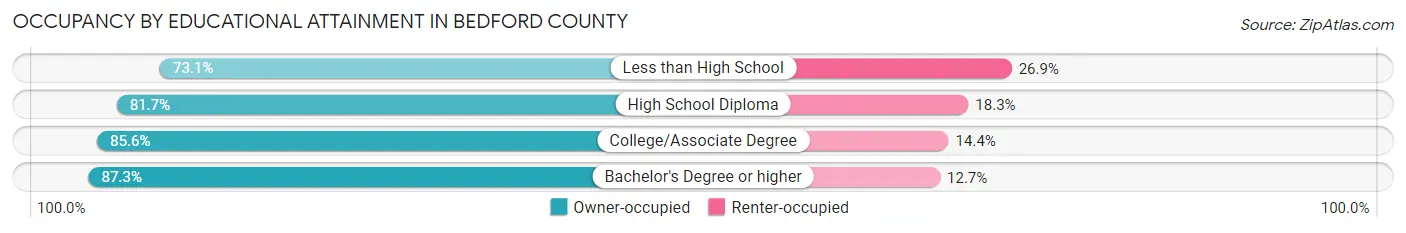
| Household Size | Owner-occupied | Renter-occupied |
| Less than High School | 1,796 (73.1%) | 660 (26.9%) |
| High School Diploma | 6,945 (81.7%) | 1,555 (18.3%) |
| College/Associate Degree | 8,693 (85.6%) | 1,459 (14.4%) |
| Bachelor's Degree or higher | 9,956 (87.3%) | 1,446 (12.7%) |
Occupancy by Age of Householder in Bedford County
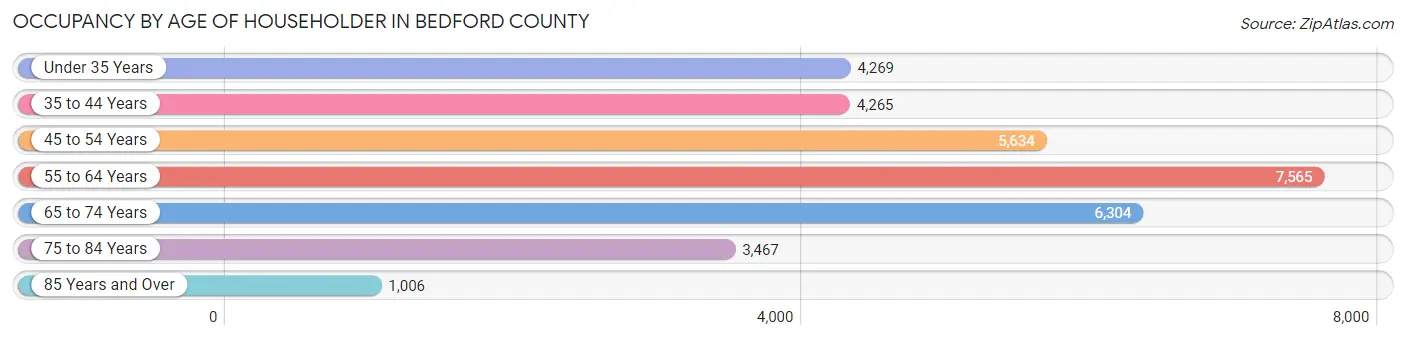
| Age Bracket | # Households | % Households |
| Under 35 Years | 4,269 | 13.1% |
| 35 to 44 Years | 4,265 | 13.1% |
| 45 to 54 Years | 5,634 | 17.3% |
| 55 to 64 Years | 7,565 | 23.3% |
| 65 to 74 Years | 6,304 | 19.4% |
| 75 to 84 Years | 3,467 | 10.7% |
| 85 Years and Over | 1,006 | 3.1% |
| Total | 32,510 | 100.0% |
Housing Finances in Bedford County
Median Income by Occupancy in Bedford County
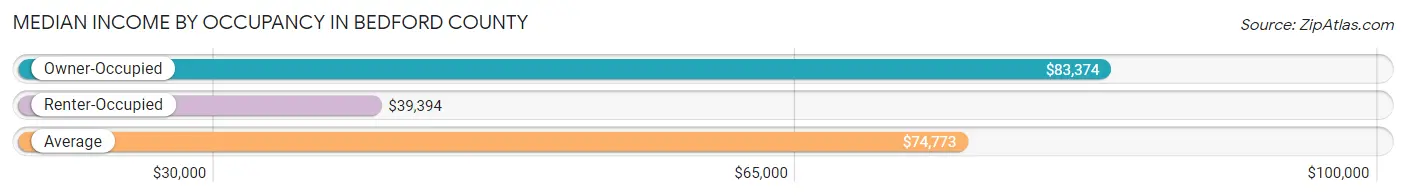
| Occupancy Type | # Households | Median Income |
| Owner-Occupied | 27,390 (84.3%) | $83,374 |
| Renter-Occupied | 5,120 (15.8%) | $39,394 |
| Average | 32,510 (100.0%) | $74,773 |
Occupancy by Householder Income Bracket in Bedford County
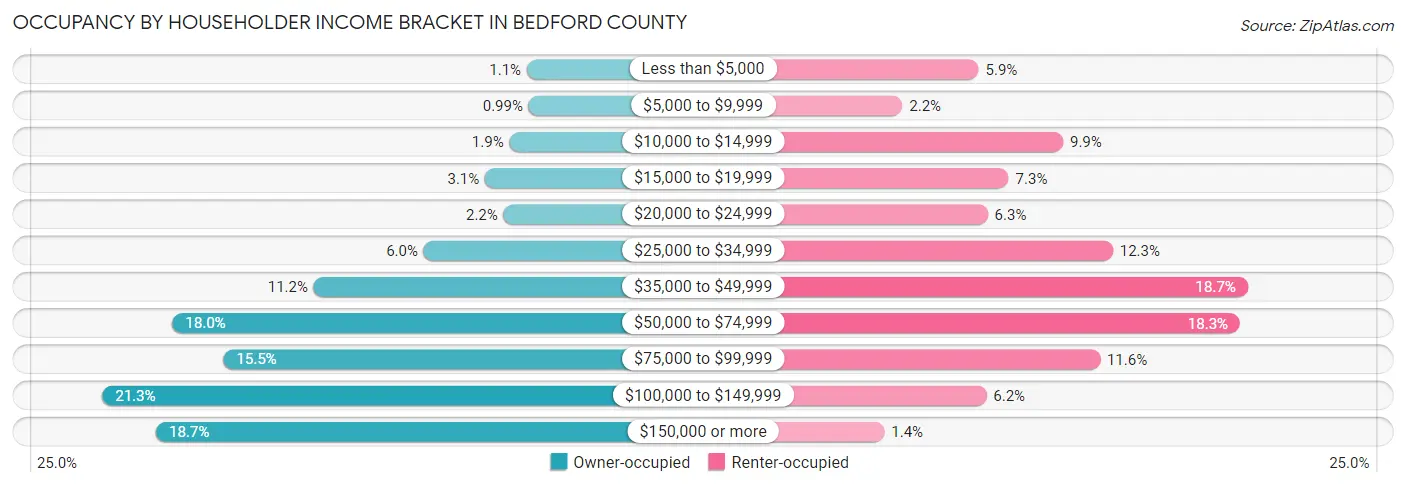
| Income Bracket | Owner-occupied | Renter-occupied |
| Less than $5,000 | 295 (1.1%) | 300 (5.9%) |
| $5,000 to $9,999 | 272 (1.0%) | 114 (2.2%) |
| $10,000 to $14,999 | 523 (1.9%) | 506 (9.9%) |
| $15,000 to $19,999 | 840 (3.1%) | 373 (7.3%) |
| $20,000 to $24,999 | 600 (2.2%) | 322 (6.3%) |
| $25,000 to $34,999 | 1,642 (6.0%) | 627 (12.2%) |
| $35,000 to $49,999 | 3,075 (11.2%) | 956 (18.7%) |
| $50,000 to $74,999 | 4,920 (18.0%) | 937 (18.3%) |
| $75,000 to $99,999 | 4,254 (15.5%) | 596 (11.6%) |
| $100,000 to $149,999 | 5,835 (21.3%) | 319 (6.2%) |
| $150,000 or more | 5,134 (18.7%) | 70 (1.4%) |
| Total | 27,390 (100.0%) | 5,120 (100.0%) |
Monthly Housing Cost Tiers in Bedford County
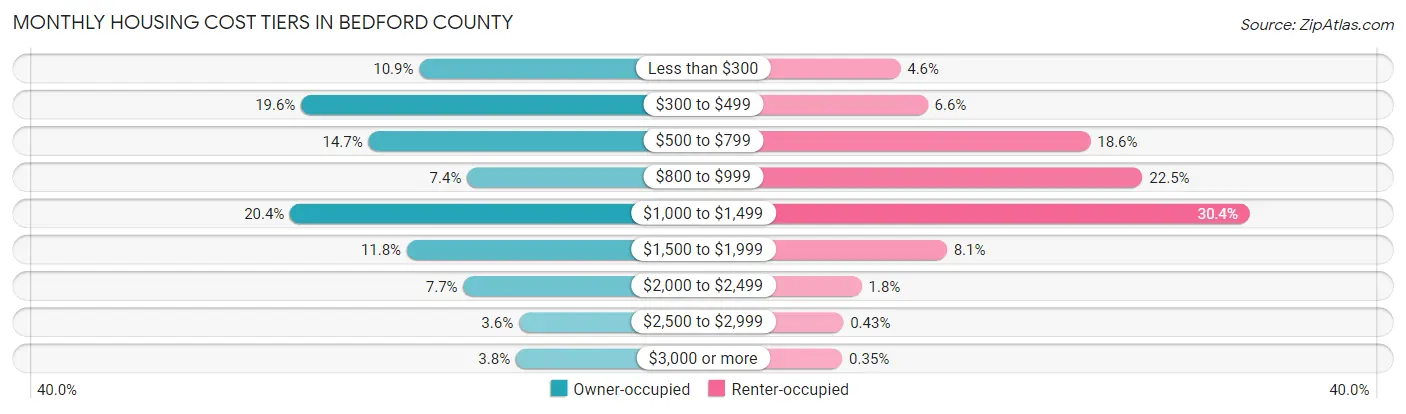
| Monthly Cost | Owner-occupied | Renter-occupied |
| Less than $300 | 2,993 (10.9%) | 237 (4.6%) |
| $300 to $499 | 5,378 (19.6%) | 340 (6.6%) |
| $500 to $799 | 4,019 (14.7%) | 954 (18.6%) |
| $800 to $999 | 2,028 (7.4%) | 1,150 (22.5%) |
| $1,000 to $1,499 | 5,599 (20.4%) | 1,555 (30.4%) |
| $1,500 to $1,999 | 3,244 (11.8%) | 412 (8.1%) |
| $2,000 to $2,499 | 2,103 (7.7%) | 91 (1.8%) |
| $2,500 to $2,999 | 982 (3.6%) | 22 (0.4%) |
| $3,000 or more | 1,044 (3.8%) | 18 (0.4%) |
| Total | 27,390 (100.0%) | 5,120 (100.0%) |
Physical Housing Characteristics in Bedford County
Housing Structures in Bedford County
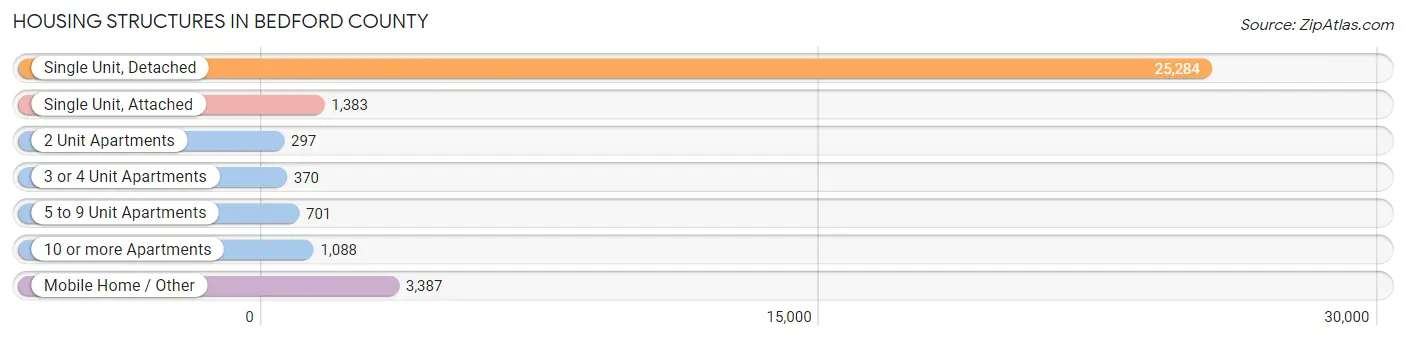
| Structure Type | # Housing Units | % Housing Units |
| Single Unit, Detached | 25,284 | 77.8% |
| Single Unit, Attached | 1,383 | 4.3% |
| 2 Unit Apartments | 297 | 0.9% |
| 3 or 4 Unit Apartments | 370 | 1.1% |
| 5 to 9 Unit Apartments | 701 | 2.2% |
| 10 or more Apartments | 1,088 | 3.4% |
| Mobile Home / Other | 3,387 | 10.4% |
| Total | 32,510 | 100.0% |
Housing Structures by Occupancy in Bedford County
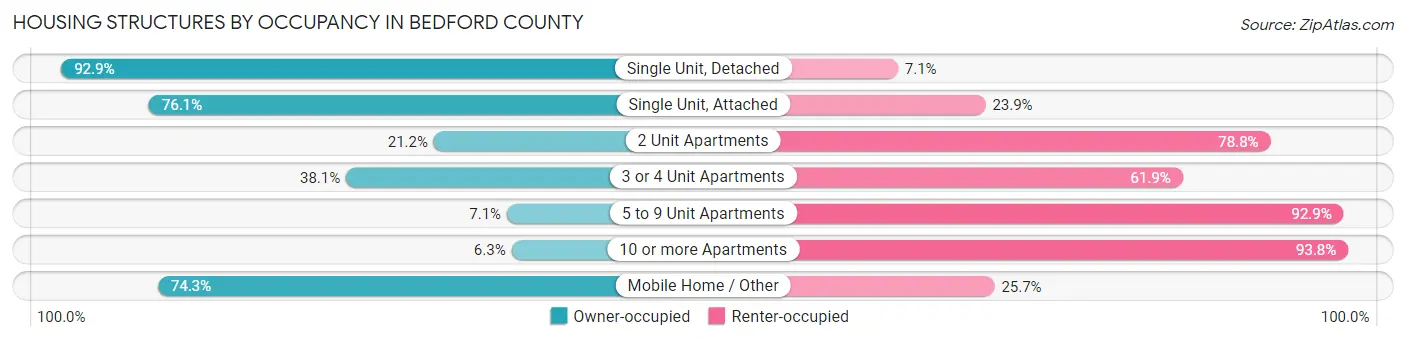
| Structure Type | Owner-occupied | Renter-occupied |
| Single Unit, Detached | 23,498 (92.9%) | 1,786 (7.1%) |
| Single Unit, Attached | 1,052 (76.1%) | 331 (23.9%) |
| 2 Unit Apartments | 63 (21.2%) | 234 (78.8%) |
| 3 or 4 Unit Apartments | 141 (38.1%) | 229 (61.9%) |
| 5 to 9 Unit Apartments | 50 (7.1%) | 651 (92.9%) |
| 10 or more Apartments | 68 (6.2%) | 1,020 (93.8%) |
| Mobile Home / Other | 2,518 (74.3%) | 869 (25.7%) |
| Total | 27,390 (84.3%) | 5,120 (15.8%) |
Housing Structures by Number of Rooms in Bedford County
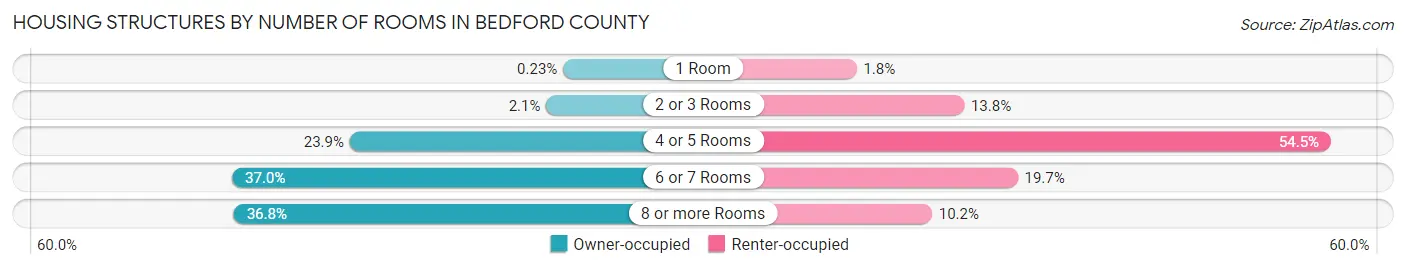
| Number of Rooms | Owner-occupied | Renter-occupied |
| 1 Room | 63 (0.2%) | 94 (1.8%) |
| 2 or 3 Rooms | 575 (2.1%) | 705 (13.8%) |
| 4 or 5 Rooms | 6,549 (23.9%) | 2,790 (54.5%) |
| 6 or 7 Rooms | 10,126 (37.0%) | 1,009 (19.7%) |
| 8 or more Rooms | 10,077 (36.8%) | 522 (10.2%) |
| Total | 27,390 (100.0%) | 5,120 (100.0%) |
Housing Structure by Heating Type in Bedford County
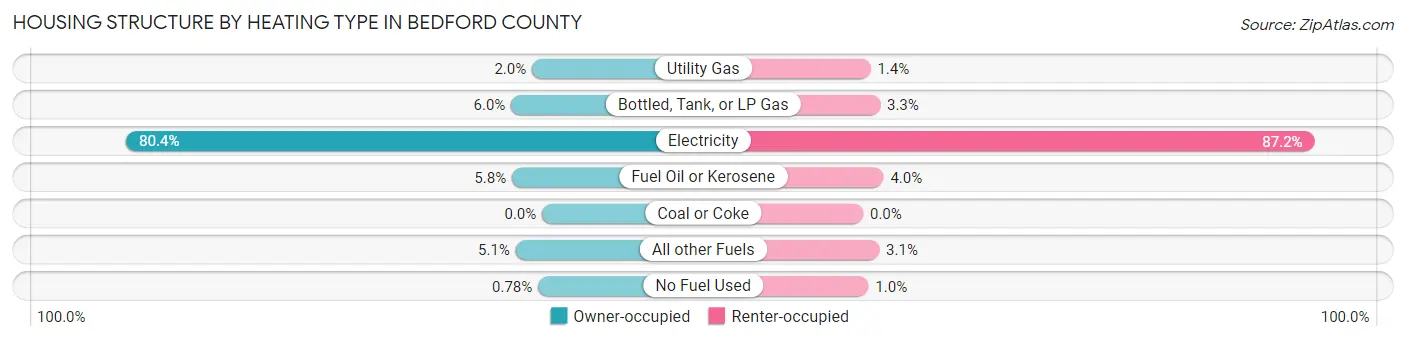
| Heating Type | Owner-occupied | Renter-occupied |
| Utility Gas | 534 (1.9%) | 73 (1.4%) |
| Bottled, Tank, or LP Gas | 1,637 (6.0%) | 168 (3.3%) |
| Electricity | 22,015 (80.4%) | 4,465 (87.2%) |
| Fuel Oil or Kerosene | 1,594 (5.8%) | 202 (4.0%) |
| Coal or Coke | 0 (0.0%) | 0 (0.0%) |
| All other Fuels | 1,397 (5.1%) | 159 (3.1%) |
| No Fuel Used | 213 (0.8%) | 53 (1.0%) |
| Total | 27,390 (100.0%) | 5,120 (100.0%) |
Household Vehicle Usage in Bedford County
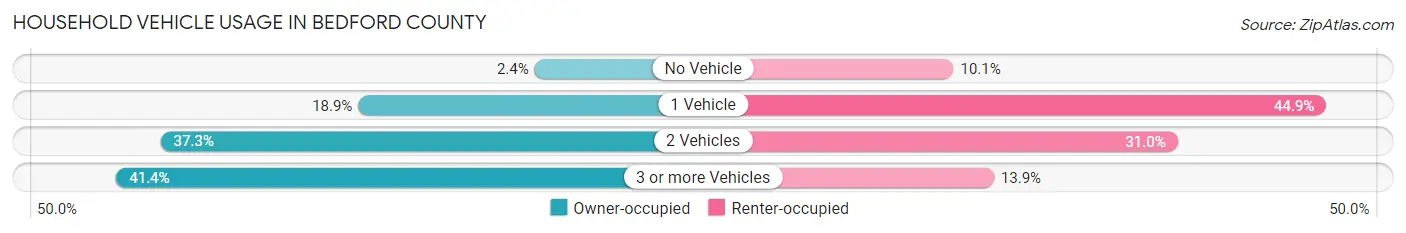
| Vehicles per Household | Owner-occupied | Renter-occupied |
| No Vehicle | 658 (2.4%) | 519 (10.1%) |
| 1 Vehicle | 5,165 (18.9%) | 2,300 (44.9%) |
| 2 Vehicles | 10,220 (37.3%) | 1,589 (31.0%) |
| 3 or more Vehicles | 11,347 (41.4%) | 712 (13.9%) |
| Total | 27,390 (100.0%) | 5,120 (100.0%) |
Real Estate & Mortgages in Bedford County
Real Estate and Mortgage Overview in Bedford County
| Characteristic | Without Mortgage | With Mortgage |
| Housing Units | 11,053 | 16,337 |
| Median Property Value | $238,500 | $275,700 |
| Median Household Income | $62,042 | $3,738 |
| Monthly Housing Costs | $398 | $1,036 |
| Real Estate Taxes | $1,157 | $538 |
Property Value by Mortgage Status in Bedford County
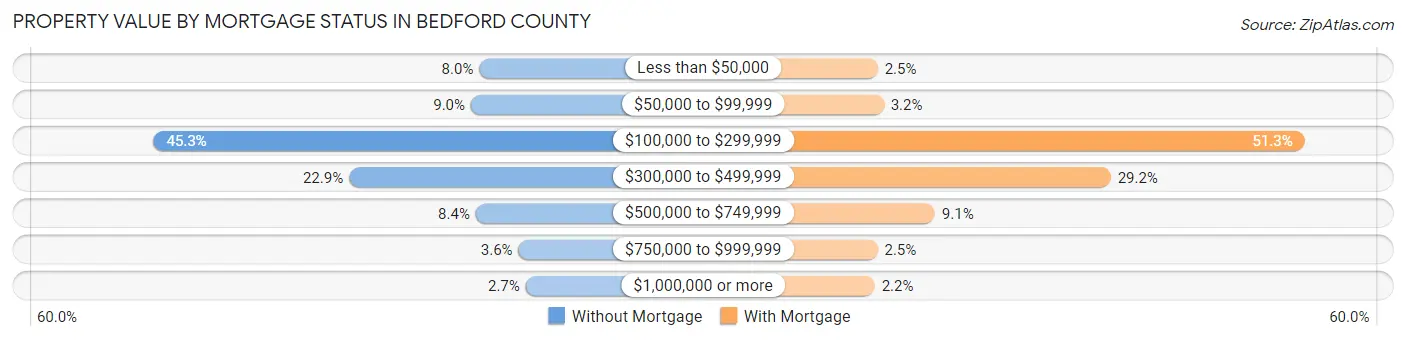
| Property Value | Without Mortgage | With Mortgage |
| Less than $50,000 | 889 (8.0%) | 414 (2.5%) |
| $50,000 to $99,999 | 995 (9.0%) | 526 (3.2%) |
| $100,000 to $299,999 | 5,004 (45.3%) | 8,384 (51.3%) |
| $300,000 to $499,999 | 2,535 (22.9%) | 4,764 (29.2%) |
| $500,000 to $749,999 | 933 (8.4%) | 1,482 (9.1%) |
| $750,000 to $999,999 | 394 (3.6%) | 410 (2.5%) |
| $1,000,000 or more | 303 (2.7%) | 357 (2.2%) |
| Total | 11,053 (100.0%) | 16,337 (100.0%) |
Household Income by Mortgage Status in Bedford County
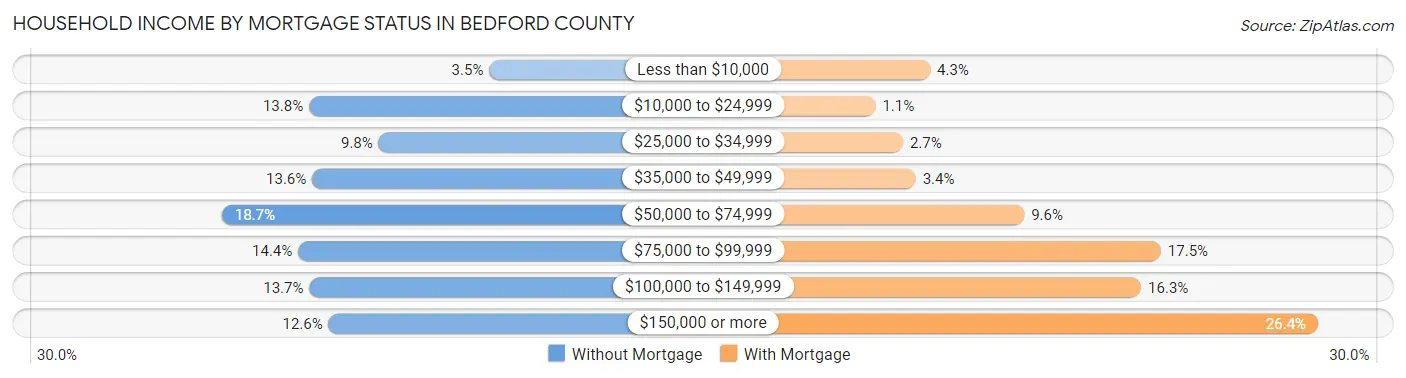
| Household Income | Without Mortgage | With Mortgage |
| Less than $10,000 | 381 (3.5%) | 696 (4.3%) |
| $10,000 to $24,999 | 1,520 (13.8%) | 186 (1.1%) |
| $25,000 to $34,999 | 1,080 (9.8%) | 443 (2.7%) |
| $35,000 to $49,999 | 1,500 (13.6%) | 562 (3.4%) |
| $50,000 to $74,999 | 2,070 (18.7%) | 1,575 (9.6%) |
| $75,000 to $99,999 | 1,588 (14.4%) | 2,850 (17.4%) |
| $100,000 to $149,999 | 1,518 (13.7%) | 2,666 (16.3%) |
| $150,000 or more | 1,396 (12.6%) | 4,317 (26.4%) |
| Total | 11,053 (100.0%) | 16,337 (100.0%) |
Property Value to Household Income Ratio in Bedford County
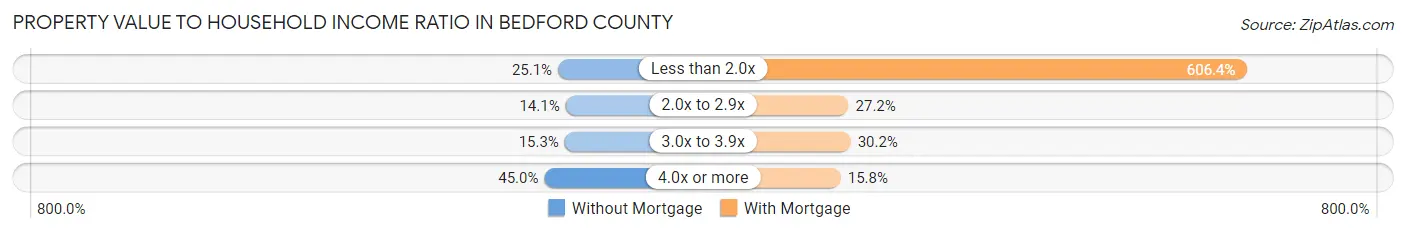
| Value-to-Income Ratio | Without Mortgage | With Mortgage |
| Less than 2.0x | 2,775 (25.1%) | 99,067 (606.4%) |
| 2.0x to 2.9x | 1,563 (14.1%) | 4,441 (27.2%) |
| 3.0x to 3.9x | 1,693 (15.3%) | 4,936 (30.2%) |
| 4.0x or more | 4,970 (45.0%) | 2,588 (15.8%) |
| Total | 11,053 (100.0%) | 16,337 (100.0%) |
Real Estate Taxes by Mortgage Status in Bedford County

| Property Taxes | Without Mortgage | With Mortgage |
| Less than $800 | 3,347 (30.3%) | 16 (0.1%) |
| $800 to $1,499 | 4,065 (36.8%) | 3,737 (22.9%) |
| $800 to $1,499 | 3,357 (30.4%) | 6,302 (38.6%) |
| Total | 11,053 (100.0%) | 16,337 (100.0%) |
Health & Disability in Bedford County
Health Insurance Coverage by Age in Bedford County
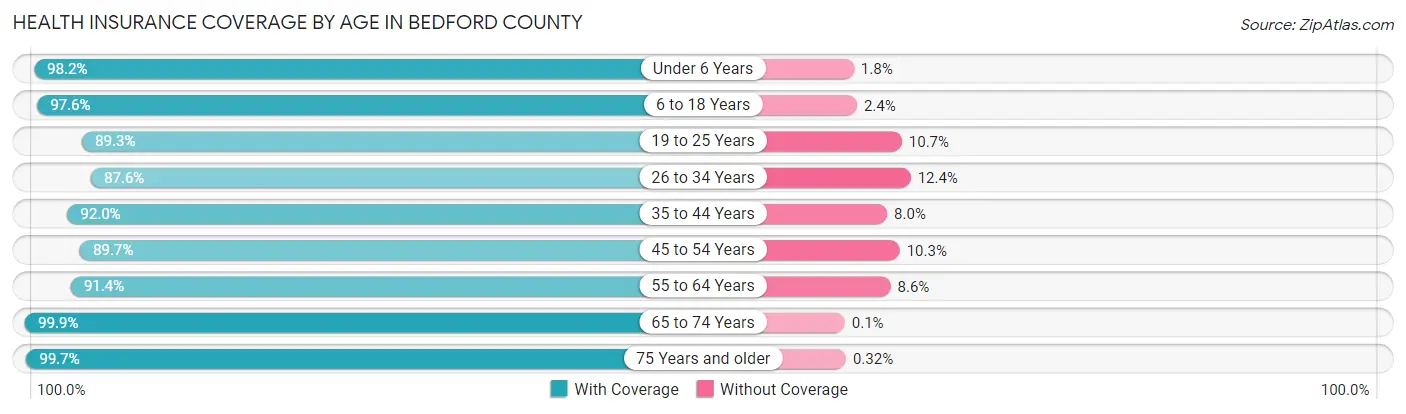
| Age Bracket | With Coverage | Without Coverage |
| Under 6 Years | 4,731 (98.2%) | 86 (1.8%) |
| 6 to 18 Years | 11,167 (97.6%) | 270 (2.4%) |
| 19 to 25 Years | 5,658 (89.3%) | 680 (10.7%) |
| 26 to 34 Years | 6,227 (87.6%) | 880 (12.4%) |
| 35 to 44 Years | 7,752 (92.0%) | 673 (8.0%) |
| 45 to 54 Years | 9,565 (89.7%) | 1,103 (10.3%) |
| 55 to 64 Years | 11,967 (91.4%) | 1,131 (8.6%) |
| 65 to 74 Years | 10,492 (99.9%) | 10 (0.1%) |
| 75 Years and older | 6,867 (99.7%) | 22 (0.3%) |
| Total | 74,426 (93.9%) | 4,855 (6.1%) |
Health Insurance Coverage by Citizenship Status in Bedford County

| Citizenship Status | With Coverage | Without Coverage |
| Native Born | 4,731 (98.2%) | 86 (1.8%) |
| Foreign Born, Citizen | 11,167 (97.6%) | 270 (2.4%) |
| Foreign Born, not a Citizen | 5,658 (89.3%) | 680 (10.7%) |
Health Insurance Coverage by Household Income in Bedford County
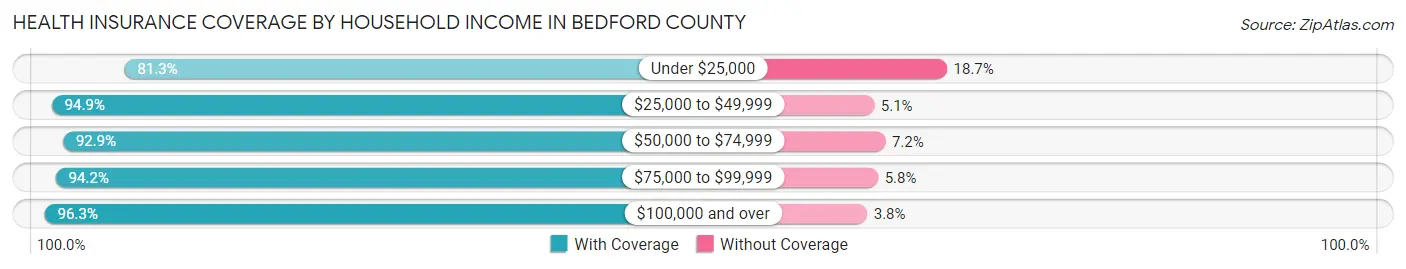
| Household Income | With Coverage | Without Coverage |
| Under $25,000 | 5,300 (81.3%) | 1,219 (18.7%) |
| $25,000 to $49,999 | 12,061 (94.9%) | 644 (5.1%) |
| $50,000 to $74,999 | 13,135 (92.8%) | 1,011 (7.1%) |
| $75,000 to $99,999 | 10,937 (94.2%) | 672 (5.8%) |
| $100,000 and over | 32,910 (96.3%) | 1,283 (3.7%) |
Public vs Private Health Insurance Coverage by Age in Bedford County
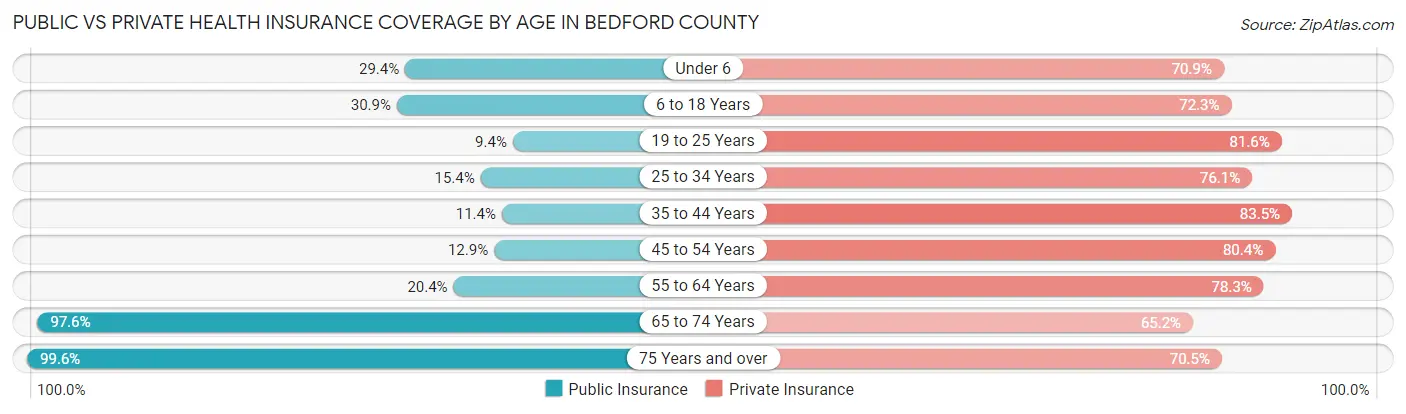
| Age Bracket | Public Insurance | Private Insurance |
| Under 6 | 1,415 (29.4%) | 3,415 (70.9%) |
| 6 to 18 Years | 3,536 (30.9%) | 8,268 (72.3%) |
| 19 to 25 Years | 595 (9.4%) | 5,174 (81.6%) |
| 25 to 34 Years | 1,092 (15.4%) | 5,411 (76.1%) |
| 35 to 44 Years | 963 (11.4%) | 7,038 (83.5%) |
| 45 to 54 Years | 1,374 (12.9%) | 8,577 (80.4%) |
| 55 to 64 Years | 2,672 (20.4%) | 10,256 (78.3%) |
| 65 to 74 Years | 10,254 (97.6%) | 6,844 (65.2%) |
| 75 Years and over | 6,859 (99.6%) | 4,859 (70.5%) |
| Total | 28,760 (36.3%) | 59,842 (75.5%) |
Disability Status by Sex by Age in Bedford County
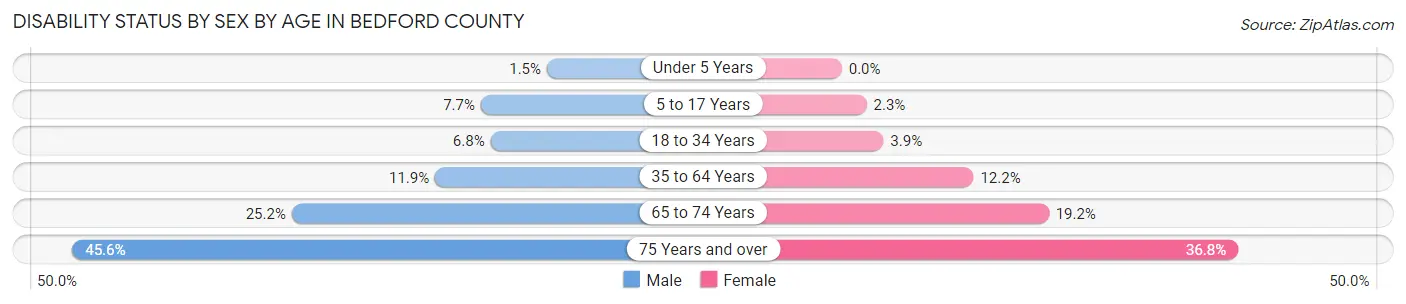
| Age Bracket | Male | Female |
| Under 5 Years | 26 (1.5%) | 0 (0.0%) |
| 5 to 17 Years | 469 (7.7%) | 137 (2.3%) |
| 18 to 34 Years | 485 (6.8%) | 267 (3.9%) |
| 35 to 64 Years | 1,899 (11.9%) | 1,986 (12.2%) |
| 65 to 74 Years | 1,298 (25.2%) | 1,028 (19.2%) |
| 75 Years and over | 1,409 (45.6%) | 1,396 (36.8%) |
Disability Class by Sex by Age in Bedford County
Disability Class: Hearing Difficulty
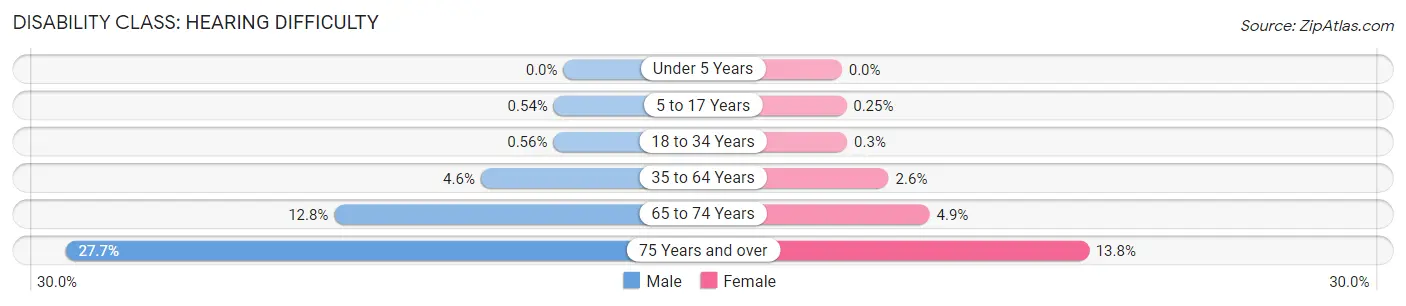
| Age Bracket | Male | Female |
| Under 5 Years | 0 (0.0%) | 0 (0.0%) |
| 5 to 17 Years | 33 (0.5%) | 15 (0.3%) |
| 18 to 34 Years | 40 (0.6%) | 21 (0.3%) |
| 35 to 64 Years | 733 (4.6%) | 424 (2.6%) |
| 65 to 74 Years | 657 (12.8%) | 262 (4.9%) |
| 75 Years and over | 857 (27.7%) | 522 (13.8%) |
Disability Class: Vision Difficulty
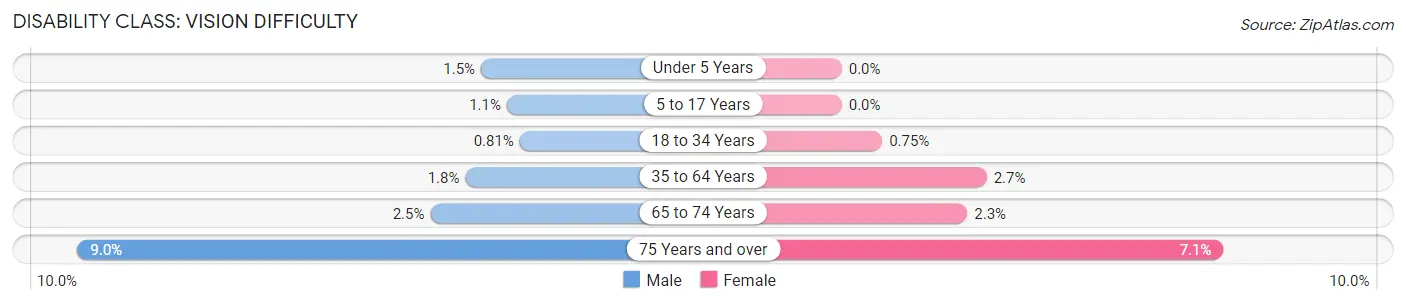
| Age Bracket | Male | Female |
| Under 5 Years | 26 (1.5%) | 0 (0.0%) |
| 5 to 17 Years | 64 (1.1%) | 0 (0.0%) |
| 18 to 34 Years | 58 (0.8%) | 52 (0.7%) |
| 35 to 64 Years | 290 (1.8%) | 437 (2.7%) |
| 65 to 74 Years | 127 (2.5%) | 125 (2.3%) |
| 75 Years and over | 279 (9.0%) | 269 (7.1%) |
Disability Class: Cognitive Difficulty
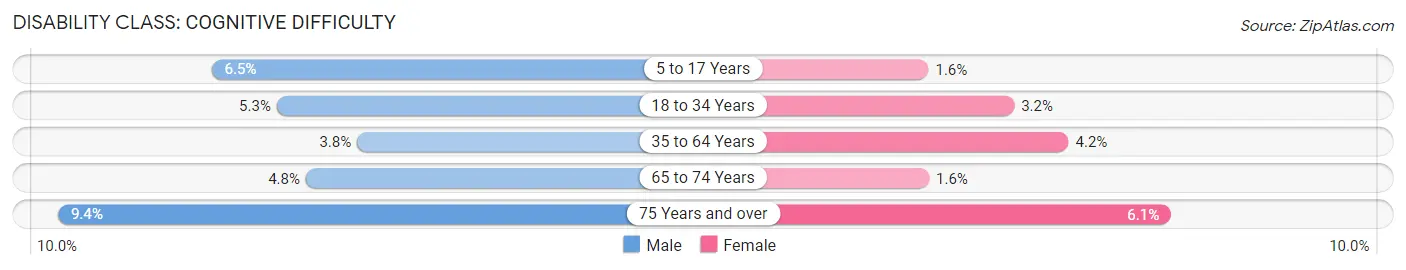
| Age Bracket | Male | Female |
| 5 to 17 Years | 400 (6.5%) | 96 (1.6%) |
| 18 to 34 Years | 382 (5.3%) | 221 (3.2%) |
| 35 to 64 Years | 610 (3.8%) | 684 (4.2%) |
| 65 to 74 Years | 246 (4.8%) | 87 (1.6%) |
| 75 Years and over | 290 (9.4%) | 232 (6.1%) |
Disability Class: Ambulatory Difficulty
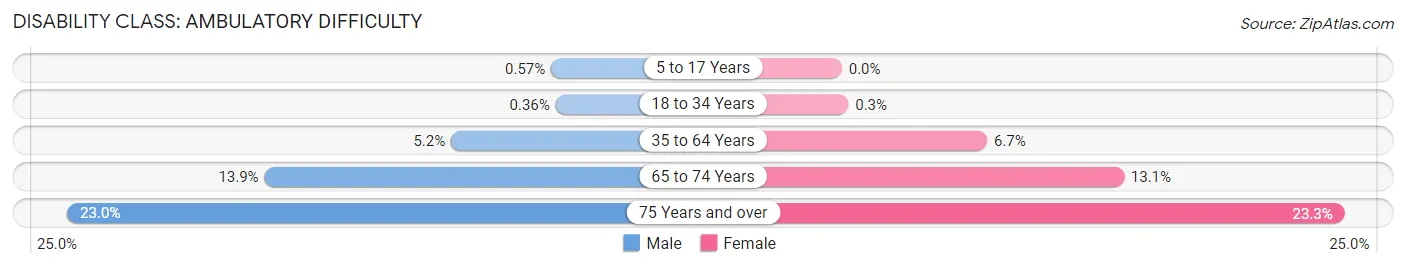
| Age Bracket | Male | Female |
| 5 to 17 Years | 35 (0.6%) | 0 (0.0%) |
| 18 to 34 Years | 26 (0.4%) | 21 (0.3%) |
| 35 to 64 Years | 831 (5.2%) | 1,095 (6.7%) |
| 65 to 74 Years | 714 (13.9%) | 701 (13.1%) |
| 75 Years and over | 712 (23.0%) | 886 (23.3%) |
Disability Class: Self-Care Difficulty
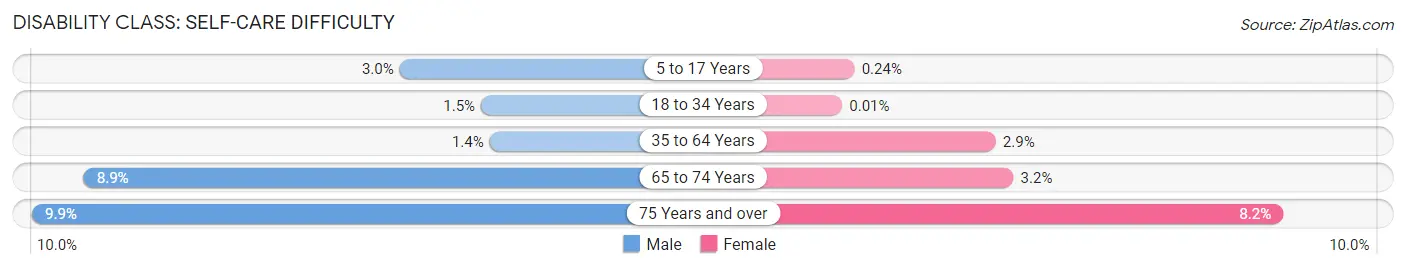
| Age Bracket | Male | Female |
| 5 to 17 Years | 186 (3.0%) | 14 (0.2%) |
| 18 to 34 Years | 110 (1.5%) | 1 (0.0%) |
| 35 to 64 Years | 218 (1.4%) | 464 (2.9%) |
| 65 to 74 Years | 458 (8.9%) | 171 (3.2%) |
| 75 Years and over | 305 (9.9%) | 311 (8.2%) |
Technology Access in Bedford County
Computing Device Access in Bedford County
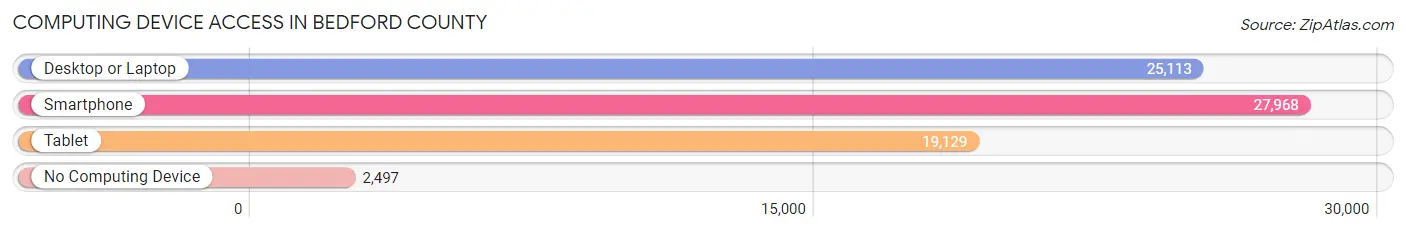
| Device Type | # Households | % Households |
| Desktop or Laptop | 25,113 | 77.2% |
| Smartphone | 27,968 | 86.0% |
| Tablet | 19,129 | 58.8% |
| No Computing Device | 2,497 | 7.7% |
| Total | 32,510 | 100.0% |
Internet Access in Bedford County
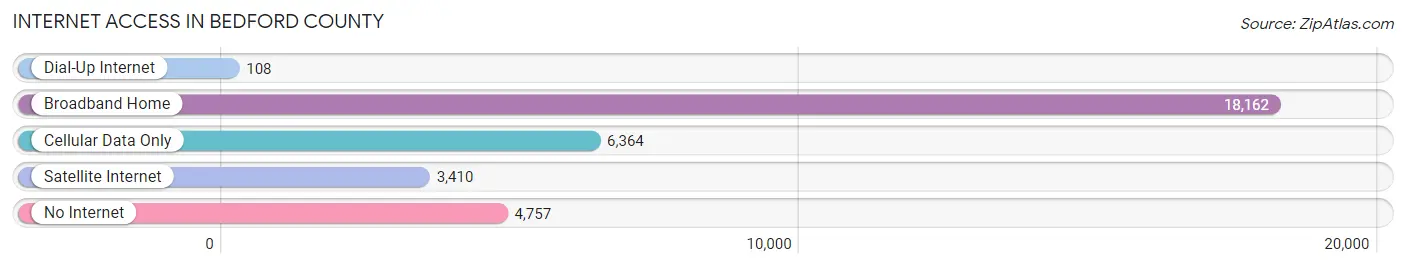
| Internet Type | # Households | % Households |
| Dial-Up Internet | 108 | 0.3% |
| Broadband Home | 18,162 | 55.9% |
| Cellular Data Only | 6,364 | 19.6% |
| Satellite Internet | 3,410 | 10.5% |
| No Internet | 4,757 | 14.6% |
| Total | 32,510 | 100.0% |
Bedford County Summary
Bedford County, Virginia is located in the central part of the state, and is part of the Lynchburg Metropolitan Statistical Area. It is bordered by the counties of Campbell, Amherst, and Franklin, and the city of Lynchburg. The county seat is the town of Bedford, which is also the county’s largest town.
History
Bedford County was formed in 1753 from parts of Lunenburg and Albemarle counties. It was named for John Russell, 4th Duke of Bedford, who was the Secretary of State for the Southern Department of the British government at the time. The county was the site of several battles during the American Revolutionary War, including the Battle of Bedford, which was fought in 1781.
In the 19th century, Bedford County was an important center of the tobacco industry. The county was also home to several prominent figures in American history, including Thomas Jefferson, who owned a plantation in the county, and James Madison, who was born in the county.
Geography
Bedford County is located in the Piedmont region of Virginia, and is part of the Blue Ridge Mountains. The county is mostly mountainous, with the highest point being Sharp Top Mountain, which has an elevation of 3,875 feet. The county is drained by the James River, which flows through the county from north to south.
The county has a total area of 517 square miles, of which 514 square miles is land and 3 square miles is water. The county is home to several state parks, including Peaks of Otter State Park, Smith Mountain Lake State Park, and James River State Park.
Economy
The economy of Bedford County is largely based on agriculture and manufacturing. The county is home to several large farms, which produce a variety of crops, including corn, soybeans, wheat, and hay. The county is also home to several manufacturing companies, which produce a variety of products, including furniture, textiles, and automotive parts.
The county is also home to several tourist attractions, including the Peaks of Otter, which is a popular destination for hikers and campers. The county is also home to several wineries, which produce a variety of wines.
Demographics
As of the 2010 census, Bedford County had a population of 68,676. The population was spread out, with 24.3% under the age of 18, 8.2% from 18 to 24, 28.2% from 25 to 44, 25.2% from 45 to 64, and 14.1% who were 65 years of age or older. The median age was 37.4 years.
The median income for a household in the county was $45,945, and the median income for a family was $54,945. The per capita income for the county was $23,945. About 10.2% of families and 13.2% of the population were below the poverty line, including 17.2% of those under age 18 and 8.2% of those age 65 or over.
The racial makeup of the county was 87.2% White, 8.3% African American, 0.3% Native American, 1.2% Asian, 0.1% Pacific Islander, 1.2% from other races, and 1.8% from two or more races. Hispanic or Latino of any race were 3.2% of the population.
Common Questions
What is Per Capita Income in Bedford County?
Per Capita income in Bedford County is $40,552.
What is the Median Family Income in Bedford County?
Median Family Income in Bedford County is $87,064.
What is the Median Household income in Bedford County?
Median Household Income in Bedford County is $74,773.
What is Income or Wage Gap in Bedford County?
Income or Wage Gap in Bedford County is 31.8%.
Women in Bedford County earn 68.2 cents for every dollar earned by a man.
What is Family Income Deficit in Bedford County?
Family Income Deficit in Bedford County is $9,488.
Families that are below poverty line in Bedford County earn $9,488 less on average than the poverty threshold level.
What is Inequality or Gini Index in Bedford County?
Inequality or Gini Index in Bedford County is 0.44.
What is the Total Population of Bedford County?
Total Population of Bedford County is 79,761.
What is the Total Male Population of Bedford County?
Total Male Population of Bedford County is 39,452.
What is the Total Female Population of Bedford County?
Total Female Population of Bedford County is 40,309.
What is the Ratio of Males per 100 Females in Bedford County?
There are 97.87 Males per 100 Females in Bedford County.
What is the Ratio of Females per 100 Males in Bedford County?
There are 102.17 Females per 100 Males in Bedford County.
What is the Median Population Age in Bedford County?
Median Population Age in Bedford County is 46.8 Years.
What is the Average Family Size in Bedford County
Average Family Size in Bedford County is 2.9 People.
What is the Average Household Size in Bedford County
Average Household Size in Bedford County is 2.4 People.
How Large is the Labor Force in Bedford County?
There are 38,348 People in the Labor Forcein in Bedford County.
What is the Percentage of People in the Labor Force in Bedford County?
57.9% of People are in the Labor Force in Bedford County.
What is the Unemployment Rate in Bedford County?
Unemployment Rate in Bedford County is 2.9%.