Albemarle County, VA Map & Demographics
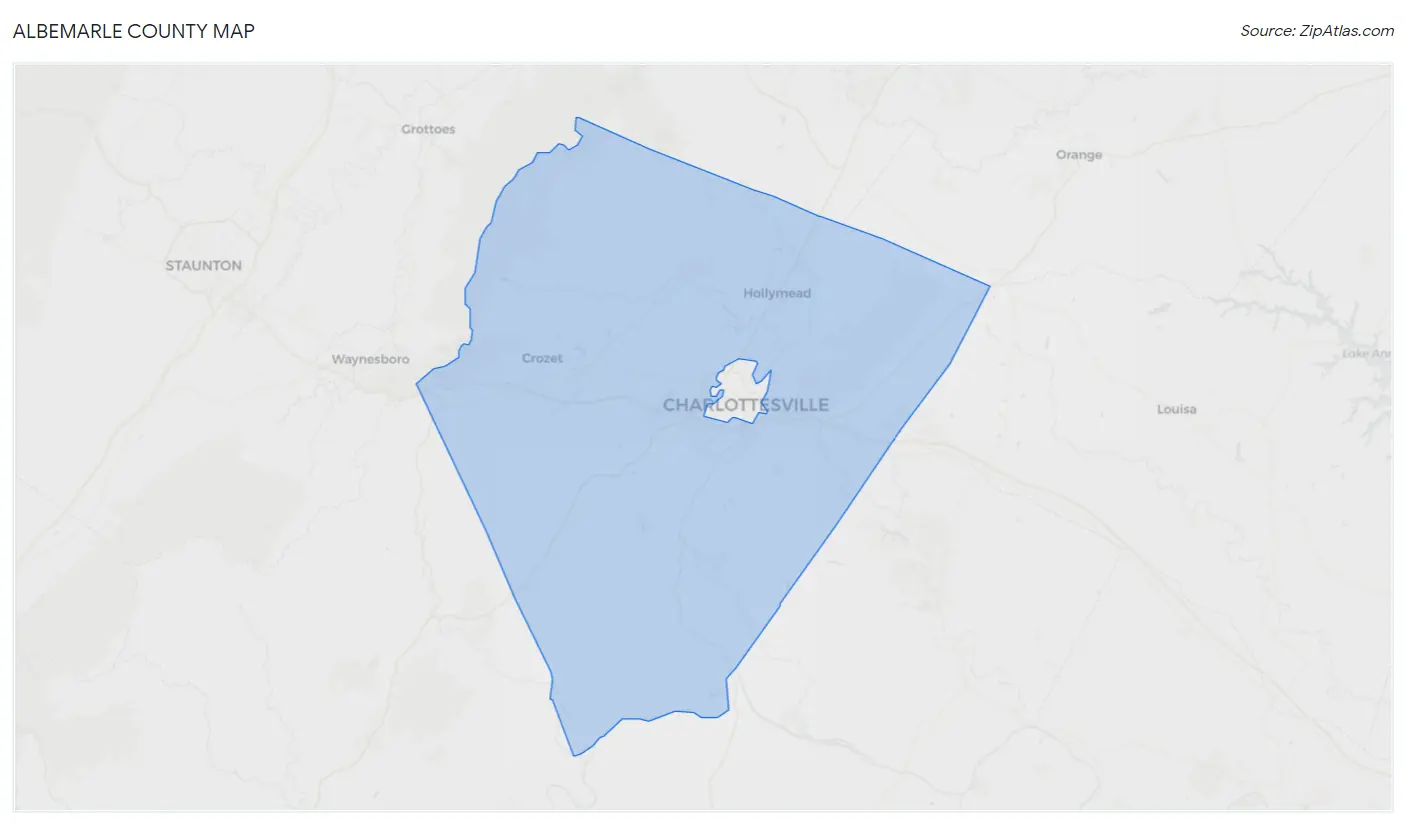
Albemarle County Map
Albemarle County Overview
$55,347
PER CAPITA INCOME
$126,769
AVG FAMILY INCOME
$97,708
AVG HOUSEHOLD INCOME
22.4%
WAGE / INCOME GAP [ % ]
77.6¢/ $1
WAGE / INCOME GAP [ $ ]
$11,643
FAMILY INCOME DEFICIT
0.48
INEQUALITY / GINI INDEX
112,513
TOTAL POPULATION
54,068
MALE POPULATION
58,445
FEMALE POPULATION
92.51
MALES / 100 FEMALES
108.10
FEMALES / 100 MALES
39.7
MEDIAN AGE
2.9
AVG FAMILY SIZE
2.4
AVG HOUSEHOLD SIZE
56,637
LABOR FORCE [ PEOPLE ]
60.8%
PERCENT IN LABOR FORCE
3.1%
UNEMPLOYMENT RATE
Income in Albemarle County
Income Overview in Albemarle County
Per Capita Income in Albemarle County is $55,347, while median incomes of families and households are $126,769 and $97,708 respectively.
| Characteristic | Number | Measure |
| Per Capita Income | 112,513 | $55,347 |
| Median Family Income | 27,331 | $126,769 |
| Mean Family Income | 27,331 | $172,833 |
| Median Household Income | 44,031 | $97,708 |
| Mean Household Income | 44,031 | $137,904 |
| Income Deficit | 27,331 | $11,643 |
| Wage / Income Gap (%) | 112,513 | 22.44% |
| Wage / Income Gap ($) | 112,513 | 77.56¢ per $1 |
| Gini / Inequality Index | 112,513 | 0.48 |
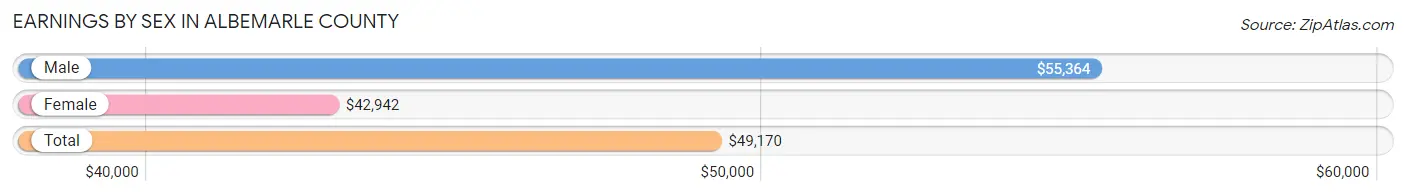
Earnings by Sex in Albemarle County
Average Earnings in Albemarle County are $49,170, $55,364 for men and $42,942 for women, a difference of 22.4%.
| Sex | Number | Average Earnings |
| Male | 31,616 (50.4%) | $55,364 |
| Female | 31,052 (49.5%) | $42,942 |
| Total | 62,668 (100.0%) | $49,170 |
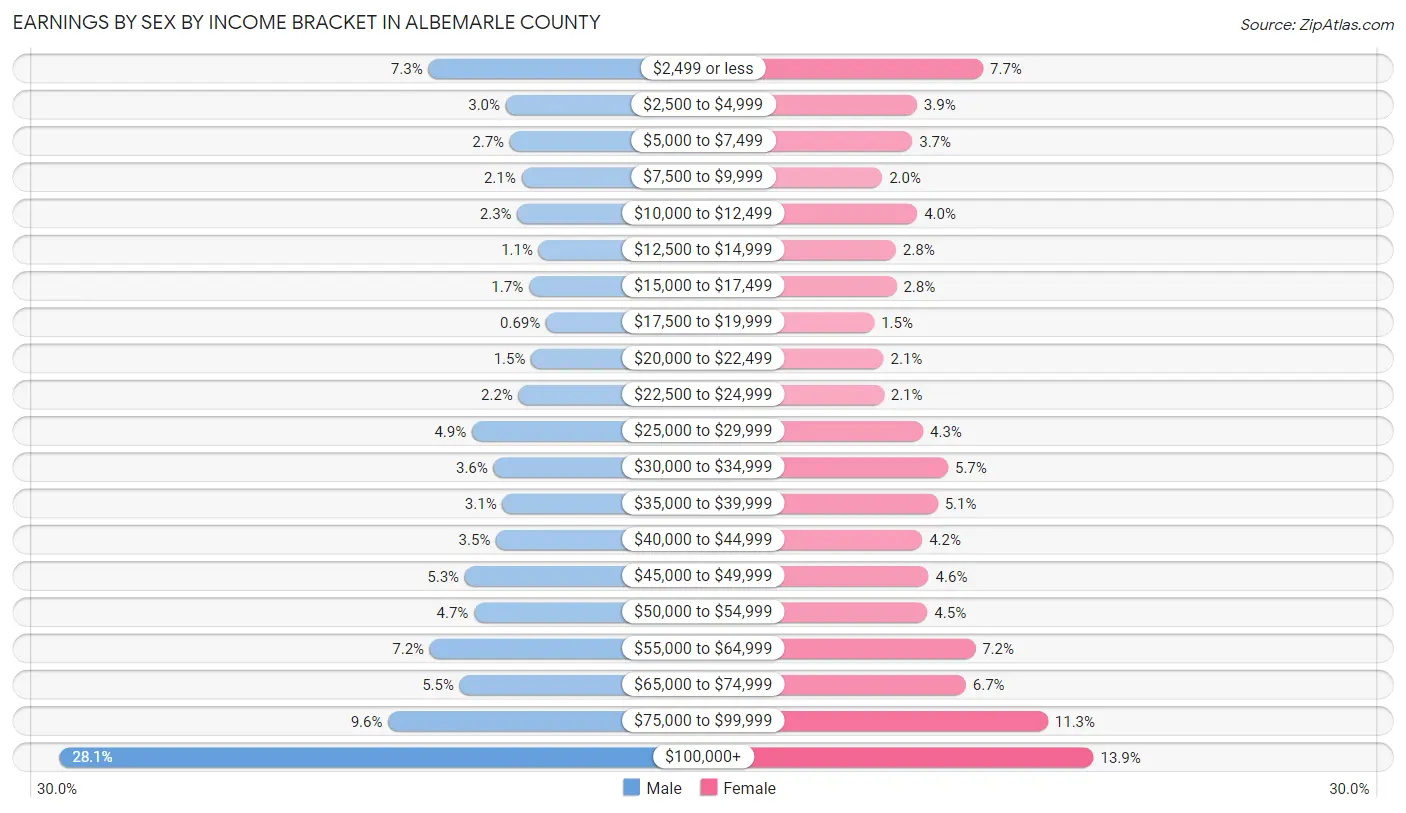
Earnings by Sex by Income Bracket in Albemarle County
The most common earnings brackets in Albemarle County are $100,000+ for men (8,868 | 28.1%) and $100,000+ for women (4,307 | 13.9%).
| Income | Male | Female |
| $2,499 or less | 2,308 (7.3%) | 2,378 (7.7%) |
| $2,500 to $4,999 | 932 (2.9%) | 1,223 (3.9%) |
| $5,000 to $7,499 | 861 (2.7%) | 1,144 (3.7%) |
| $7,500 to $9,999 | 653 (2.1%) | 619 (2.0%) |
| $10,000 to $12,499 | 726 (2.3%) | 1,231 (4.0%) |
| $12,500 to $14,999 | 348 (1.1%) | 856 (2.8%) |
| $15,000 to $17,499 | 523 (1.7%) | 867 (2.8%) |
| $17,500 to $19,999 | 217 (0.7%) | 479 (1.5%) |
| $20,000 to $22,499 | 481 (1.5%) | 642 (2.1%) |
| $22,500 to $24,999 | 706 (2.2%) | 646 (2.1%) |
| $25,000 to $29,999 | 1,532 (4.9%) | 1,332 (4.3%) |
| $30,000 to $34,999 | 1,151 (3.6%) | 1,766 (5.7%) |
| $35,000 to $39,999 | 994 (3.1%) | 1,586 (5.1%) |
| $40,000 to $44,999 | 1,103 (3.5%) | 1,316 (4.2%) |
| $45,000 to $49,999 | 1,661 (5.2%) | 1,427 (4.6%) |
| $50,000 to $54,999 | 1,494 (4.7%) | 1,407 (4.5%) |
| $55,000 to $64,999 | 2,283 (7.2%) | 2,242 (7.2%) |
| $65,000 to $74,999 | 1,751 (5.5%) | 2,076 (6.7%) |
| $75,000 to $99,999 | 3,024 (9.6%) | 3,508 (11.3%) |
| $100,000+ | 8,868 (28.1%) | 4,307 (13.9%) |
| Total | 31,616 (100.0%) | 31,052 (100.0%) |
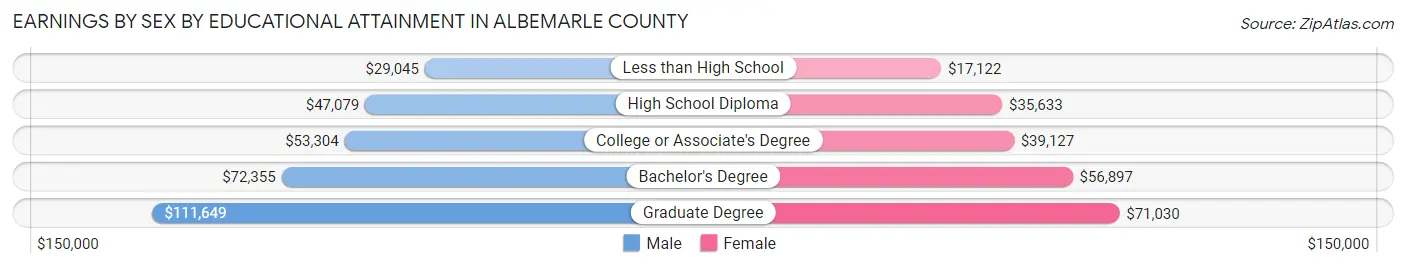
Earnings by Sex by Educational Attainment in Albemarle County
Average earnings in Albemarle County are $67,767 for men and $51,713 for women, a difference of 23.7%. Men with an educational attainment of graduate degree enjoy the highest average annual earnings of $111,649, while those with less than high school education earn the least with $29,045. Women with an educational attainment of graduate degree earn the most with the average annual earnings of $71,030, while those with less than high school education have the smallest earnings of $17,122.
| Educational Attainment | Male Income | Female Income |
| Less than High School | $29,045 | $17,122 |
| High School Diploma | $47,079 | $35,633 |
| College or Associate's Degree | $53,304 | $39,127 |
| Bachelor's Degree | $72,355 | $56,897 |
| Graduate Degree | $111,649 | $71,030 |
| Total | $67,767 | $51,713 |
Family Income in Albemarle County
Family Income Brackets in Albemarle County
According to the Albemarle County family income data, there are 7,024 families falling into the $200,000+ income range, which is the most common income bracket and makes up 25.7% of all families. Conversely, the $10,000 to $14,999 income bracket is the least frequent group with only 191 families (0.7%) belonging to this category.
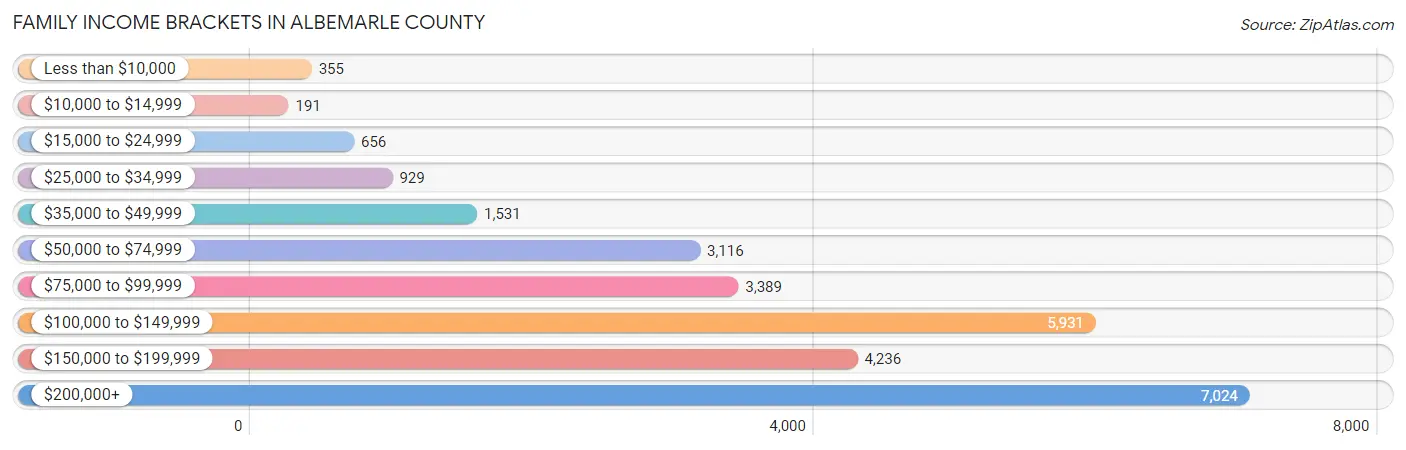
| Income Bracket | # Families | % Families |
| Less than $10,000 | 355 | 1.3% |
| $10,000 to $14,999 | 191 | 0.7% |
| $15,000 to $24,999 | 656 | 2.4% |
| $25,000 to $34,999 | 929 | 3.4% |
| $35,000 to $49,999 | 1,531 | 5.6% |
| $50,000 to $74,999 | 3,116 | 11.4% |
| $75,000 to $99,999 | 3,389 | 12.4% |
| $100,000 to $149,999 | 5,931 | 21.7% |
| $150,000 to $199,999 | 4,236 | 15.5% |
| $200,000+ | 7,024 | 25.7% |
Family Income by Famaliy Size in Albemarle County
6-person families (616 | 2.2%) account for the highest median family income in Albemarle County with $193,750 per family, while 2-person families (13,867 | 50.7%) have the highest median income of $56,732 per family member.
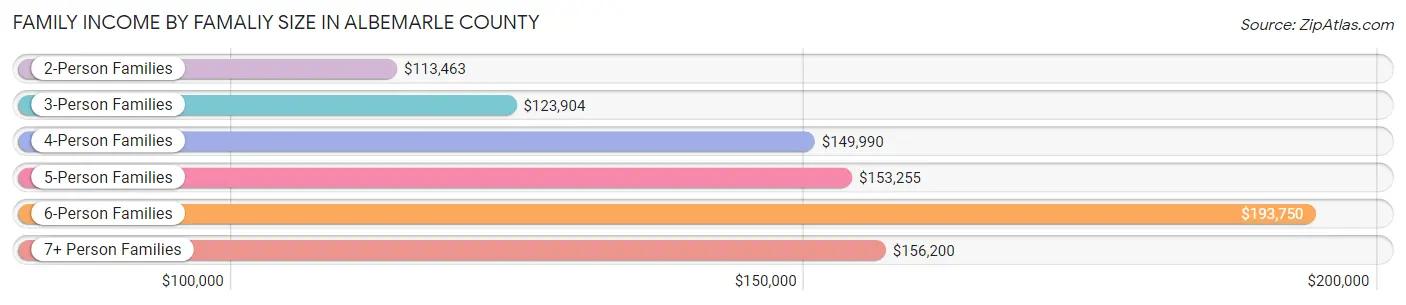
| Income Bracket | # Families | Median Income |
| 2-Person Families | 13,867 (50.7%) | $113,463 |
| 3-Person Families | 5,728 (21.0%) | $123,904 |
| 4-Person Families | 5,213 (19.1%) | $149,990 |
| 5-Person Families | 1,751 (6.4%) | $153,255 |
| 6-Person Families | 616 (2.2%) | $193,750 |
| 7+ Person Families | 156 (0.6%) | $156,200 |
| Total | 27,331 (100.0%) | $126,769 |
Family Income by Number of Earners in Albemarle County
The median family income in Albemarle County is $126,769, with families comprising 3+ earners (2,666) having the highest median family income of $167,933, while families with no earners (4,597) have the lowest median family income of $81,463, accounting for 9.8% and 16.8% of families, respectively.
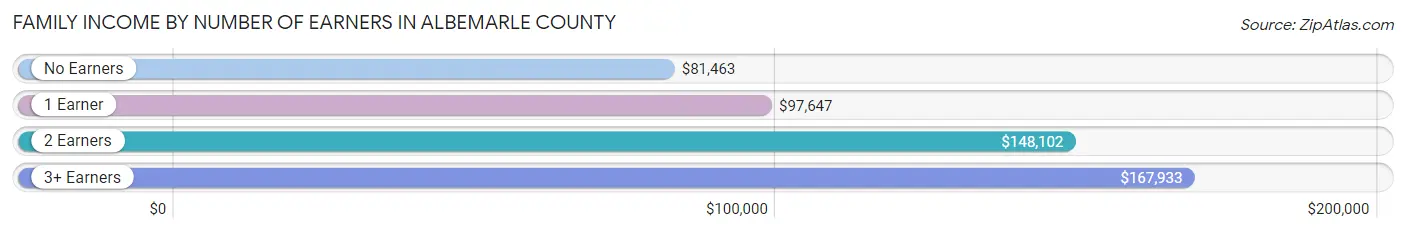
| Number of Earners | # Families | Median Income |
| No Earners | 4,597 (16.8%) | $81,463 |
| 1 Earner | 7,278 (26.6%) | $97,647 |
| 2 Earners | 12,790 (46.8%) | $148,102 |
| 3+ Earners | 2,666 (9.8%) | $167,933 |
| Total | 27,331 (100.0%) | $126,769 |
Household Income in Albemarle County
Household Income Brackets in Albemarle County
With 8,102 households falling in the category, the $100,000 to $149,999 income range is the most frequent in Albemarle County, accounting for 18.4% of all households. In contrast, only 925 households (2.1%) fall into the $10,000 to $14,999 income bracket, making it the least populous group.
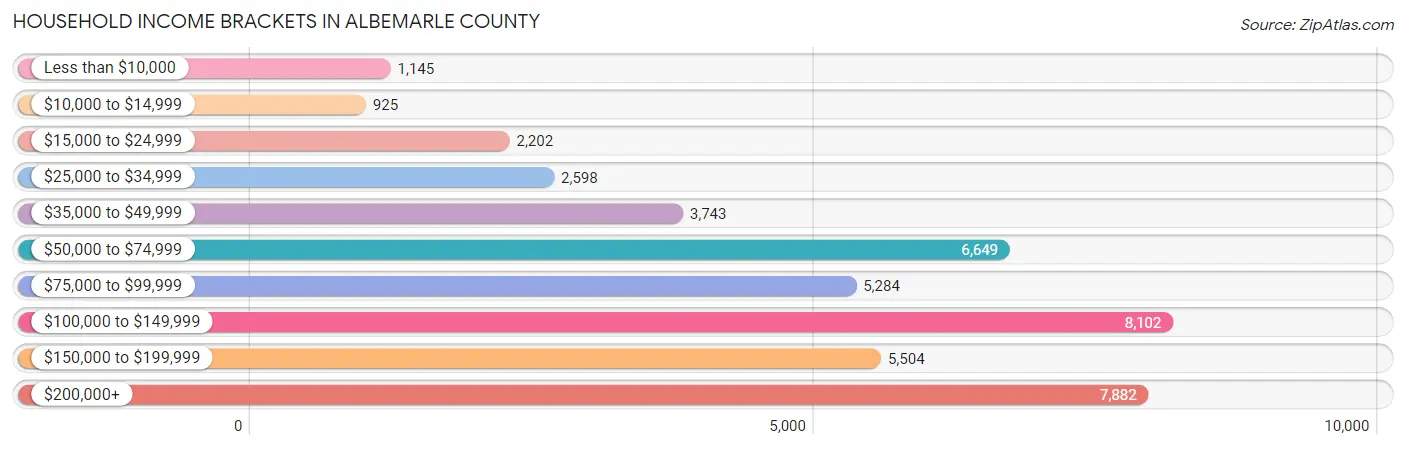
| Income Bracket | # Households | % Households |
| Less than $10,000 | 1,145 | 2.6% |
| $10,000 to $14,999 | 925 | 2.1% |
| $15,000 to $24,999 | 2,202 | 5.0% |
| $25,000 to $34,999 | 2,598 | 5.9% |
| $35,000 to $49,999 | 3,743 | 8.5% |
| $50,000 to $74,999 | 6,649 | 15.1% |
| $75,000 to $99,999 | 5,284 | 12.0% |
| $100,000 to $149,999 | 8,102 | 18.4% |
| $150,000 to $199,999 | 5,504 | 12.5% |
| $200,000+ | 7,882 | 17.9% |
Household Income by Householder Age in Albemarle County
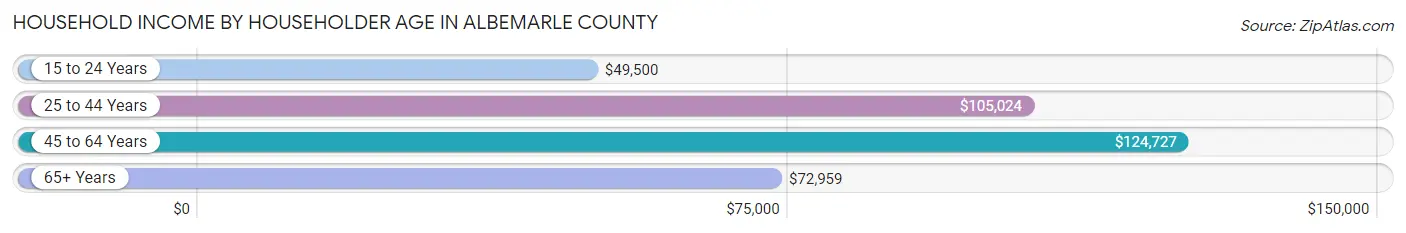
The median household income in Albemarle County is $97,708, with the highest median household income of $124,727 found in the 45 to 64 years age bracket for the primary householder. A total of 15,654 households (35.5%) fall into this category. Meanwhile, the 15 to 24 years age bracket for the primary householder has the lowest median household income of $49,500, with 1,464 households (3.3%) in this group.
| Income Bracket | # Households | Median Income |
| 15 to 24 Years | 1,464 (3.3%) | $49,500 |
| 25 to 44 Years | 12,836 (29.1%) | $105,024 |
| 45 to 64 Years | 15,654 (35.5%) | $124,727 |
| 65+ Years | 14,077 (32.0%) | $72,959 |
| Total | 44,031 (100.0%) | $97,708 |
Poverty in Albemarle County
Income Below Poverty by Sex and Age in Albemarle County
With 5.9% poverty level for males and 8.2% for females among the residents of Albemarle County, 18 to 24 year old males and 18 to 24 year old females are the most vulnerable to poverty, with 409 males (14.1%) and 664 females (17.5%) in their respective age groups living below the poverty level.
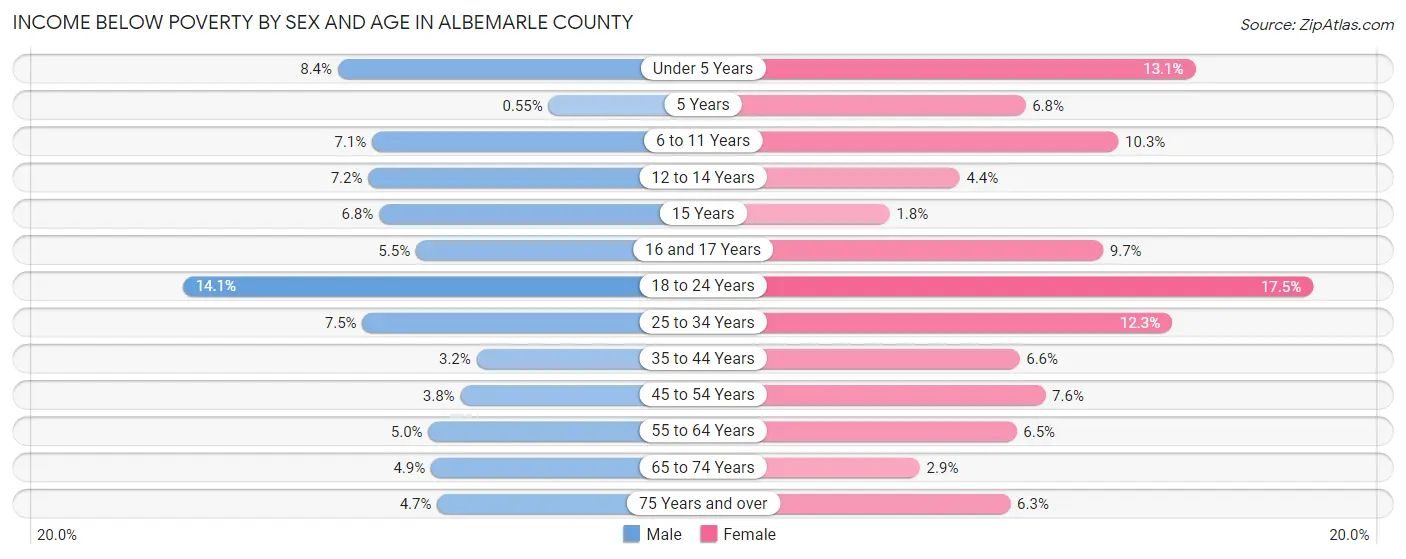
| Age Bracket | Male | Female |
| Under 5 Years | 233 (8.4%) | 369 (13.1%) |
| 5 Years | 3 (0.5%) | 38 (6.8%) |
| 6 to 11 Years | 257 (7.1%) | 369 (10.3%) |
| 12 to 14 Years | 150 (7.2%) | 81 (4.4%) |
| 15 Years | 43 (6.8%) | 11 (1.8%) |
| 16 and 17 Years | 72 (5.5%) | 121 (9.7%) |
| 18 to 24 Years | 409 (14.1%) | 664 (17.5%) |
| 25 to 34 Years | 495 (7.5%) | 860 (12.3%) |
| 35 to 44 Years | 215 (3.2%) | 448 (6.6%) |
| 45 to 54 Years | 237 (3.8%) | 487 (7.5%) |
| 55 to 64 Years | 325 (5.0%) | 497 (6.5%) |
| 65 to 74 Years | 278 (4.9%) | 195 (2.9%) |
| 75 Years and over | 180 (4.7%) | 341 (6.2%) |
| Total | 2,897 (5.9%) | 4,481 (8.2%) |
Income Above Poverty by Sex and Age in Albemarle County
According to the poverty statistics in Albemarle County, males aged 5 years and females aged 15 years are the age groups that are most secure financially, with 99.5% of males and 98.2% of females in these age groups living above the poverty line.
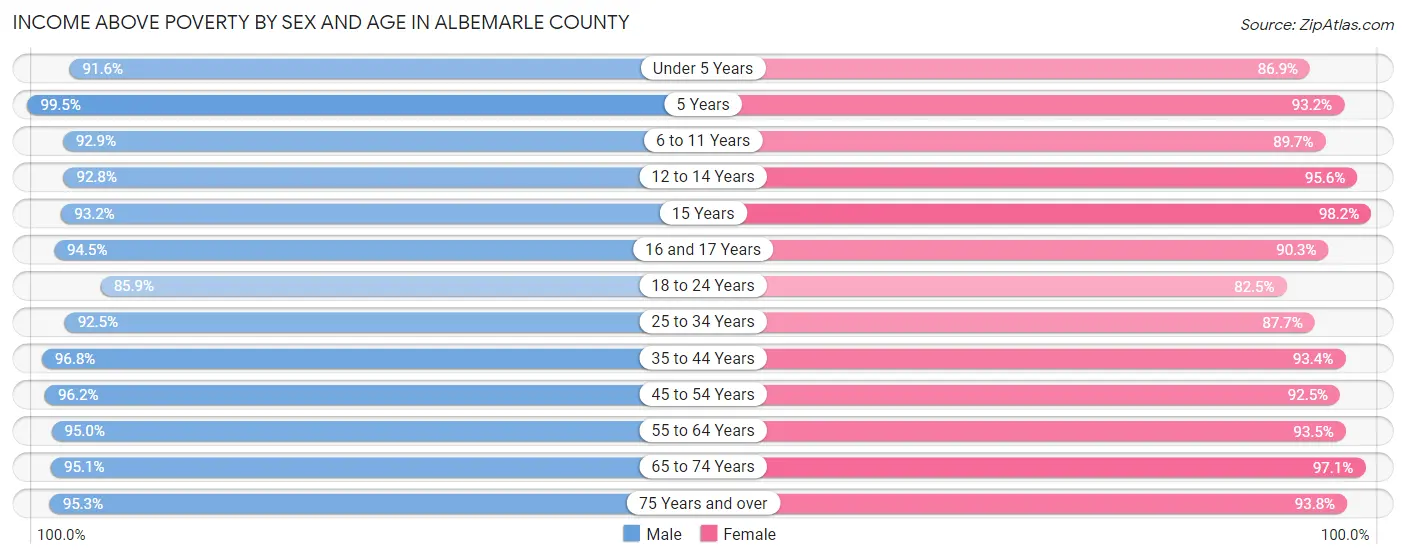
| Age Bracket | Male | Female |
| Under 5 Years | 2,552 (91.6%) | 2,443 (86.9%) |
| 5 Years | 546 (99.5%) | 520 (93.2%) |
| 6 to 11 Years | 3,363 (92.9%) | 3,229 (89.7%) |
| 12 to 14 Years | 1,922 (92.8%) | 1,771 (95.6%) |
| 15 Years | 586 (93.2%) | 609 (98.2%) |
| 16 and 17 Years | 1,244 (94.5%) | 1,128 (90.3%) |
| 18 to 24 Years | 2,485 (85.9%) | 3,132 (82.5%) |
| 25 to 34 Years | 6,140 (92.5%) | 6,154 (87.7%) |
| 35 to 44 Years | 6,469 (96.8%) | 6,350 (93.4%) |
| 45 to 54 Years | 5,963 (96.2%) | 5,965 (92.4%) |
| 55 to 64 Years | 6,167 (95.0%) | 7,169 (93.5%) |
| 65 to 74 Years | 5,383 (95.1%) | 6,556 (97.1%) |
| 75 Years and over | 3,664 (95.3%) | 5,112 (93.8%) |
| Total | 46,484 (94.1%) | 50,138 (91.8%) |
Income Below Poverty Among Married-Couple Families in Albemarle County
The poverty statistics for married-couple families in Albemarle County show that 1.1% or 246 of the total 21,895 families live below the poverty line. Families with 5 or more children have the highest poverty rate of 35.1%, comprising of 26 families. On the other hand, families with 1 or 2 children have the lowest poverty rate of 0.8%, which includes 57 families.
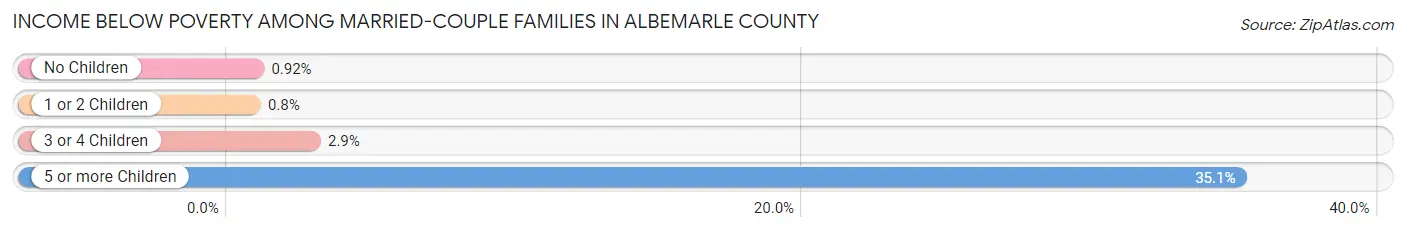
| Children | Above Poverty | Below Poverty |
| No Children | 13,127 (99.1%) | 122 (0.9%) |
| 1 or 2 Children | 7,098 (99.2%) | 57 (0.8%) |
| 3 or 4 Children | 1,376 (97.1%) | 41 (2.9%) |
| 5 or more Children | 48 (64.9%) | 26 (35.1%) |
| Total | 21,649 (98.9%) | 246 (1.1%) |
Income Below Poverty Among Single-Parent Households in Albemarle County
According to the poverty data in Albemarle County, 6.5% or 99 single-father households and 16.7% or 650 single-mother households are living below the poverty line. Among single-father households, those with 1 or 2 children have the highest poverty rate, with 68 households (10.3%) experiencing poverty. Likewise, among single-mother households, those with 3 or 4 children have the highest poverty rate, with 246 households (44.3%) falling below the poverty line.
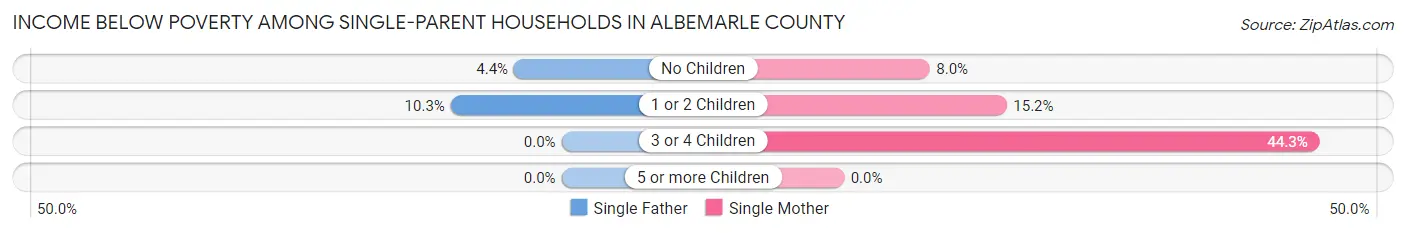
| Children | Single Father | Single Mother |
| No Children | 31 (4.4%) | 115 (8.0%) |
| 1 or 2 Children | 68 (10.3%) | 289 (15.1%) |
| 3 or 4 Children | 0 (0.0%) | 246 (44.3%) |
| 5 or more Children | 0 (0.0%) | 0 (0.0%) |
| Total | 99 (6.5%) | 650 (16.7%) |
Income Below Poverty Among Married-Couple vs Single-Parent Households in Albemarle County
The poverty data for Albemarle County shows that 246 of the married-couple family households (1.1%) and 749 of the single-parent households (13.8%) are living below the poverty level. Within the married-couple family households, those with 5 or more children have the highest poverty rate, with 26 households (35.1%) falling below the poverty line. Among the single-parent households, those with 3 or 4 children have the highest poverty rate, with 246 household (33.7%) living below poverty.
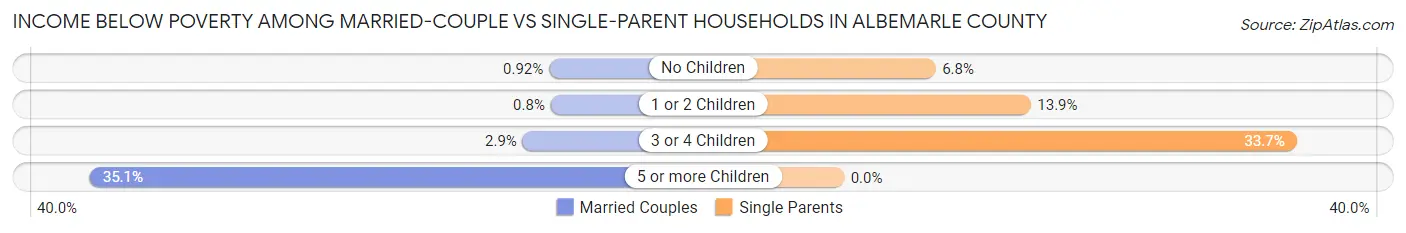
| Children | Married-Couple Families | Single-Parent Households |
| No Children | 122 (0.9%) | 146 (6.8%) |
| 1 or 2 Children | 57 (0.8%) | 357 (13.9%) |
| 3 or 4 Children | 41 (2.9%) | 246 (33.7%) |
| 5 or more Children | 26 (35.1%) | 0 (0.0%) |
| Total | 246 (1.1%) | 749 (13.8%) |
Race in Albemarle County
The most populous races in Albemarle County are White / Caucasian (88,455 | 78.6%), Black / African American (9,966 | 8.9%), and Hispanic or Latino (6,633 | 5.9%).
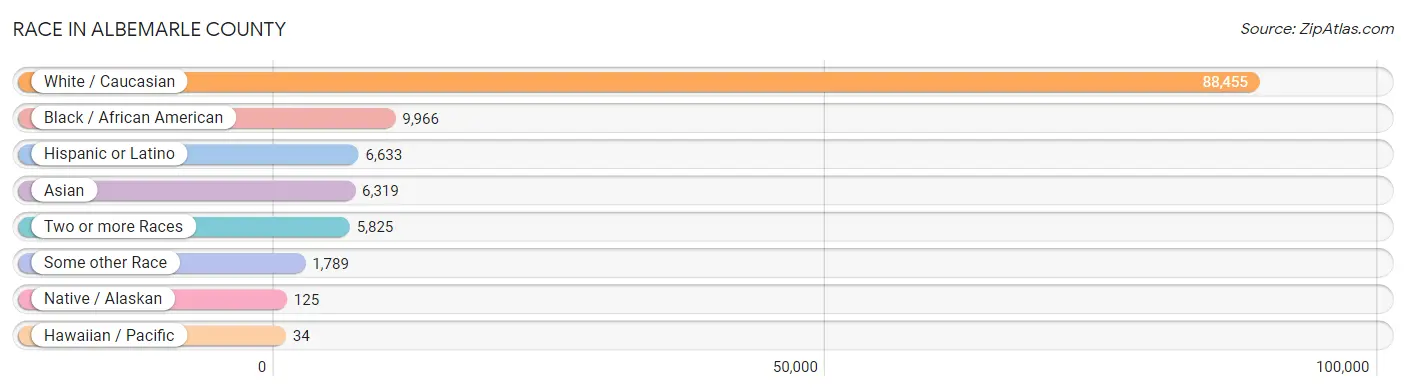
| Race | # Population | % Population |
| Asian | 6,319 | 5.6% |
| Black / African American | 9,966 | 8.9% |
| Hawaiian / Pacific | 34 | 0.0% |
| Hispanic or Latino | 6,633 | 5.9% |
| Native / Alaskan | 125 | 0.1% |
| White / Caucasian | 88,455 | 78.6% |
| Two or more Races | 5,825 | 5.2% |
| Some other Race | 1,789 | 1.6% |
| Total | 112,513 | 100.0% |
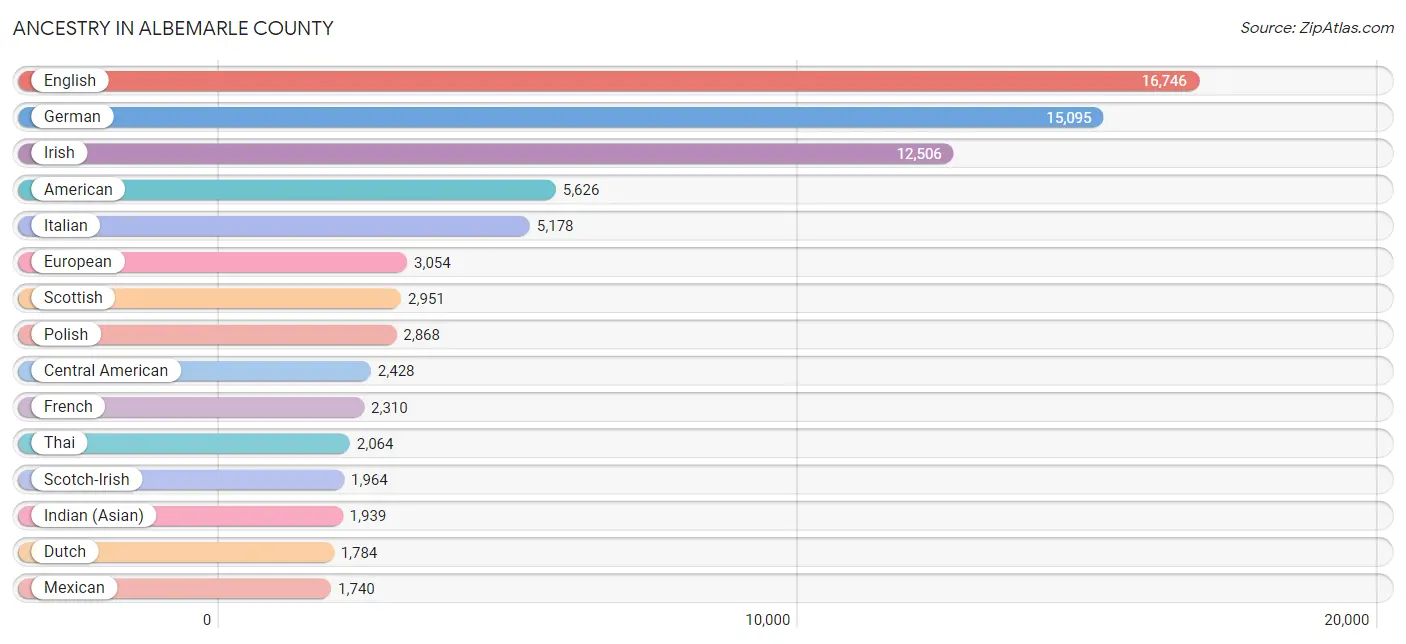
Ancestry in Albemarle County
The most populous ancestries reported in Albemarle County are English (16,746 | 14.9%), German (15,095 | 13.4%), Irish (12,506 | 11.1%), American (5,626 | 5.0%), and Italian (5,178 | 4.6%), together accounting for 49.0% of all Albemarle County residents.
| Ancestry | # Population | % Population |
| Afghan | 117 | 0.1% |
| African | 266 | 0.2% |
| Albanian | 144 | 0.1% |
| American | 5,626 | 5.0% |
| Apache | 19 | 0.0% |
| Arab | 802 | 0.7% |
| Argentinean | 106 | 0.1% |
| Armenian | 74 | 0.1% |
| Australian | 42 | 0.0% |
| Austrian | 413 | 0.4% |
| Basque | 4 | 0.0% |
| Belgian | 15 | 0.0% |
| Bhutanese | 394 | 0.4% |
| Blackfeet | 5 | 0.0% |
| Bolivian | 25 | 0.0% |
| Brazilian | 210 | 0.2% |
| British | 1,689 | 1.5% |
| Bulgarian | 76 | 0.1% |
| Burmese | 1,151 | 1.0% |
| Cajun | 8 | 0.0% |
| Canadian | 148 | 0.1% |
| Cape Verdean | 22 | 0.0% |
| Central American | 2,428 | 2.2% |
| Central American Indian | 79 | 0.1% |
| Cherokee | 82 | 0.1% |
| Chilean | 71 | 0.1% |
| Chippewa | 8 | 0.0% |
| Choctaw | 14 | 0.0% |
| Colombian | 74 | 0.1% |
| Croatian | 104 | 0.1% |
| Cuban | 258 | 0.2% |
| Czech | 224 | 0.2% |
| Czechoslovakian | 61 | 0.1% |
| Danish | 501 | 0.4% |
| Dominican | 85 | 0.1% |
| Dutch | 1,784 | 1.6% |
| Eastern European | 549 | 0.5% |
| Egyptian | 69 | 0.1% |
| English | 16,746 | 14.9% |
| Ethiopian | 22 | 0.0% |
| European | 3,054 | 2.7% |
| Filipino | 25 | 0.0% |
| Finnish | 40 | 0.0% |
| French | 2,310 | 2.1% |
| French American Indian | 12 | 0.0% |
| French Canadian | 394 | 0.4% |
| German | 15,095 | 13.4% |
| German Russian | 13 | 0.0% |
| Ghanaian | 154 | 0.1% |
| Greek | 418 | 0.4% |
| Guamanian / Chamorro | 11 | 0.0% |
| Guatemalan | 162 | 0.1% |
| Honduran | 434 | 0.4% |
| Hungarian | 498 | 0.4% |
| Indian (Asian) | 1,939 | 1.7% |
| Iranian | 208 | 0.2% |
| Iraqi | 46 | 0.0% |
| Irish | 12,506 | 11.1% |
| Iroquois | 77 | 0.1% |
| Israeli | 1 | 0.0% |
| Italian | 5,178 | 4.6% |
| Jamaican | 314 | 0.3% |
| Japanese | 50 | 0.0% |
| Kenyan | 31 | 0.0% |
| Kiowa | 1 | 0.0% |
| Korean | 706 | 0.6% |
| Laotian | 46 | 0.0% |
| Latvian | 27 | 0.0% |
| Lebanese | 480 | 0.4% |
| Lithuanian | 393 | 0.4% |
| Macedonian | 37 | 0.0% |
| Maltese | 3 | 0.0% |
| Menominee | 3 | 0.0% |
| Mexican | 1,740 | 1.5% |
| Mongolian | 20 | 0.0% |
| Moroccan | 18 | 0.0% |
| Native Hawaiian | 110 | 0.1% |
| New Zealander | 9 | 0.0% |
| Nicaraguan | 43 | 0.0% |
| Nigerian | 214 | 0.2% |
| Northern European | 337 | 0.3% |
| Norwegian | 986 | 0.9% |
| Okinawan | 13 | 0.0% |
| Pakistani | 27 | 0.0% |
| Palestinian | 11 | 0.0% |
| Panamanian | 123 | 0.1% |
| Pennsylvania German | 17 | 0.0% |
| Peruvian | 176 | 0.2% |
| Polish | 2,868 | 2.5% |
| Portuguese | 103 | 0.1% |
| Puerto Rican | 750 | 0.7% |
| Romanian | 138 | 0.1% |
| Russian | 764 | 0.7% |
| Salvadoran | 1,650 | 1.5% |
| Samoan | 9 | 0.0% |
| Scandinavian | 411 | 0.4% |
| Scotch-Irish | 1,964 | 1.8% |
| Scottish | 2,951 | 2.6% |
| Serbian | 38 | 0.0% |
| Slavic | 57 | 0.1% |
| Slovak | 467 | 0.4% |
| Slovene | 12 | 0.0% |
| Somali | 3 | 0.0% |
| South African | 9 | 0.0% |
| South American | 592 | 0.5% |
| South American Indian | 18 | 0.0% |
| Spaniard | 286 | 0.3% |
| Spanish | 94 | 0.1% |
| Sri Lankan | 459 | 0.4% |
| Subsaharan African | 883 | 0.8% |
| Sudanese | 84 | 0.1% |
| Swedish | 1,351 | 1.2% |
| Swiss | 326 | 0.3% |
| Syrian | 141 | 0.1% |
| Thai | 2,064 | 1.8% |
| Trinidadian and Tobagonian | 88 | 0.1% |
| Turkish | 166 | 0.2% |
| Ukrainian | 544 | 0.5% |
| Venezuelan | 111 | 0.1% |
| Vietnamese | 208 | 0.2% |
| Welsh | 852 | 0.8% |
| West Indian | 12 | 0.0% |
| Yugoslavian | 79 | 0.1% | View All 123 Rows |
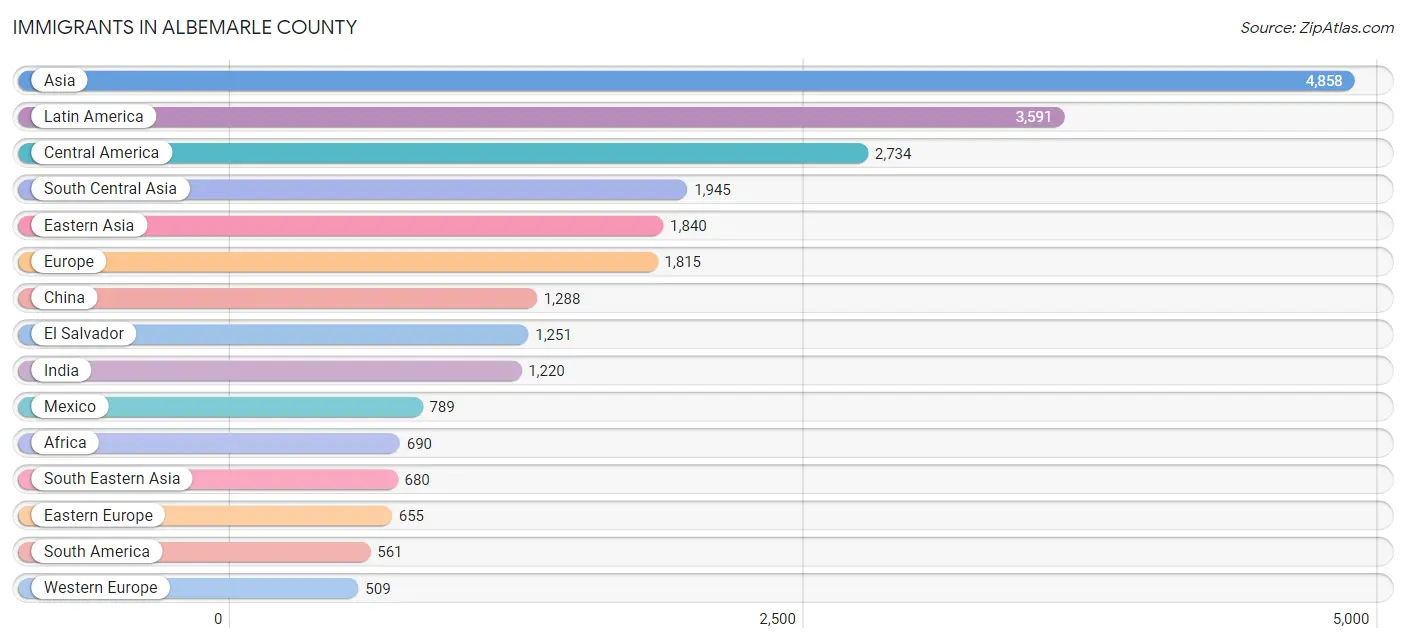
Immigrants in Albemarle County
The most numerous immigrant groups reported in Albemarle County came from Asia (4,858 | 4.3%), Latin America (3,591 | 3.2%), Central America (2,734 | 2.4%), South Central Asia (1,945 | 1.7%), and Eastern Asia (1,840 | 1.6%), together accounting for 13.3% of all Albemarle County residents.
| Immigration Origin | # Population | % Population |
| Afghanistan | 132 | 0.1% |
| Africa | 690 | 0.6% |
| Argentina | 81 | 0.1% |
| Asia | 4,858 | 4.3% |
| Australia | 93 | 0.1% |
| Austria | 45 | 0.0% |
| Bangladesh | 177 | 0.2% |
| Bosnia and Herzegovina | 59 | 0.1% |
| Brazil | 221 | 0.2% |
| Cambodia | 19 | 0.0% |
| Canada | 278 | 0.3% |
| Caribbean | 296 | 0.3% |
| Central America | 2,734 | 2.4% |
| Chile | 56 | 0.1% |
| China | 1,288 | 1.1% |
| Colombia | 73 | 0.1% |
| Congo | 61 | 0.1% |
| Croatia | 12 | 0.0% |
| Cuba | 29 | 0.0% |
| Czechoslovakia | 42 | 0.0% |
| Denmark | 19 | 0.0% |
| Dominican Republic | 25 | 0.0% |
| Eastern Africa | 76 | 0.1% |
| Eastern Asia | 1,840 | 1.6% |
| Eastern Europe | 655 | 0.6% |
| Ecuador | 10 | 0.0% |
| Egypt | 41 | 0.0% |
| El Salvador | 1,251 | 1.1% |
| England | 109 | 0.1% |
| Ethiopia | 11 | 0.0% |
| Europe | 1,815 | 1.6% |
| France | 50 | 0.0% |
| Germany | 232 | 0.2% |
| Ghana | 168 | 0.2% |
| Greece | 17 | 0.0% |
| Guatemala | 71 | 0.1% |
| Haiti | 9 | 0.0% |
| Honduras | 493 | 0.4% |
| Hong Kong | 82 | 0.1% |
| India | 1,220 | 1.1% |
| Indonesia | 29 | 0.0% |
| Iran | 188 | 0.2% |
| Iraq | 72 | 0.1% |
| Ireland | 84 | 0.1% |
| Israel | 1 | 0.0% |
| Italy | 57 | 0.1% |
| Jamaica | 127 | 0.1% |
| Japan | 99 | 0.1% |
| Jordan | 6 | 0.0% |
| Kenya | 10 | 0.0% |
| Korea | 453 | 0.4% |
| Latin America | 3,591 | 3.2% |
| Latvia | 5 | 0.0% |
| Malaysia | 32 | 0.0% |
| Mexico | 789 | 0.7% |
| Middle Africa | 207 | 0.2% |
| Nepal | 50 | 0.0% |
| Netherlands | 102 | 0.1% |
| Nicaragua | 37 | 0.0% |
| Nigeria | 67 | 0.1% |
| Northern Africa | 108 | 0.1% |
| Northern Europe | 476 | 0.4% |
| Norway | 10 | 0.0% |
| Oceania | 110 | 0.1% |
| Pakistan | 76 | 0.1% |
| Panama | 93 | 0.1% |
| Peru | 41 | 0.0% |
| Philippines | 329 | 0.3% |
| Poland | 69 | 0.1% |
| Portugal | 7 | 0.0% |
| Romania | 102 | 0.1% |
| Russia | 136 | 0.1% |
| Saudi Arabia | 8 | 0.0% |
| Scotland | 31 | 0.0% |
| Serbia | 37 | 0.0% |
| Singapore | 43 | 0.0% |
| South America | 561 | 0.5% |
| South Central Asia | 1,945 | 1.7% |
| South Eastern Asia | 680 | 0.6% |
| Southern Europe | 175 | 0.2% |
| Spain | 94 | 0.1% |
| Sudan | 52 | 0.1% |
| Sweden | 57 | 0.1% |
| Switzerland | 80 | 0.1% |
| Syria | 136 | 0.1% |
| Taiwan | 102 | 0.1% |
| Trinidad and Tobago | 106 | 0.1% |
| Turkey | 147 | 0.1% |
| Ukraine | 123 | 0.1% |
| Uzbekistan | 66 | 0.1% |
| Venezuela | 79 | 0.1% |
| Vietnam | 228 | 0.2% |
| Western Africa | 299 | 0.3% |
| Western Asia | 393 | 0.4% |
| Western Europe | 509 | 0.4% |
| Zaire | 146 | 0.1% |
| Zimbabwe | 50 | 0.0% | View All 97 Rows |
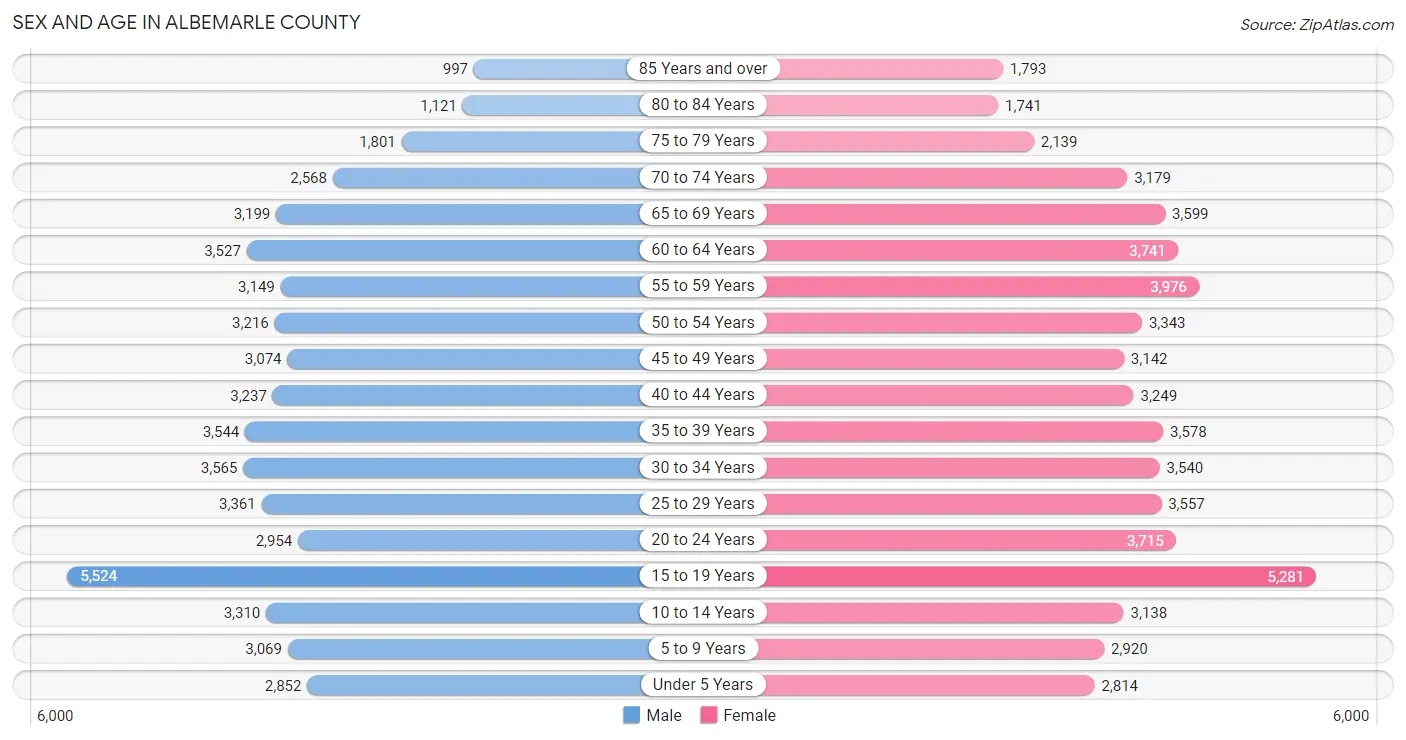
Sex and Age in Albemarle County
Sex and Age in Albemarle County
The most populous age groups in Albemarle County are 15 to 19 Years (5,524 | 10.2%) for men and 15 to 19 Years (5,281 | 9.0%) for women.
| Age Bracket | Male | Female |
| Under 5 Years | 2,852 (5.3%) | 2,814 (4.8%) |
| 5 to 9 Years | 3,069 (5.7%) | 2,920 (5.0%) |
| 10 to 14 Years | 3,310 (6.1%) | 3,138 (5.4%) |
| 15 to 19 Years | 5,524 (10.2%) | 5,281 (9.0%) |
| 20 to 24 Years | 2,954 (5.5%) | 3,715 (6.4%) |
| 25 to 29 Years | 3,361 (6.2%) | 3,557 (6.1%) |
| 30 to 34 Years | 3,565 (6.6%) | 3,540 (6.1%) |
| 35 to 39 Years | 3,544 (6.6%) | 3,578 (6.1%) |
| 40 to 44 Years | 3,237 (6.0%) | 3,249 (5.6%) |
| 45 to 49 Years | 3,074 (5.7%) | 3,142 (5.4%) |
| 50 to 54 Years | 3,216 (5.9%) | 3,343 (5.7%) |
| 55 to 59 Years | 3,149 (5.8%) | 3,976 (6.8%) |
| 60 to 64 Years | 3,527 (6.5%) | 3,741 (6.4%) |
| 65 to 69 Years | 3,199 (5.9%) | 3,599 (6.2%) |
| 70 to 74 Years | 2,568 (4.8%) | 3,179 (5.4%) |
| 75 to 79 Years | 1,801 (3.3%) | 2,139 (3.7%) |
| 80 to 84 Years | 1,121 (2.1%) | 1,741 (3.0%) |
| 85 Years and over | 997 (1.8%) | 1,793 (3.1%) |
| Total | 54,068 (100.0%) | 58,445 (100.0%) |
Families and Households in Albemarle County
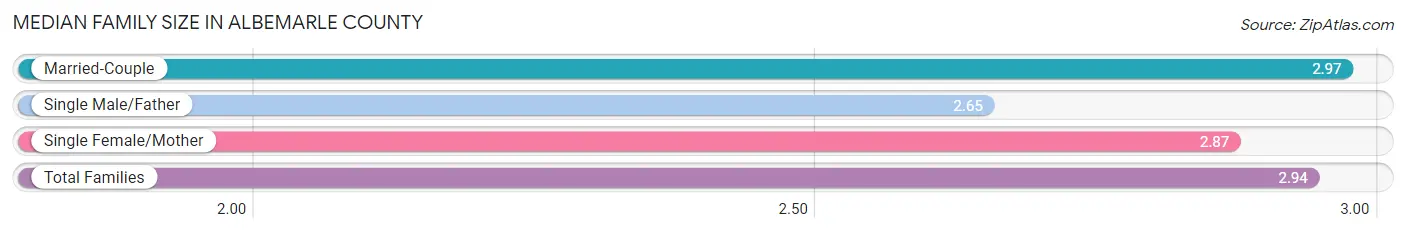
Median Family Size in Albemarle County
The median family size in Albemarle County is 2.94 persons per family, with married-couple families (21,895 | 80.1%) accounting for the largest median family size of 2.97 persons per family. On the other hand, single male/father families (1,532 | 5.6%) represent the smallest median family size with 2.65 persons per family.
| Family Type | # Families | Family Size |
| Married-Couple | 21,895 (80.1%) | 2.97 |
| Single Male/Father | 1,532 (5.6%) | 2.65 |
| Single Female/Mother | 3,904 (14.3%) | 2.87 |
| Total Families | 27,331 (100.0%) | 2.94 |
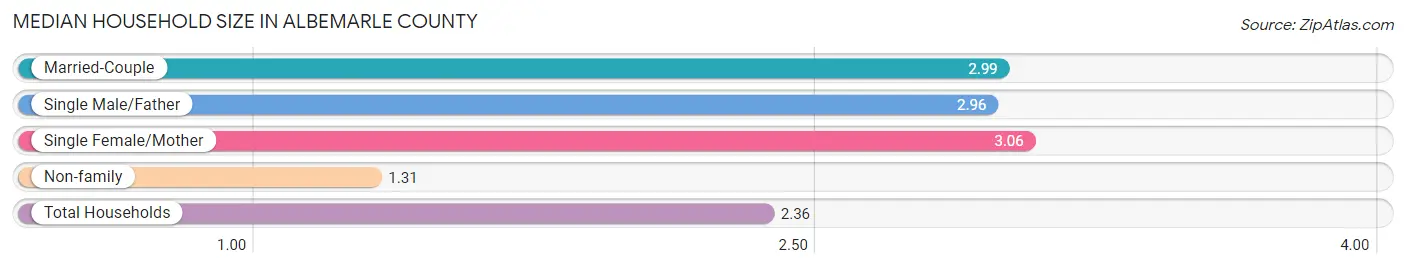
Median Household Size in Albemarle County
The median household size in Albemarle County is 2.36 persons per household, with single female/mother households (3,904 | 8.9%) accounting for the largest median household size of 3.06 persons per household. non-family households (16,700 | 37.9%) represent the smallest median household size with 1.31 persons per household.
| Household Type | # Households | Household Size |
| Married-Couple | 21,895 (49.7%) | 2.99 |
| Single Male/Father | 1,532 (3.5%) | 2.96 |
| Single Female/Mother | 3,904 (8.9%) | 3.06 |
| Non-family | 16,700 (37.9%) | 1.31 |
| Total Households | 44,031 (100.0%) | 2.36 |
Household Size by Marriage Status in Albemarle County
Out of a total of 44,031 households in Albemarle County, 27,331 (62.1%) are family households, while 16,700 (37.9%) are nonfamily households. The most numerous type of family households are 2-person households, comprising 13,259, and the most common type of nonfamily households are 1-person households, comprising 13,142.
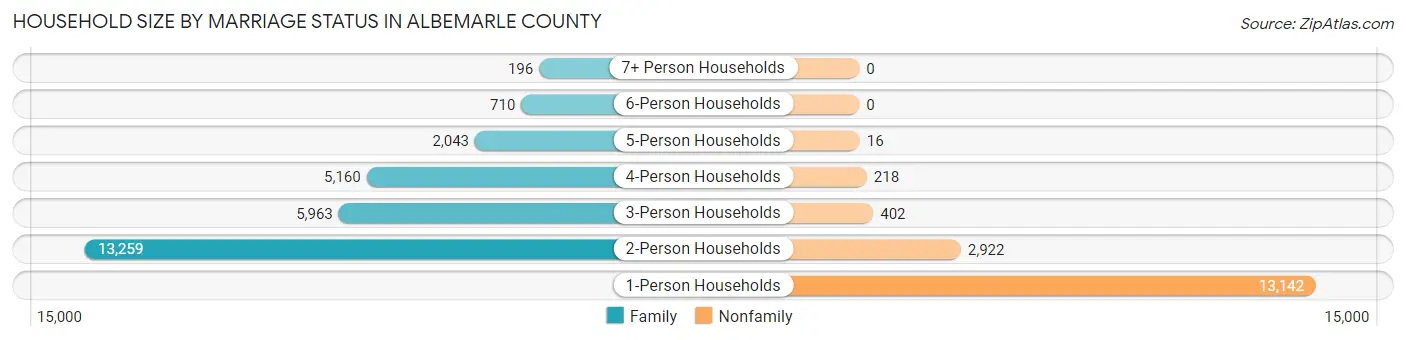
| Household Size | Family Households | Nonfamily Households |
| 1-Person Households | - | 13,142 (29.8%) |
| 2-Person Households | 13,259 (30.1%) | 2,922 (6.6%) |
| 3-Person Households | 5,963 (13.5%) | 402 (0.9%) |
| 4-Person Households | 5,160 (11.7%) | 218 (0.5%) |
| 5-Person Households | 2,043 (4.6%) | 16 (0.0%) |
| 6-Person Households | 710 (1.6%) | 0 (0.0%) |
| 7+ Person Households | 196 (0.4%) | 0 (0.0%) |
| Total | 27,331 (62.1%) | 16,700 (37.9%) |
Female Fertility in Albemarle County
Fertility by Age in Albemarle County
Average fertility rate in Albemarle County is 36.0 births per 1,000 women. Women in the age bracket of 20 to 34 years have the highest fertility rate with 52.0 births per 1,000 women. Women in the age bracket of 20 to 34 years acount for 59.1% of all women with births.
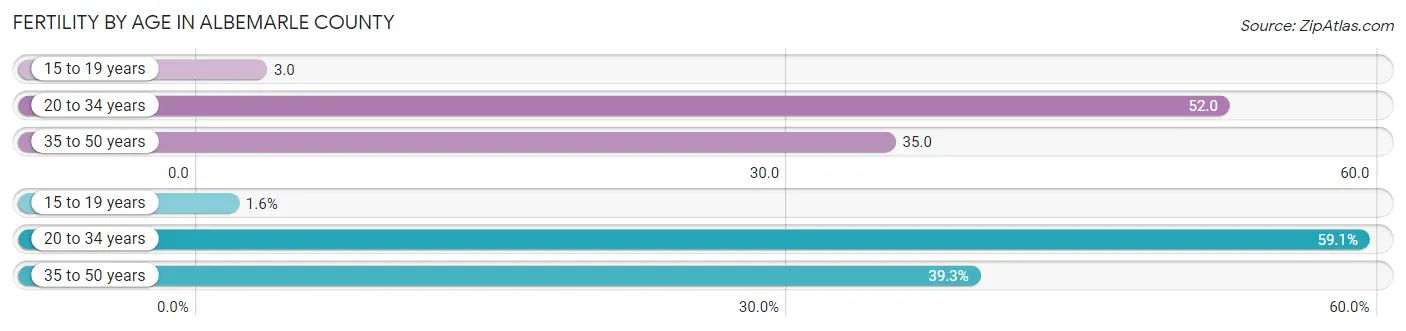
| Age Bracket | Women with Births | Births / 1,000 Women |
| 15 to 19 years | 15 (1.6%) | 3.0 |
| 20 to 34 years | 564 (59.1%) | 52.0 |
| 35 to 50 years | 375 (39.3%) | 35.0 |
| Total | 954 (100.0%) | 36.0 |
Fertility by Age by Marriage Status in Albemarle County
86.6% of women with births (954) in Albemarle County are married. The highest percentage of unmarried women with births falls into 15 to 19 years age bracket with 100.0% of them unmarried at the time of birth, while the lowest percentage of unmarried women with births belong to 35 to 50 years age bracket with 4.3% of them unmarried.
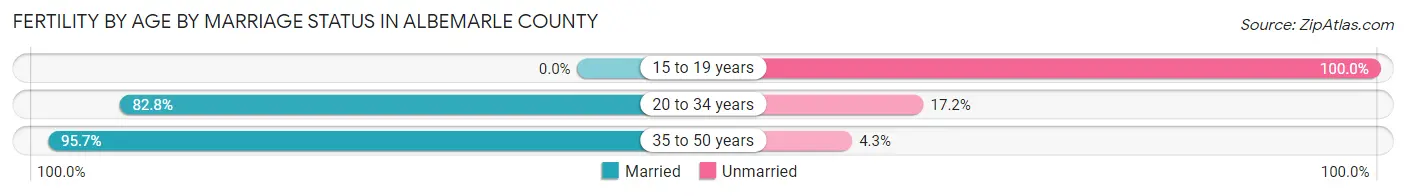
| Age Bracket | Married | Unmarried |
| 15 to 19 years | 0 (0.0%) | 15 (100.0%) |
| 20 to 34 years | 467 (82.8%) | 97 (17.2%) |
| 35 to 50 years | 359 (95.7%) | 16 (4.3%) |
| Total | 826 (86.6%) | 128 (13.4%) |
Fertility by Education in Albemarle County
Average fertility rate in Albemarle County is 36.0 births per 1,000 women. Women with the education attainment of bachelor's degree have the highest fertility rate of 59.0 births per 1,000 women, while women with the education attainment of high school diploma have the lowest fertility at 12.0 births per 1,000 women. Women with the education attainment of bachelor's degree represent 45.8% of all women with births.
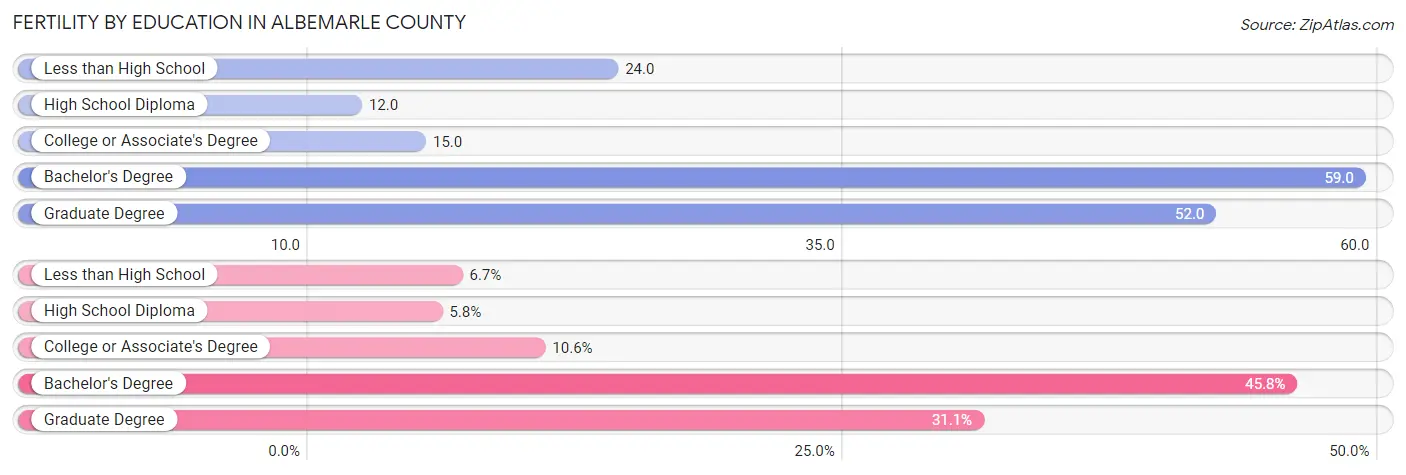
| Educational Attainment | Women with Births | Births / 1,000 Women |
| Less than High School | 64 (6.7%) | 24.0 |
| High School Diploma | 55 (5.8%) | 12.0 |
| College or Associate's Degree | 101 (10.6%) | 15.0 |
| Bachelor's Degree | 437 (45.8%) | 59.0 |
| Graduate Degree | 297 (31.1%) | 52.0 |
| Total | 954 (100.0%) | 36.0 |
Fertility by Education by Marriage Status in Albemarle County
13.4% of women with births in Albemarle County are unmarried. Women with the educational attainment of graduate degree are most likely to be married with 100.0% of them married at childbirth, while women with the educational attainment of less than high school are least likely to be married with 85.9% of them unmarried at childbirth.
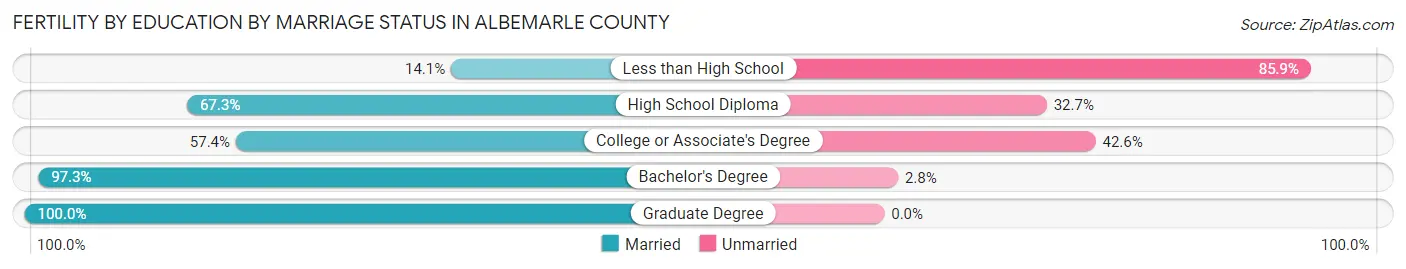
| Educational Attainment | Married | Unmarried |
| Less than High School | 9 (14.1%) | 55 (85.9%) |
| High School Diploma | 37 (67.3%) | 18 (32.7%) |
| College or Associate's Degree | 58 (57.4%) | 43 (42.6%) |
| Bachelor's Degree | 425 (97.3%) | 12 (2.8%) |
| Graduate Degree | 297 (100.0%) | 0 (0.0%) |
| Total | 826 (86.6%) | 128 (13.4%) |
Employment Characteristics in Albemarle County
Employment by Class of Employer in Albemarle County
Among the 53,838 employed individuals in Albemarle County, private company employees (27,527 | 51.1%), state government employees (7,283 | 13.5%), and not-for-profit organizations (6,489 | 12.0%) make up the most common classes of employment.
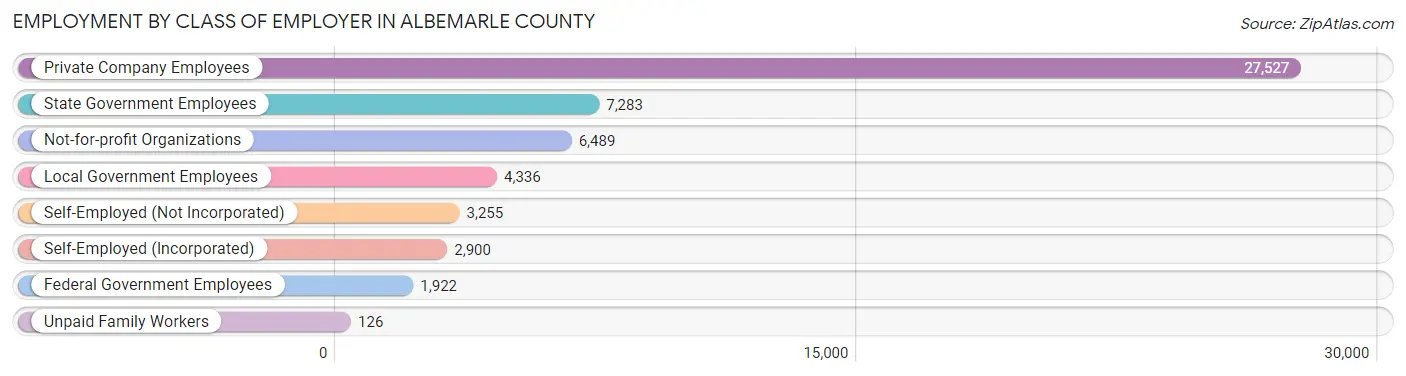
| Employer Class | # Employees | % Employees |
| Private Company Employees | 27,527 | 51.1% |
| Self-Employed (Incorporated) | 2,900 | 5.4% |
| Self-Employed (Not Incorporated) | 3,255 | 6.0% |
| Not-for-profit Organizations | 6,489 | 12.0% |
| Local Government Employees | 4,336 | 8.1% |
| State Government Employees | 7,283 | 13.5% |
| Federal Government Employees | 1,922 | 3.6% |
| Unpaid Family Workers | 126 | 0.2% |
| Total | 53,838 | 100.0% |
Employment Status by Age in Albemarle County
According to the labor force statistics for Albemarle County, out of the total population over 16 years of age (93,153), 60.8% or 56,637 individuals are in the labor force, with 3.1% or 1,756 of them unemployed. The age group with the highest labor force participation rate is 30 to 34 years, with 87.6% or 6,224 individuals in the labor force. Within the labor force, the 16 to 19 years age range has the highest percentage of unemployed individuals, with 7.5% or 207 of them being unemployed.
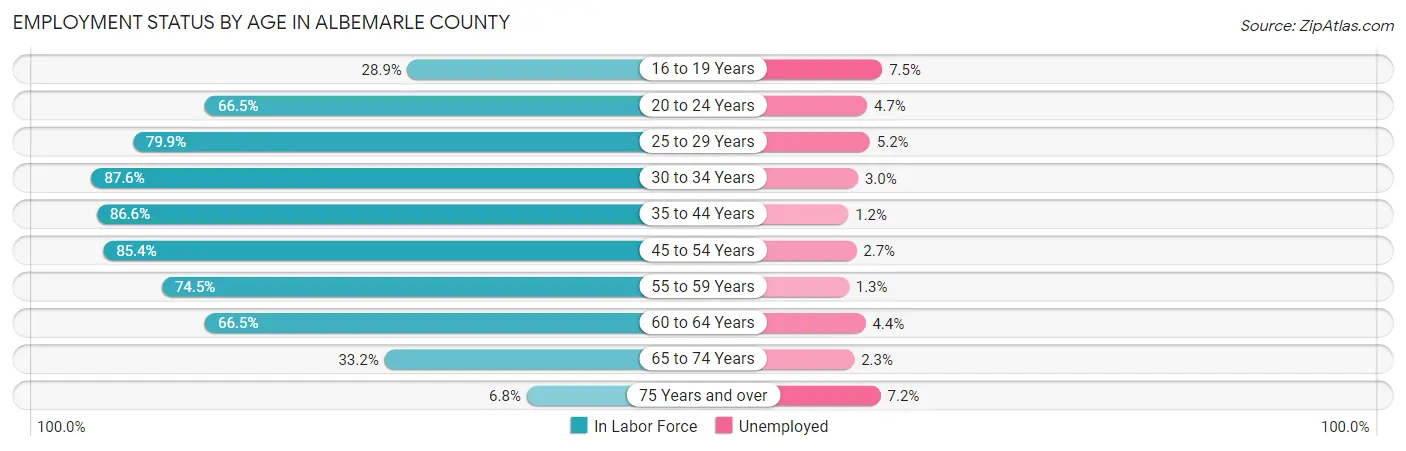
| Age Bracket | In Labor Force | Unemployed |
| 16 to 19 Years | 2,759 (28.9%) | 207 (7.5%) |
| 20 to 24 Years | 4,435 (66.5%) | 208 (4.7%) |
| 25 to 29 Years | 5,527 (79.9%) | 287 (5.2%) |
| 30 to 34 Years | 6,224 (87.6%) | 187 (3.0%) |
| 35 to 44 Years | 11,785 (86.6%) | 141 (1.2%) |
| 45 to 54 Years | 10,910 (85.4%) | 295 (2.7%) |
| 55 to 59 Years | 5,308 (74.5%) | 69 (1.3%) |
| 60 to 64 Years | 4,833 (66.5%) | 213 (4.4%) |
| 65 to 74 Years | 4,165 (33.2%) | 96 (2.3%) |
| 75 Years and over | 652 (6.8%) | 47 (7.2%) |
| Total | 56,637 (60.8%) | 1,756 (3.1%) |
Employment Status by Educational Attainment in Albemarle County
According to labor force statistics for Albemarle County, 81.4% of individuals (44,606) out of the total population between 25 and 64 years of age (54,799) are in the labor force, with 2.7% or 1,204 of them being unemployed. The group with the highest labor force participation rate are those with the educational attainment of bachelor's degree or higher, with 85.6% or 29,063 individuals in the labor force. Within the labor force, individuals with high school diploma education have the highest percentage of unemployment, with 6.3% or 381 of them being unemployed.
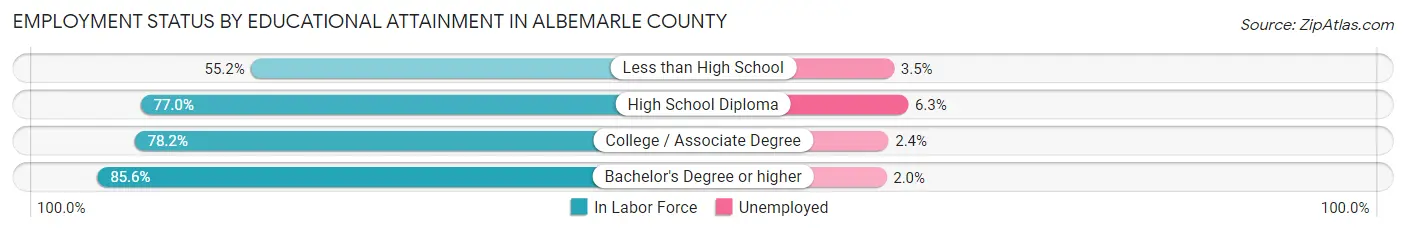
| Educational Attainment | In Labor Force | Unemployed |
| Less than High School | 1,623 (55.2%) | 103 (3.5%) |
| High School Diploma | 6,041 (77.0%) | 494 (6.3%) |
| College / Associate Degree | 7,868 (78.2%) | 241 (2.4%) |
| Bachelor's Degree or higher | 29,063 (85.6%) | 679 (2.0%) |
| Total | 44,606 (81.4%) | 1,480 (2.7%) |
Employment Occupations by Sex in Albemarle County
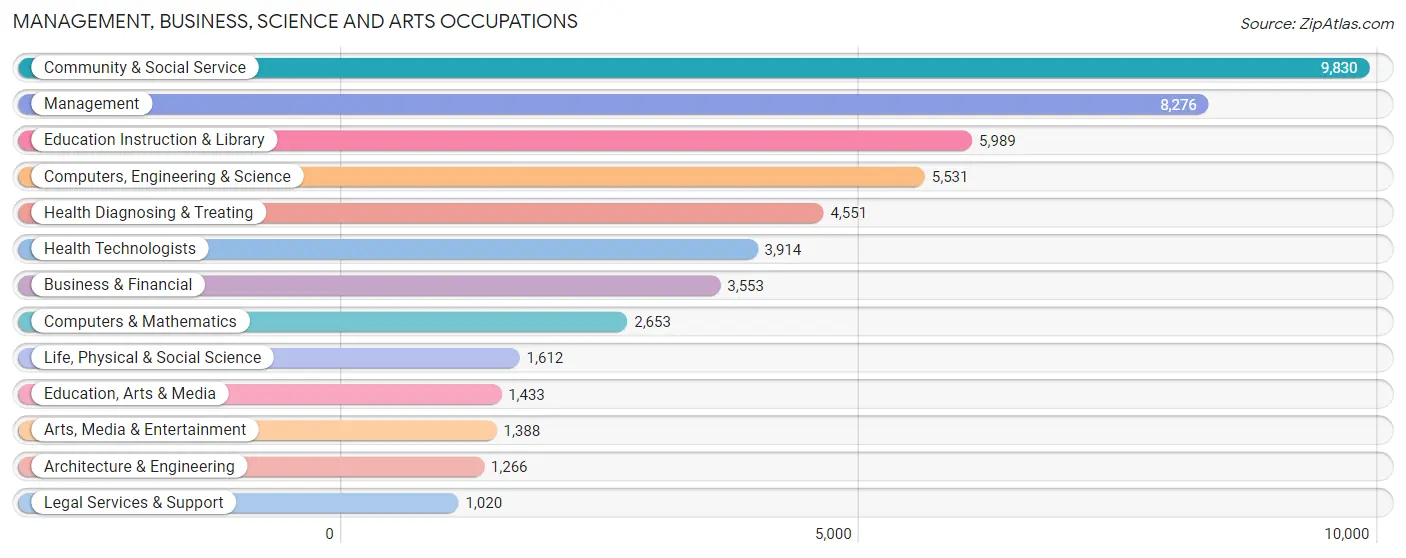
Management, Business, Science and Arts Occupations
The most common Management, Business, Science and Arts occupations in Albemarle County are Community & Social Service (9,830 | 18.0%), Management (8,276 | 15.2%), Education Instruction & Library (5,989 | 11.0%), Computers, Engineering & Science (5,531 | 10.1%), and Health Diagnosing & Treating (4,551 | 8.3%).
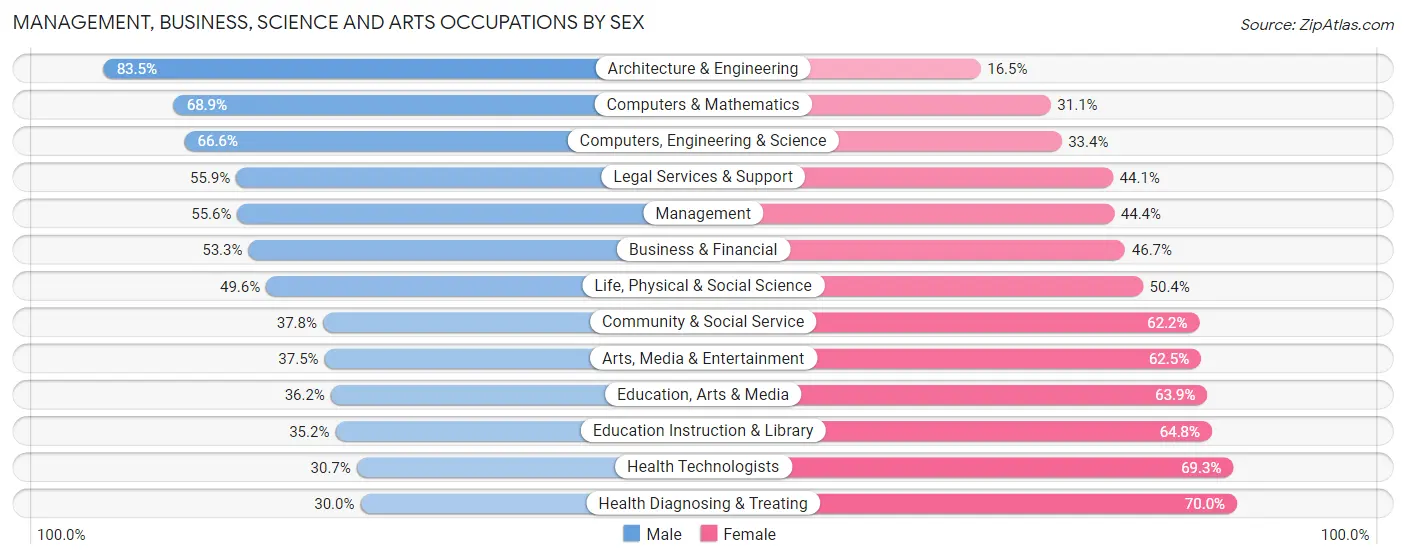
Management, Business, Science and Arts Occupations by Sex
Within the Management, Business, Science and Arts occupations in Albemarle County, the most male-oriented occupations are Architecture & Engineering (83.5%), Computers & Mathematics (68.9%), and Computers, Engineering & Science (66.6%), while the most female-oriented occupations are Health Diagnosing & Treating (70.0%), Health Technologists (69.3%), and Education Instruction & Library (64.8%).
| Occupation | Male | Female |
| Management | 4,604 (55.6%) | 3,672 (44.4%) |
| Business & Financial | 1,895 (53.3%) | 1,658 (46.7%) |
| Computers, Engineering & Science | 3,684 (66.6%) | 1,847 (33.4%) |
| Computers & Mathematics | 1,827 (68.9%) | 826 (31.1%) |
| Architecture & Engineering | 1,057 (83.5%) | 209 (16.5%) |
| Life, Physical & Social Science | 800 (49.6%) | 812 (50.4%) |
| Community & Social Service | 3,716 (37.8%) | 6,114 (62.2%) |
| Education, Arts & Media | 518 (36.1%) | 915 (63.8%) |
| Legal Services & Support | 570 (55.9%) | 450 (44.1%) |
| Education Instruction & Library | 2,108 (35.2%) | 3,881 (64.8%) |
| Arts, Media & Entertainment | 520 (37.5%) | 868 (62.5%) |
| Health Diagnosing & Treating | 1,364 (30.0%) | 3,187 (70.0%) |
| Health Technologists | 1,203 (30.7%) | 2,711 (69.3%) |
| Total (Category) | 15,263 (48.1%) | 16,478 (51.9%) |
| Total (Overall) | 27,358 (50.1%) | 27,216 (49.9%) |
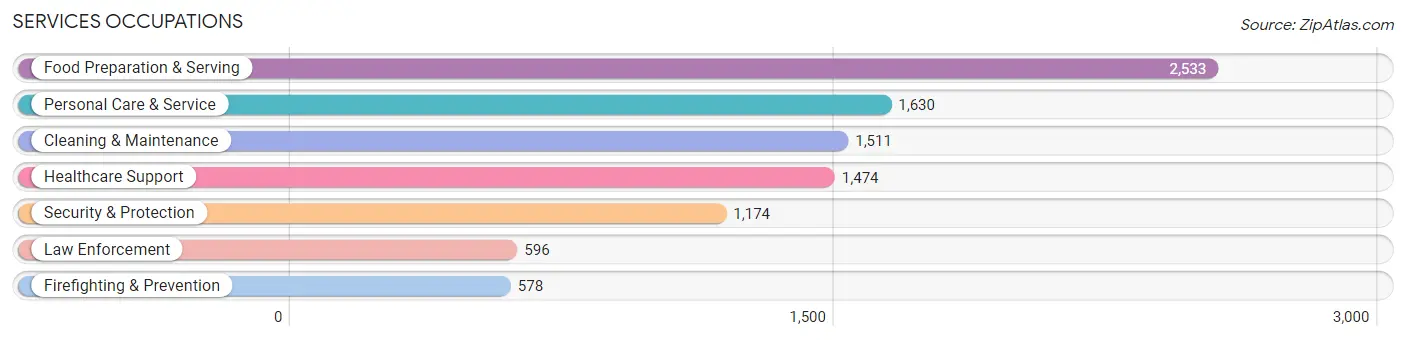
Services Occupations
The most common Services occupations in Albemarle County are Food Preparation & Serving (2,533 | 4.6%), Personal Care & Service (1,630 | 3.0%), Cleaning & Maintenance (1,511 | 2.8%), Healthcare Support (1,474 | 2.7%), and Security & Protection (1,174 | 2.1%).
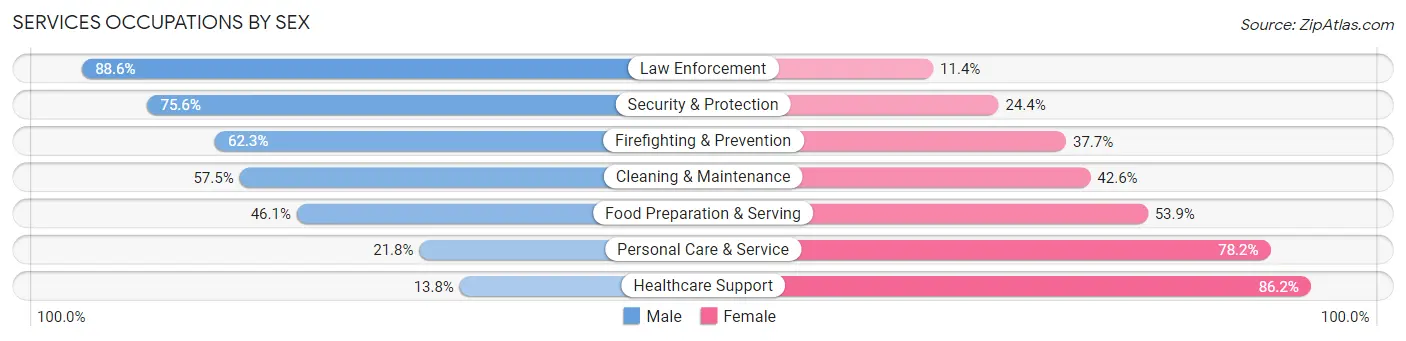
Services Occupations by Sex
Within the Services occupations in Albemarle County, the most male-oriented occupations are Law Enforcement (88.6%), Security & Protection (75.6%), and Firefighting & Prevention (62.3%), while the most female-oriented occupations are Healthcare Support (86.2%), Personal Care & Service (78.2%), and Food Preparation & Serving (53.9%).
| Occupation | Male | Female |
| Healthcare Support | 204 (13.8%) | 1,270 (86.2%) |
| Security & Protection | 888 (75.6%) | 286 (24.4%) |
| Firefighting & Prevention | 360 (62.3%) | 218 (37.7%) |
| Law Enforcement | 528 (88.6%) | 68 (11.4%) |
| Food Preparation & Serving | 1,168 (46.1%) | 1,365 (53.9%) |
| Cleaning & Maintenance | 868 (57.5%) | 643 (42.5%) |
| Personal Care & Service | 356 (21.8%) | 1,274 (78.2%) |
| Total (Category) | 3,484 (41.9%) | 4,838 (58.1%) |
| Total (Overall) | 27,358 (50.1%) | 27,216 (49.9%) |
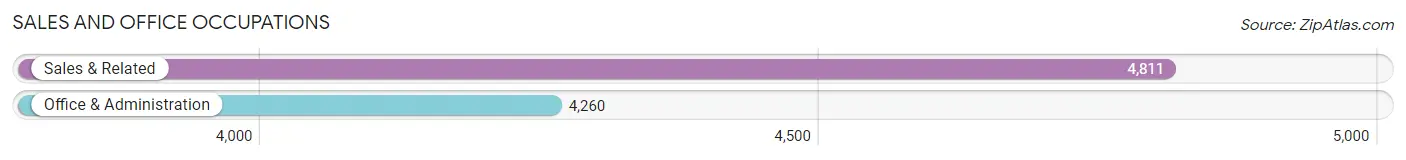
Sales and Office Occupations
The most common Sales and Office occupations in Albemarle County are Sales & Related (4,811 | 8.8%), and Office & Administration (4,260 | 7.8%).
Sales and Office Occupations by Sex
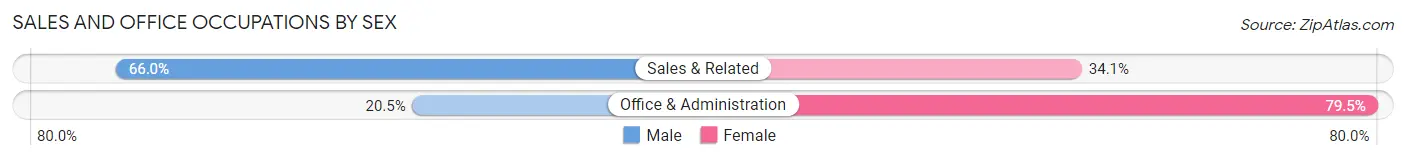
| Occupation | Male | Female |
| Sales & Related | 3,173 (65.9%) | 1,638 (34.1%) |
| Office & Administration | 872 (20.5%) | 3,388 (79.5%) |
| Total (Category) | 4,045 (44.6%) | 5,026 (55.4%) |
| Total (Overall) | 27,358 (50.1%) | 27,216 (49.9%) |
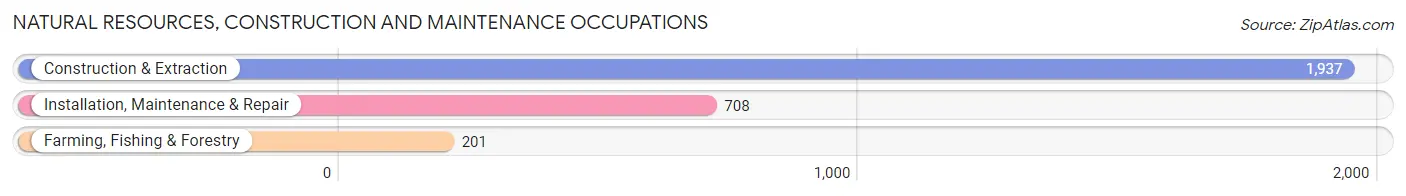
Natural Resources, Construction and Maintenance Occupations
The most common Natural Resources, Construction and Maintenance occupations in Albemarle County are Construction & Extraction (1,937 | 3.5%), Installation, Maintenance & Repair (708 | 1.3%), and Farming, Fishing & Forestry (201 | 0.4%).
Natural Resources, Construction and Maintenance Occupations by Sex
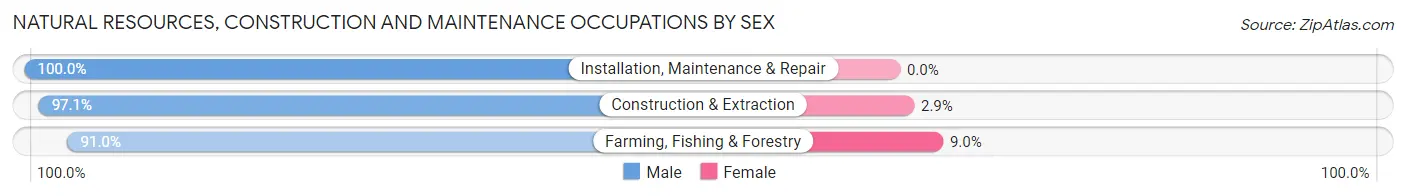
| Occupation | Male | Female |
| Farming, Fishing & Forestry | 183 (91.0%) | 18 (9.0%) |
| Construction & Extraction | 1,880 (97.1%) | 57 (2.9%) |
| Installation, Maintenance & Repair | 708 (100.0%) | 0 (0.0%) |
| Total (Category) | 2,771 (97.4%) | 75 (2.6%) |
| Total (Overall) | 27,358 (50.1%) | 27,216 (49.9%) |
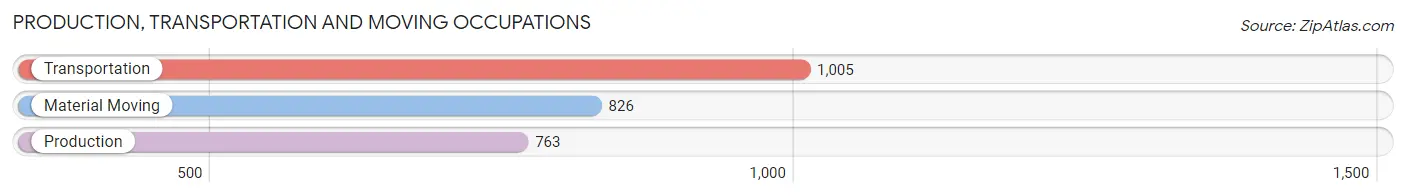
Production, Transportation and Moving Occupations
The most common Production, Transportation and Moving occupations in Albemarle County are Transportation (1,005 | 1.8%), Material Moving (826 | 1.5%), and Production (763 | 1.4%).
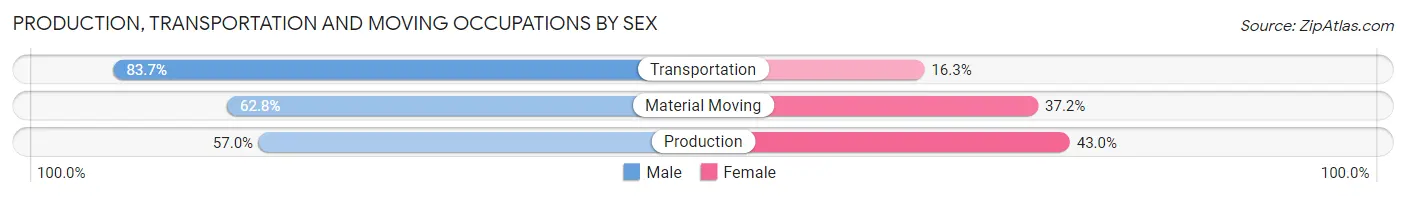
Production, Transportation and Moving Occupations by Sex
| Occupation | Male | Female |
| Production | 435 (57.0%) | 328 (43.0%) |
| Transportation | 841 (83.7%) | 164 (16.3%) |
| Material Moving | 519 (62.8%) | 307 (37.2%) |
| Total (Category) | 1,795 (69.2%) | 799 (30.8%) |
| Total (Overall) | 27,358 (50.1%) | 27,216 (49.9%) |
Employment Industries by Sex in Albemarle County
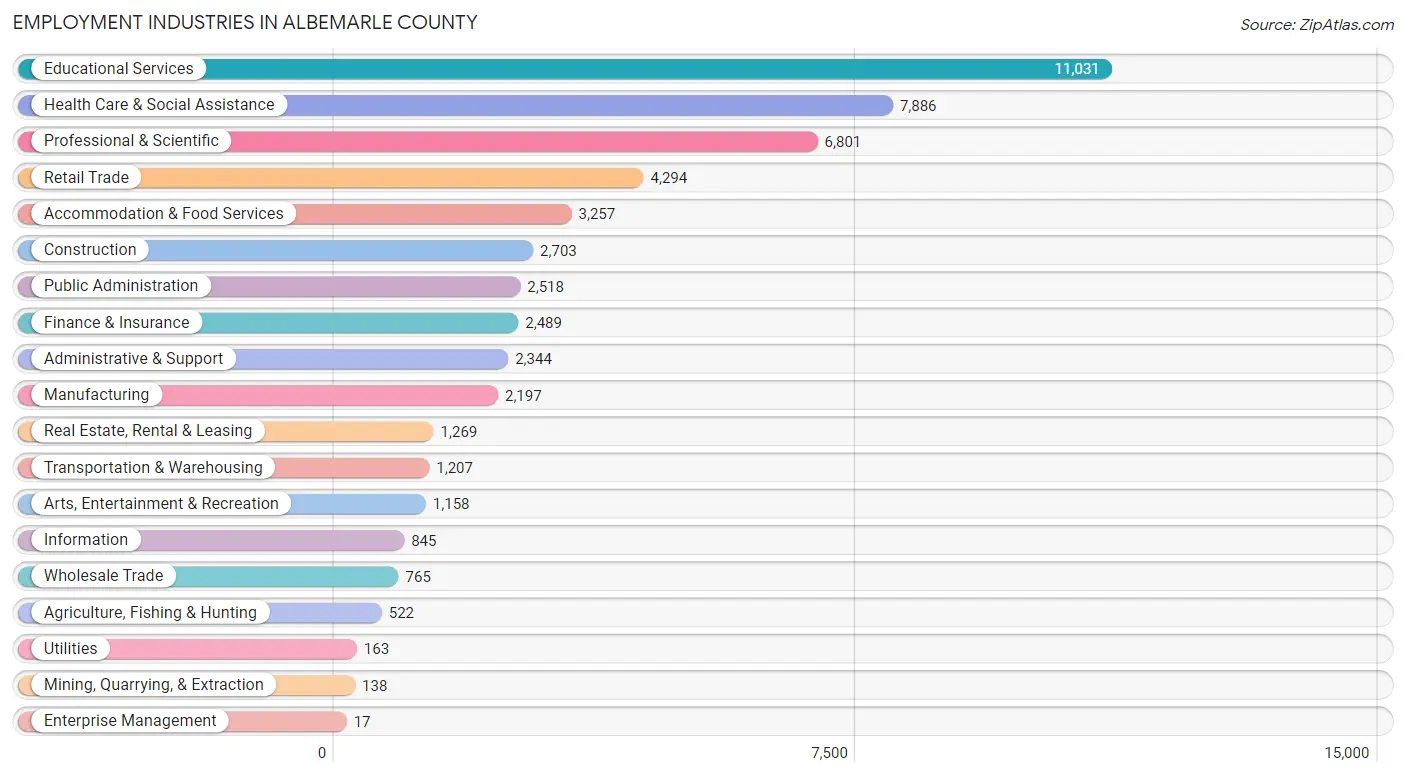
Employment Industries in Albemarle County
The major employment industries in Albemarle County include Educational Services (11,031 | 20.2%), Health Care & Social Assistance (7,886 | 14.4%), Professional & Scientific (6,801 | 12.5%), Retail Trade (4,294 | 7.9%), and Accommodation & Food Services (3,257 | 6.0%).
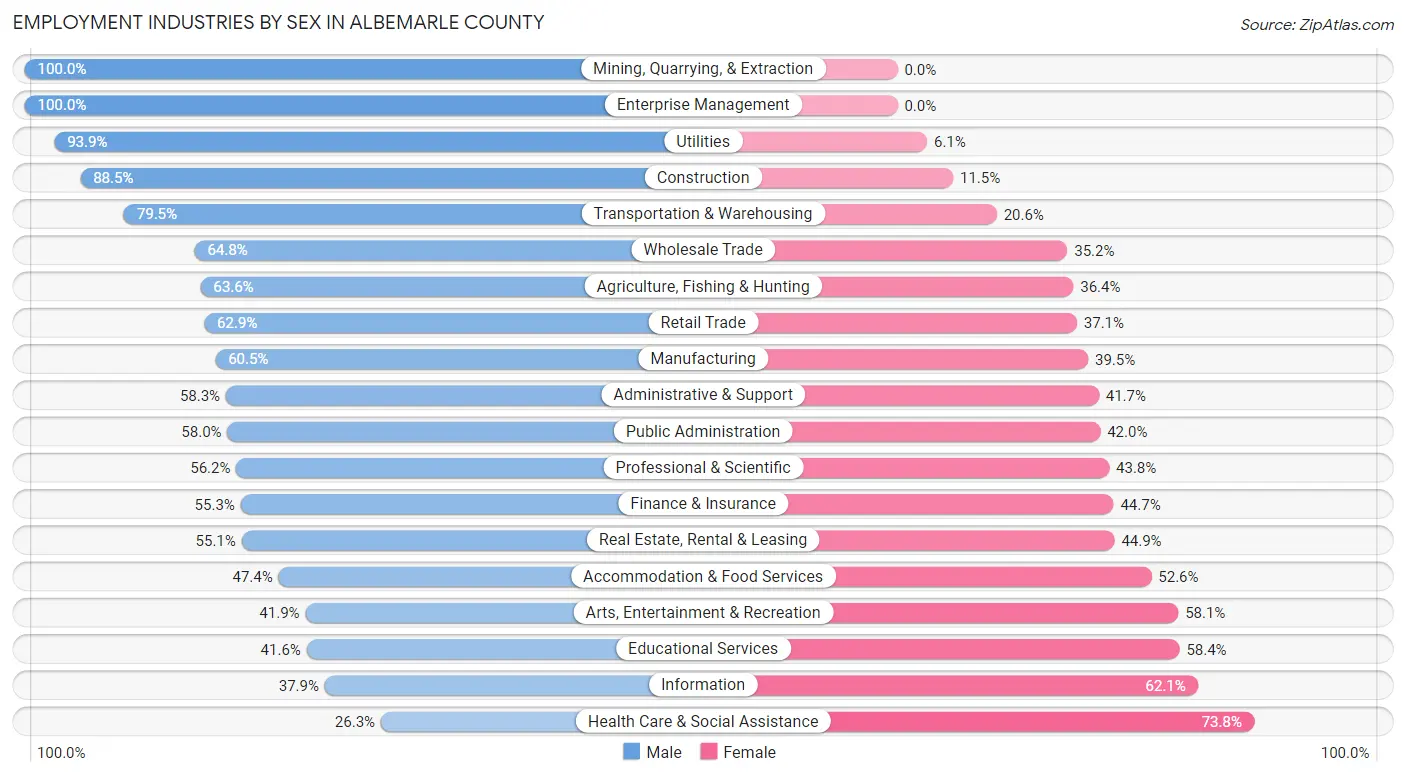
Employment Industries by Sex in Albemarle County
The Albemarle County industries that see more men than women are Mining, Quarrying, & Extraction (100.0%), Enterprise Management (100.0%), and Utilities (93.9%), whereas the industries that tend to have a higher number of women are Health Care & Social Assistance (73.8%), Information (62.1%), and Educational Services (58.4%).
| Industry | Male | Female |
| Agriculture, Fishing & Hunting | 332 (63.6%) | 190 (36.4%) |
| Mining, Quarrying, & Extraction | 138 (100.0%) | 0 (0.0%) |
| Construction | 2,392 (88.5%) | 311 (11.5%) |
| Manufacturing | 1,330 (60.5%) | 867 (39.5%) |
| Wholesale Trade | 496 (64.8%) | 269 (35.2%) |
| Retail Trade | 2,699 (62.9%) | 1,595 (37.1%) |
| Transportation & Warehousing | 959 (79.4%) | 248 (20.5%) |
| Utilities | 153 (93.9%) | 10 (6.1%) |
| Information | 320 (37.9%) | 525 (62.1%) |
| Finance & Insurance | 1,376 (55.3%) | 1,113 (44.7%) |
| Real Estate, Rental & Leasing | 699 (55.1%) | 570 (44.9%) |
| Professional & Scientific | 3,821 (56.2%) | 2,980 (43.8%) |
| Enterprise Management | 17 (100.0%) | 0 (0.0%) |
| Administrative & Support | 1,367 (58.3%) | 977 (41.7%) |
| Educational Services | 4,591 (41.6%) | 6,440 (58.4%) |
| Health Care & Social Assistance | 2,070 (26.3%) | 5,816 (73.8%) |
| Arts, Entertainment & Recreation | 485 (41.9%) | 673 (58.1%) |
| Accommodation & Food Services | 1,545 (47.4%) | 1,712 (52.6%) |
| Public Administration | 1,461 (58.0%) | 1,057 (42.0%) |
| Total | 27,358 (50.1%) | 27,216 (49.9%) |
Education in Albemarle County
School Enrollment in Albemarle County
The most common levels of schooling among the 31,532 students in Albemarle County are college / undergraduate (9,820 | 31.1%), high school (5,298 | 16.8%), and middle school (5,028 | 16.0%).
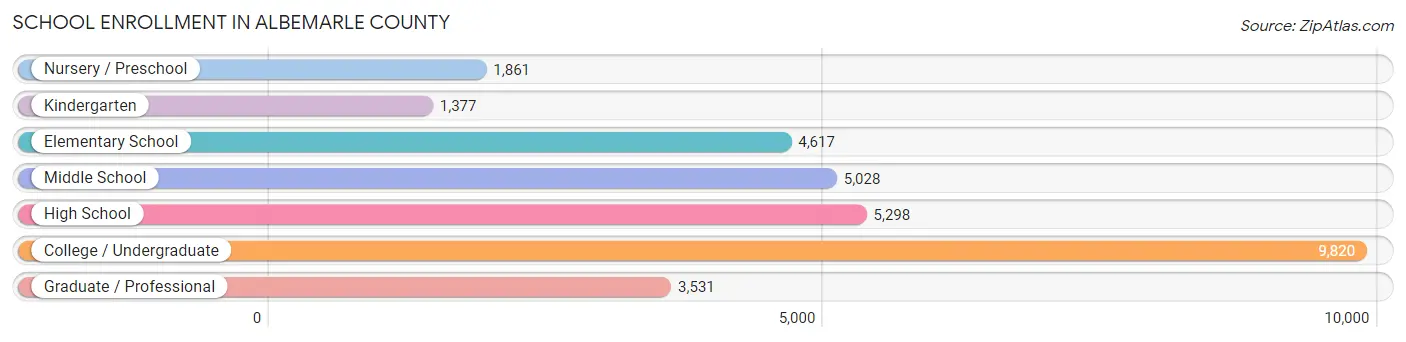
| School Level | # Students | % Students |
| Nursery / Preschool | 1,861 | 5.9% |
| Kindergarten | 1,377 | 4.4% |
| Elementary School | 4,617 | 14.6% |
| Middle School | 5,028 | 16.0% |
| High School | 5,298 | 16.8% |
| College / Undergraduate | 9,820 | 31.1% |
| Graduate / Professional | 3,531 | 11.2% |
| Total | 31,532 | 100.0% |
School Enrollment by Age by Funding Source in Albemarle County
Out of a total of 31,532 students who are enrolled in schools in Albemarle County, 4,951 (15.7%) attend a private institution, while the remaining 26,581 (84.3%) are enrolled in public schools. The age group of 3 to 4 year olds has the highest likelihood of being enrolled in private schools, with 743 (50.5% in the age bracket) enrolled. Conversely, the age group of 18 to 19 year olds has the lowest likelihood of being enrolled in a private school, with 6,254 (97.5% in the age bracket) attending a public institution.
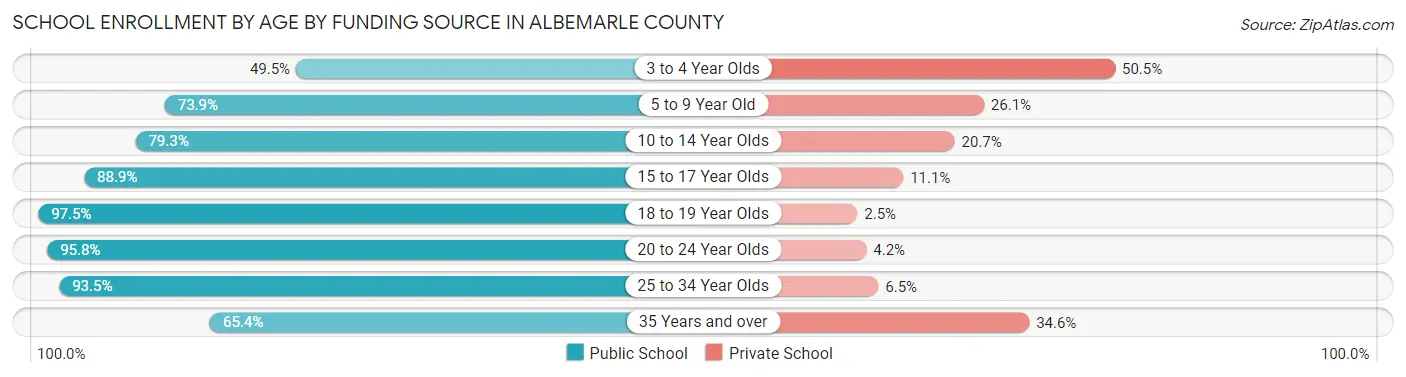
| Age Bracket | Public School | Private School |
| 3 to 4 Year Olds | 727 (49.5%) | 743 (50.5%) |
| 5 to 9 Year Old | 4,330 (73.9%) | 1,531 (26.1%) |
| 10 to 14 Year Olds | 5,019 (79.3%) | 1,307 (20.7%) |
| 15 to 17 Year Olds | 3,398 (88.9%) | 424 (11.1%) |
| 18 to 19 Year Olds | 6,254 (97.5%) | 163 (2.5%) |
| 20 to 24 Year Olds | 3,585 (95.8%) | 158 (4.2%) |
| 25 to 34 Year Olds | 2,418 (93.5%) | 167 (6.5%) |
| 35 Years and over | 856 (65.4%) | 452 (34.6%) |
| Total | 26,581 (84.3%) | 4,951 (15.7%) |
Educational Attainment by Field of Study in Albemarle County
Business (6,219 | 12.4%), social sciences (5,799 | 11.6%), science & technology (5,412 | 10.8%), education (4,232 | 8.4%), and bio, nature & agricultural (4,194 | 8.4%) are the most common fields of study among 50,179 individuals in Albemarle County who have obtained a bachelor's degree or higher.
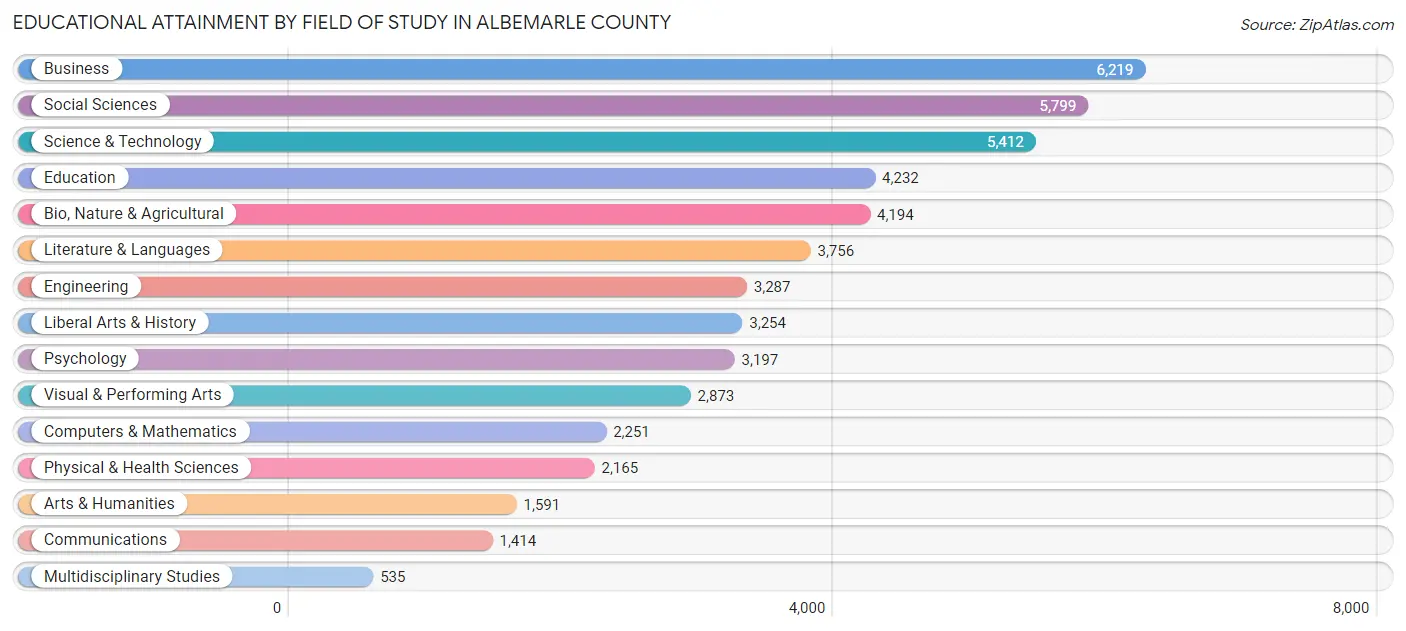
| Field of Study | # Graduates | % Graduates |
| Computers & Mathematics | 2,251 | 4.5% |
| Bio, Nature & Agricultural | 4,194 | 8.4% |
| Physical & Health Sciences | 2,165 | 4.3% |
| Psychology | 3,197 | 6.4% |
| Social Sciences | 5,799 | 11.6% |
| Engineering | 3,287 | 6.6% |
| Multidisciplinary Studies | 535 | 1.1% |
| Science & Technology | 5,412 | 10.8% |
| Business | 6,219 | 12.4% |
| Education | 4,232 | 8.4% |
| Literature & Languages | 3,756 | 7.5% |
| Liberal Arts & History | 3,254 | 6.5% |
| Visual & Performing Arts | 2,873 | 5.7% |
| Communications | 1,414 | 2.8% |
| Arts & Humanities | 1,591 | 3.2% |
| Total | 50,179 | 100.0% |
Transportation & Commute in Albemarle County
Vehicle Availability by Sex in Albemarle County
The most prevalent vehicle ownership categories in Albemarle County are males with 2 vehicles (12,932, accounting for 49.0%) and females with 2 vehicles (11,193, making up 50.1%).
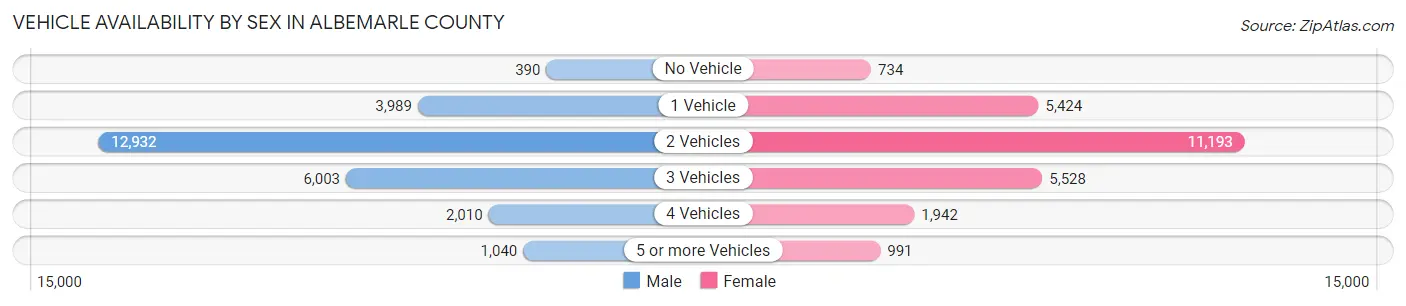
| Vehicles Available | Male | Female |
| No Vehicle | 390 (1.5%) | 734 (2.8%) |
| 1 Vehicle | 3,989 (15.1%) | 5,424 (21.0%) |
| 2 Vehicles | 12,932 (49.0%) | 11,193 (43.4%) |
| 3 Vehicles | 6,003 (22.8%) | 5,528 (21.4%) |
| 4 Vehicles | 2,010 (7.6%) | 1,942 (7.5%) |
| 5 or more Vehicles | 1,040 (3.9%) | 991 (3.8%) |
| Total | 26,364 (100.0%) | 25,812 (100.0%) |
Commute Time in Albemarle County
The most frequently occuring commute durations in Albemarle County are 15 to 19 minutes (9,439 commuters, 21.4%), 20 to 24 minutes (7,740 commuters, 17.5%), and 10 to 14 minutes (7,301 commuters, 16.6%).
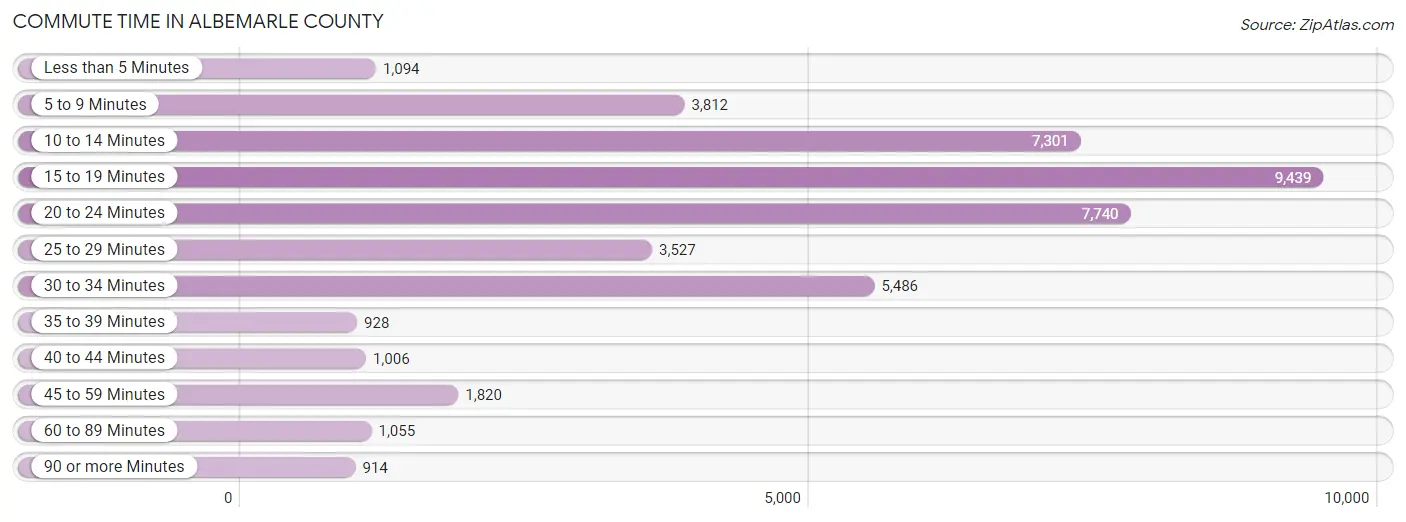
| Commute Time | # Commuters | % Commuters |
| Less than 5 Minutes | 1,094 | 2.5% |
| 5 to 9 Minutes | 3,812 | 8.6% |
| 10 to 14 Minutes | 7,301 | 16.6% |
| 15 to 19 Minutes | 9,439 | 21.4% |
| 20 to 24 Minutes | 7,740 | 17.5% |
| 25 to 29 Minutes | 3,527 | 8.0% |
| 30 to 34 Minutes | 5,486 | 12.4% |
| 35 to 39 Minutes | 928 | 2.1% |
| 40 to 44 Minutes | 1,006 | 2.3% |
| 45 to 59 Minutes | 1,820 | 4.1% |
| 60 to 89 Minutes | 1,055 | 2.4% |
| 90 or more Minutes | 914 | 2.1% |
Commute Time by Sex in Albemarle County
The most common commute times in Albemarle County are 15 to 19 minutes (4,758 commuters, 21.3%) for males and 15 to 19 minutes (4,681 commuters, 21.5%) for females.
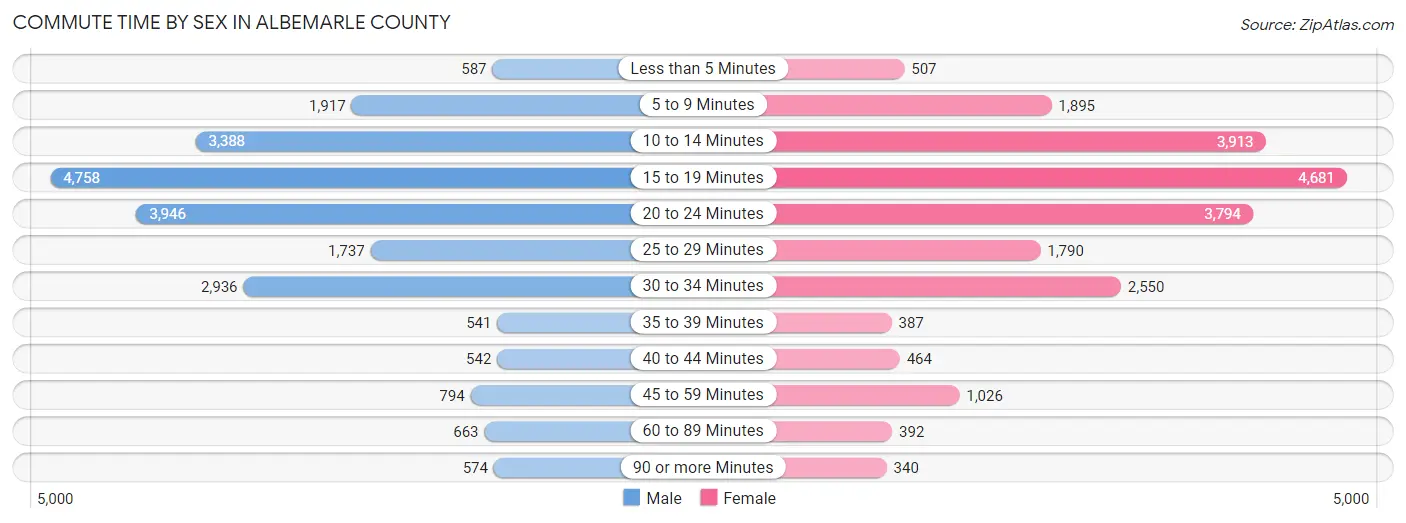
| Commute Time | Male | Female |
| Less than 5 Minutes | 587 (2.6%) | 507 (2.3%) |
| 5 to 9 Minutes | 1,917 (8.6%) | 1,895 (8.7%) |
| 10 to 14 Minutes | 3,388 (15.1%) | 3,913 (18.0%) |
| 15 to 19 Minutes | 4,758 (21.3%) | 4,681 (21.5%) |
| 20 to 24 Minutes | 3,946 (17.6%) | 3,794 (17.4%) |
| 25 to 29 Minutes | 1,737 (7.8%) | 1,790 (8.2%) |
| 30 to 34 Minutes | 2,936 (13.1%) | 2,550 (11.7%) |
| 35 to 39 Minutes | 541 (2.4%) | 387 (1.8%) |
| 40 to 44 Minutes | 542 (2.4%) | 464 (2.1%) |
| 45 to 59 Minutes | 794 (3.5%) | 1,026 (4.7%) |
| 60 to 89 Minutes | 663 (3.0%) | 392 (1.8%) |
| 90 or more Minutes | 574 (2.6%) | 340 (1.6%) |
Time of Departure to Work by Sex in Albemarle County
The most frequent times of departure to work in Albemarle County are 8:00 AM to 8:29 AM (3,596, 16.1%) for males and 8:00 AM to 8:29 AM (3,749, 17.2%) for females.
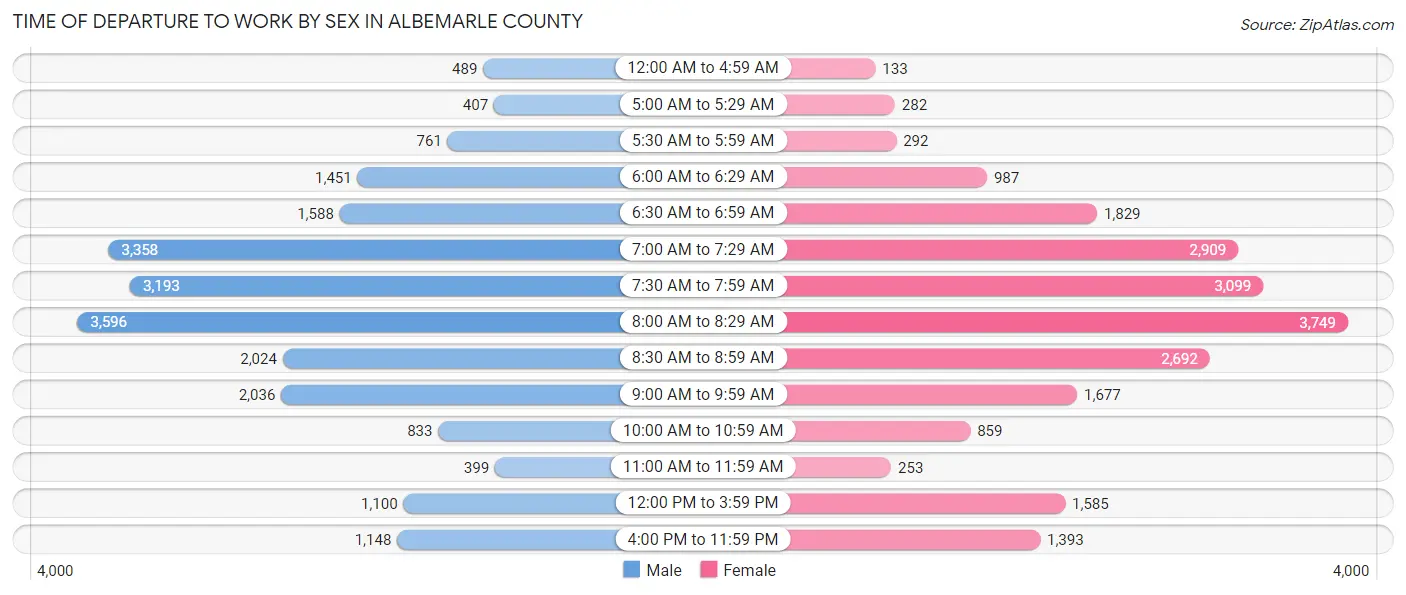
| Time of Departure | Male | Female |
| 12:00 AM to 4:59 AM | 489 (2.2%) | 133 (0.6%) |
| 5:00 AM to 5:29 AM | 407 (1.8%) | 282 (1.3%) |
| 5:30 AM to 5:59 AM | 761 (3.4%) | 292 (1.3%) |
| 6:00 AM to 6:29 AM | 1,451 (6.5%) | 987 (4.5%) |
| 6:30 AM to 6:59 AM | 1,588 (7.1%) | 1,829 (8.4%) |
| 7:00 AM to 7:29 AM | 3,358 (15.0%) | 2,909 (13.4%) |
| 7:30 AM to 7:59 AM | 3,193 (14.3%) | 3,099 (14.3%) |
| 8:00 AM to 8:29 AM | 3,596 (16.1%) | 3,749 (17.2%) |
| 8:30 AM to 8:59 AM | 2,024 (9.0%) | 2,692 (12.4%) |
| 9:00 AM to 9:59 AM | 2,036 (9.1%) | 1,677 (7.7%) |
| 10:00 AM to 10:59 AM | 833 (3.7%) | 859 (4.0%) |
| 11:00 AM to 11:59 AM | 399 (1.8%) | 253 (1.2%) |
| 12:00 PM to 3:59 PM | 1,100 (4.9%) | 1,585 (7.3%) |
| 4:00 PM to 11:59 PM | 1,148 (5.1%) | 1,393 (6.4%) |
| Total | 22,383 (100.0%) | 21,739 (100.0%) |
Housing Occupancy in Albemarle County
Occupancy by Ownership in Albemarle County
Of the total 44,031 dwellings in Albemarle County, owner-occupied units account for 29,604 (67.2%), while renter-occupied units make up 14,427 (32.8%).
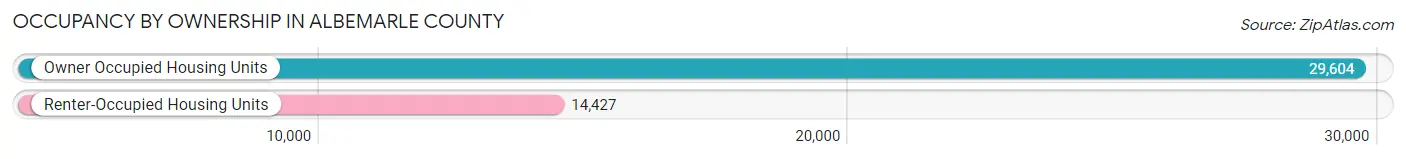
| Occupancy | # Housing Units | % Housing Units |
| Owner Occupied Housing Units | 29,604 | 67.2% |
| Renter-Occupied Housing Units | 14,427 | 32.8% |
| Total Occupied Housing Units | 44,031 | 100.0% |
Occupancy by Household Size in Albemarle County
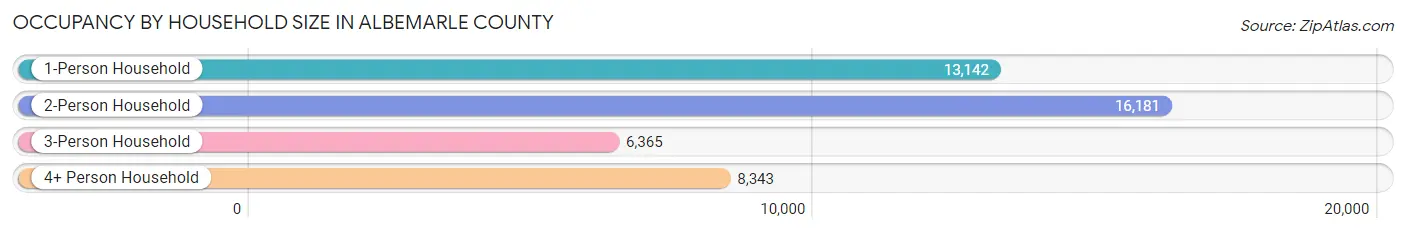
| Household Size | # Housing Units | % Housing Units |
| 1-Person Household | 13,142 | 29.8% |
| 2-Person Household | 16,181 | 36.7% |
| 3-Person Household | 6,365 | 14.5% |
| 4+ Person Household | 8,343 | 19.0% |
| Total Housing Units | 44,031 | 100.0% |
Occupancy by Ownership by Household Size in Albemarle County
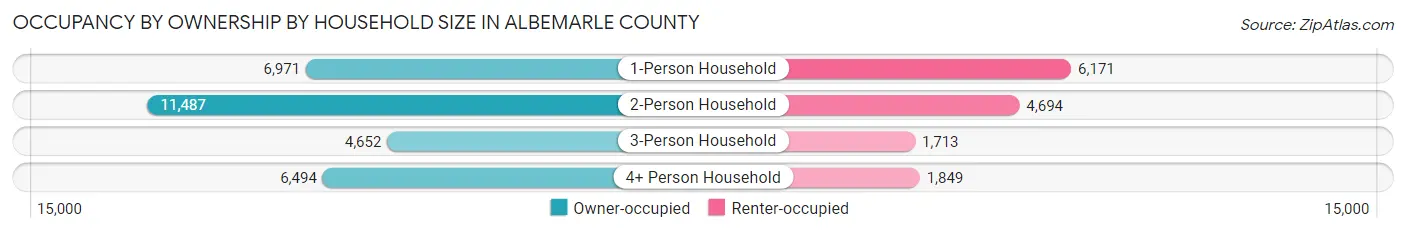
| Household Size | Owner-occupied | Renter-occupied |
| 1-Person Household | 6,971 (53.0%) | 6,171 (47.0%) |
| 2-Person Household | 11,487 (71.0%) | 4,694 (29.0%) |
| 3-Person Household | 4,652 (73.1%) | 1,713 (26.9%) |
| 4+ Person Household | 6,494 (77.8%) | 1,849 (22.2%) |
| Total Housing Units | 29,604 (67.2%) | 14,427 (32.8%) |
Occupancy by Educational Attainment in Albemarle County
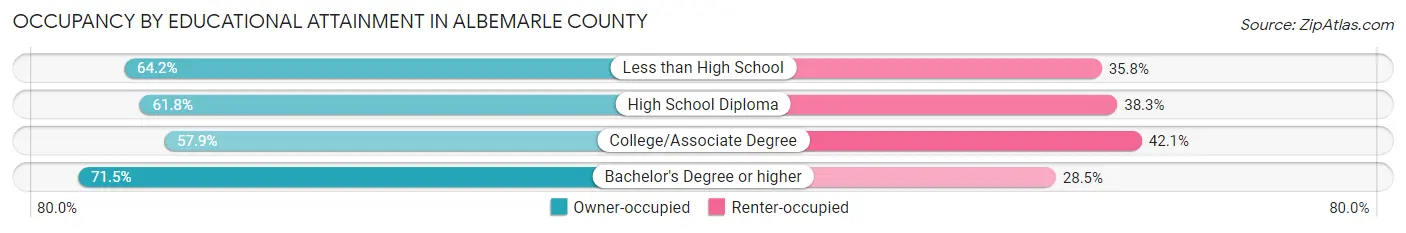
| Household Size | Owner-occupied | Renter-occupied |
| Less than High School | 1,371 (64.2%) | 764 (35.8%) |
| High School Diploma | 3,226 (61.8%) | 1,998 (38.3%) |
| College/Associate Degree | 5,146 (57.9%) | 3,748 (42.1%) |
| Bachelor's Degree or higher | 19,861 (71.5%) | 7,917 (28.5%) |
Occupancy by Age of Householder in Albemarle County
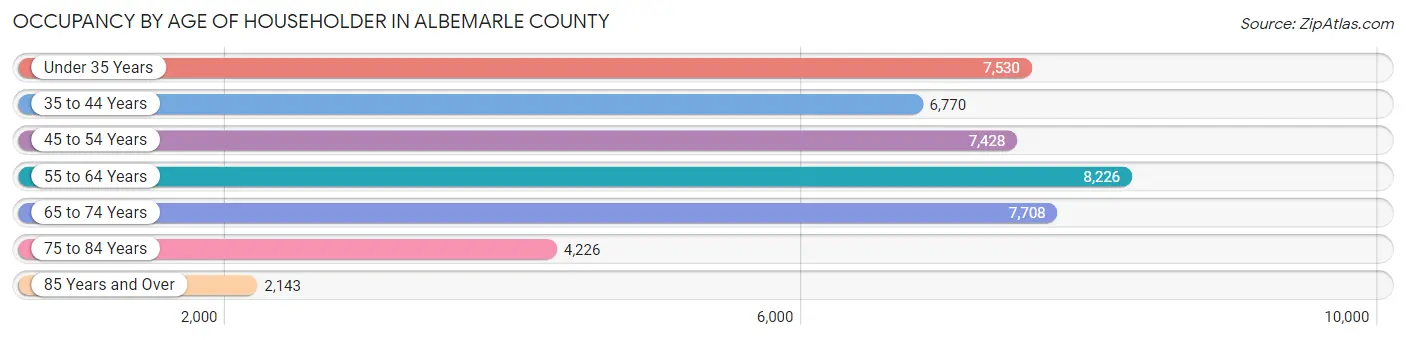
| Age Bracket | # Households | % Households |
| Under 35 Years | 7,530 | 17.1% |
| 35 to 44 Years | 6,770 | 15.4% |
| 45 to 54 Years | 7,428 | 16.9% |
| 55 to 64 Years | 8,226 | 18.7% |
| 65 to 74 Years | 7,708 | 17.5% |
| 75 to 84 Years | 4,226 | 9.6% |
| 85 Years and Over | 2,143 | 4.9% |
| Total | 44,031 | 100.0% |
Housing Finances in Albemarle County
Median Income by Occupancy in Albemarle County
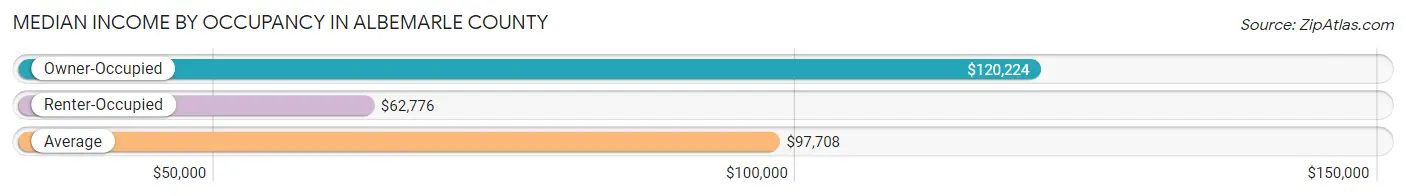
| Occupancy Type | # Households | Median Income |
| Owner-Occupied | 29,604 (67.2%) | $120,224 |
| Renter-Occupied | 14,427 (32.8%) | $62,776 |
| Average | 44,031 (100.0%) | $97,708 |
Occupancy by Householder Income Bracket in Albemarle County
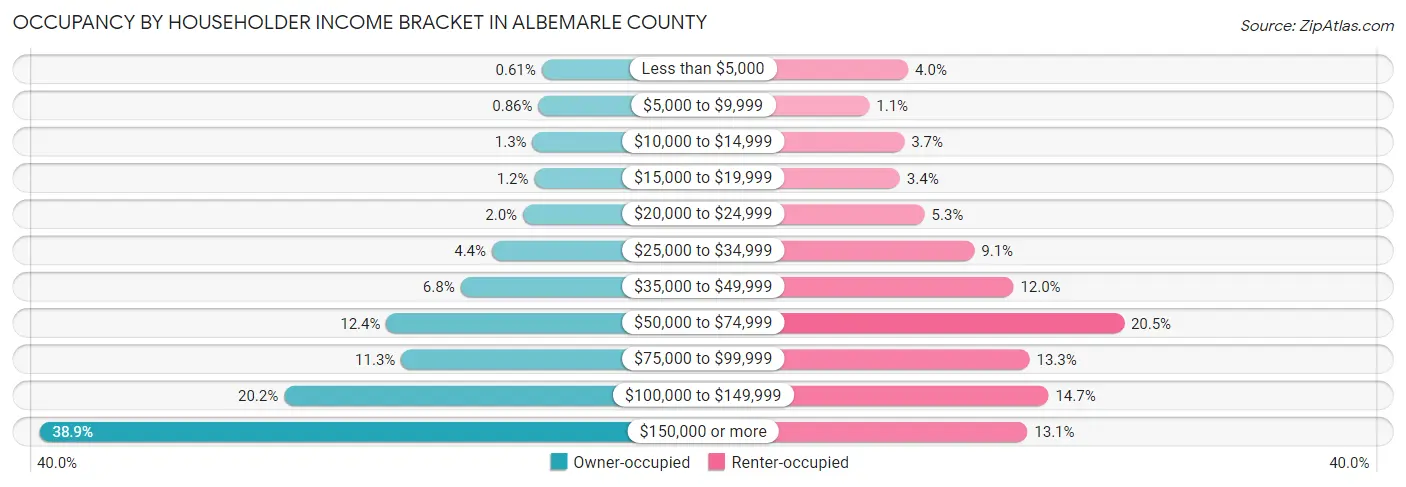
| Income Bracket | Owner-occupied | Renter-occupied |
| Less than $5,000 | 181 (0.6%) | 579 (4.0%) |
| $5,000 to $9,999 | 254 (0.9%) | 152 (1.1%) |
| $10,000 to $14,999 | 388 (1.3%) | 535 (3.7%) |
| $15,000 to $19,999 | 342 (1.2%) | 487 (3.4%) |
| $20,000 to $24,999 | 602 (2.0%) | 759 (5.3%) |
| $25,000 to $34,999 | 1,303 (4.4%) | 1,306 (9.0%) |
| $35,000 to $49,999 | 2,010 (6.8%) | 1,735 (12.0%) |
| $50,000 to $74,999 | 3,682 (12.4%) | 2,951 (20.4%) |
| $75,000 to $99,999 | 3,349 (11.3%) | 1,913 (13.3%) |
| $100,000 to $149,999 | 5,988 (20.2%) | 2,121 (14.7%) |
| $150,000 or more | 11,505 (38.9%) | 1,889 (13.1%) |
| Total | 29,604 (100.0%) | 14,427 (100.0%) |
Monthly Housing Cost Tiers in Albemarle County
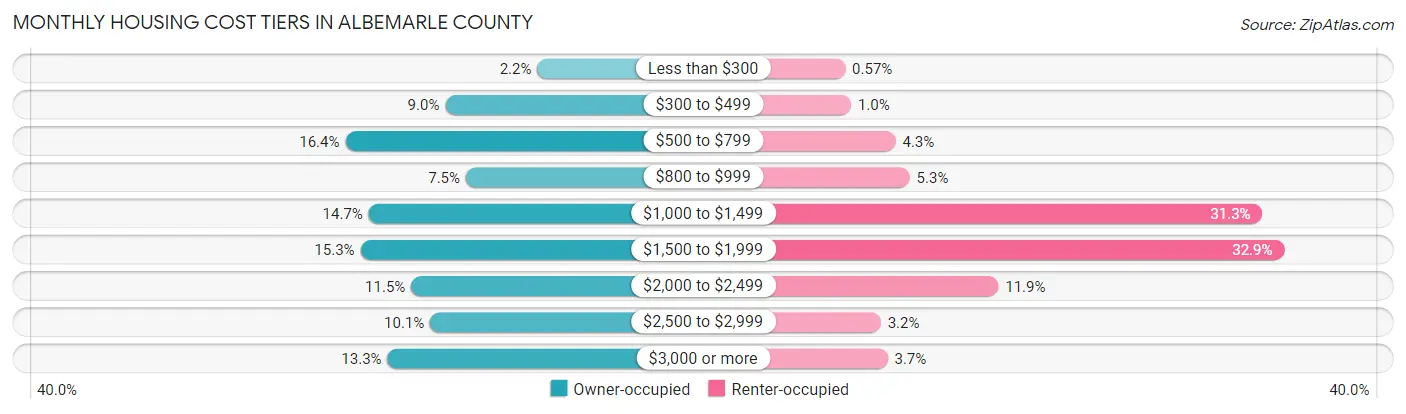
| Monthly Cost | Owner-occupied | Renter-occupied |
| Less than $300 | 663 (2.2%) | 82 (0.6%) |
| $300 to $499 | 2,670 (9.0%) | 144 (1.0%) |
| $500 to $799 | 4,848 (16.4%) | 618 (4.3%) |
| $800 to $999 | 2,220 (7.5%) | 767 (5.3%) |
| $1,000 to $1,499 | 4,340 (14.7%) | 4,516 (31.3%) |
| $1,500 to $1,999 | 4,520 (15.3%) | 4,748 (32.9%) |
| $2,000 to $2,499 | 3,413 (11.5%) | 1,709 (11.8%) |
| $2,500 to $2,999 | 3,000 (10.1%) | 460 (3.2%) |
| $3,000 or more | 3,930 (13.3%) | 533 (3.7%) |
| Total | 29,604 (100.0%) | 14,427 (100.0%) |
Physical Housing Characteristics in Albemarle County
Housing Structures in Albemarle County
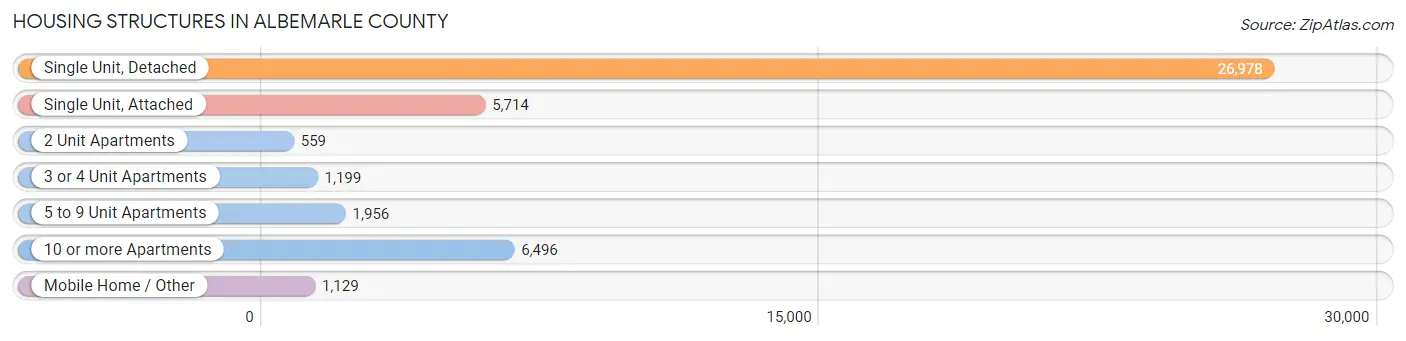
| Structure Type | # Housing Units | % Housing Units |
| Single Unit, Detached | 26,978 | 61.3% |
| Single Unit, Attached | 5,714 | 13.0% |
| 2 Unit Apartments | 559 | 1.3% |
| 3 or 4 Unit Apartments | 1,199 | 2.7% |
| 5 to 9 Unit Apartments | 1,956 | 4.4% |
| 10 or more Apartments | 6,496 | 14.7% |
| Mobile Home / Other | 1,129 | 2.6% |
| Total | 44,031 | 100.0% |
Housing Structures by Occupancy in Albemarle County
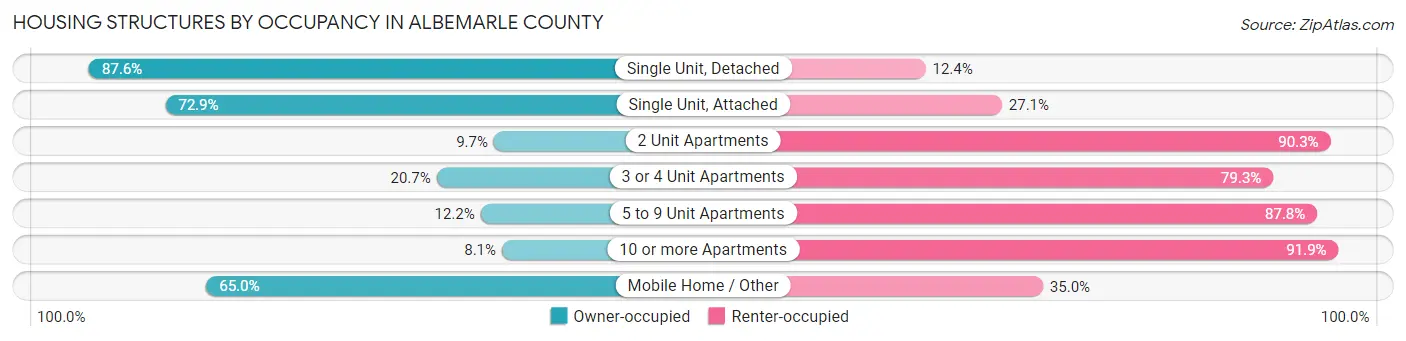
| Structure Type | Owner-occupied | Renter-occupied |
| Single Unit, Detached | 23,636 (87.6%) | 3,342 (12.4%) |
| Single Unit, Attached | 4,166 (72.9%) | 1,548 (27.1%) |
| 2 Unit Apartments | 54 (9.7%) | 505 (90.3%) |
| 3 or 4 Unit Apartments | 248 (20.7%) | 951 (79.3%) |
| 5 to 9 Unit Apartments | 239 (12.2%) | 1,717 (87.8%) |
| 10 or more Apartments | 527 (8.1%) | 5,969 (91.9%) |
| Mobile Home / Other | 734 (65.0%) | 395 (35.0%) |
| Total | 29,604 (67.2%) | 14,427 (32.8%) |
Housing Structures by Number of Rooms in Albemarle County
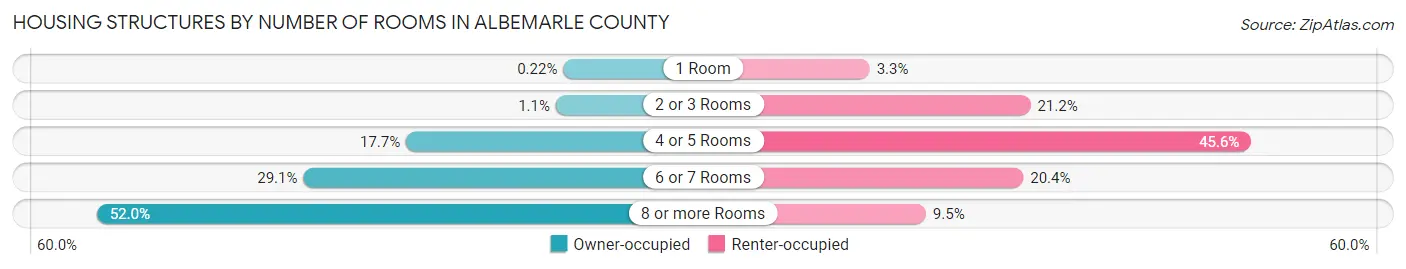
| Number of Rooms | Owner-occupied | Renter-occupied |
| 1 Room | 65 (0.2%) | 478 (3.3%) |
| 2 or 3 Rooms | 310 (1.1%) | 3,052 (21.1%) |
| 4 or 5 Rooms | 5,232 (17.7%) | 6,585 (45.6%) |
| 6 or 7 Rooms | 8,607 (29.1%) | 2,936 (20.3%) |
| 8 or more Rooms | 15,390 (52.0%) | 1,376 (9.5%) |
| Total | 29,604 (100.0%) | 14,427 (100.0%) |
Housing Structure by Heating Type in Albemarle County
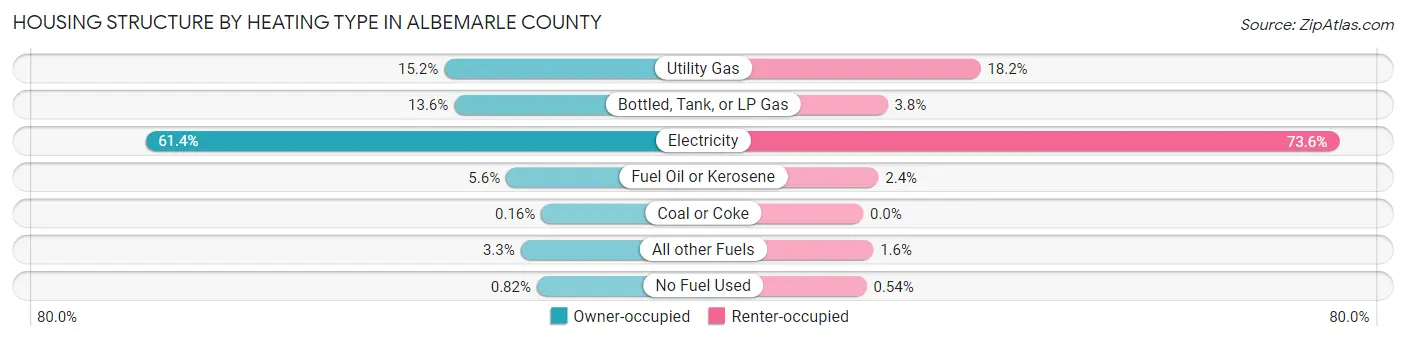
| Heating Type | Owner-occupied | Renter-occupied |
| Utility Gas | 4,487 (15.2%) | 2,619 (18.1%) |
| Bottled, Tank, or LP Gas | 4,026 (13.6%) | 546 (3.8%) |
| Electricity | 18,162 (61.4%) | 10,615 (73.6%) |
| Fuel Oil or Kerosene | 1,652 (5.6%) | 342 (2.4%) |
| Coal or Coke | 46 (0.2%) | 0 (0.0%) |
| All other Fuels | 987 (3.3%) | 227 (1.6%) |
| No Fuel Used | 244 (0.8%) | 78 (0.5%) |
| Total | 29,604 (100.0%) | 14,427 (100.0%) |
Household Vehicle Usage in Albemarle County
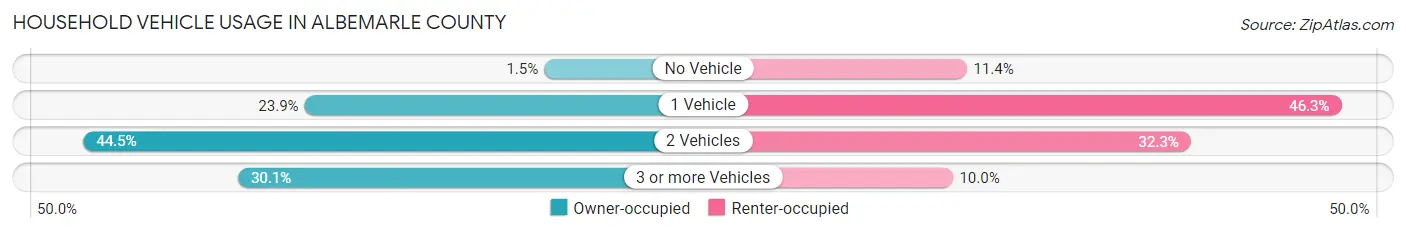
| Vehicles per Household | Owner-occupied | Renter-occupied |
| No Vehicle | 447 (1.5%) | 1,637 (11.4%) |
| 1 Vehicle | 7,070 (23.9%) | 6,686 (46.3%) |
| 2 Vehicles | 13,181 (44.5%) | 4,656 (32.3%) |
| 3 or more Vehicles | 8,906 (30.1%) | 1,448 (10.0%) |
| Total | 29,604 (100.0%) | 14,427 (100.0%) |
Real Estate & Mortgages in Albemarle County
Real Estate and Mortgage Overview in Albemarle County
| Characteristic | Without Mortgage | With Mortgage |
| Housing Units | 11,376 | 18,228 |
| Median Property Value | $446,700 | $451,500 |
| Median Household Income | $92,617 | $8,146 |
| Monthly Housing Costs | $645 | $3,716 |
| Real Estate Taxes | $3,491 | $173 |
Property Value by Mortgage Status in Albemarle County
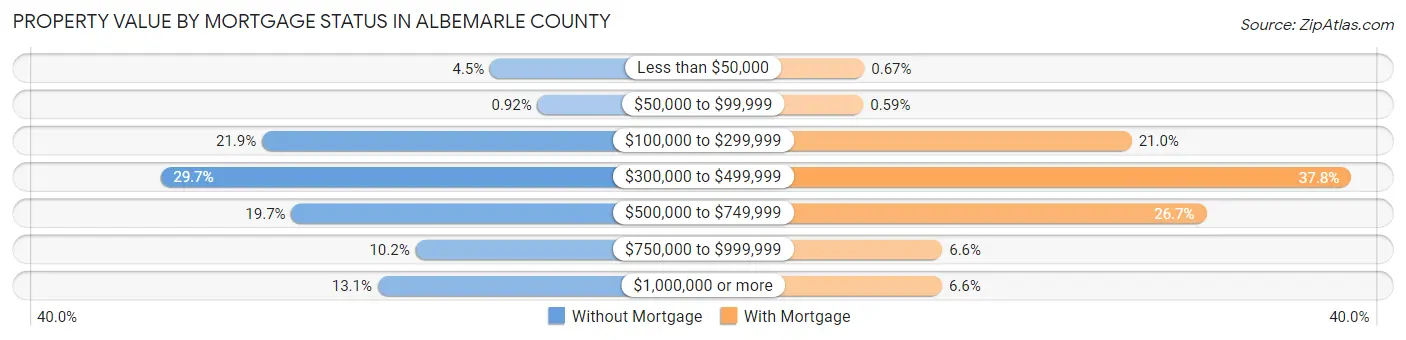
| Property Value | Without Mortgage | With Mortgage |
| Less than $50,000 | 515 (4.5%) | 122 (0.7%) |
| $50,000 to $99,999 | 105 (0.9%) | 107 (0.6%) |
| $100,000 to $299,999 | 2,492 (21.9%) | 3,836 (21.0%) |
| $300,000 to $499,999 | 3,374 (29.7%) | 6,883 (37.8%) |
| $500,000 to $749,999 | 2,238 (19.7%) | 4,873 (26.7%) |
| $750,000 to $999,999 | 1,163 (10.2%) | 1,205 (6.6%) |
| $1,000,000 or more | 1,489 (13.1%) | 1,202 (6.6%) |
| Total | 11,376 (100.0%) | 18,228 (100.0%) |
Household Income by Mortgage Status in Albemarle County
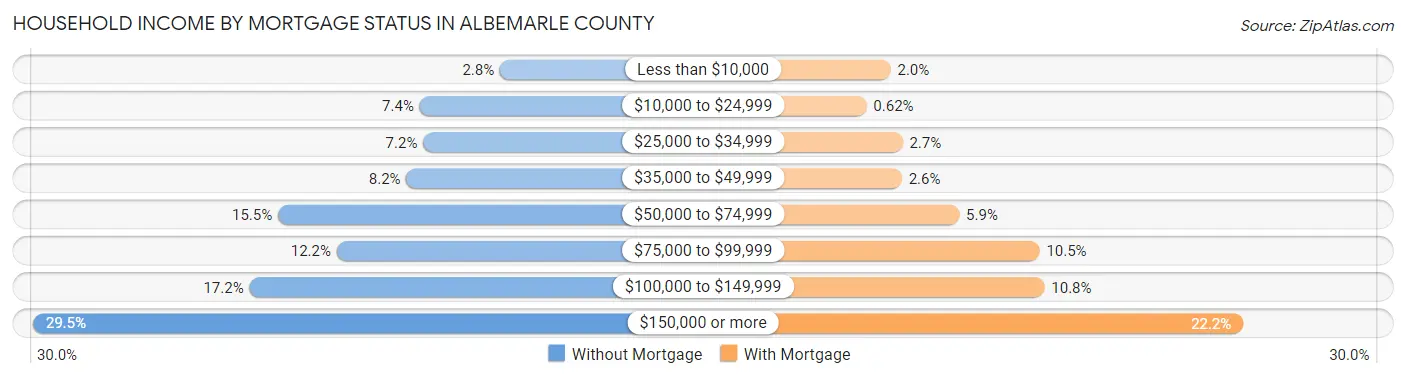
| Household Income | Without Mortgage | With Mortgage |
| Less than $10,000 | 322 (2.8%) | 364 (2.0%) |
| $10,000 to $24,999 | 844 (7.4%) | 113 (0.6%) |
| $25,000 to $34,999 | 821 (7.2%) | 488 (2.7%) |
| $35,000 to $49,999 | 930 (8.2%) | 482 (2.6%) |
| $50,000 to $74,999 | 1,766 (15.5%) | 1,080 (5.9%) |
| $75,000 to $99,999 | 1,383 (12.2%) | 1,916 (10.5%) |
| $100,000 to $149,999 | 1,951 (17.2%) | 1,966 (10.8%) |
| $150,000 or more | 3,359 (29.5%) | 4,037 (22.2%) |
| Total | 11,376 (100.0%) | 18,228 (100.0%) |
Property Value to Household Income Ratio in Albemarle County
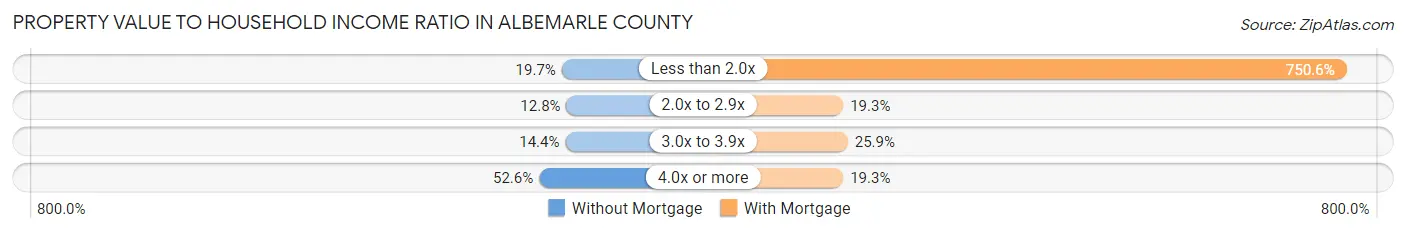
| Value-to-Income Ratio | Without Mortgage | With Mortgage |
| Less than 2.0x | 2,245 (19.7%) | 136,812 (750.6%) |
| 2.0x to 2.9x | 1,454 (12.8%) | 3,526 (19.3%) |
| 3.0x to 3.9x | 1,638 (14.4%) | 4,729 (25.9%) |
| 4.0x or more | 5,980 (52.6%) | 3,523 (19.3%) |
| Total | 11,376 (100.0%) | 18,228 (100.0%) |
Real Estate Taxes by Mortgage Status in Albemarle County
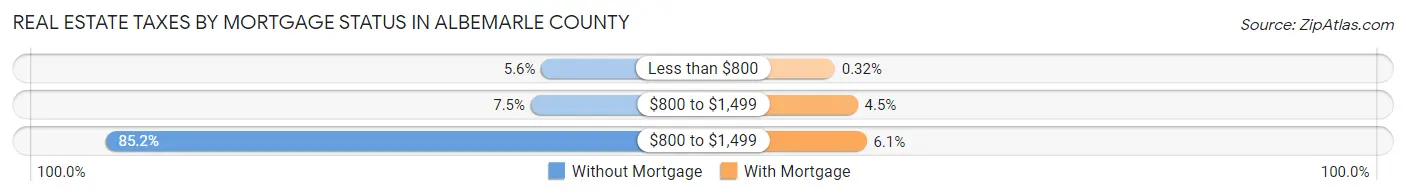
| Property Taxes | Without Mortgage | With Mortgage |
| Less than $800 | 638 (5.6%) | 59 (0.3%) |
| $800 to $1,499 | 857 (7.5%) | 818 (4.5%) |
| $800 to $1,499 | 9,694 (85.2%) | 1,111 (6.1%) |
| Total | 11,376 (100.0%) | 18,228 (100.0%) |
Health & Disability in Albemarle County
Health Insurance Coverage by Age in Albemarle County
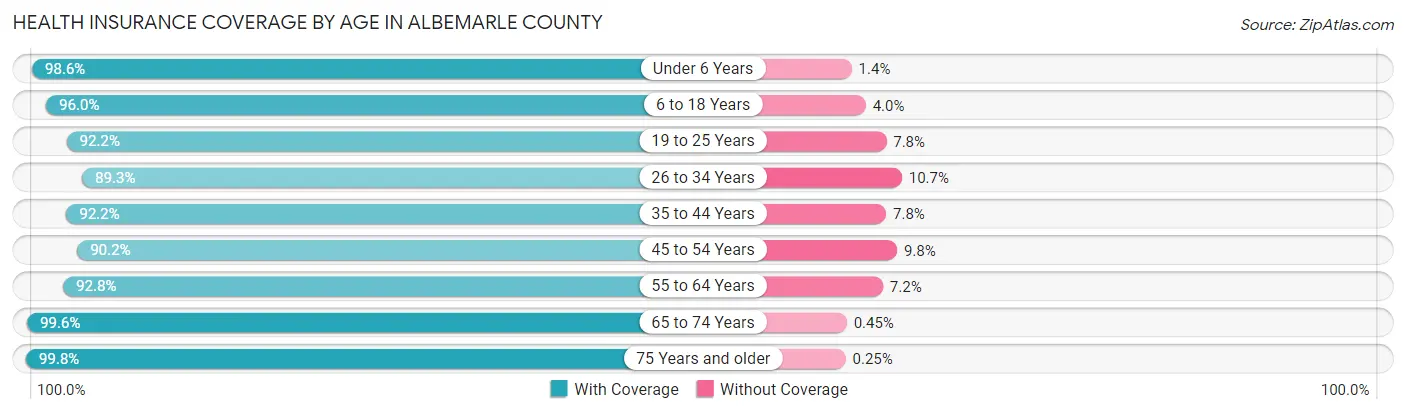
| Age Bracket | With Coverage | Without Coverage |
| Under 6 Years | 6,708 (98.6%) | 93 (1.4%) |
| 6 to 18 Years | 18,310 (96.0%) | 763 (4.0%) |
| 19 to 25 Years | 10,042 (92.2%) | 853 (7.8%) |
| 26 to 34 Years | 11,123 (89.3%) | 1,336 (10.7%) |
| 35 to 44 Years | 12,379 (92.2%) | 1,046 (7.8%) |
| 45 to 54 Years | 11,337 (90.2%) | 1,234 (9.8%) |
| 55 to 64 Years | 13,139 (92.8%) | 1,019 (7.2%) |
| 65 to 74 Years | 12,356 (99.6%) | 56 (0.4%) |
| 75 Years and older | 9,274 (99.8%) | 23 (0.3%) |
| Total | 104,668 (94.2%) | 6,423 (5.8%) |
Health Insurance Coverage by Citizenship Status in Albemarle County
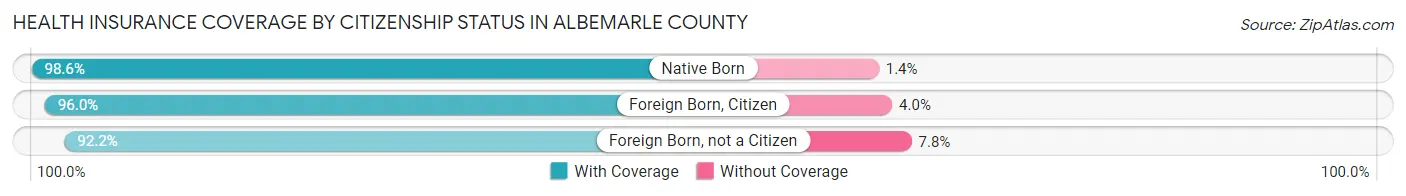
| Citizenship Status | With Coverage | Without Coverage |
| Native Born | 6,708 (98.6%) | 93 (1.4%) |
| Foreign Born, Citizen | 18,310 (96.0%) | 763 (4.0%) |
| Foreign Born, not a Citizen | 10,042 (92.2%) | 853 (7.8%) |
Health Insurance Coverage by Household Income in Albemarle County
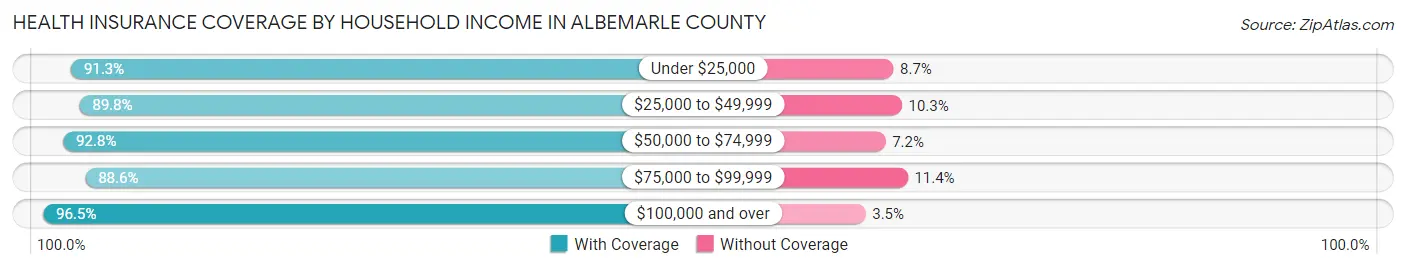
| Household Income | With Coverage | Without Coverage |
| Under $25,000 | 6,334 (91.3%) | 601 (8.7%) |
| $25,000 to $49,999 | 9,511 (89.7%) | 1,086 (10.2%) |
| $50,000 to $74,999 | 11,639 (92.8%) | 903 (7.2%) |
| $75,000 to $99,999 | 11,131 (88.6%) | 1,426 (11.4%) |
| $100,000 and over | 58,952 (96.5%) | 2,113 (3.5%) |
Public vs Private Health Insurance Coverage by Age in Albemarle County
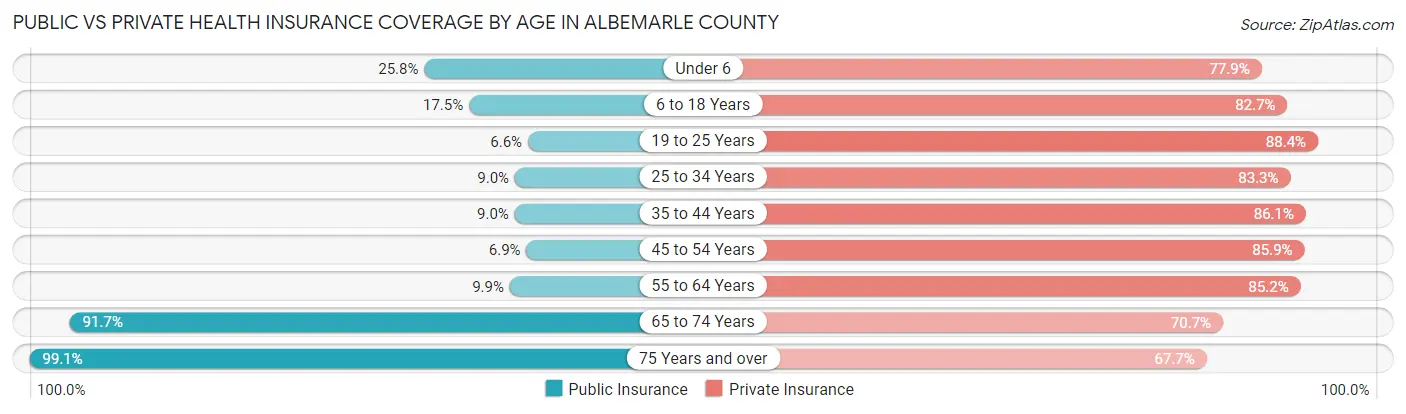
| Age Bracket | Public Insurance | Private Insurance |
| Under 6 | 1,755 (25.8%) | 5,299 (77.9%) |
| 6 to 18 Years | 3,340 (17.5%) | 15,775 (82.7%) |
| 19 to 25 Years | 716 (6.6%) | 9,628 (88.4%) |
| 25 to 34 Years | 1,119 (9.0%) | 10,372 (83.3%) |
| 35 to 44 Years | 1,213 (9.0%) | 11,562 (86.1%) |
| 45 to 54 Years | 861 (6.9%) | 10,794 (85.9%) |
| 55 to 64 Years | 1,407 (9.9%) | 12,056 (85.2%) |
| 65 to 74 Years | 11,377 (91.7%) | 8,780 (70.7%) |
| 75 Years and over | 9,214 (99.1%) | 6,295 (67.7%) |
| Total | 31,002 (27.9%) | 90,561 (81.5%) |
Disability Status by Sex by Age in Albemarle County
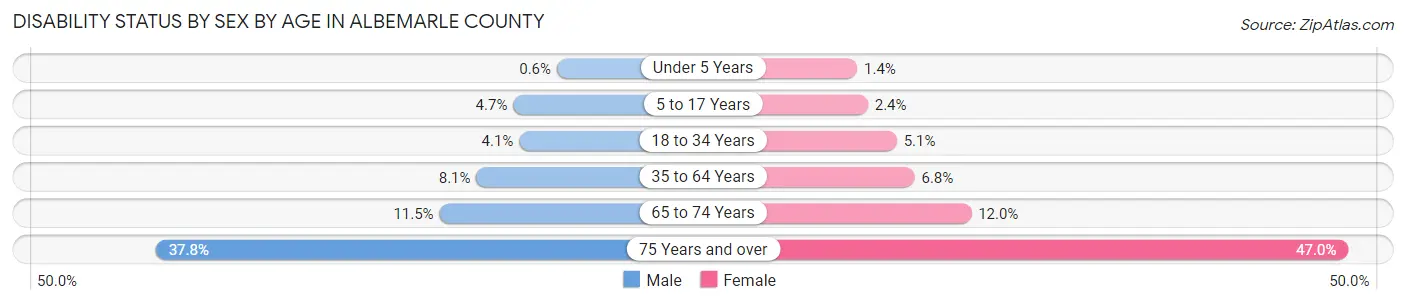
| Age Bracket | Male | Female |
| Under 5 Years | 17 (0.6%) | 40 (1.4%) |
| 5 to 17 Years | 388 (4.6%) | 192 (2.4%) |
| 18 to 34 Years | 539 (4.1%) | 719 (5.1%) |
| 35 to 64 Years | 1,554 (8.1%) | 1,411 (6.8%) |
| 65 to 74 Years | 651 (11.5%) | 811 (12.0%) |
| 75 Years and over | 1,454 (37.8%) | 2,563 (47.0%) |
Disability Class by Sex by Age in Albemarle County
Disability Class: Hearing Difficulty
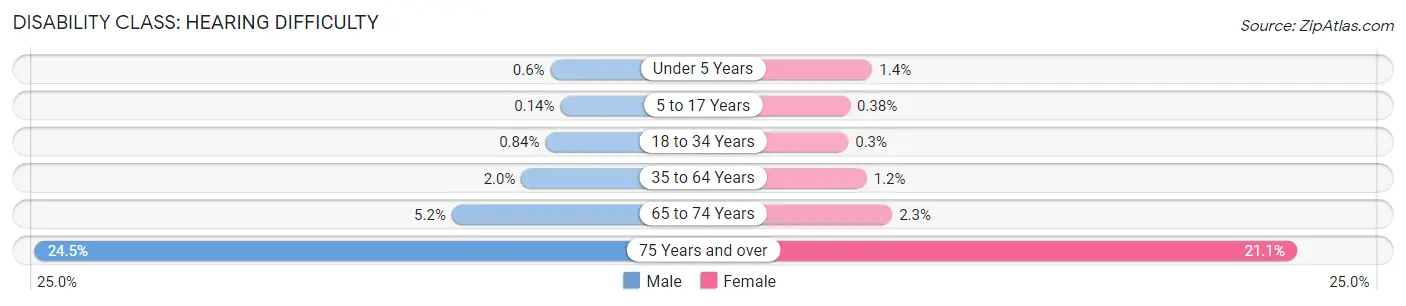
| Age Bracket | Male | Female |
| Under 5 Years | 17 (0.6%) | 40 (1.4%) |
| 5 to 17 Years | 12 (0.1%) | 30 (0.4%) |
| 18 to 34 Years | 110 (0.8%) | 43 (0.3%) |
| 35 to 64 Years | 375 (1.9%) | 242 (1.2%) |
| 65 to 74 Years | 293 (5.2%) | 158 (2.3%) |
| 75 Years and over | 943 (24.5%) | 1,151 (21.1%) |
Disability Class: Vision Difficulty
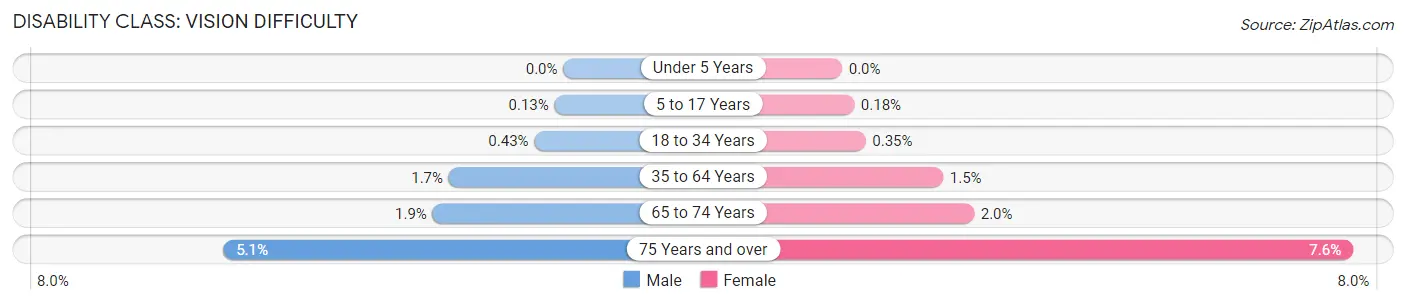
| Age Bracket | Male | Female |
| Under 5 Years | 0 (0.0%) | 0 (0.0%) |
| 5 to 17 Years | 11 (0.1%) | 14 (0.2%) |
| 18 to 34 Years | 56 (0.4%) | 49 (0.4%) |
| 35 to 64 Years | 328 (1.7%) | 313 (1.5%) |
| 65 to 74 Years | 110 (1.9%) | 132 (2.0%) |
| 75 Years and over | 194 (5.1%) | 414 (7.6%) |
Disability Class: Cognitive Difficulty
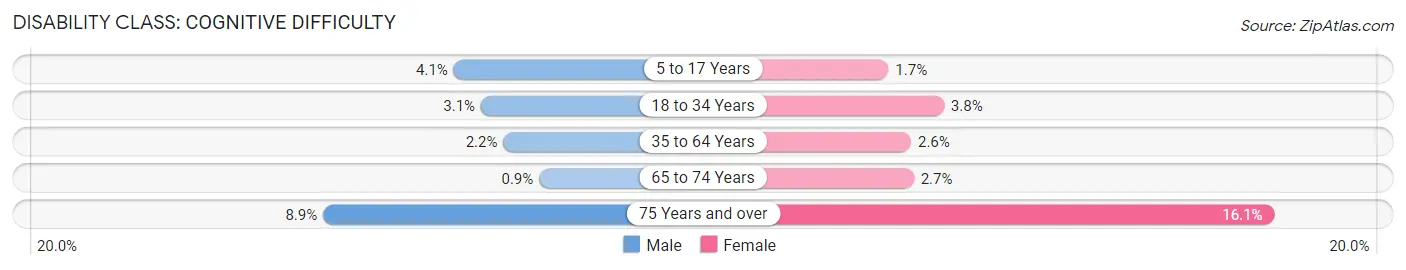
| Age Bracket | Male | Female |
| 5 to 17 Years | 340 (4.1%) | 138 (1.7%) |
| 18 to 34 Years | 402 (3.1%) | 534 (3.8%) |
| 35 to 64 Years | 429 (2.2%) | 537 (2.6%) |
| 65 to 74 Years | 51 (0.9%) | 180 (2.7%) |
| 75 Years and over | 343 (8.9%) | 876 (16.1%) |
Disability Class: Ambulatory Difficulty
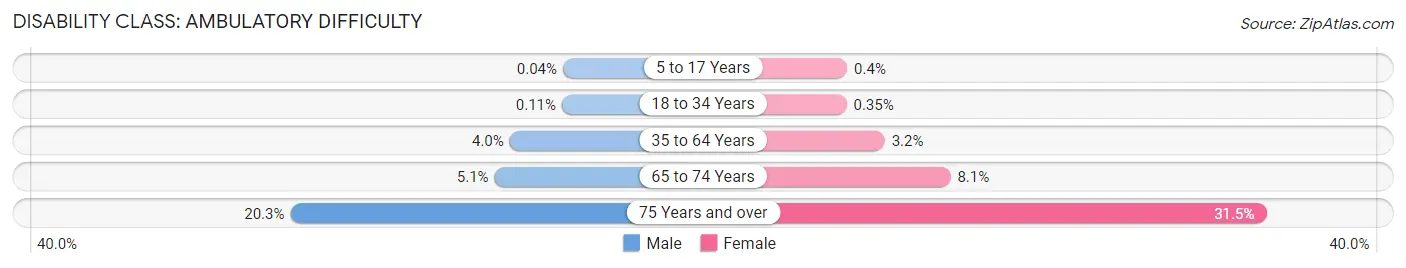
| Age Bracket | Male | Female |
| 5 to 17 Years | 3 (0.0%) | 32 (0.4%) |
| 18 to 34 Years | 15 (0.1%) | 49 (0.4%) |
| 35 to 64 Years | 768 (4.0%) | 667 (3.2%) |
| 65 to 74 Years | 290 (5.1%) | 545 (8.1%) |
| 75 Years and over | 779 (20.3%) | 1,718 (31.5%) |
Disability Class: Self-Care Difficulty
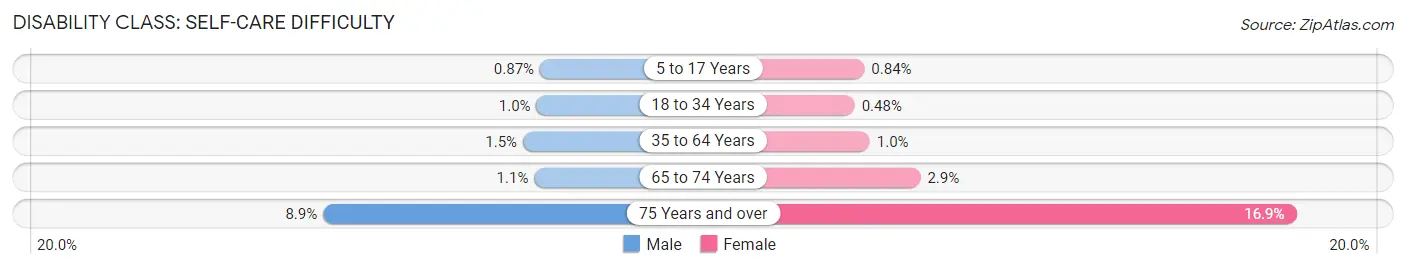
| Age Bracket | Male | Female |
| 5 to 17 Years | 73 (0.9%) | 67 (0.8%) |
| 18 to 34 Years | 131 (1.0%) | 68 (0.5%) |
| 35 to 64 Years | 288 (1.5%) | 218 (1.0%) |
| 65 to 74 Years | 61 (1.1%) | 197 (2.9%) |
| 75 Years and over | 343 (8.9%) | 920 (16.9%) |
Technology Access in Albemarle County
Computing Device Access in Albemarle County
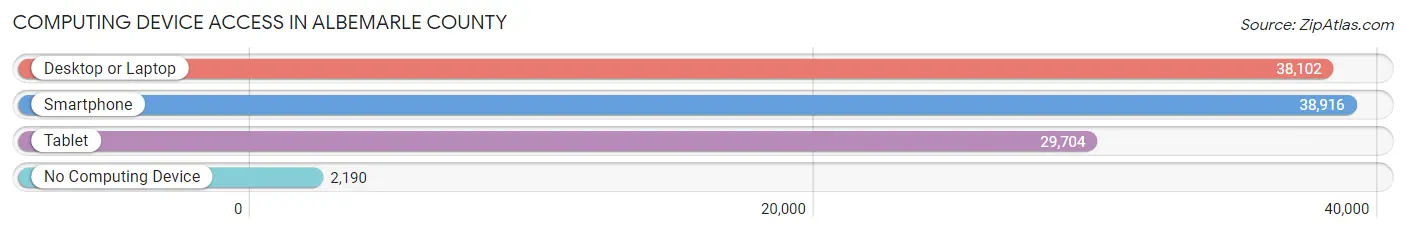
| Device Type | # Households | % Households |
| Desktop or Laptop | 38,102 | 86.5% |
| Smartphone | 38,916 | 88.4% |
| Tablet | 29,704 | 67.5% |
| No Computing Device | 2,190 | 5.0% |
| Total | 44,031 | 100.0% |
Internet Access in Albemarle County
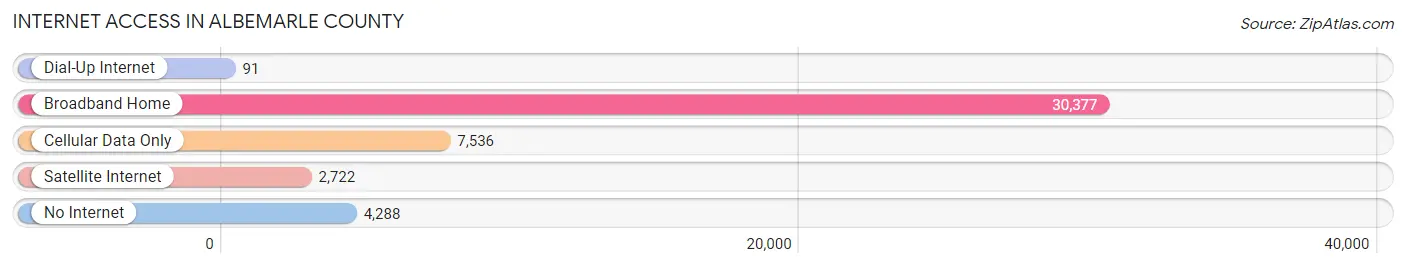
| Internet Type | # Households | % Households |
| Dial-Up Internet | 91 | 0.2% |
| Broadband Home | 30,377 | 69.0% |
| Cellular Data Only | 7,536 | 17.1% |
| Satellite Internet | 2,722 | 6.2% |
| No Internet | 4,288 | 9.7% |
| Total | 44,031 | 100.0% |
Albemarle County Summary
Albemarle County, Virginia is located in the central part of the state, just west of Charlottesville. It is bordered by Greene County to the north, Fluvanna County to the east, Louisa County to the south, and Nelson County to the west. The county is home to a population of approximately 97,000 people, making it the fifth most populous county in Virginia.
History
Albemarle County was established in 1744 from the western portion of Goochland County. It was named after William Anne Keppel, 2nd Earl of Albemarle, who was a British general and colonial governor of Virginia. The county was originally divided into four districts: Charlottesville, Scottsville, Milton, and Free Union.
The county was home to several prominent figures in American history, including Thomas Jefferson, James Madison, and James Monroe. Jefferson and Madison both owned plantations in the county, and Monroe was born in Albemarle County.
Geography
Albemarle County is located in the Piedmont region of Virginia, and is characterized by rolling hills and valleys. The county is home to the Blue Ridge Mountains, which form its western border. The county is drained by the Rivanna River, which flows through the county from north to south.
The county has a total area of 726 square miles, of which 717 square miles is land and 9 square miles is water. The county is home to several state parks, including Shenandoah National Park, which is located in the northern part of the county.
Economy
Albemarle County has a diverse economy, with a mix of agriculture, manufacturing, and service industries. The county is home to several large employers, including the University of Virginia, the University of Virginia Medical Center, and the Albemarle County Public Schools.
Agriculture is an important part of the county’s economy, with the county’s farms producing a variety of crops, including corn, soybeans, wheat, hay, and tobacco. The county is also home to several wineries and breweries, as well as a number of small businesses.
Demographics
As of the 2010 census, Albemarle County had a population of 97,570. The racial makeup of the county was 79.2% White, 14.3% African American, 0.3% Native American, 3.2% Asian, 0.1% Pacific Islander, 1.2% from other races, and 1.8% from two or more races. Hispanic or Latino of any race were 3.7% of the population.
The median income for a household in the county was $63,902, and the median income for a family was $77,868. The per capita income for the county was $35,945. About 8.2% of families and 11.7% of the population were below the poverty line, including 15.2% of those under age 18 and 6.2% of those age 65 or over.
Albemarle County is a diverse and vibrant community, with a rich history and a strong economy. The county is home to a variety of industries, from agriculture to manufacturing, and is a great place to live and work.
Common Questions
What is Per Capita Income in Albemarle County?
Per Capita income in Albemarle County is $55,347.
What is the Median Family Income in Albemarle County?
Median Family Income in Albemarle County is $126,769.
What is the Median Household income in Albemarle County?
Median Household Income in Albemarle County is $97,708.
What is Income or Wage Gap in Albemarle County?
Income or Wage Gap in Albemarle County is 22.4%.
Women in Albemarle County earn 77.6 cents for every dollar earned by a man.
What is Family Income Deficit in Albemarle County?
Family Income Deficit in Albemarle County is $11,643.
Families that are below poverty line in Albemarle County earn $11,643 less on average than the poverty threshold level.
What is Inequality or Gini Index in Albemarle County?
Inequality or Gini Index in Albemarle County is 0.48.
What is the Total Population of Albemarle County?
Total Population of Albemarle County is 112,513.
What is the Total Male Population of Albemarle County?
Total Male Population of Albemarle County is 54,068.
What is the Total Female Population of Albemarle County?
Total Female Population of Albemarle County is 58,445.
What is the Ratio of Males per 100 Females in Albemarle County?
There are 92.51 Males per 100 Females in Albemarle County.
What is the Ratio of Females per 100 Males in Albemarle County?
There are 108.10 Females per 100 Males in Albemarle County.
What is the Median Population Age in Albemarle County?
Median Population Age in Albemarle County is 39.7 Years.
What is the Average Family Size in Albemarle County
Average Family Size in Albemarle County is 2.9 People.
What is the Average Household Size in Albemarle County
Average Household Size in Albemarle County is 2.4 People.
How Large is the Labor Force in Albemarle County?
There are 56,637 People in the Labor Forcein in Albemarle County.
What is the Percentage of People in the Labor Force in Albemarle County?
60.8% of People are in the Labor Force in Albemarle County.
What is the Unemployment Rate in Albemarle County?
Unemployment Rate in Albemarle County is 3.1%.