Fort Stockton, TX Map & Demographics
Fort Stockton Map
Fort Stockton Overview
$30,376
PER CAPITA INCOME
$66,950
AVG FAMILY INCOME
$65,657
AVG HOUSEHOLD INCOME
51.9%
WAGE / INCOME GAP [ % ]
48.1¢/ $1
WAGE / INCOME GAP [ $ ]
$13,039
FAMILY INCOME DEFICIT
0.47
INEQUALITY / GINI INDEX
8,404
TOTAL POPULATION
4,228
MALE POPULATION
4,176
FEMALE POPULATION
101.25
MALES / 100 FEMALES
98.77
FEMALES / 100 MALES
34.5
MEDIAN AGE
3.0
AVG FAMILY SIZE
2.5
AVG HOUSEHOLD SIZE
3,948
LABOR FORCE [ PEOPLE ]
62.5%
PERCENT IN LABOR FORCE
1.2%
UNEMPLOYMENT RATE
Fort Stockton Zip Codes
Fort Stockton Area Codes
Income in Fort Stockton
Income Overview in Fort Stockton
Per Capita Income in Fort Stockton is $30,376, while median incomes of families and households are $66,950 and $65,657 respectively.
| Characteristic | Number | Measure |
| Per Capita Income | 8,404 | $30,376 |
| Median Family Income | 2,111 | $66,950 |
| Mean Family Income | 2,111 | $84,703 |
| Median Household Income | 3,147 | $65,657 |
| Mean Household Income | 3,147 | $82,413 |
| Income Deficit | 2,111 | $13,039 |
| Wage / Income Gap (%) | 8,404 | 51.88% |
| Wage / Income Gap ($) | 8,404 | 48.12¢ per $1 |
| Gini / Inequality Index | 8,404 | 0.47 |
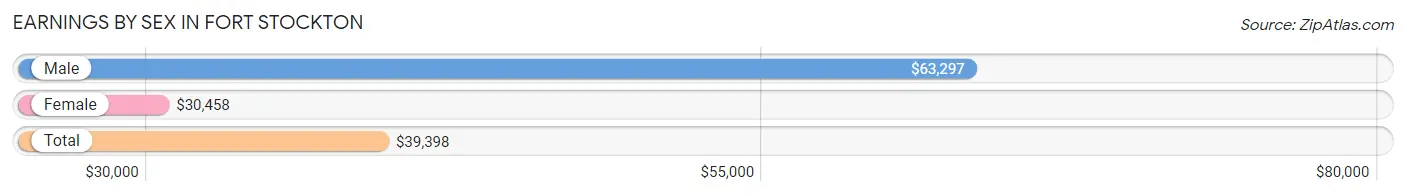
Earnings by Sex in Fort Stockton
Average Earnings in Fort Stockton are $39,398, $63,297 for men and $30,458 for women, a difference of 51.9%.
| Sex | Number | Average Earnings |
| Male | 2,065 (50.2%) | $63,297 |
| Female | 2,052 (49.8%) | $30,458 |
| Total | 4,117 (100.0%) | $39,398 |
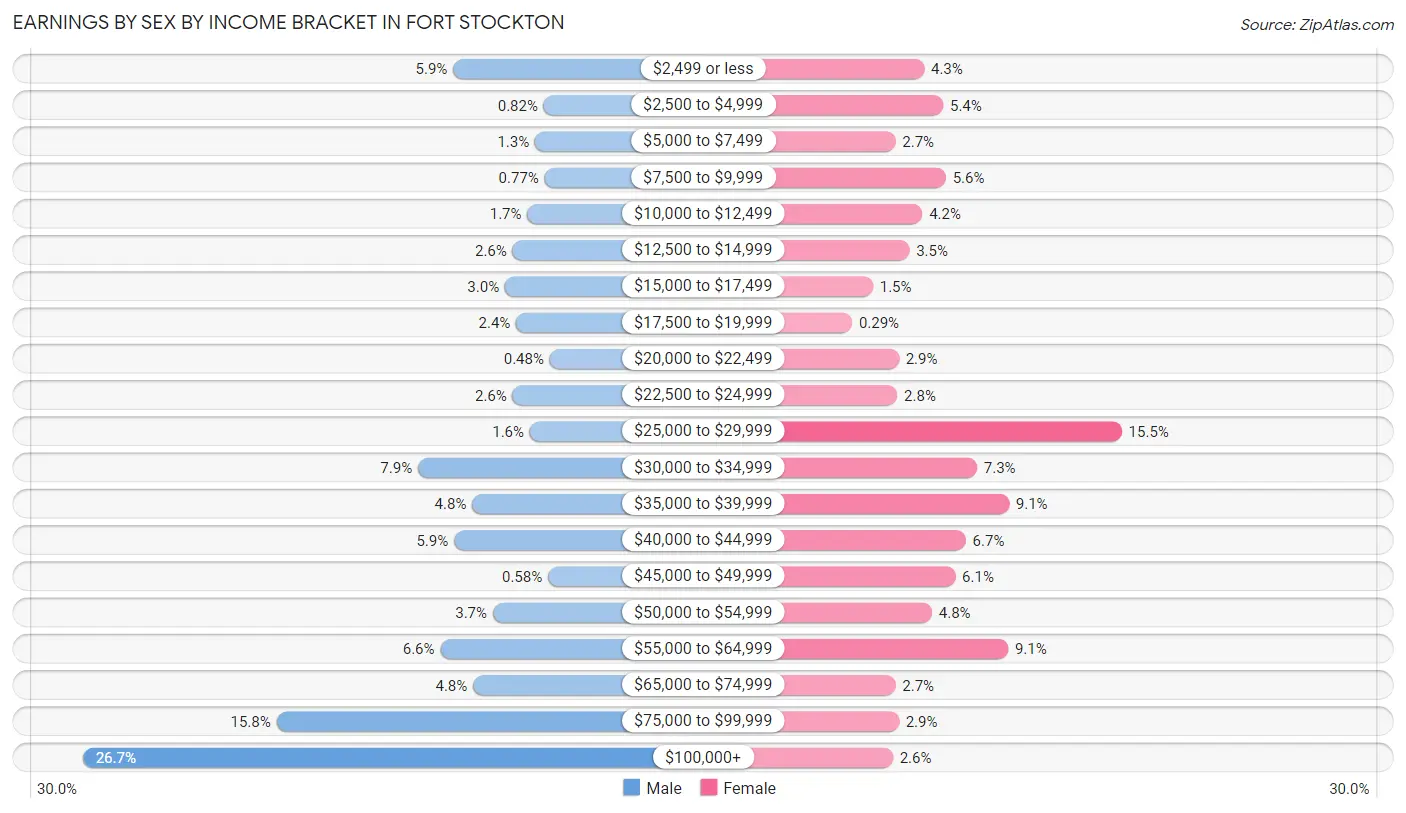
Earnings by Sex by Income Bracket in Fort Stockton
The most common earnings brackets in Fort Stockton are $100,000+ for men (552 | 26.7%) and $25,000 to $29,999 for women (317 | 15.4%).
| Income | Male | Female |
| $2,499 or less | 122 (5.9%) | 89 (4.3%) |
| $2,500 to $4,999 | 17 (0.8%) | 111 (5.4%) |
| $5,000 to $7,499 | 27 (1.3%) | 56 (2.7%) |
| $7,500 to $9,999 | 16 (0.8%) | 114 (5.6%) |
| $10,000 to $12,499 | 36 (1.7%) | 87 (4.2%) |
| $12,500 to $14,999 | 53 (2.6%) | 72 (3.5%) |
| $15,000 to $17,499 | 62 (3.0%) | 30 (1.5%) |
| $17,500 to $19,999 | 49 (2.4%) | 6 (0.3%) |
| $20,000 to $22,499 | 10 (0.5%) | 60 (2.9%) |
| $22,500 to $24,999 | 53 (2.6%) | 58 (2.8%) |
| $25,000 to $29,999 | 33 (1.6%) | 317 (15.4%) |
| $30,000 to $34,999 | 163 (7.9%) | 150 (7.3%) |
| $35,000 to $39,999 | 100 (4.8%) | 187 (9.1%) |
| $40,000 to $44,999 | 121 (5.9%) | 137 (6.7%) |
| $45,000 to $49,999 | 12 (0.6%) | 125 (6.1%) |
| $50,000 to $54,999 | 76 (3.7%) | 98 (4.8%) |
| $55,000 to $64,999 | 137 (6.6%) | 186 (9.1%) |
| $65,000 to $74,999 | 99 (4.8%) | 56 (2.7%) |
| $75,000 to $99,999 | 327 (15.8%) | 60 (2.9%) |
| $100,000+ | 552 (26.7%) | 53 (2.6%) |
| Total | 2,065 (100.0%) | 2,052 (100.0%) |
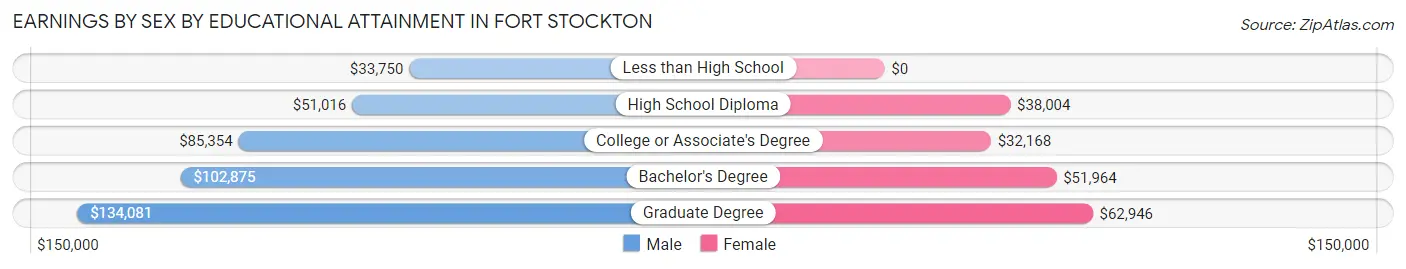
Earnings by Sex by Educational Attainment in Fort Stockton
Average earnings in Fort Stockton are $71,076 for men and $32,478 for women, a difference of 54.3%. Men with an educational attainment of graduate degree enjoy the highest average annual earnings of $134,081, while those with less than high school education earn the least with $33,750. Women with an educational attainment of graduate degree earn the most with the average annual earnings of $62,946, while those with college or associate's degree education have the smallest earnings of $32,168.
| Educational Attainment | Male Income | Female Income |
| Less than High School | $33,750 | $0 |
| High School Diploma | $51,016 | $38,004 |
| College or Associate's Degree | $85,354 | $32,168 |
| Bachelor's Degree | $102,875 | $51,964 |
| Graduate Degree | $134,081 | $62,946 |
| Total | $71,076 | $32,478 |
Family Income in Fort Stockton
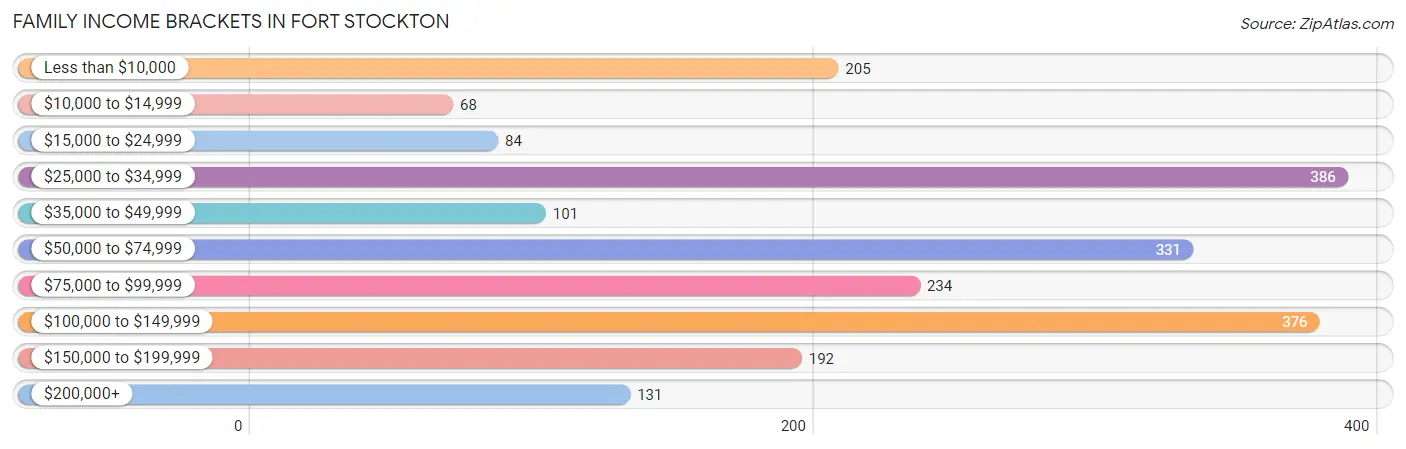
Family Income Brackets in Fort Stockton
According to the Fort Stockton family income data, there are 386 families falling into the $25,000 to $34,999 income range, which is the most common income bracket and makes up 18.3% of all families. Conversely, the $10,000 to $14,999 income bracket is the least frequent group with only 68 families (3.2%) belonging to this category.
| Income Bracket | # Families | % Families |
| Less than $10,000 | 205 | 9.7% |
| $10,000 to $14,999 | 68 | 3.2% |
| $15,000 to $24,999 | 84 | 4.0% |
| $25,000 to $34,999 | 386 | 18.3% |
| $35,000 to $49,999 | 101 | 4.8% |
| $50,000 to $74,999 | 331 | 15.7% |
| $75,000 to $99,999 | 234 | 11.1% |
| $100,000 to $149,999 | 376 | 17.8% |
| $150,000 to $199,999 | 192 | 9.1% |
| $200,000+ | 131 | 6.2% |
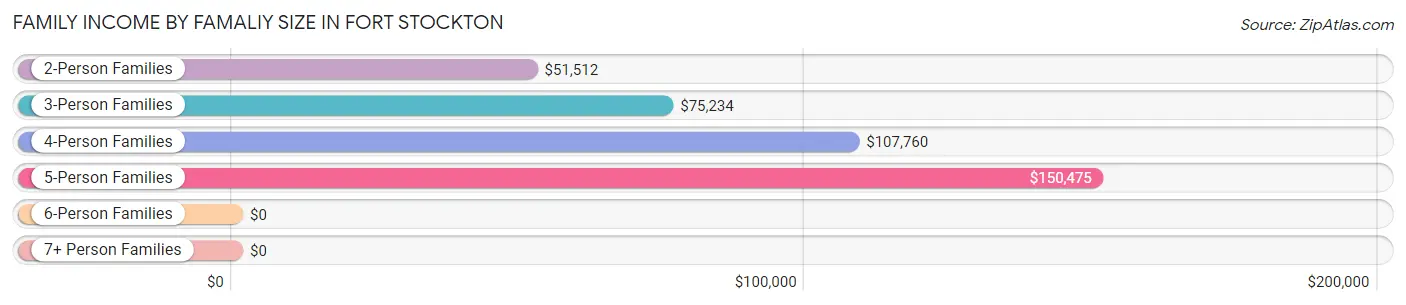
Family Income by Famaliy Size in Fort Stockton
5-person families (188 | 8.9%) account for the highest median family income in Fort Stockton with $150,475 per family, while 5-person families (188 | 8.9%) have the highest median income of $30,095 per family member.
| Income Bracket | # Families | Median Income |
| 2-Person Families | 1,234 (58.5%) | $51,512 |
| 3-Person Families | 153 (7.2%) | $75,234 |
| 4-Person Families | 371 (17.6%) | $107,760 |
| 5-Person Families | 188 (8.9%) | $150,475 |
| 6-Person Families | 74 (3.5%) | $0 |
| 7+ Person Families | 91 (4.3%) | $0 |
| Total | 2,111 (100.0%) | $66,950 |
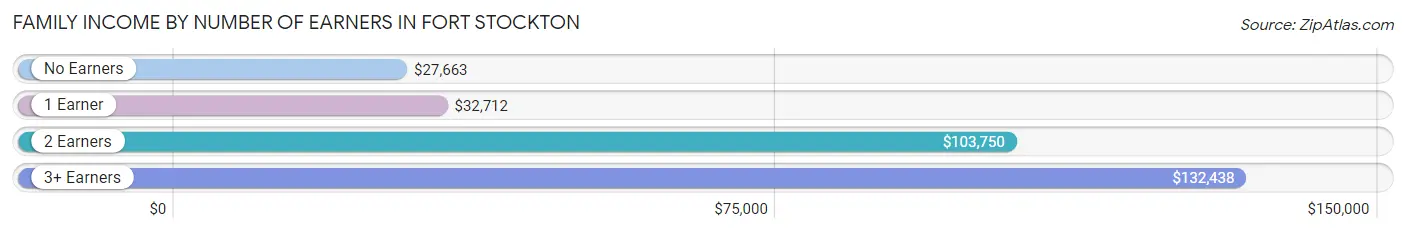
Family Income by Number of Earners in Fort Stockton
The median family income in Fort Stockton is $66,950, with families comprising 3+ earners (141) having the highest median family income of $132,438, while families with no earners (207) have the lowest median family income of $27,663, accounting for 6.7% and 9.8% of families, respectively.
| Number of Earners | # Families | Median Income |
| No Earners | 207 (9.8%) | $27,663 |
| 1 Earner | 907 (43.0%) | $32,712 |
| 2 Earners | 856 (40.6%) | $103,750 |
| 3+ Earners | 141 (6.7%) | $132,438 |
| Total | 2,111 (100.0%) | $66,950 |
Household Income in Fort Stockton
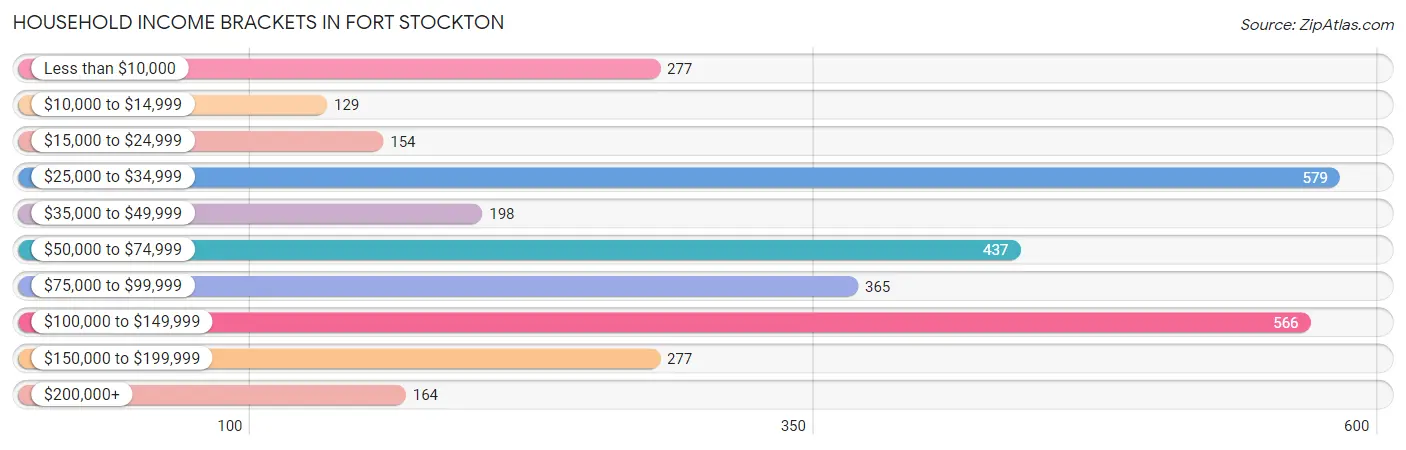
Household Income Brackets in Fort Stockton
With 579 households falling in the category, the $25,000 to $34,999 income range is the most frequent in Fort Stockton, accounting for 18.4% of all households. In contrast, only 129 households (4.1%) fall into the $10,000 to $14,999 income bracket, making it the least populous group.
| Income Bracket | # Households | % Households |
| Less than $10,000 | 277 | 8.8% |
| $10,000 to $14,999 | 129 | 4.1% |
| $15,000 to $24,999 | 154 | 4.9% |
| $25,000 to $34,999 | 579 | 18.4% |
| $35,000 to $49,999 | 198 | 6.3% |
| $50,000 to $74,999 | 437 | 13.9% |
| $75,000 to $99,999 | 365 | 11.6% |
| $100,000 to $149,999 | 566 | 18.0% |
| $150,000 to $199,999 | 277 | 8.8% |
| $200,000+ | 164 | 5.2% |
Household Income by Householder Age in Fort Stockton
The median household income in Fort Stockton is $65,657, with the highest median household income of $81,161 found in the 25 to 44 years age bracket for the primary householder. A total of 1,157 households (36.8%) fall into this category. Meanwhile, the 15 to 24 years age bracket for the primary householder has the lowest median household income of $0, with 126 households (4.0%) in this group.
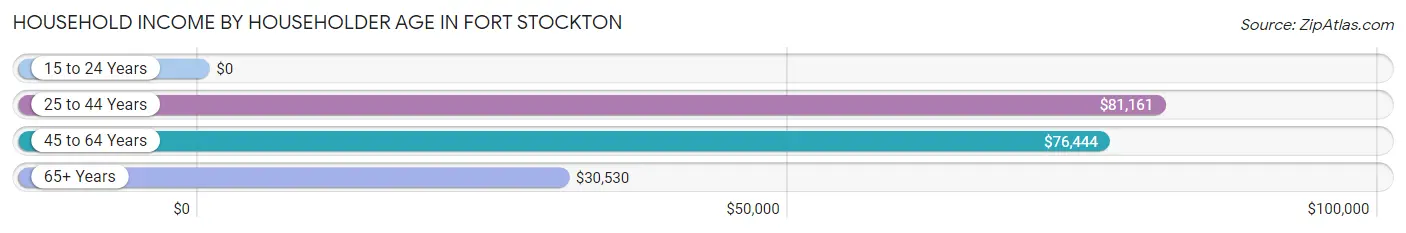
| Income Bracket | # Households | Median Income |
| 15 to 24 Years | 126 (4.0%) | $0 |
| 25 to 44 Years | 1,157 (36.8%) | $81,161 |
| 45 to 64 Years | 1,088 (34.6%) | $76,444 |
| 65+ Years | 776 (24.7%) | $30,530 |
| Total | 3,147 (100.0%) | $65,657 |
Poverty in Fort Stockton
Income Below Poverty by Sex and Age in Fort Stockton
With 28.7% poverty level for males and 28.2% for females among the residents of Fort Stockton, 15 year old males and 15 year old females are the most vulnerable to poverty, with 11 males (100.0%) and 106 females (100.0%) in their respective age groups living below the poverty level.
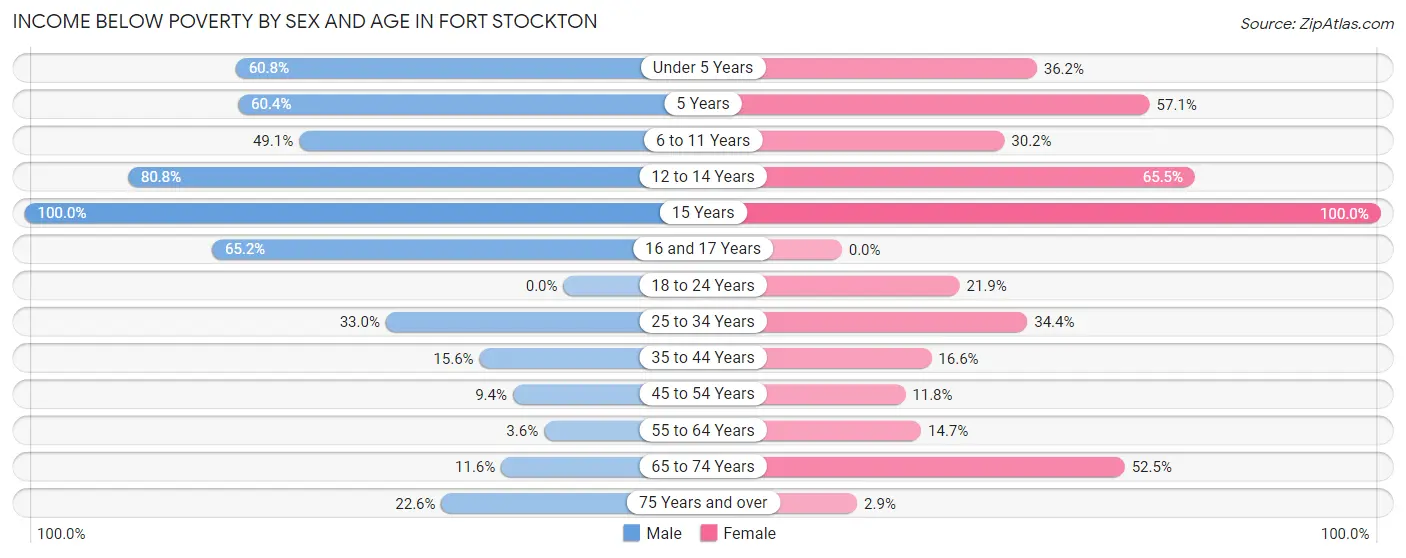
| Age Bracket | Male | Female |
| Under 5 Years | 183 (60.8%) | 93 (36.2%) |
| 5 Years | 64 (60.4%) | 32 (57.1%) |
| 6 to 11 Years | 185 (49.1%) | 99 (30.2%) |
| 12 to 14 Years | 135 (80.8%) | 173 (65.5%) |
| 15 Years | 11 (100.0%) | 106 (100.0%) |
| 16 and 17 Years | 60 (65.2%) | 0 (0.0%) |
| 18 to 24 Years | 0 (0.0%) | 89 (21.9%) |
| 25 to 34 Years | 183 (33.0%) | 209 (34.4%) |
| 35 to 44 Years | 91 (15.6%) | 79 (16.6%) |
| 45 to 54 Years | 35 (9.4%) | 63 (11.8%) |
| 55 to 64 Years | 13 (3.6%) | 63 (14.7%) |
| 65 to 74 Years | 29 (11.6%) | 146 (52.5%) |
| 75 Years and over | 36 (22.6%) | 8 (2.9%) |
| Total | 1,025 (28.7%) | 1,160 (28.2%) |
Income Above Poverty by Sex and Age in Fort Stockton
According to the poverty statistics in Fort Stockton, males aged 18 to 24 years and females aged 16 and 17 years are the age groups that are most secure financially, with 100.0% of males and 100.0% of females in these age groups living above the poverty line.
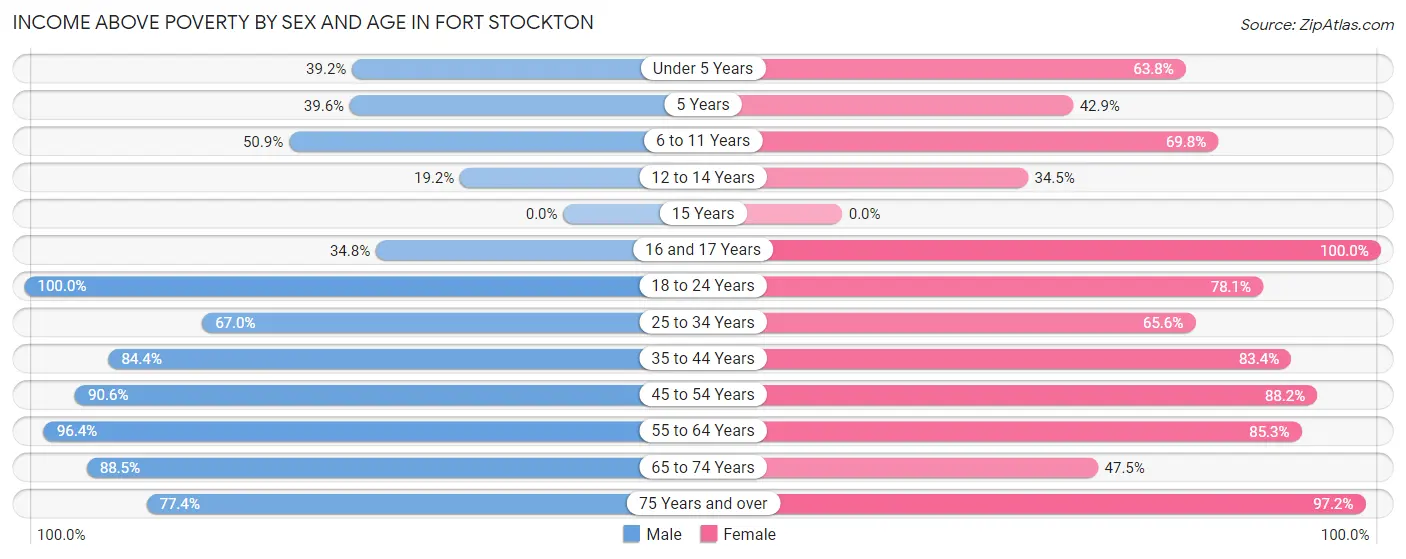
| Age Bracket | Male | Female |
| Under 5 Years | 118 (39.2%) | 164 (63.8%) |
| 5 Years | 42 (39.6%) | 24 (42.9%) |
| 6 to 11 Years | 192 (50.9%) | 229 (69.8%) |
| 12 to 14 Years | 32 (19.2%) | 91 (34.5%) |
| 15 Years | 0 (0.0%) | 0 (0.0%) |
| 16 and 17 Years | 32 (34.8%) | 99 (100.0%) |
| 18 to 24 Years | 233 (100.0%) | 318 (78.1%) |
| 25 to 34 Years | 372 (67.0%) | 398 (65.6%) |
| 35 to 44 Years | 493 (84.4%) | 396 (83.4%) |
| 45 to 54 Years | 338 (90.6%) | 471 (88.2%) |
| 55 to 64 Years | 349 (96.4%) | 365 (85.3%) |
| 65 to 74 Years | 222 (88.4%) | 132 (47.5%) |
| 75 Years and over | 123 (77.4%) | 273 (97.2%) |
| Total | 2,546 (71.3%) | 2,960 (71.8%) |
Income Below Poverty Among Married-Couple Families in Fort Stockton
The poverty statistics for married-couple families in Fort Stockton show that 14.1% or 167 of the total 1,185 families live below the poverty line. Families with 5 or more children have the highest poverty rate of 100.0%, comprising of 52 families. On the other hand, families with no children have the lowest poverty rate of 4.6%, which includes 27 families.
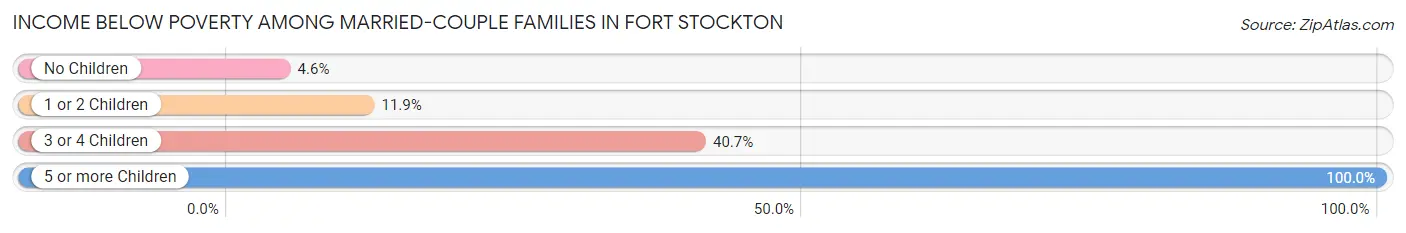
| Children | Above Poverty | Below Poverty |
| No Children | 562 (95.4%) | 27 (4.6%) |
| 1 or 2 Children | 408 (88.1%) | 55 (11.9%) |
| 3 or 4 Children | 48 (59.3%) | 33 (40.7%) |
| 5 or more Children | 0 (0.0%) | 52 (100.0%) |
| Total | 1,018 (85.9%) | 167 (14.1%) |
Income Below Poverty Among Single-Parent Households in Fort Stockton
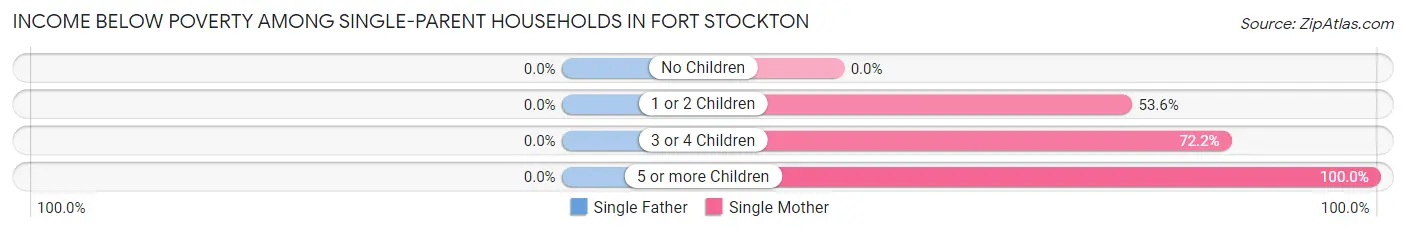
| Children | Single Father | Single Mother |
| No Children | 0 (0.0%) | 0 (0.0%) |
| 1 or 2 Children | 0 (0.0%) | 185 (53.6%) |
| 3 or 4 Children | 0 (0.0%) | 39 (72.2%) |
| 5 or more Children | 0 (0.0%) | 30 (100.0%) |
| Total | 0 (0.0%) | 254 (32.6%) |
Income Below Poverty Among Married-Couple vs Single-Parent Households in Fort Stockton
The poverty data for Fort Stockton shows that 167 of the married-couple family households (14.1%) and 254 of the single-parent households (27.4%) are living below the poverty level. Within the married-couple family households, those with 5 or more children have the highest poverty rate, with 52 households (100.0%) falling below the poverty line. Among the single-parent households, those with 5 or more children have the highest poverty rate, with 30 household (100.0%) living below poverty.
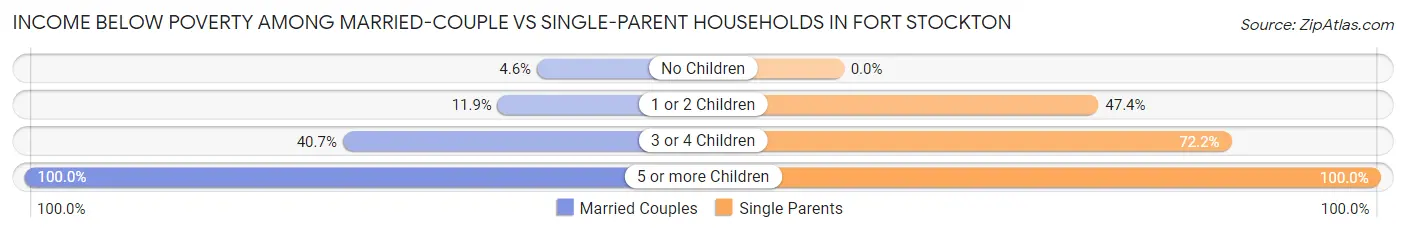
| Children | Married-Couple Families | Single-Parent Households |
| No Children | 27 (4.6%) | 0 (0.0%) |
| 1 or 2 Children | 55 (11.9%) | 185 (47.4%) |
| 3 or 4 Children | 33 (40.7%) | 39 (72.2%) |
| 5 or more Children | 52 (100.0%) | 30 (100.0%) |
| Total | 167 (14.1%) | 254 (27.4%) |
Race in Fort Stockton
The most populous races in Fort Stockton are Hispanic or Latino (6,498 | 77.3%), White / Caucasian (5,544 | 66.0%), and Two or more Races (1,486 | 17.7%).
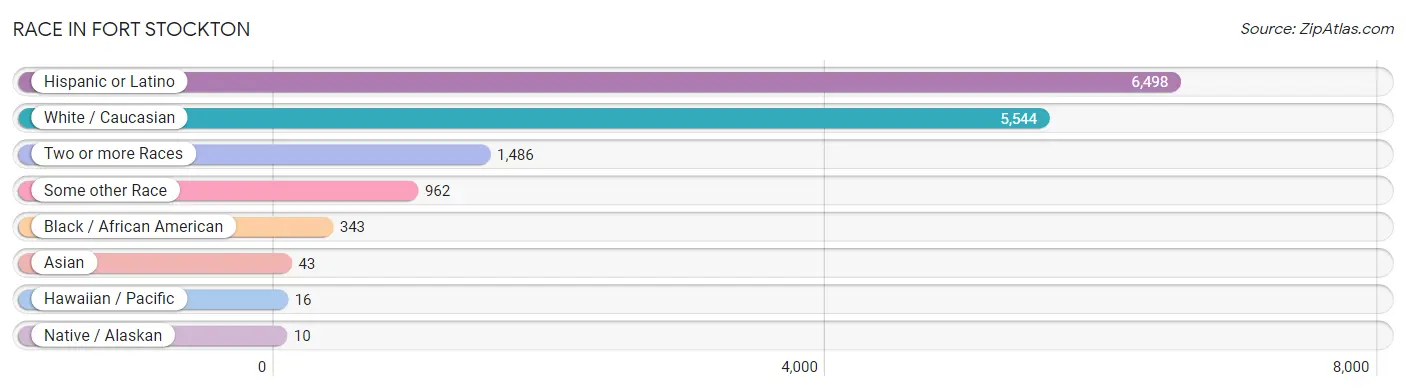
| Race | # Population | % Population |
| Asian | 43 | 0.5% |
| Black / African American | 343 | 4.1% |
| Hawaiian / Pacific | 16 | 0.2% |
| Hispanic or Latino | 6,498 | 77.3% |
| Native / Alaskan | 10 | 0.1% |
| White / Caucasian | 5,544 | 66.0% |
| Two or more Races | 1,486 | 17.7% |
| Some other Race | 962 | 11.5% |
| Total | 8,404 | 100.0% |
Ancestry in Fort Stockton
The most populous ancestries reported in Fort Stockton are Mexican (5,997 | 71.4%), Irish (242 | 2.9%), English (197 | 2.3%), German (177 | 2.1%), and American (124 | 1.5%), together accounting for 80.2% of all Fort Stockton residents.
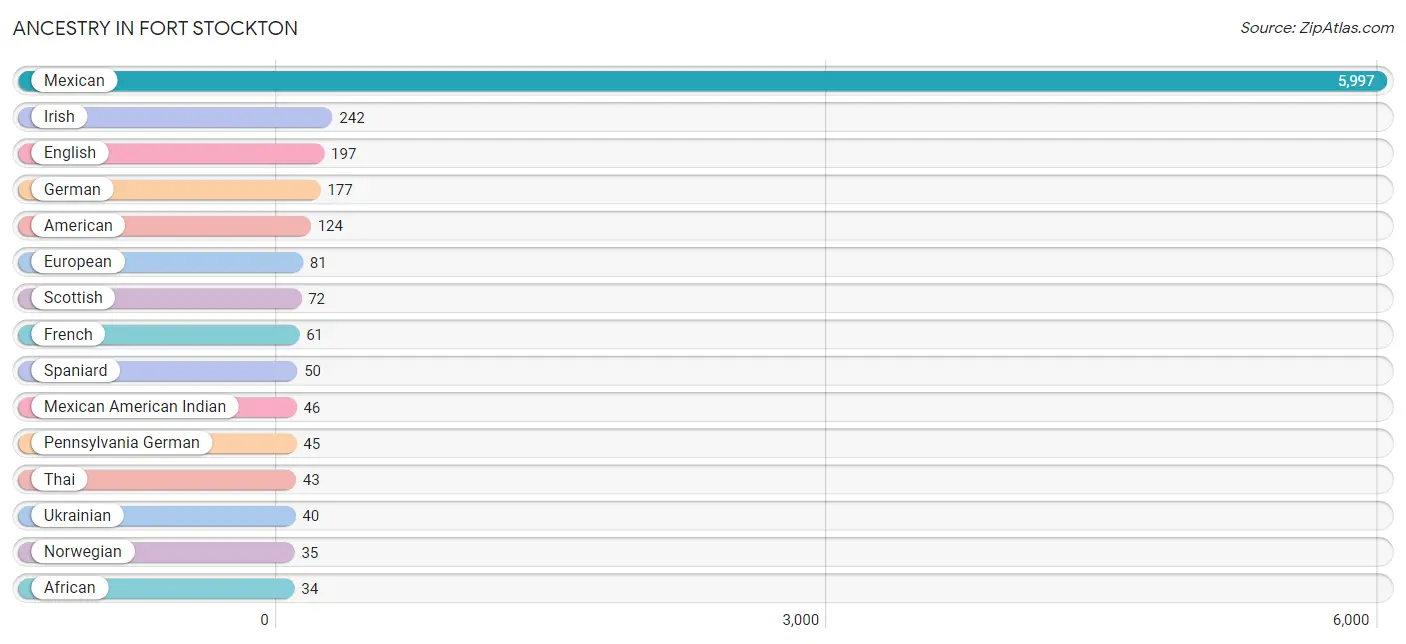
| Ancestry | # Population | % Population |
| African | 34 | 0.4% |
| American | 124 | 1.5% |
| Apache | 22 | 0.3% |
| Central American | 7 | 0.1% |
| Chippewa | 14 | 0.2% |
| Choctaw | 8 | 0.1% |
| Czech | 6 | 0.1% |
| Dutch | 24 | 0.3% |
| Dutch West Indian | 20 | 0.2% |
| English | 197 | 2.3% |
| European | 81 | 1.0% |
| French | 61 | 0.7% |
| German | 177 | 2.1% |
| Guamanian / Chamorro | 8 | 0.1% |
| Guyanese | 8 | 0.1% |
| Icelander | 7 | 0.1% |
| Irish | 242 | 2.9% |
| Italian | 23 | 0.3% |
| Mexican | 5,997 | 71.4% |
| Mexican American Indian | 46 | 0.5% |
| Native Hawaiian | 8 | 0.1% |
| Nicaraguan | 7 | 0.1% |
| Norwegian | 35 | 0.4% |
| Pennsylvania German | 45 | 0.5% |
| Polish | 15 | 0.2% |
| Scandinavian | 17 | 0.2% |
| Scotch-Irish | 29 | 0.4% |
| Scottish | 72 | 0.9% |
| Spaniard | 50 | 0.6% |
| Spanish | 7 | 0.1% |
| Subsaharan African | 34 | 0.4% |
| Thai | 43 | 0.5% |
| Ukrainian | 40 | 0.5% | View All 33 Rows |
Immigrants in Fort Stockton
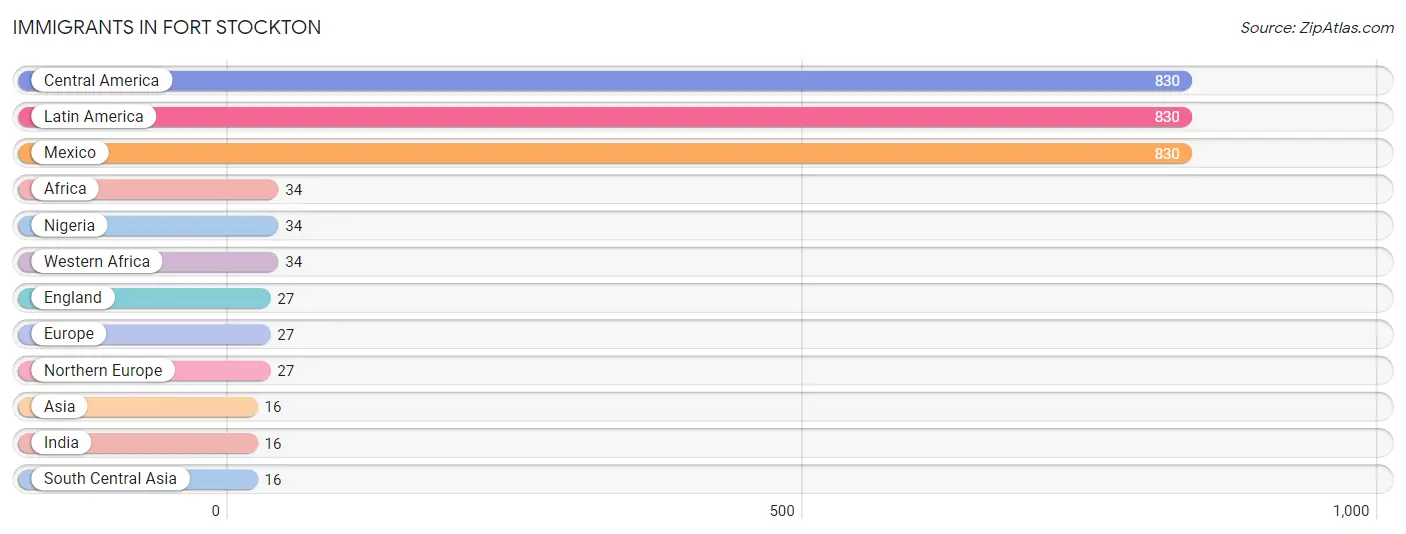
The most numerous immigrant groups reported in Fort Stockton came from Central America (830 | 9.9%), Latin America (830 | 9.9%), Mexico (830 | 9.9%), Africa (34 | 0.4%), and Nigeria (34 | 0.4%), together accounting for 30.4% of all Fort Stockton residents.
| Immigration Origin | # Population | % Population |
| Africa | 34 | 0.4% |
| Asia | 16 | 0.2% |
| Central America | 830 | 9.9% |
| England | 27 | 0.3% |
| Europe | 27 | 0.3% |
| India | 16 | 0.2% |
| Latin America | 830 | 9.9% |
| Mexico | 830 | 9.9% |
| Nigeria | 34 | 0.4% |
| Northern Europe | 27 | 0.3% |
| South Central Asia | 16 | 0.2% |
| Western Africa | 34 | 0.4% | View All 12 Rows |
Sex and Age in Fort Stockton
Sex and Age in Fort Stockton
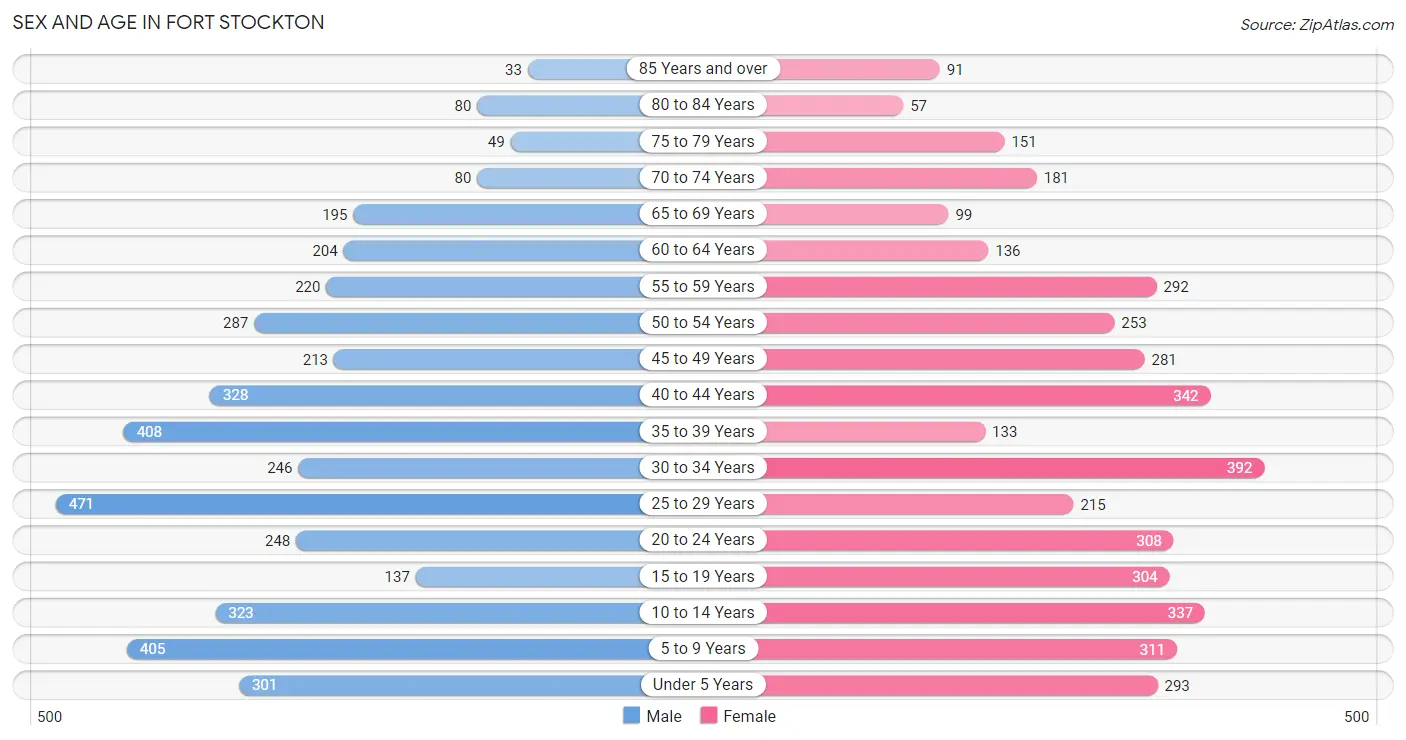
The most populous age groups in Fort Stockton are 25 to 29 Years (471 | 11.1%) for men and 30 to 34 Years (392 | 9.4%) for women.
| Age Bracket | Male | Female |
| Under 5 Years | 301 (7.1%) | 293 (7.0%) |
| 5 to 9 Years | 405 (9.6%) | 311 (7.4%) |
| 10 to 14 Years | 323 (7.6%) | 337 (8.1%) |
| 15 to 19 Years | 137 (3.2%) | 304 (7.3%) |
| 20 to 24 Years | 248 (5.9%) | 308 (7.4%) |
| 25 to 29 Years | 471 (11.1%) | 215 (5.1%) |
| 30 to 34 Years | 246 (5.8%) | 392 (9.4%) |
| 35 to 39 Years | 408 (9.7%) | 133 (3.2%) |
| 40 to 44 Years | 328 (7.8%) | 342 (8.2%) |
| 45 to 49 Years | 213 (5.0%) | 281 (6.7%) |
| 50 to 54 Years | 287 (6.8%) | 253 (6.1%) |
| 55 to 59 Years | 220 (5.2%) | 292 (7.0%) |
| 60 to 64 Years | 204 (4.8%) | 136 (3.3%) |
| 65 to 69 Years | 195 (4.6%) | 99 (2.4%) |
| 70 to 74 Years | 80 (1.9%) | 181 (4.3%) |
| 75 to 79 Years | 49 (1.2%) | 151 (3.6%) |
| 80 to 84 Years | 80 (1.9%) | 57 (1.4%) |
| 85 Years and over | 33 (0.8%) | 91 (2.2%) |
| Total | 4,228 (100.0%) | 4,176 (100.0%) |
Families and Households in Fort Stockton
Median Family Size in Fort Stockton
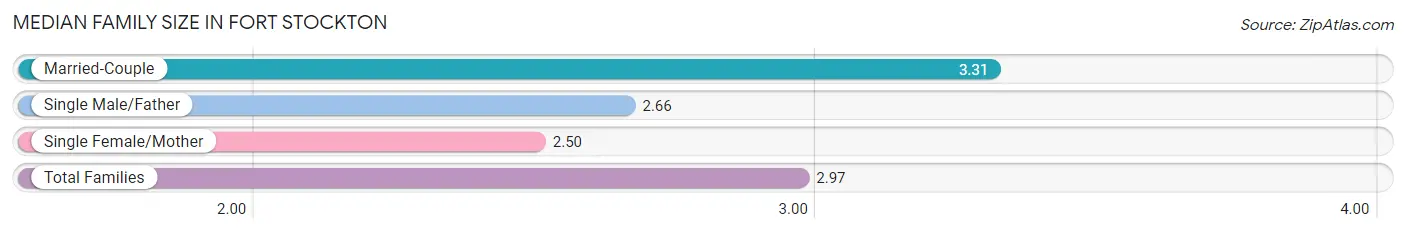
The median family size in Fort Stockton is 2.97 persons per family, with married-couple families (1,185 | 56.1%) accounting for the largest median family size of 3.31 persons per family. On the other hand, single female/mother families (779 | 36.9%) represent the smallest median family size with 2.50 persons per family.
| Family Type | # Families | Family Size |
| Married-Couple | 1,185 (56.1%) | 3.31 |
| Single Male/Father | 147 (7.0%) | 2.66 |
| Single Female/Mother | 779 (36.9%) | 2.50 |
| Total Families | 2,111 (100.0%) | 2.97 |
Median Household Size in Fort Stockton
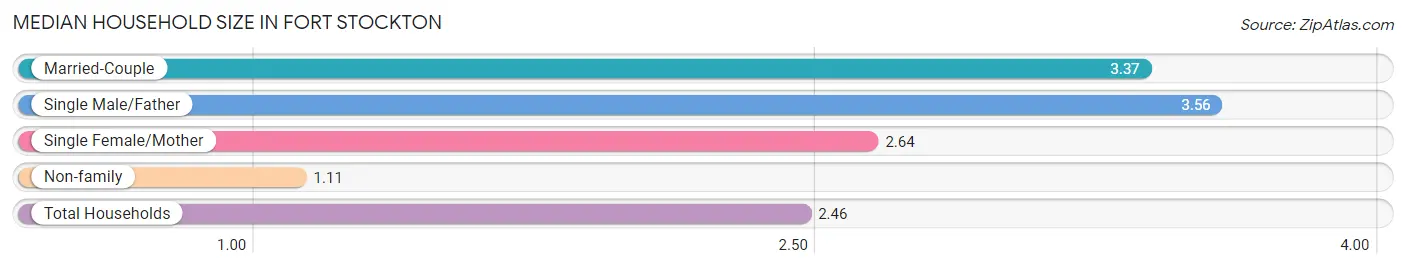
The median household size in Fort Stockton is 2.46 persons per household, with single male/father households (147 | 4.7%) accounting for the largest median household size of 3.56 persons per household. non-family households (1,036 | 32.9%) represent the smallest median household size with 1.11 persons per household.
| Household Type | # Households | Household Size |
| Married-Couple | 1,185 (37.7%) | 3.37 |
| Single Male/Father | 147 (4.7%) | 3.56 |
| Single Female/Mother | 779 (24.7%) | 2.64 |
| Non-family | 1,036 (32.9%) | 1.11 |
| Total Households | 3,147 (100.0%) | 2.46 |
Household Size by Marriage Status in Fort Stockton
Out of a total of 3,147 households in Fort Stockton, 2,111 (67.1%) are family households, while 1,036 (32.9%) are nonfamily households. The most numerous type of family households are 2-person households, comprising 1,156, and the most common type of nonfamily households are 1-person households, comprising 798.
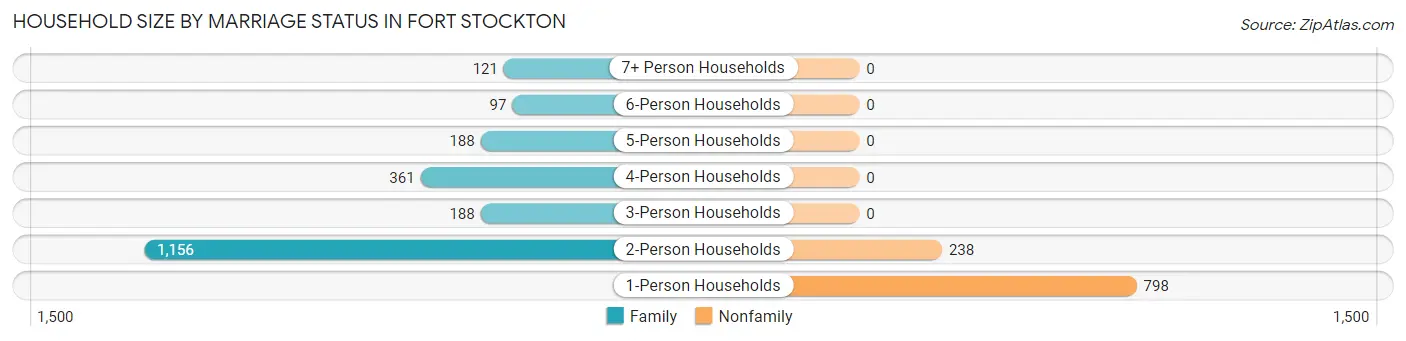
| Household Size | Family Households | Nonfamily Households |
| 1-Person Households | - | 798 (25.4%) |
| 2-Person Households | 1,156 (36.7%) | 238 (7.6%) |
| 3-Person Households | 188 (6.0%) | 0 (0.0%) |
| 4-Person Households | 361 (11.5%) | 0 (0.0%) |
| 5-Person Households | 188 (6.0%) | 0 (0.0%) |
| 6-Person Households | 97 (3.1%) | 0 (0.0%) |
| 7+ Person Households | 121 (3.8%) | 0 (0.0%) |
| Total | 2,111 (67.1%) | 1,036 (32.9%) |
Female Fertility in Fort Stockton
Fertility by Age in Fort Stockton
Average fertility rate in Fort Stockton is 34.0 births per 1,000 women. Women in the age bracket of 20 to 34 years have the highest fertility rate with 74.0 births per 1,000 women. Women in the age bracket of 20 to 34 years acount for 100.0% of all women with births.
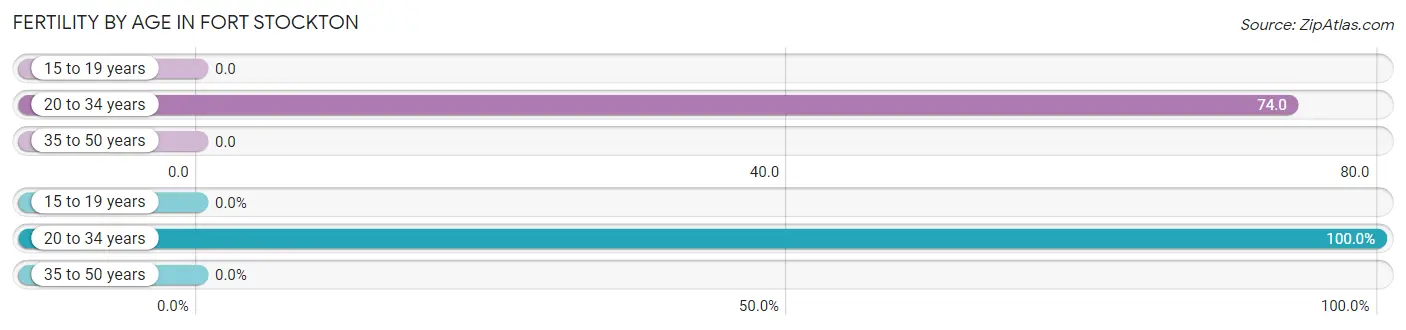
| Age Bracket | Women with Births | Births / 1,000 Women |
| 15 to 19 years | 0 (0.0%) | 0.0 |
| 20 to 34 years | 68 (100.0%) | 74.0 |
| 35 to 50 years | 0 (0.0%) | 0.0 |
| Total | 68 (100.0%) | 34.0 |
Fertility by Age by Marriage Status in Fort Stockton
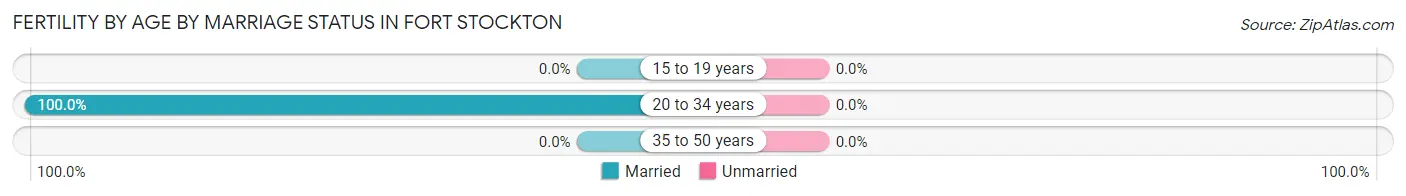
| Age Bracket | Married | Unmarried |
| 15 to 19 years | 0 (0.0%) | 0 (0.0%) |
| 20 to 34 years | 68 (100.0%) | 0 (0.0%) |
| 35 to 50 years | 0 (0.0%) | 0 (0.0%) |
| Total | 68 (100.0%) | 0 (0.0%) |
Fertility by Education in Fort Stockton
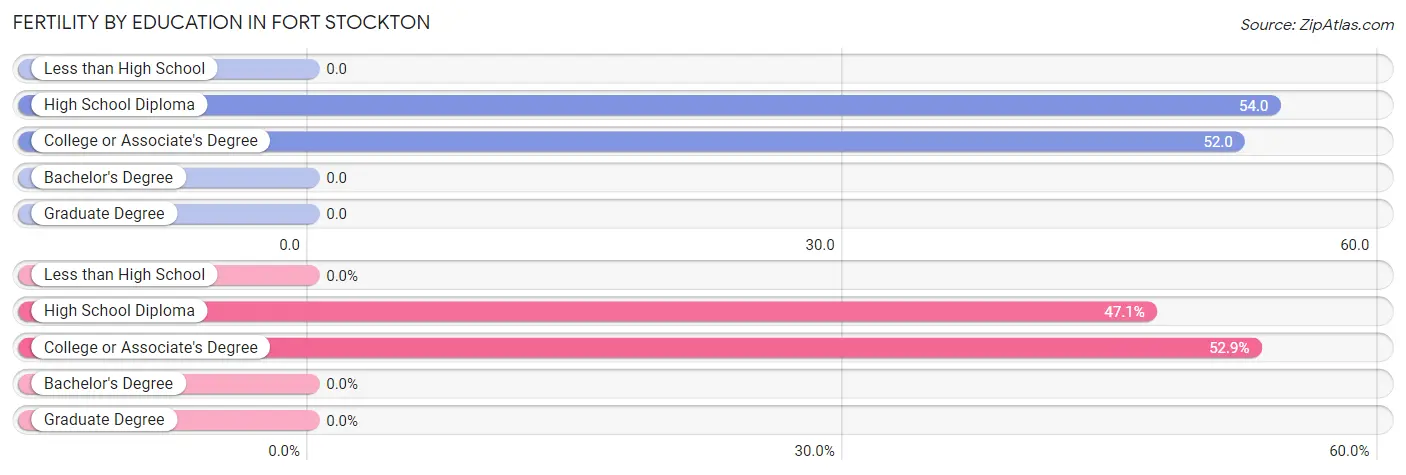
| Educational Attainment | Women with Births | Births / 1,000 Women |
| Less than High School | 0 (0.0%) | 0.0 |
| High School Diploma | 32 (47.1%) | 54.0 |
| College or Associate's Degree | 36 (52.9%) | 52.0 |
| Bachelor's Degree | 0 (0.0%) | 0.0 |
| Graduate Degree | 0 (0.0%) | 0.0 |
| Total | 68 (100.0%) | 34.0 |
Fertility by Education by Marriage Status in Fort Stockton
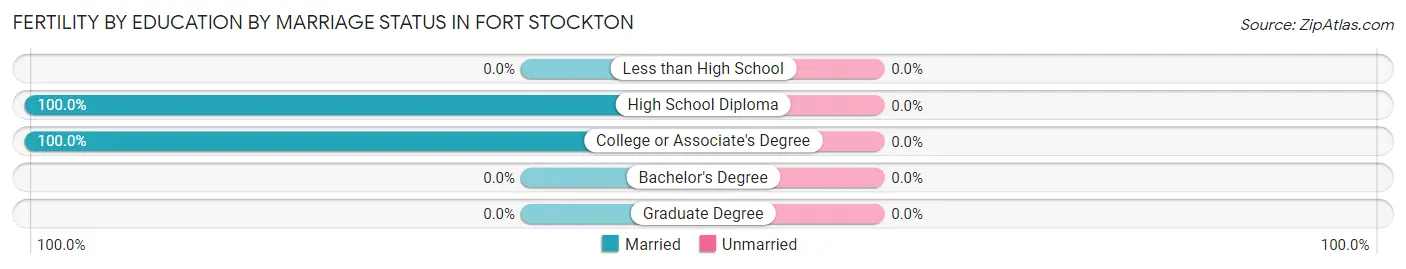
| Educational Attainment | Married | Unmarried |
| Less than High School | 0 (0.0%) | 0 (0.0%) |
| High School Diploma | 32 (100.0%) | 0 (0.0%) |
| College or Associate's Degree | 36 (100.0%) | 0 (0.0%) |
| Bachelor's Degree | 0 (0.0%) | 0 (0.0%) |
| Graduate Degree | 0 (0.0%) | 0 (0.0%) |
| Total | 68 (100.0%) | 0 (0.0%) |
Employment Characteristics in Fort Stockton
Employment by Class of Employer in Fort Stockton
Among the 3,816 employed individuals in Fort Stockton, private company employees (2,393 | 62.7%), local government employees (496 | 13.0%), and self-employed (not incorporated) (356 | 9.3%) make up the most common classes of employment.
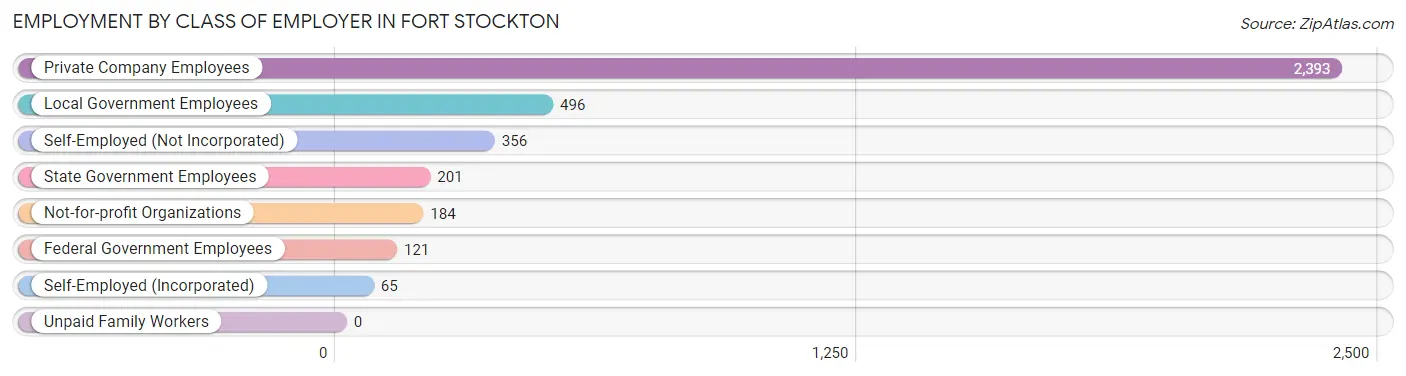
| Employer Class | # Employees | % Employees |
| Private Company Employees | 2,393 | 62.7% |
| Self-Employed (Incorporated) | 65 | 1.7% |
| Self-Employed (Not Incorporated) | 356 | 9.3% |
| Not-for-profit Organizations | 184 | 4.8% |
| Local Government Employees | 496 | 13.0% |
| State Government Employees | 201 | 5.3% |
| Federal Government Employees | 121 | 3.2% |
| Unpaid Family Workers | 0 | 0.0% |
| Total | 3,816 | 100.0% |
Employment Status by Age in Fort Stockton
According to the labor force statistics for Fort Stockton, out of the total population over 16 years of age (6,317), 62.5% or 3,948 individuals are in the labor force, with 1.2% or 47 of them unemployed. The age group with the highest labor force participation rate is 35 to 44 years, with 84.6% or 1,025 individuals in the labor force. Within the labor force, the 25 to 29 years age range has the highest percentage of unemployed individuals, with 9.4% or 35 of them being unemployed.
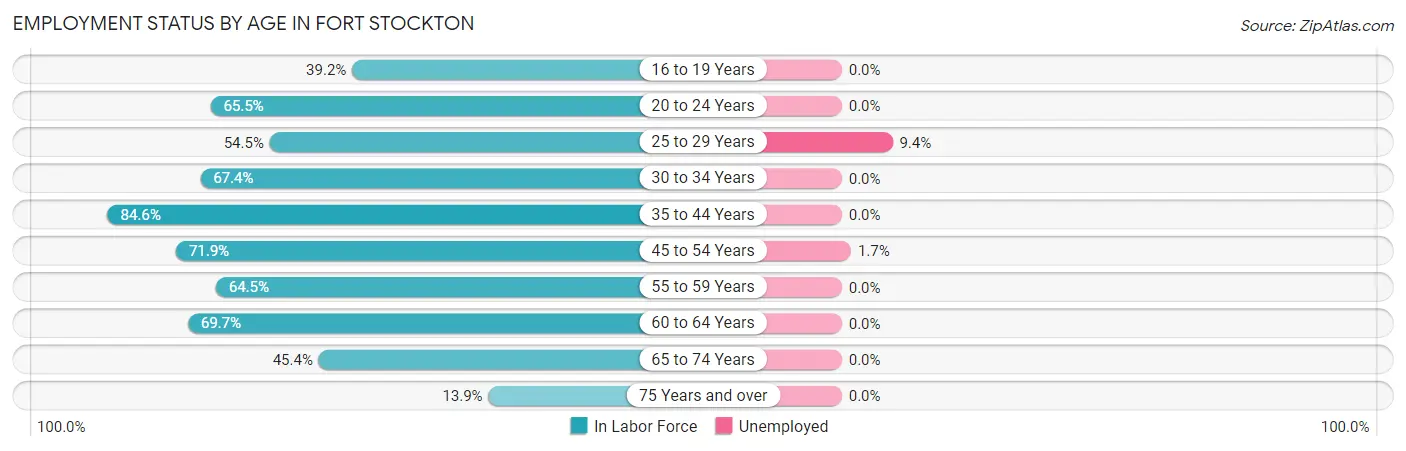
| Age Bracket | In Labor Force | Unemployed |
| 16 to 19 Years | 127 (39.2%) | 0 (0.0%) |
| 20 to 24 Years | 364 (65.5%) | 0 (0.0%) |
| 25 to 29 Years | 374 (54.5%) | 35 (9.4%) |
| 30 to 34 Years | 430 (67.4%) | 0 (0.0%) |
| 35 to 44 Years | 1,025 (84.6%) | 0 (0.0%) |
| 45 to 54 Years | 743 (71.9%) | 13 (1.7%) |
| 55 to 59 Years | 330 (64.5%) | 0 (0.0%) |
| 60 to 64 Years | 237 (69.7%) | 0 (0.0%) |
| 65 to 74 Years | 252 (45.4%) | 0 (0.0%) |
| 75 Years and over | 64 (13.9%) | 0 (0.0%) |
| Total | 3,948 (62.5%) | 47 (1.2%) |
Employment Status by Educational Attainment in Fort Stockton
According to labor force statistics for Fort Stockton, 71.0% of individuals (3,139) out of the total population between 25 and 64 years of age (4,421) are in the labor force, with 1.5% or 47 of them being unemployed. The group with the highest labor force participation rate are those with the educational attainment of bachelor's degree or higher, with 89.6% or 463 individuals in the labor force. Within the labor force, individuals with bachelor's degree or higher education have the highest percentage of unemployment, with 2.8% or 13 of them being unemployed.
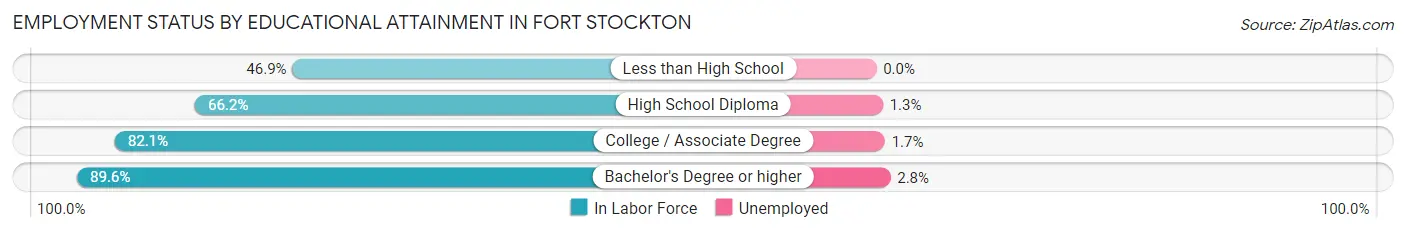
| Educational Attainment | In Labor Force | Unemployed |
| Less than High School | 358 (46.9%) | 0 (0.0%) |
| High School Diploma | 1,084 (66.2%) | 21 (1.3%) |
| College / Associate Degree | 1,235 (82.1%) | 26 (1.7%) |
| Bachelor's Degree or higher | 463 (89.6%) | 14 (2.8%) |
| Total | 3,139 (71.0%) | 66 (1.5%) |
Employment Occupations by Sex in Fort Stockton
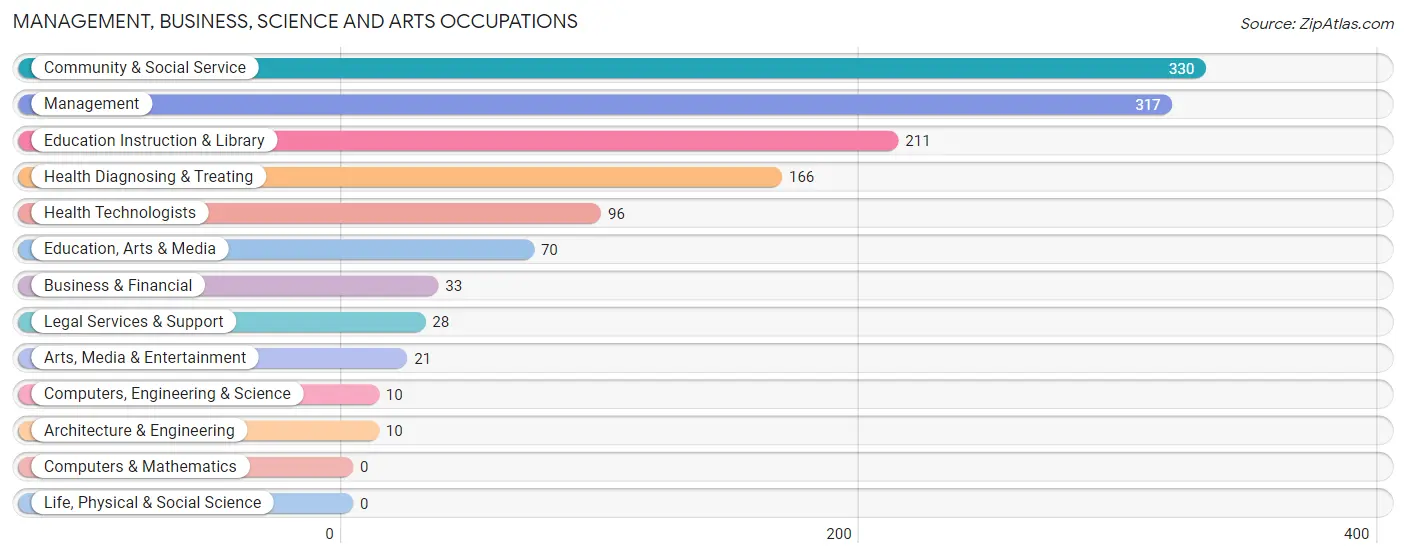
Management, Business, Science and Arts Occupations
The most common Management, Business, Science and Arts occupations in Fort Stockton are Community & Social Service (330 | 8.5%), Management (317 | 8.2%), Education Instruction & Library (211 | 5.4%), Health Diagnosing & Treating (166 | 4.3%), and Health Technologists (96 | 2.5%).
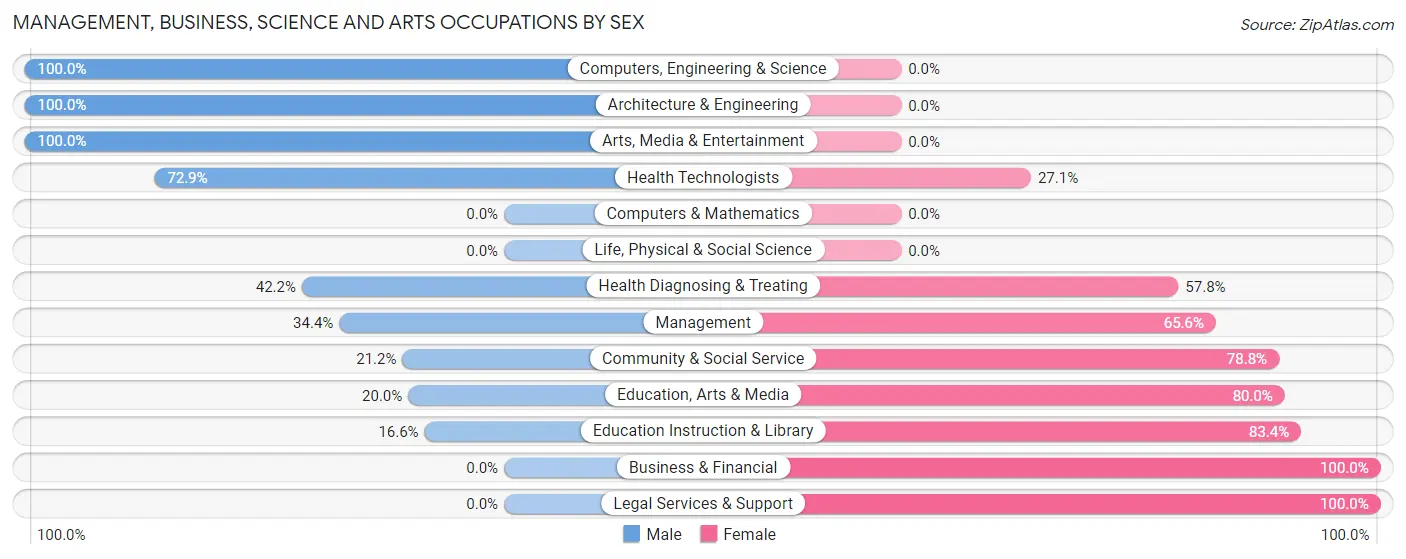
Management, Business, Science and Arts Occupations by Sex
Within the Management, Business, Science and Arts occupations in Fort Stockton, the most male-oriented occupations are Computers, Engineering & Science (100.0%), Architecture & Engineering (100.0%), and Arts, Media & Entertainment (100.0%), while the most female-oriented occupations are Business & Financial (100.0%), Legal Services & Support (100.0%), and Education Instruction & Library (83.4%).
| Occupation | Male | Female |
| Management | 109 (34.4%) | 208 (65.6%) |
| Business & Financial | 0 (0.0%) | 33 (100.0%) |
| Computers, Engineering & Science | 10 (100.0%) | 0 (0.0%) |
| Computers & Mathematics | 0 (0.0%) | 0 (0.0%) |
| Architecture & Engineering | 10 (100.0%) | 0 (0.0%) |
| Life, Physical & Social Science | 0 (0.0%) | 0 (0.0%) |
| Community & Social Service | 70 (21.2%) | 260 (78.8%) |
| Education, Arts & Media | 14 (20.0%) | 56 (80.0%) |
| Legal Services & Support | 0 (0.0%) | 28 (100.0%) |
| Education Instruction & Library | 35 (16.6%) | 176 (83.4%) |
| Arts, Media & Entertainment | 21 (100.0%) | 0 (0.0%) |
| Health Diagnosing & Treating | 70 (42.2%) | 96 (57.8%) |
| Health Technologists | 70 (72.9%) | 26 (27.1%) |
| Total (Category) | 259 (30.3%) | 597 (69.7%) |
| Total (Overall) | 1,906 (49.1%) | 1,975 (50.9%) |
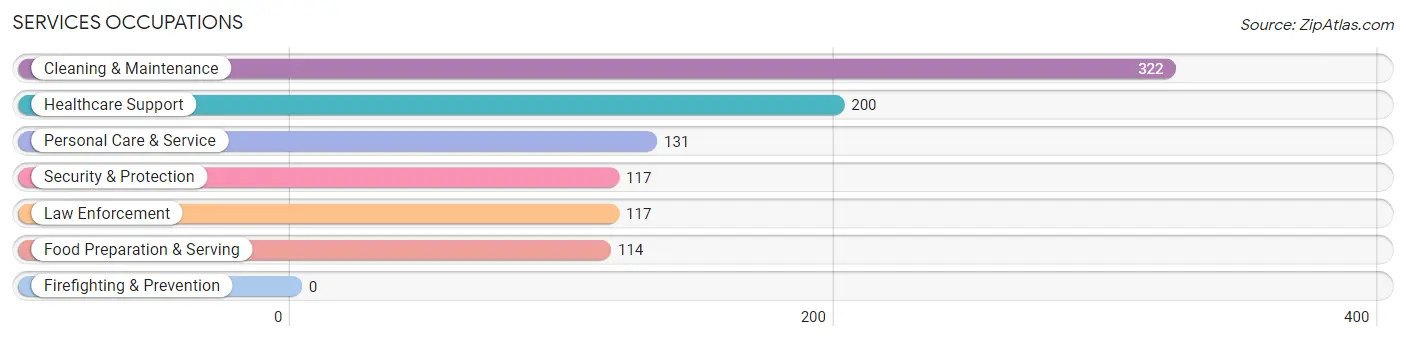
Services Occupations
The most common Services occupations in Fort Stockton are Cleaning & Maintenance (322 | 8.3%), Healthcare Support (200 | 5.1%), Personal Care & Service (131 | 3.4%), Security & Protection (117 | 3.0%), and Law Enforcement (117 | 3.0%).
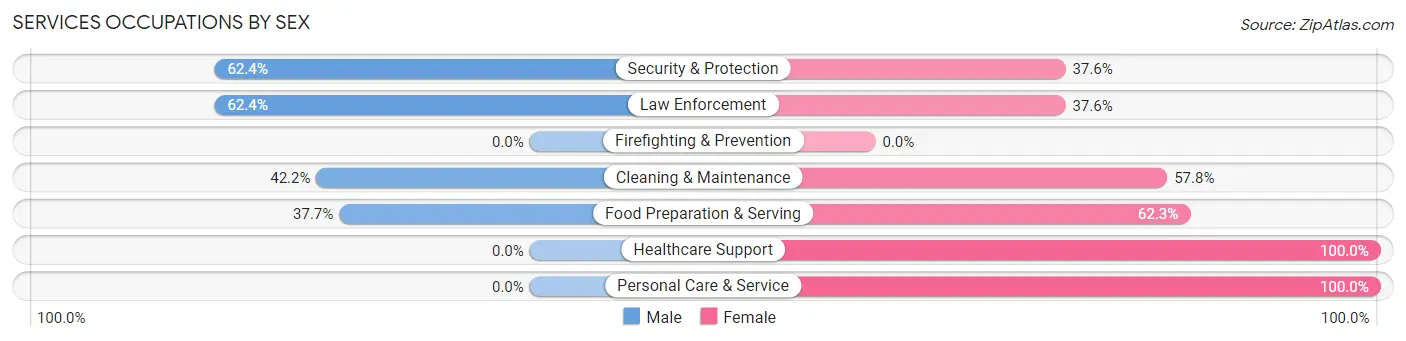
Services Occupations by Sex
Within the Services occupations in Fort Stockton, the most male-oriented occupations are Security & Protection (62.4%), Law Enforcement (62.4%), and Cleaning & Maintenance (42.2%), while the most female-oriented occupations are Healthcare Support (100.0%), Personal Care & Service (100.0%), and Food Preparation & Serving (62.3%).
| Occupation | Male | Female |
| Healthcare Support | 0 (0.0%) | 200 (100.0%) |
| Security & Protection | 73 (62.4%) | 44 (37.6%) |
| Firefighting & Prevention | 0 (0.0%) | 0 (0.0%) |
| Law Enforcement | 73 (62.4%) | 44 (37.6%) |
| Food Preparation & Serving | 43 (37.7%) | 71 (62.3%) |
| Cleaning & Maintenance | 136 (42.2%) | 186 (57.8%) |
| Personal Care & Service | 0 (0.0%) | 131 (100.0%) |
| Total (Category) | 252 (28.5%) | 632 (71.5%) |
| Total (Overall) | 1,906 (49.1%) | 1,975 (50.9%) |
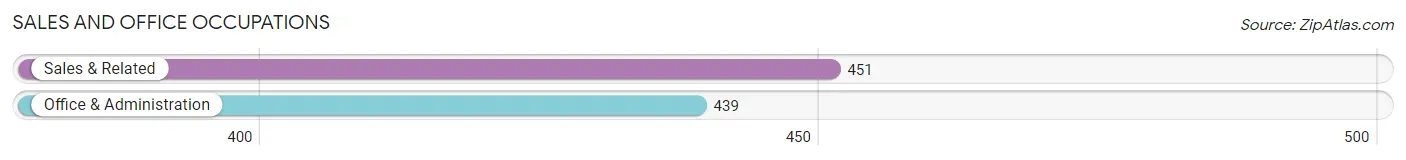
Sales and Office Occupations
The most common Sales and Office occupations in Fort Stockton are Sales & Related (451 | 11.6%), and Office & Administration (439 | 11.3%).
Sales and Office Occupations by Sex
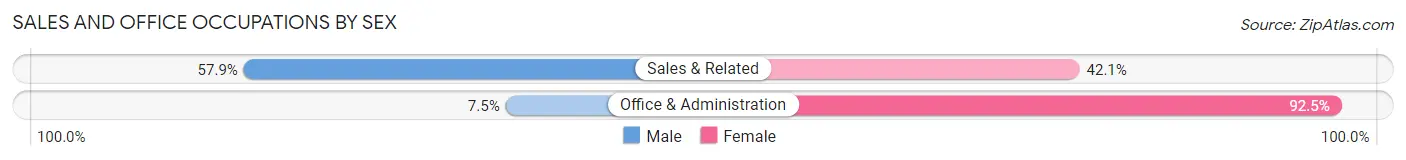
| Occupation | Male | Female |
| Sales & Related | 261 (57.9%) | 190 (42.1%) |
| Office & Administration | 33 (7.5%) | 406 (92.5%) |
| Total (Category) | 294 (33.0%) | 596 (67.0%) |
| Total (Overall) | 1,906 (49.1%) | 1,975 (50.9%) |
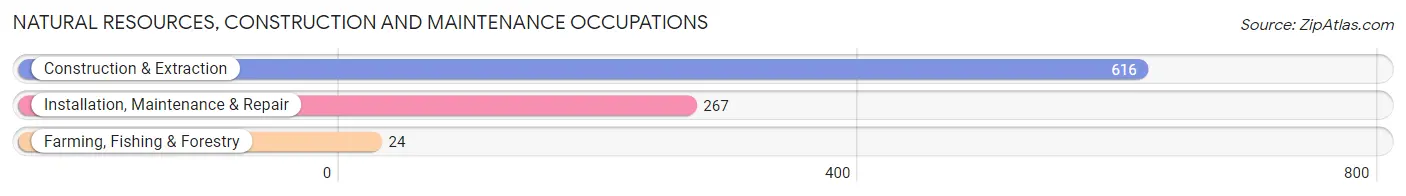
Natural Resources, Construction and Maintenance Occupations
The most common Natural Resources, Construction and Maintenance occupations in Fort Stockton are Construction & Extraction (616 | 15.9%), Installation, Maintenance & Repair (267 | 6.9%), and Farming, Fishing & Forestry (24 | 0.6%).
Natural Resources, Construction and Maintenance Occupations by Sex
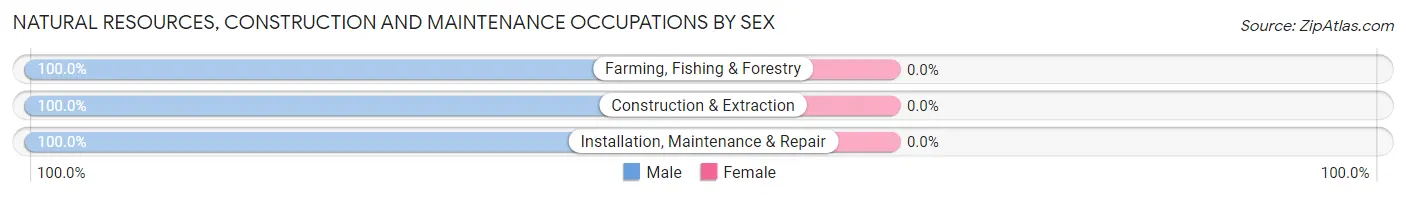
| Occupation | Male | Female |
| Farming, Fishing & Forestry | 24 (100.0%) | 0 (0.0%) |
| Construction & Extraction | 616 (100.0%) | 0 (0.0%) |
| Installation, Maintenance & Repair | 267 (100.0%) | 0 (0.0%) |
| Total (Category) | 907 (100.0%) | 0 (0.0%) |
| Total (Overall) | 1,906 (49.1%) | 1,975 (50.9%) |
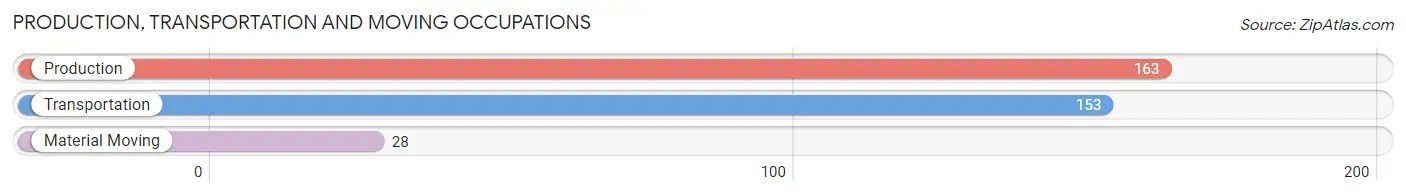
Production, Transportation and Moving Occupations
The most common Production, Transportation and Moving occupations in Fort Stockton are Production (163 | 4.2%), Transportation (153 | 3.9%), and Material Moving (28 | 0.7%).
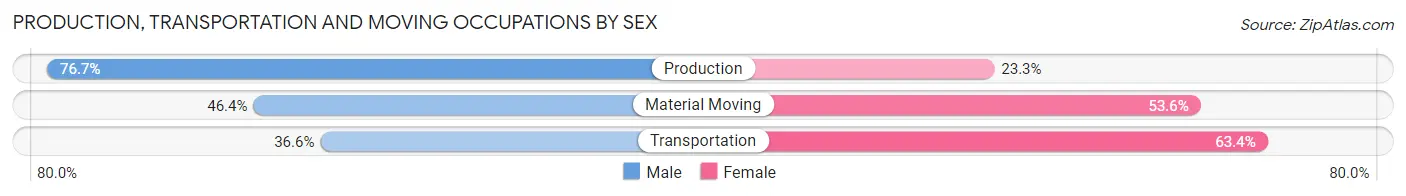
Production, Transportation and Moving Occupations by Sex
| Occupation | Male | Female |
| Production | 125 (76.7%) | 38 (23.3%) |
| Transportation | 56 (36.6%) | 97 (63.4%) |
| Material Moving | 13 (46.4%) | 15 (53.6%) |
| Total (Category) | 194 (56.4%) | 150 (43.6%) |
| Total (Overall) | 1,906 (49.1%) | 1,975 (50.9%) |
Employment Industries by Sex in Fort Stockton
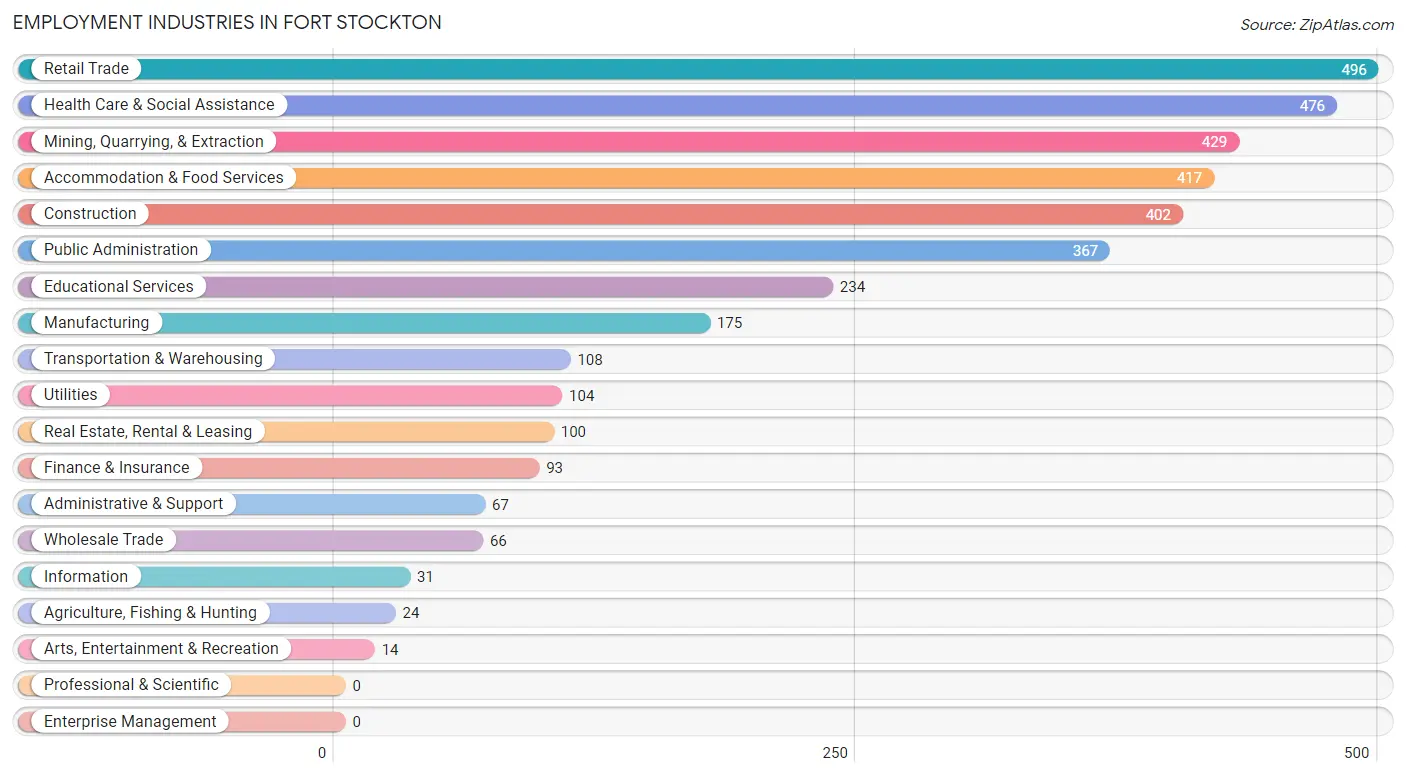
Employment Industries in Fort Stockton
The major employment industries in Fort Stockton include Retail Trade (496 | 12.8%), Health Care & Social Assistance (476 | 12.3%), Mining, Quarrying, & Extraction (429 | 11.1%), Accommodation & Food Services (417 | 10.7%), and Construction (402 | 10.4%).
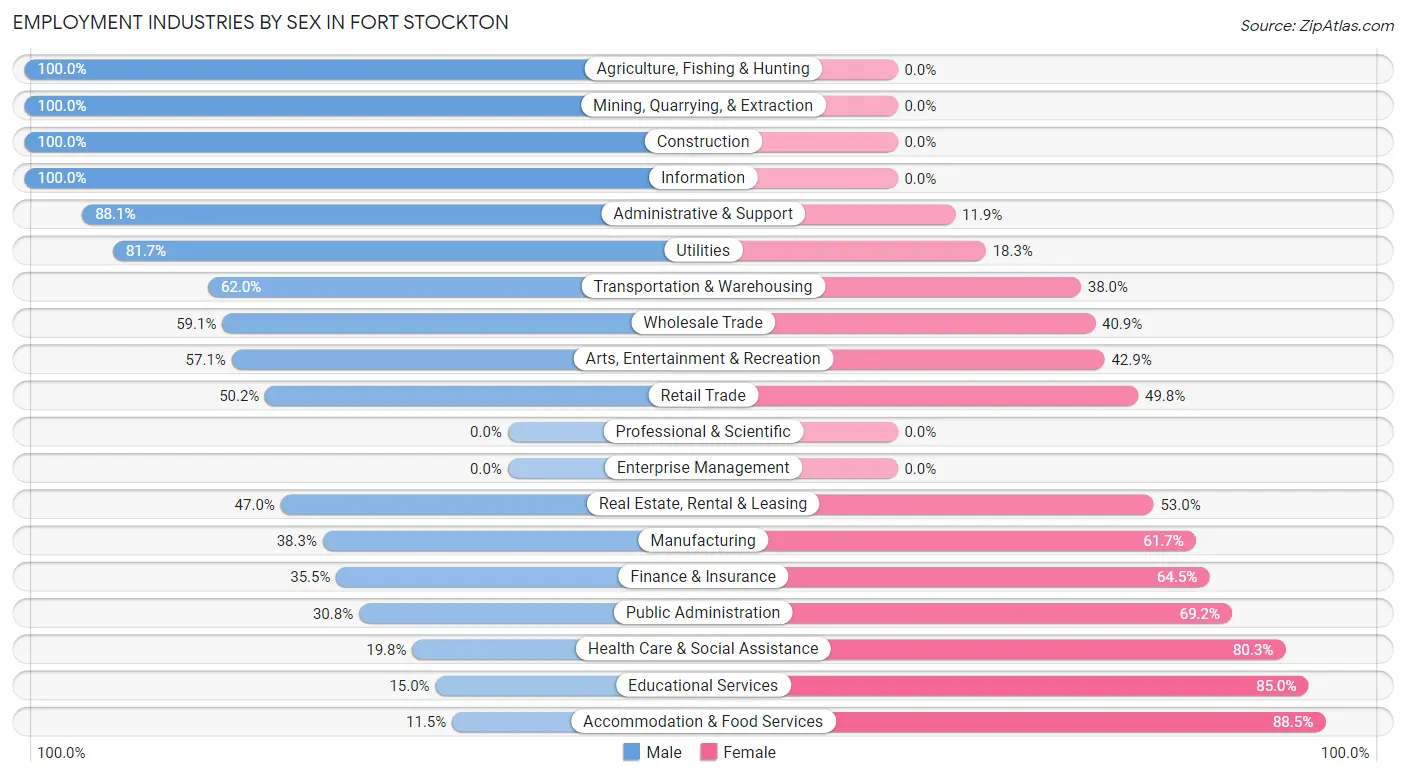
Employment Industries by Sex in Fort Stockton
The Fort Stockton industries that see more men than women are Agriculture, Fishing & Hunting (100.0%), Mining, Quarrying, & Extraction (100.0%), and Construction (100.0%), whereas the industries that tend to have a higher number of women are Accommodation & Food Services (88.5%), Educational Services (85.0%), and Health Care & Social Assistance (80.2%).
| Industry | Male | Female |
| Agriculture, Fishing & Hunting | 24 (100.0%) | 0 (0.0%) |
| Mining, Quarrying, & Extraction | 429 (100.0%) | 0 (0.0%) |
| Construction | 402 (100.0%) | 0 (0.0%) |
| Manufacturing | 67 (38.3%) | 108 (61.7%) |
| Wholesale Trade | 39 (59.1%) | 27 (40.9%) |
| Retail Trade | 249 (50.2%) | 247 (49.8%) |
| Transportation & Warehousing | 67 (62.0%) | 41 (38.0%) |
| Utilities | 85 (81.7%) | 19 (18.3%) |
| Information | 31 (100.0%) | 0 (0.0%) |
| Finance & Insurance | 33 (35.5%) | 60 (64.5%) |
| Real Estate, Rental & Leasing | 47 (47.0%) | 53 (53.0%) |
| Professional & Scientific | 0 (0.0%) | 0 (0.0%) |
| Enterprise Management | 0 (0.0%) | 0 (0.0%) |
| Administrative & Support | 59 (88.1%) | 8 (11.9%) |
| Educational Services | 35 (15.0%) | 199 (85.0%) |
| Health Care & Social Assistance | 94 (19.8%) | 382 (80.2%) |
| Arts, Entertainment & Recreation | 8 (57.1%) | 6 (42.9%) |
| Accommodation & Food Services | 48 (11.5%) | 369 (88.5%) |
| Public Administration | 113 (30.8%) | 254 (69.2%) |
| Total | 1,906 (49.1%) | 1,975 (50.9%) |
Education in Fort Stockton
School Enrollment in Fort Stockton
The most common levels of schooling among the 2,116 students in Fort Stockton are middle school (543 | 25.7%), elementary school (499 | 23.6%), and high school (395 | 18.7%).
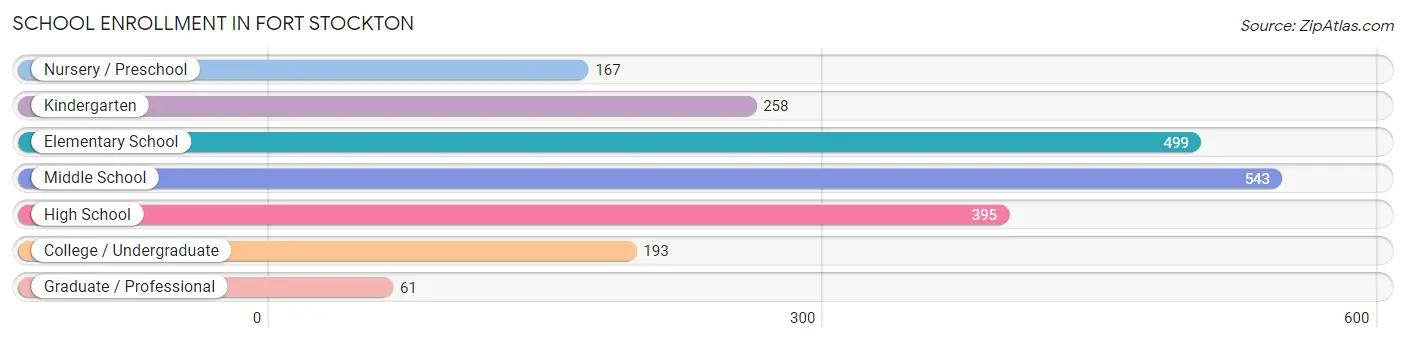
| School Level | # Students | % Students |
| Nursery / Preschool | 167 | 7.9% |
| Kindergarten | 258 | 12.2% |
| Elementary School | 499 | 23.6% |
| Middle School | 543 | 25.7% |
| High School | 395 | 18.7% |
| College / Undergraduate | 193 | 9.1% |
| Graduate / Professional | 61 | 2.9% |
| Total | 2,116 | 100.0% |
School Enrollment by Age by Funding Source in Fort Stockton
Out of a total of 2,116 students who are enrolled in schools in Fort Stockton, 38 (1.8%) attend a private institution, while the remaining 2,078 (98.2%) are enrolled in public schools. The age group of 35 years and over has the highest likelihood of being enrolled in private schools, with 19 (22.6% in the age bracket) enrolled. Conversely, the age group of 3 to 4 year olds has the lowest likelihood of being enrolled in a private school, with 148 (100.0% in the age bracket) attending a public institution.
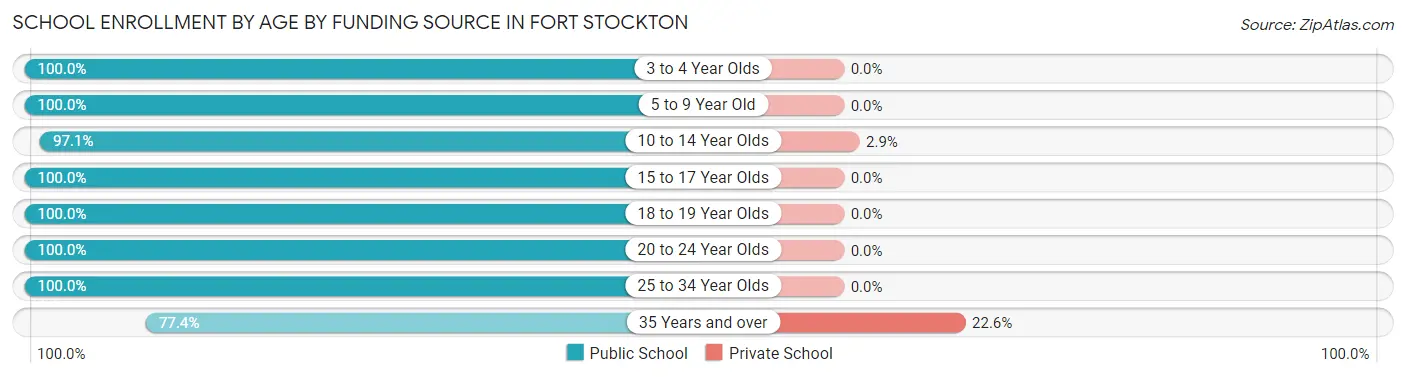
| Age Bracket | Public School | Private School |
| 3 to 4 Year Olds | 148 (100.0%) | 0 (0.0%) |
| 5 to 9 Year Old | 691 (100.0%) | 0 (0.0%) |
| 10 to 14 Year Olds | 641 (97.1%) | 19 (2.9%) |
| 15 to 17 Year Olds | 308 (100.0%) | 0 (0.0%) |
| 18 to 19 Year Olds | 25 (100.0%) | 0 (0.0%) |
| 20 to 24 Year Olds | 165 (100.0%) | 0 (0.0%) |
| 25 to 34 Year Olds | 35 (100.0%) | 0 (0.0%) |
| 35 Years and over | 65 (77.4%) | 19 (22.6%) |
| Total | 2,078 (98.2%) | 38 (1.8%) |
Educational Attainment by Field of Study in Fort Stockton
Education (121 | 17.1%), business (106 | 15.0%), science & technology (75 | 10.6%), arts & humanities (74 | 10.4%), and visual & performing arts (72 | 10.2%) are the most common fields of study among 708 individuals in Fort Stockton who have obtained a bachelor's degree or higher.
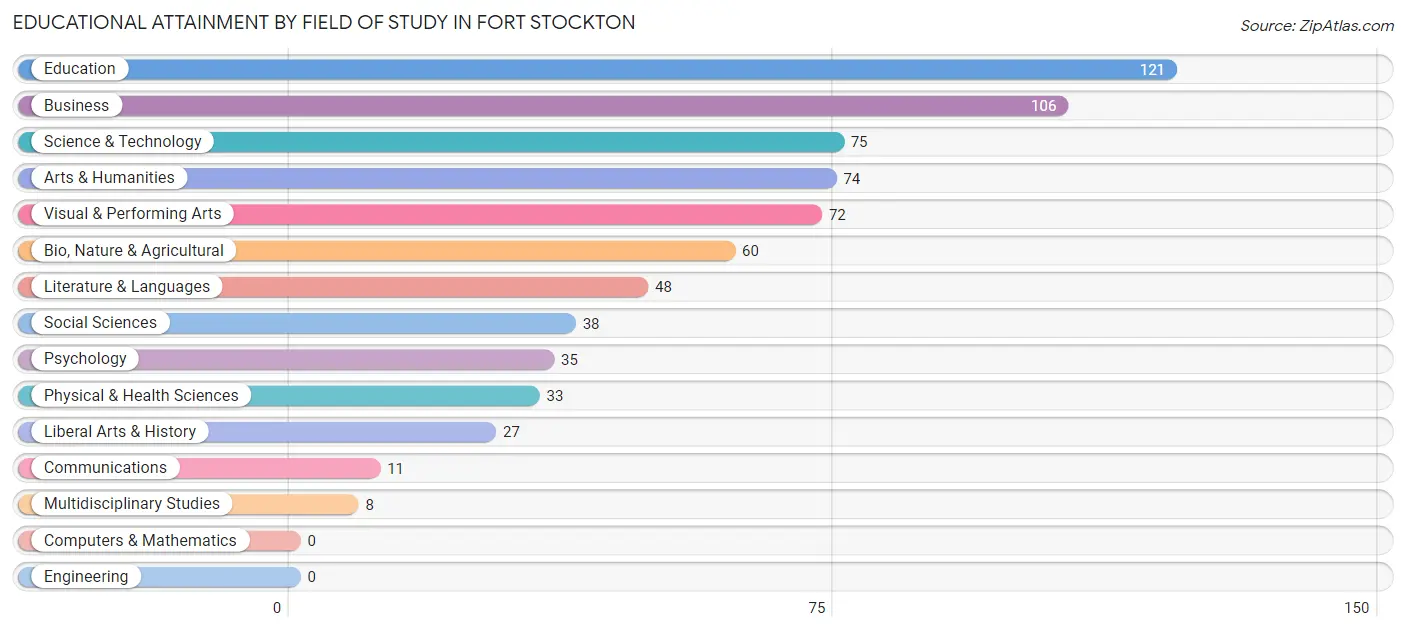
| Field of Study | # Graduates | % Graduates |
| Computers & Mathematics | 0 | 0.0% |
| Bio, Nature & Agricultural | 60 | 8.5% |
| Physical & Health Sciences | 33 | 4.7% |
| Psychology | 35 | 4.9% |
| Social Sciences | 38 | 5.4% |
| Engineering | 0 | 0.0% |
| Multidisciplinary Studies | 8 | 1.1% |
| Science & Technology | 75 | 10.6% |
| Business | 106 | 15.0% |
| Education | 121 | 17.1% |
| Literature & Languages | 48 | 6.8% |
| Liberal Arts & History | 27 | 3.8% |
| Visual & Performing Arts | 72 | 10.2% |
| Communications | 11 | 1.5% |
| Arts & Humanities | 74 | 10.4% |
| Total | 708 | 100.0% |
Transportation & Commute in Fort Stockton
Vehicle Availability by Sex in Fort Stockton
The most prevalent vehicle ownership categories in Fort Stockton are males with 2 vehicles (685, accounting for 36.2%) and females with 2 vehicles (889, making up 36.1%).
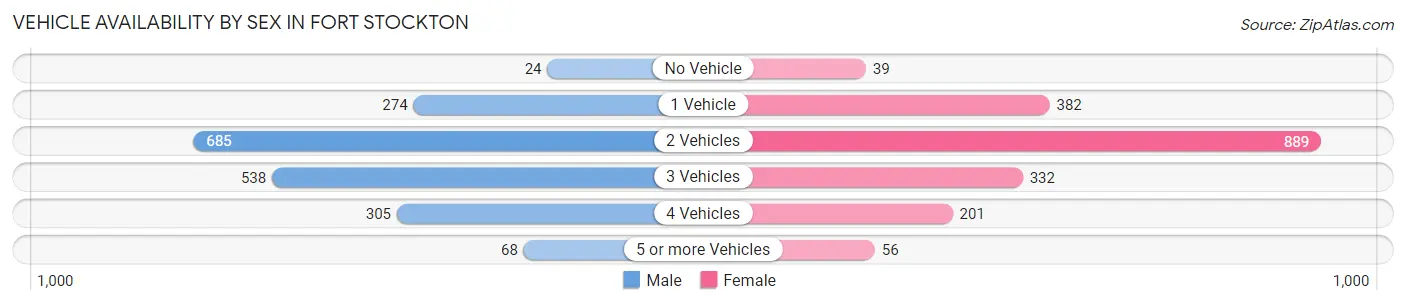
| Vehicles Available | Male | Female |
| No Vehicle | 24 (1.3%) | 39 (2.1%) |
| 1 Vehicle | 274 (14.5%) | 382 (20.1%) |
| 2 Vehicles | 685 (36.2%) | 889 (46.8%) |
| 3 Vehicles | 538 (28.4%) | 332 (17.5%) |
| 4 Vehicles | 305 (16.1%) | 201 (10.6%) |
| 5 or more Vehicles | 68 (3.6%) | 56 (2.9%) |
| Total | 1,894 (100.0%) | 1,899 (100.0%) |
Commute Time in Fort Stockton
The most frequently occuring commute durations in Fort Stockton are 5 to 9 minutes (1,422 commuters, 37.6%), less than 5 minutes (986 commuters, 26.1%), and 10 to 14 minutes (590 commuters, 15.6%).
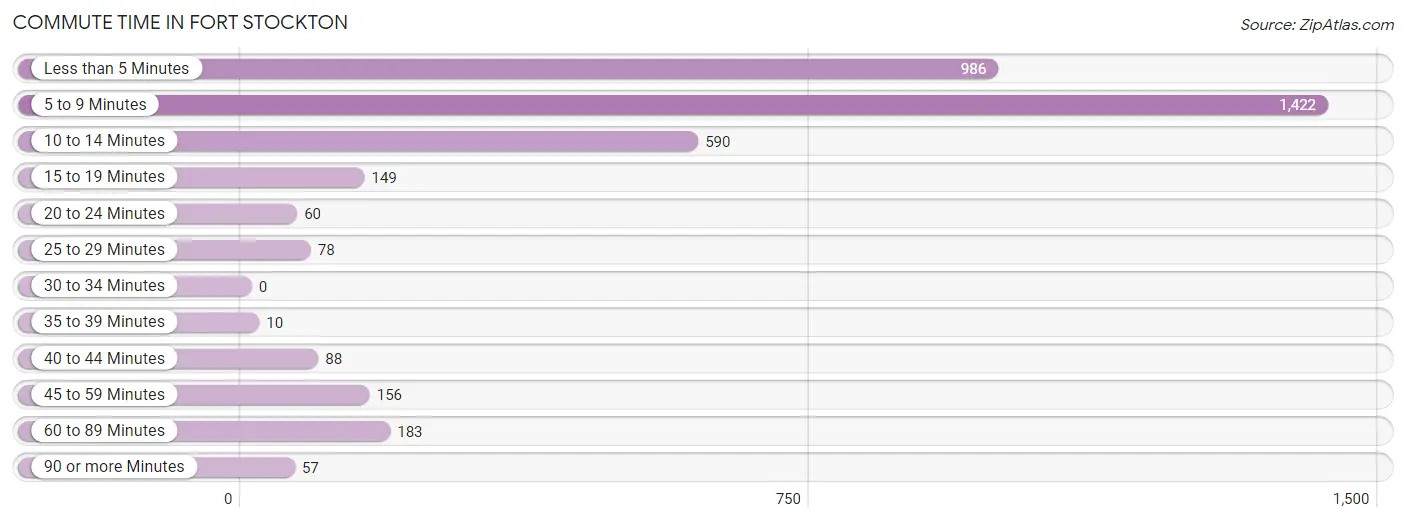
| Commute Time | # Commuters | % Commuters |
| Less than 5 Minutes | 986 | 26.1% |
| 5 to 9 Minutes | 1,422 | 37.6% |
| 10 to 14 Minutes | 590 | 15.6% |
| 15 to 19 Minutes | 149 | 3.9% |
| 20 to 24 Minutes | 60 | 1.6% |
| 25 to 29 Minutes | 78 | 2.1% |
| 30 to 34 Minutes | 0 | 0.0% |
| 35 to 39 Minutes | 10 | 0.3% |
| 40 to 44 Minutes | 88 | 2.3% |
| 45 to 59 Minutes | 156 | 4.1% |
| 60 to 89 Minutes | 183 | 4.8% |
| 90 or more Minutes | 57 | 1.5% |
Commute Time by Sex in Fort Stockton
The most common commute times in Fort Stockton are 5 to 9 minutes (530 commuters, 28.0%) for males and 5 to 9 minutes (892 commuters, 47.3%) for females.
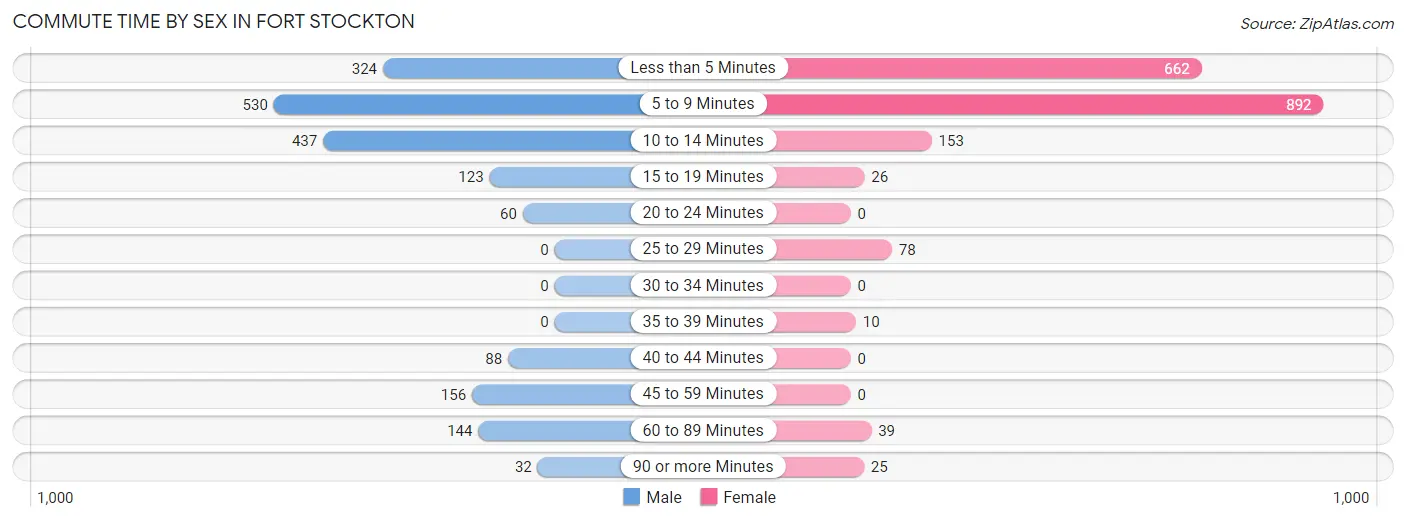
| Commute Time | Male | Female |
| Less than 5 Minutes | 324 (17.1%) | 662 (35.1%) |
| 5 to 9 Minutes | 530 (28.0%) | 892 (47.3%) |
| 10 to 14 Minutes | 437 (23.1%) | 153 (8.1%) |
| 15 to 19 Minutes | 123 (6.5%) | 26 (1.4%) |
| 20 to 24 Minutes | 60 (3.2%) | 0 (0.0%) |
| 25 to 29 Minutes | 0 (0.0%) | 78 (4.1%) |
| 30 to 34 Minutes | 0 (0.0%) | 0 (0.0%) |
| 35 to 39 Minutes | 0 (0.0%) | 10 (0.5%) |
| 40 to 44 Minutes | 88 (4.6%) | 0 (0.0%) |
| 45 to 59 Minutes | 156 (8.2%) | 0 (0.0%) |
| 60 to 89 Minutes | 144 (7.6%) | 39 (2.1%) |
| 90 or more Minutes | 32 (1.7%) | 25 (1.3%) |
Time of Departure to Work by Sex in Fort Stockton
The most frequent times of departure to work in Fort Stockton are 7:00 AM to 7:29 AM (308, 16.3%) for males and 8:00 AM to 8:29 AM (464, 24.6%) for females.
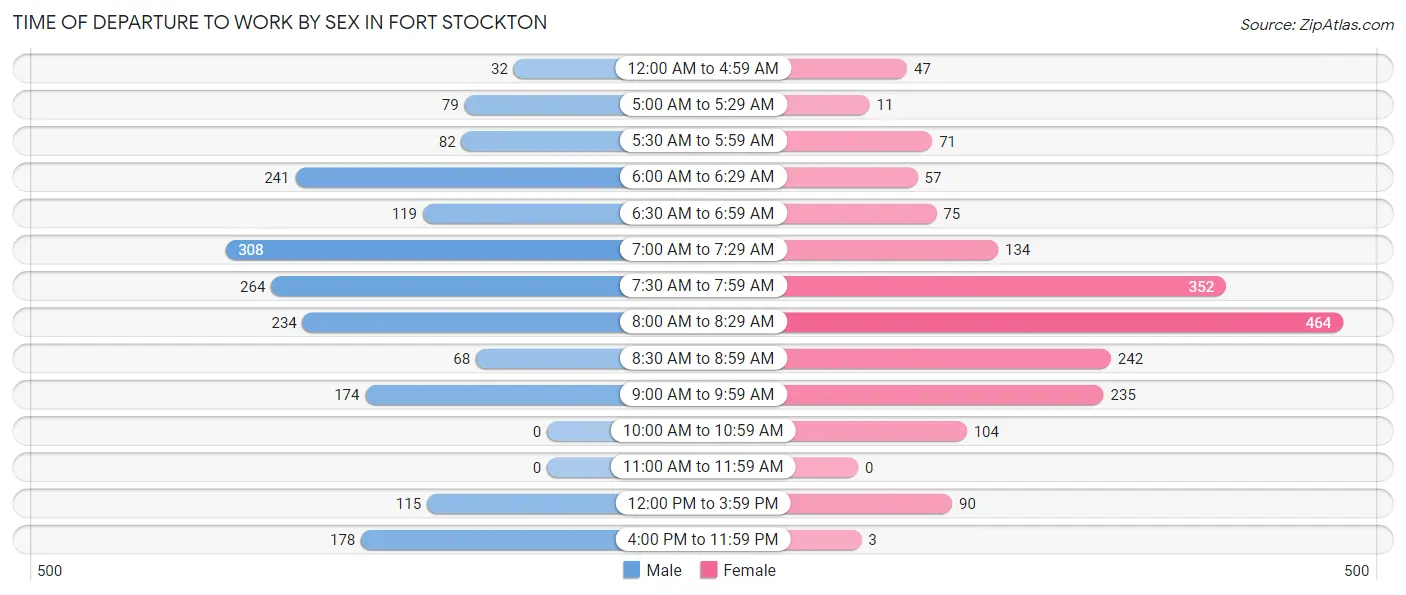
| Time of Departure | Male | Female |
| 12:00 AM to 4:59 AM | 32 (1.7%) | 47 (2.5%) |
| 5:00 AM to 5:29 AM | 79 (4.2%) | 11 (0.6%) |
| 5:30 AM to 5:59 AM | 82 (4.3%) | 71 (3.8%) |
| 6:00 AM to 6:29 AM | 241 (12.7%) | 57 (3.0%) |
| 6:30 AM to 6:59 AM | 119 (6.3%) | 75 (4.0%) |
| 7:00 AM to 7:29 AM | 308 (16.3%) | 134 (7.1%) |
| 7:30 AM to 7:59 AM | 264 (13.9%) | 352 (18.7%) |
| 8:00 AM to 8:29 AM | 234 (12.3%) | 464 (24.6%) |
| 8:30 AM to 8:59 AM | 68 (3.6%) | 242 (12.8%) |
| 9:00 AM to 9:59 AM | 174 (9.2%) | 235 (12.5%) |
| 10:00 AM to 10:59 AM | 0 (0.0%) | 104 (5.5%) |
| 11:00 AM to 11:59 AM | 0 (0.0%) | 0 (0.0%) |
| 12:00 PM to 3:59 PM | 115 (6.1%) | 90 (4.8%) |
| 4:00 PM to 11:59 PM | 178 (9.4%) | 3 (0.2%) |
| Total | 1,894 (100.0%) | 1,885 (100.0%) |
Housing Occupancy in Fort Stockton
Occupancy by Ownership in Fort Stockton
Of the total 3,147 dwellings in Fort Stockton, owner-occupied units account for 2,068 (65.7%), while renter-occupied units make up 1,079 (34.3%).
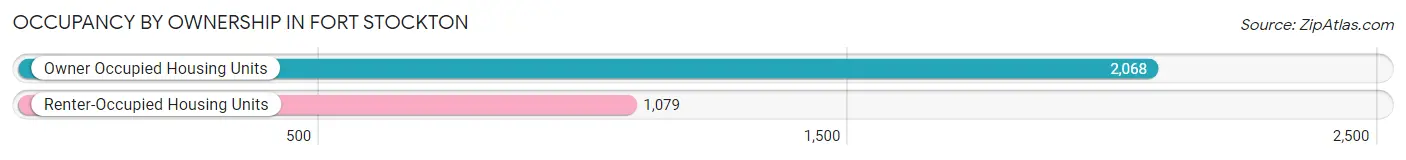
| Occupancy | # Housing Units | % Housing Units |
| Owner Occupied Housing Units | 2,068 | 65.7% |
| Renter-Occupied Housing Units | 1,079 | 34.3% |
| Total Occupied Housing Units | 3,147 | 100.0% |
Occupancy by Household Size in Fort Stockton
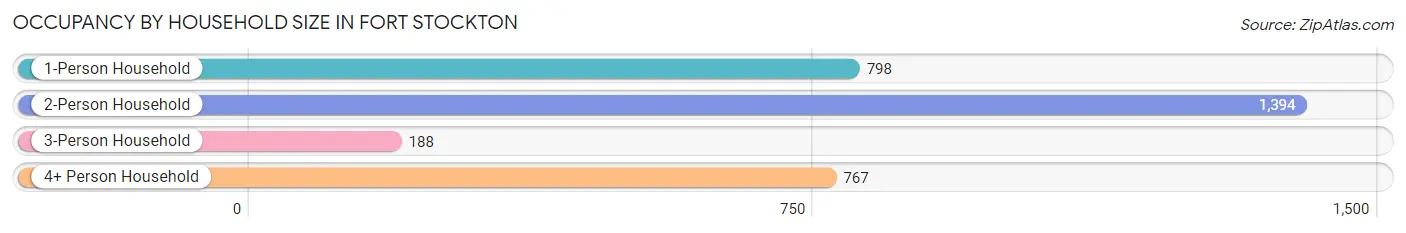
| Household Size | # Housing Units | % Housing Units |
| 1-Person Household | 798 | 25.4% |
| 2-Person Household | 1,394 | 44.3% |
| 3-Person Household | 188 | 6.0% |
| 4+ Person Household | 767 | 24.4% |
| Total Housing Units | 3,147 | 100.0% |
Occupancy by Ownership by Household Size in Fort Stockton
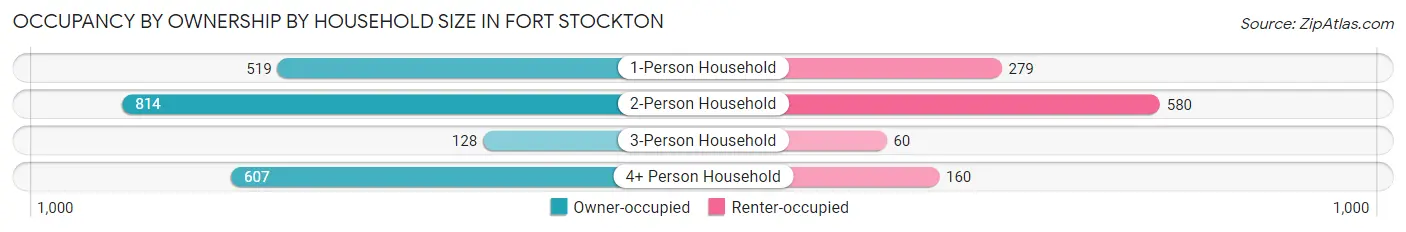
| Household Size | Owner-occupied | Renter-occupied |
| 1-Person Household | 519 (65.0%) | 279 (35.0%) |
| 2-Person Household | 814 (58.4%) | 580 (41.6%) |
| 3-Person Household | 128 (68.1%) | 60 (31.9%) |
| 4+ Person Household | 607 (79.1%) | 160 (20.9%) |
| Total Housing Units | 2,068 (65.7%) | 1,079 (34.3%) |
Occupancy by Educational Attainment in Fort Stockton
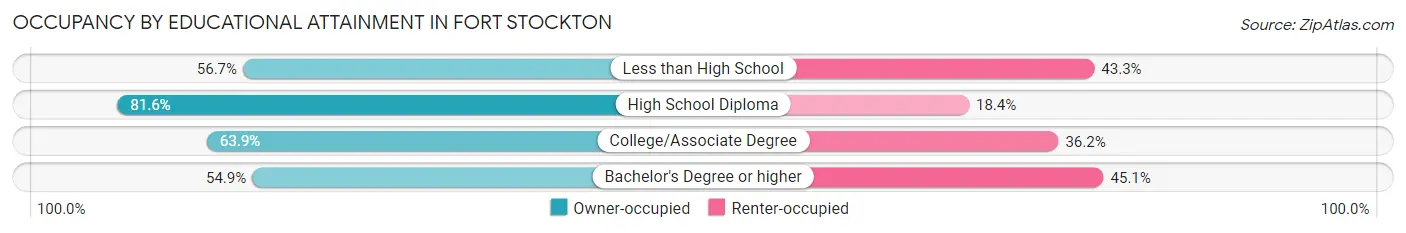
| Household Size | Owner-occupied | Renter-occupied |
| Less than High School | 350 (56.7%) | 267 (43.3%) |
| High School Diploma | 669 (81.6%) | 151 (18.4%) |
| College/Associate Degree | 786 (63.8%) | 445 (36.1%) |
| Bachelor's Degree or higher | 263 (54.9%) | 216 (45.1%) |
Occupancy by Age of Householder in Fort Stockton
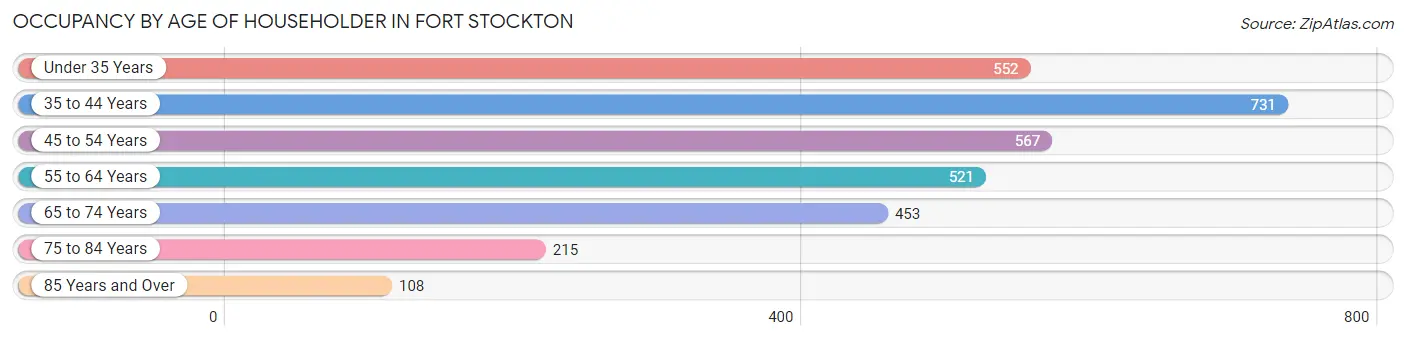
| Age Bracket | # Households | % Households |
| Under 35 Years | 552 | 17.5% |
| 35 to 44 Years | 731 | 23.2% |
| 45 to 54 Years | 567 | 18.0% |
| 55 to 64 Years | 521 | 16.6% |
| 65 to 74 Years | 453 | 14.4% |
| 75 to 84 Years | 215 | 6.8% |
| 85 Years and Over | 108 | 3.4% |
| Total | 3,147 | 100.0% |
Housing Finances in Fort Stockton
Median Income by Occupancy in Fort Stockton
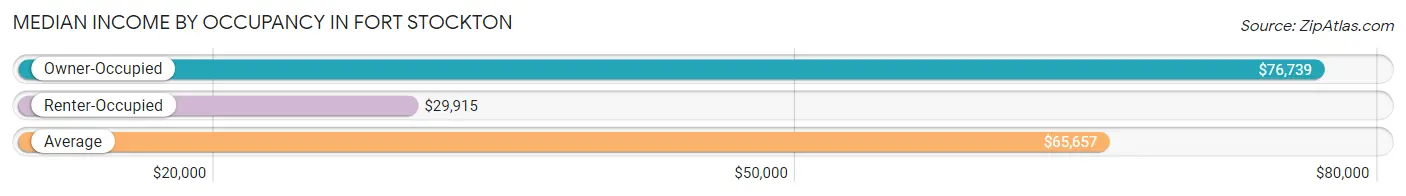
| Occupancy Type | # Households | Median Income |
| Owner-Occupied | 2,068 (65.7%) | $76,739 |
| Renter-Occupied | 1,079 (34.3%) | $29,915 |
| Average | 3,147 (100.0%) | $65,657 |
Occupancy by Householder Income Bracket in Fort Stockton
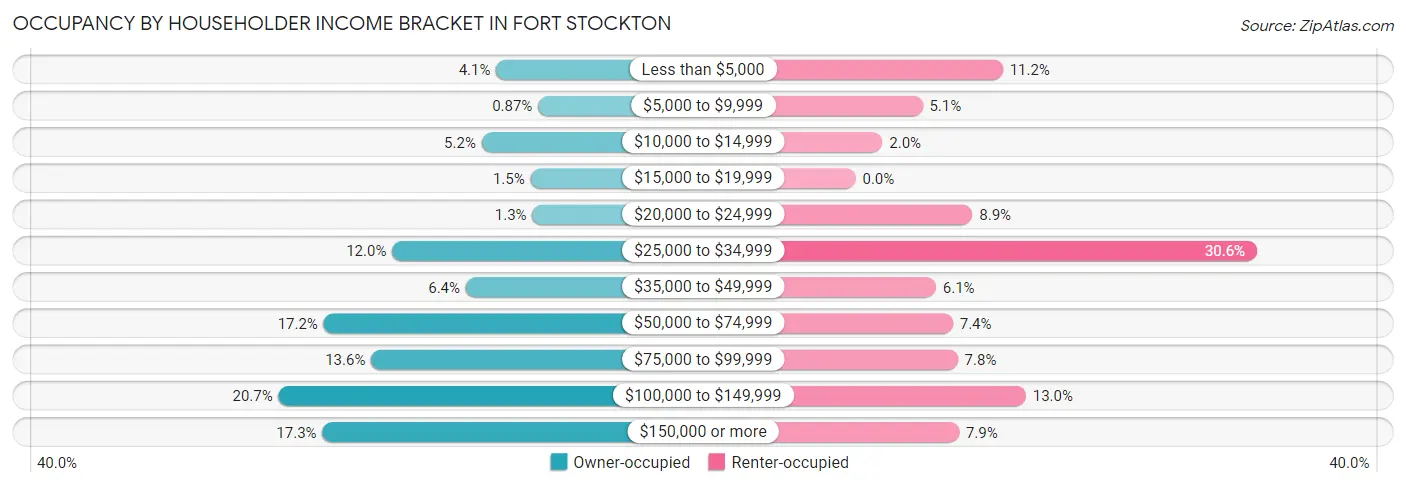
| Income Bracket | Owner-occupied | Renter-occupied |
| Less than $5,000 | 84 (4.1%) | 121 (11.2%) |
| $5,000 to $9,999 | 18 (0.9%) | 55 (5.1%) |
| $10,000 to $14,999 | 107 (5.2%) | 22 (2.0%) |
| $15,000 to $19,999 | 30 (1.5%) | 0 (0.0%) |
| $20,000 to $24,999 | 27 (1.3%) | 96 (8.9%) |
| $25,000 to $34,999 | 248 (12.0%) | 330 (30.6%) |
| $35,000 to $49,999 | 132 (6.4%) | 66 (6.1%) |
| $50,000 to $74,999 | 356 (17.2%) | 80 (7.4%) |
| $75,000 to $99,999 | 281 (13.6%) | 84 (7.8%) |
| $100,000 to $149,999 | 427 (20.6%) | 140 (13.0%) |
| $150,000 or more | 358 (17.3%) | 85 (7.9%) |
| Total | 2,068 (100.0%) | 1,079 (100.0%) |
Monthly Housing Cost Tiers in Fort Stockton
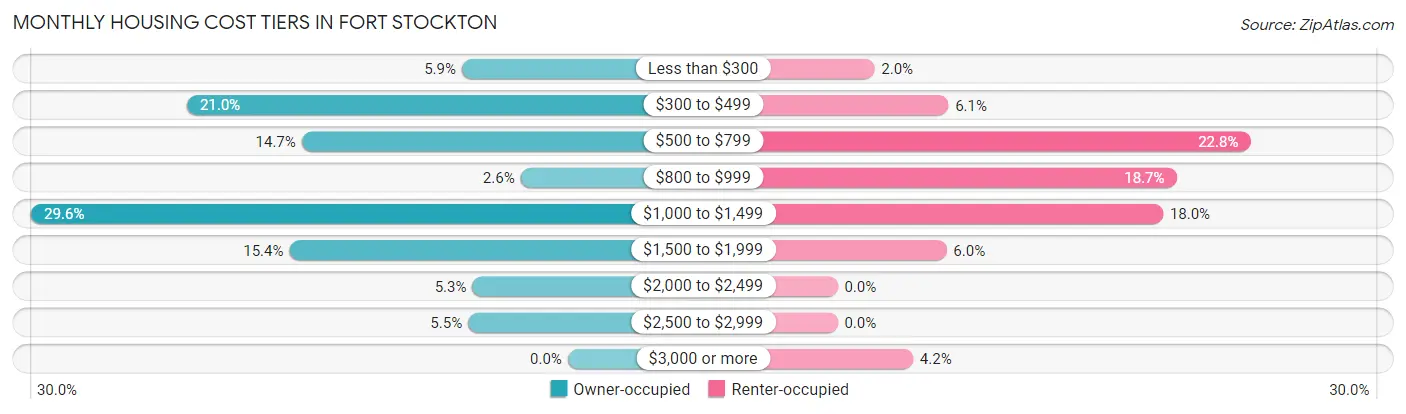
| Monthly Cost | Owner-occupied | Renter-occupied |
| Less than $300 | 121 (5.9%) | 22 (2.0%) |
| $300 to $499 | 435 (21.0%) | 66 (6.1%) |
| $500 to $799 | 304 (14.7%) | 246 (22.8%) |
| $800 to $999 | 54 (2.6%) | 202 (18.7%) |
| $1,000 to $1,499 | 613 (29.6%) | 194 (18.0%) |
| $1,500 to $1,999 | 318 (15.4%) | 65 (6.0%) |
| $2,000 to $2,499 | 109 (5.3%) | 0 (0.0%) |
| $2,500 to $2,999 | 114 (5.5%) | 0 (0.0%) |
| $3,000 or more | 0 (0.0%) | 45 (4.2%) |
| Total | 2,068 (100.0%) | 1,079 (100.0%) |
Physical Housing Characteristics in Fort Stockton
Housing Structures in Fort Stockton
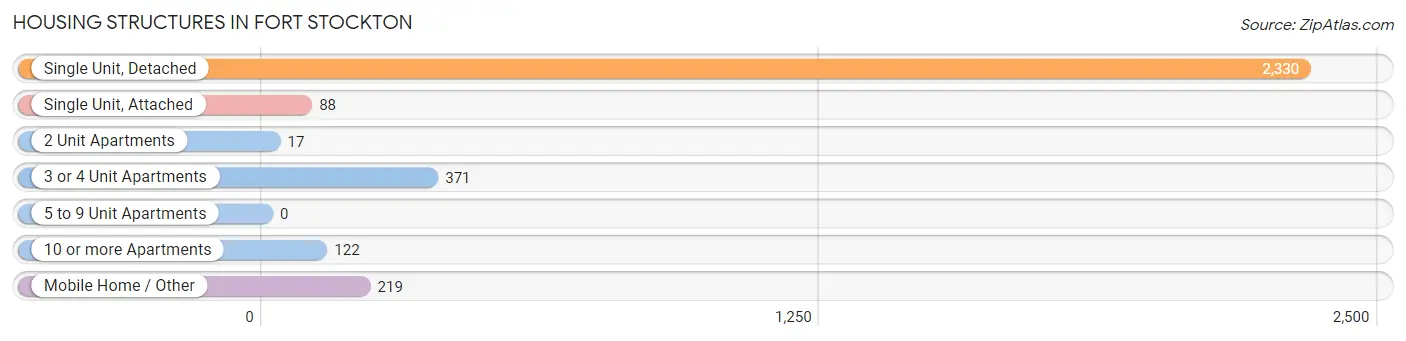
| Structure Type | # Housing Units | % Housing Units |
| Single Unit, Detached | 2,330 | 74.0% |
| Single Unit, Attached | 88 | 2.8% |
| 2 Unit Apartments | 17 | 0.5% |
| 3 or 4 Unit Apartments | 371 | 11.8% |
| 5 to 9 Unit Apartments | 0 | 0.0% |
| 10 or more Apartments | 122 | 3.9% |
| Mobile Home / Other | 219 | 7.0% |
| Total | 3,147 | 100.0% |
Housing Structures by Occupancy in Fort Stockton
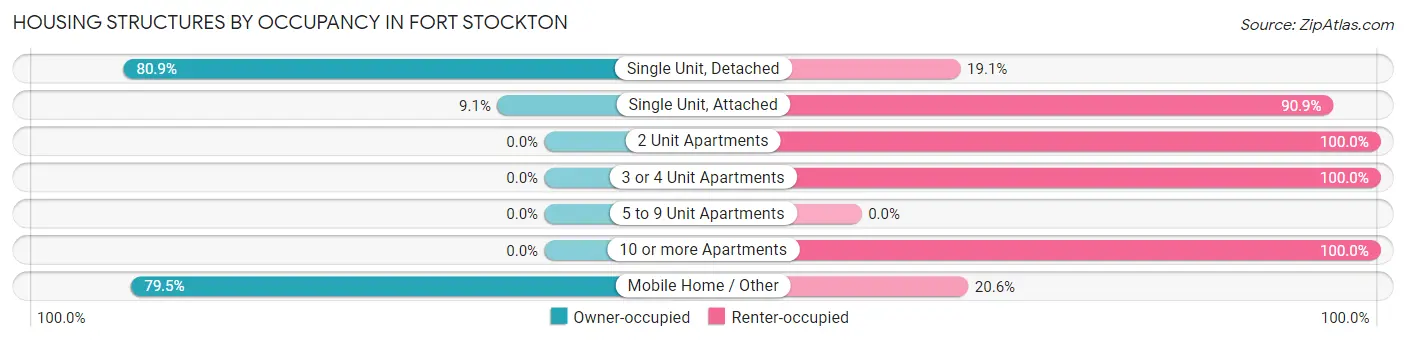
| Structure Type | Owner-occupied | Renter-occupied |
| Single Unit, Detached | 1,886 (80.9%) | 444 (19.1%) |
| Single Unit, Attached | 8 (9.1%) | 80 (90.9%) |
| 2 Unit Apartments | 0 (0.0%) | 17 (100.0%) |
| 3 or 4 Unit Apartments | 0 (0.0%) | 371 (100.0%) |
| 5 to 9 Unit Apartments | 0 (0.0%) | 0 (0.0%) |
| 10 or more Apartments | 0 (0.0%) | 122 (100.0%) |
| Mobile Home / Other | 174 (79.4%) | 45 (20.5%) |
| Total | 2,068 (65.7%) | 1,079 (34.3%) |
Housing Structures by Number of Rooms in Fort Stockton
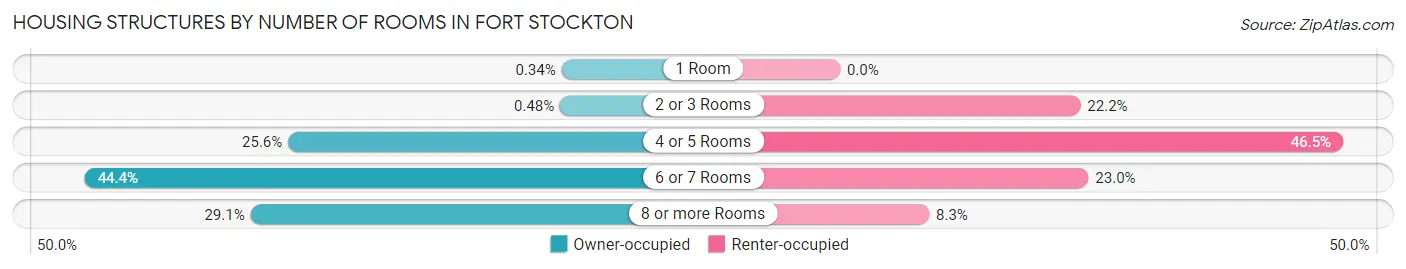
| Number of Rooms | Owner-occupied | Renter-occupied |
| 1 Room | 7 (0.3%) | 0 (0.0%) |
| 2 or 3 Rooms | 10 (0.5%) | 240 (22.2%) |
| 4 or 5 Rooms | 530 (25.6%) | 502 (46.5%) |
| 6 or 7 Rooms | 919 (44.4%) | 248 (23.0%) |
| 8 or more Rooms | 602 (29.1%) | 89 (8.3%) |
| Total | 2,068 (100.0%) | 1,079 (100.0%) |
Housing Structure by Heating Type in Fort Stockton
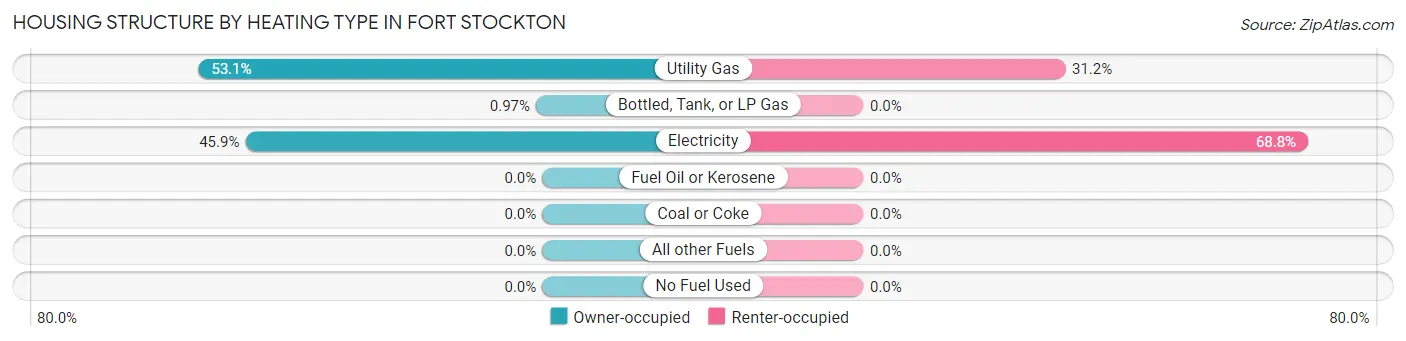
| Heating Type | Owner-occupied | Renter-occupied |
| Utility Gas | 1,099 (53.1%) | 337 (31.2%) |
| Bottled, Tank, or LP Gas | 20 (1.0%) | 0 (0.0%) |
| Electricity | 949 (45.9%) | 742 (68.8%) |
| Fuel Oil or Kerosene | 0 (0.0%) | 0 (0.0%) |
| Coal or Coke | 0 (0.0%) | 0 (0.0%) |
| All other Fuels | 0 (0.0%) | 0 (0.0%) |
| No Fuel Used | 0 (0.0%) | 0 (0.0%) |
| Total | 2,068 (100.0%) | 1,079 (100.0%) |
Household Vehicle Usage in Fort Stockton
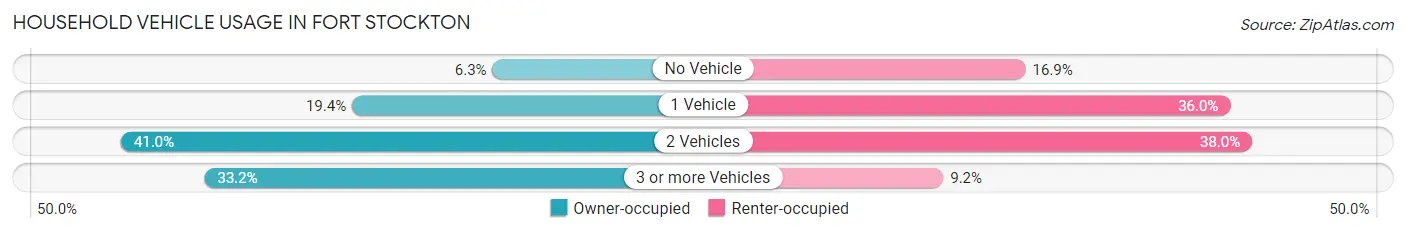
| Vehicles per Household | Owner-occupied | Renter-occupied |
| No Vehicle | 131 (6.3%) | 182 (16.9%) |
| 1 Vehicle | 402 (19.4%) | 388 (36.0%) |
| 2 Vehicles | 848 (41.0%) | 410 (38.0%) |
| 3 or more Vehicles | 687 (33.2%) | 99 (9.2%) |
| Total | 2,068 (100.0%) | 1,079 (100.0%) |
Real Estate & Mortgages in Fort Stockton
Real Estate and Mortgage Overview in Fort Stockton
| Characteristic | Without Mortgage | With Mortgage |
| Housing Units | 951 | 1,117 |
| Median Property Value | $104,900 | $192,000 |
| Median Household Income | $66,048 | $233 |
| Monthly Housing Costs | $460 | $0 |
| Real Estate Taxes | $917 | $0 |
Property Value by Mortgage Status in Fort Stockton
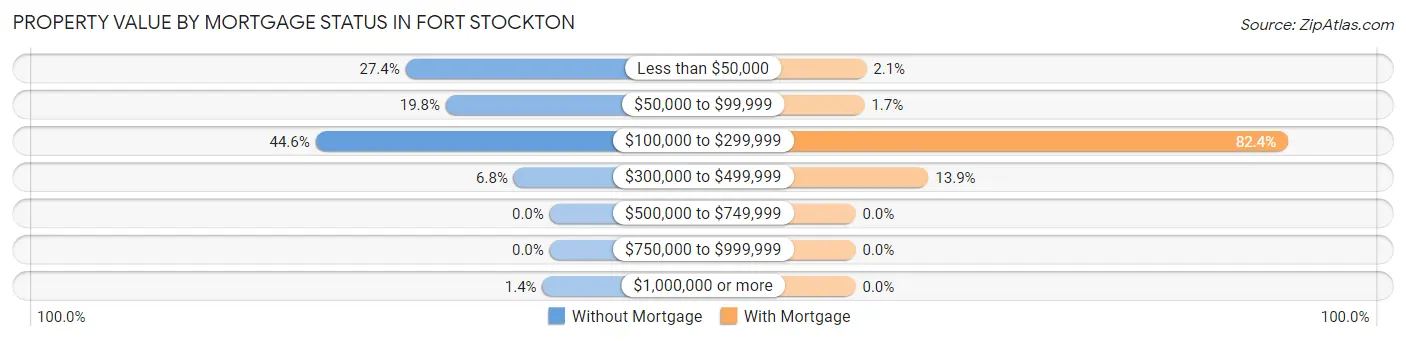
| Property Value | Without Mortgage | With Mortgage |
| Less than $50,000 | 261 (27.4%) | 23 (2.1%) |
| $50,000 to $99,999 | 188 (19.8%) | 19 (1.7%) |
| $100,000 to $299,999 | 424 (44.6%) | 920 (82.4%) |
| $300,000 to $499,999 | 65 (6.8%) | 155 (13.9%) |
| $500,000 to $749,999 | 0 (0.0%) | 0 (0.0%) |
| $750,000 to $999,999 | 0 (0.0%) | 0 (0.0%) |
| $1,000,000 or more | 13 (1.4%) | 0 (0.0%) |
| Total | 951 (100.0%) | 1,117 (100.0%) |
Household Income by Mortgage Status in Fort Stockton
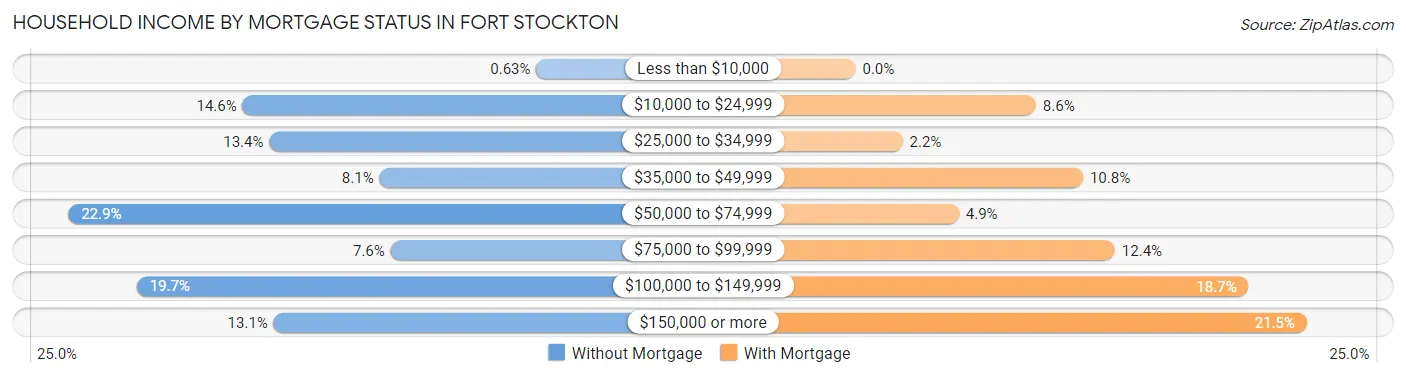
| Household Income | Without Mortgage | With Mortgage |
| Less than $10,000 | 6 (0.6%) | 0 (0.0%) |
| $10,000 to $24,999 | 139 (14.6%) | 96 (8.6%) |
| $25,000 to $34,999 | 127 (13.4%) | 25 (2.2%) |
| $35,000 to $49,999 | 77 (8.1%) | 121 (10.8%) |
| $50,000 to $74,999 | 218 (22.9%) | 55 (4.9%) |
| $75,000 to $99,999 | 72 (7.6%) | 138 (12.3%) |
| $100,000 to $149,999 | 187 (19.7%) | 209 (18.7%) |
| $150,000 or more | 125 (13.1%) | 240 (21.5%) |
| Total | 951 (100.0%) | 1,117 (100.0%) |
Property Value to Household Income Ratio in Fort Stockton
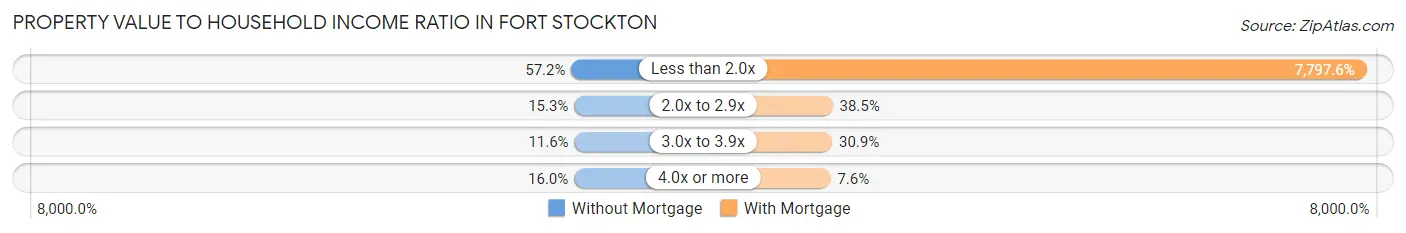
| Value-to-Income Ratio | Without Mortgage | With Mortgage |
| Less than 2.0x | 544 (57.2%) | 87,099 (7,797.6%) |
| 2.0x to 2.9x | 145 (15.2%) | 430 (38.5%) |
| 3.0x to 3.9x | 110 (11.6%) | 345 (30.9%) |
| 4.0x or more | 152 (16.0%) | 85 (7.6%) |
| Total | 951 (100.0%) | 1,117 (100.0%) |
Real Estate Taxes by Mortgage Status in Fort Stockton
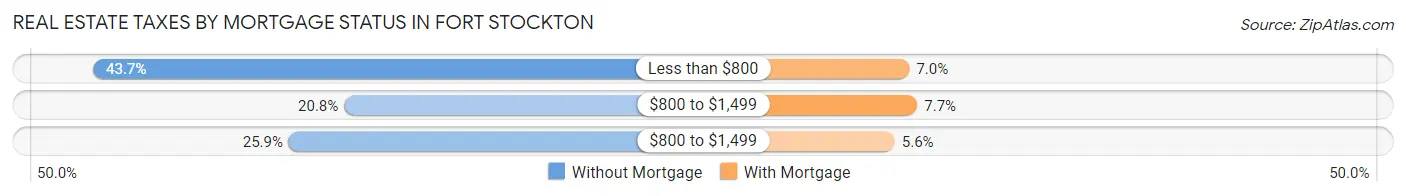
| Property Taxes | Without Mortgage | With Mortgage |
| Less than $800 | 416 (43.7%) | 78 (7.0%) |
| $800 to $1,499 | 198 (20.8%) | 86 (7.7%) |
| $800 to $1,499 | 246 (25.9%) | 63 (5.6%) |
| Total | 951 (100.0%) | 1,117 (100.0%) |
Health & Disability in Fort Stockton
Health Insurance Coverage by Age in Fort Stockton
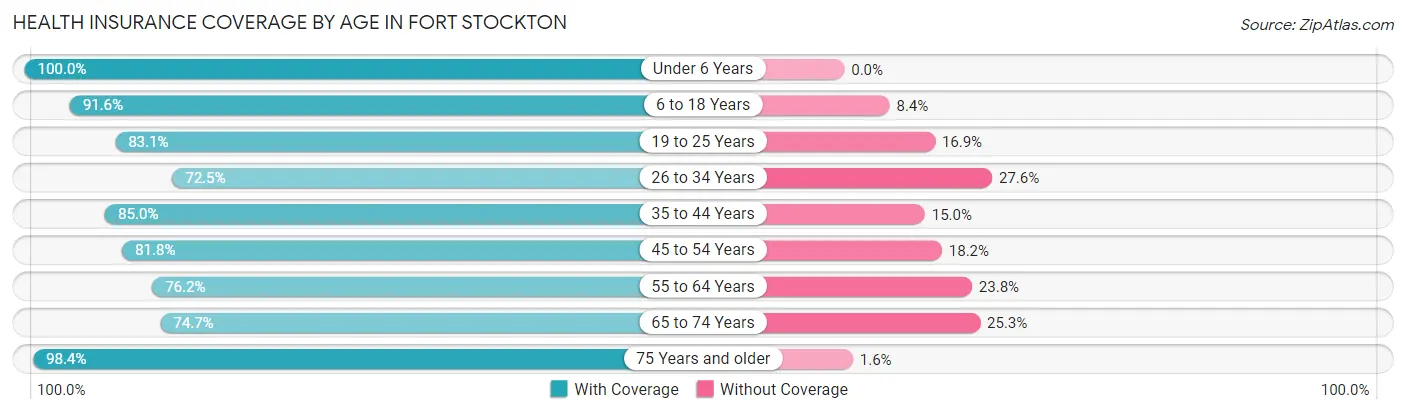
| Age Bracket | With Coverage | Without Coverage |
| Under 6 Years | 792 (100.0%) | 0 (0.0%) |
| 6 to 18 Years | 1,432 (91.6%) | 132 (8.4%) |
| 19 to 25 Years | 585 (83.1%) | 119 (16.9%) |
| 26 to 34 Years | 739 (72.5%) | 281 (27.6%) |
| 35 to 44 Years | 900 (85.0%) | 159 (15.0%) |
| 45 to 54 Years | 742 (81.8%) | 165 (18.2%) |
| 55 to 64 Years | 589 (76.2%) | 184 (23.8%) |
| 65 to 74 Years | 395 (74.7%) | 134 (25.3%) |
| 75 Years and older | 433 (98.4%) | 7 (1.6%) |
| Total | 6,607 (84.8%) | 1,181 (15.2%) |
Health Insurance Coverage by Citizenship Status in Fort Stockton
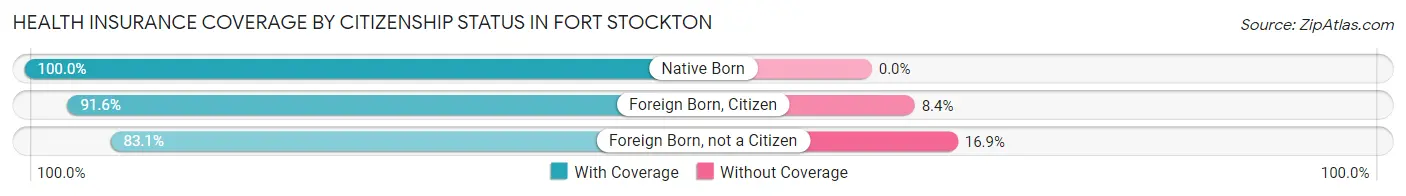
| Citizenship Status | With Coverage | Without Coverage |
| Native Born | 792 (100.0%) | 0 (0.0%) |
| Foreign Born, Citizen | 1,432 (91.6%) | 132 (8.4%) |
| Foreign Born, not a Citizen | 585 (83.1%) | 119 (16.9%) |
Health Insurance Coverage by Household Income in Fort Stockton
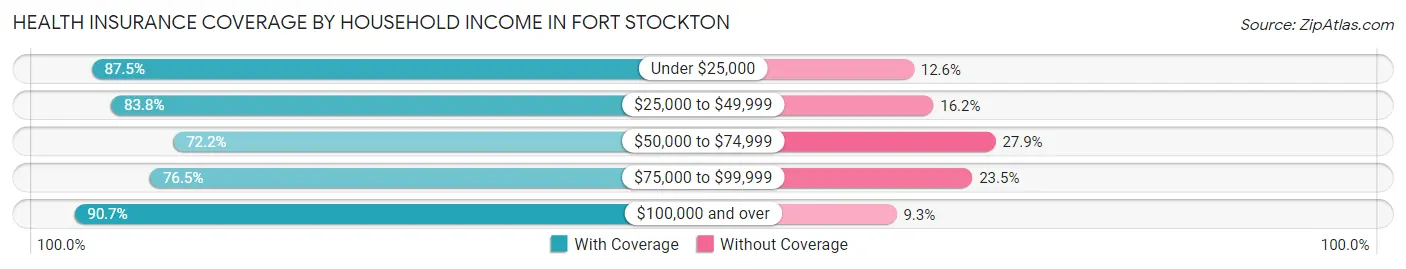
| Household Income | With Coverage | Without Coverage |
| Under $25,000 | 996 (87.5%) | 143 (12.6%) |
| $25,000 to $49,999 | 1,840 (83.8%) | 356 (16.2%) |
| $50,000 to $74,999 | 671 (72.2%) | 259 (27.9%) |
| $75,000 to $99,999 | 550 (76.5%) | 169 (23.5%) |
| $100,000 and over | 2,475 (90.7%) | 254 (9.3%) |
Public vs Private Health Insurance Coverage by Age in Fort Stockton
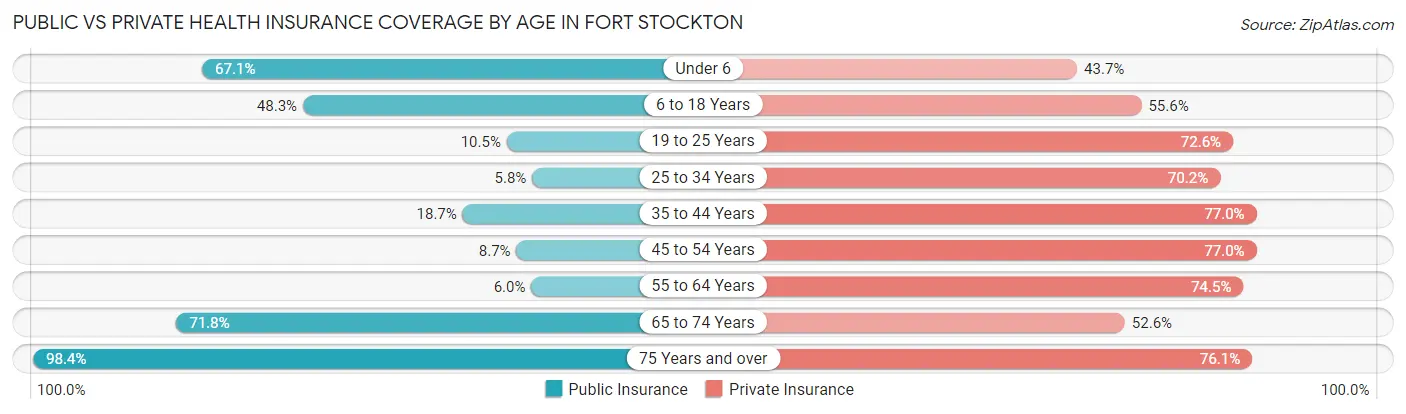
| Age Bracket | Public Insurance | Private Insurance |
| Under 6 | 531 (67.0%) | 346 (43.7%) |
| 6 to 18 Years | 756 (48.3%) | 870 (55.6%) |
| 19 to 25 Years | 74 (10.5%) | 511 (72.6%) |
| 25 to 34 Years | 59 (5.8%) | 716 (70.2%) |
| 35 to 44 Years | 198 (18.7%) | 815 (77.0%) |
| 45 to 54 Years | 79 (8.7%) | 698 (77.0%) |
| 55 to 64 Years | 46 (5.9%) | 576 (74.5%) |
| 65 to 74 Years | 380 (71.8%) | 278 (52.5%) |
| 75 Years and over | 433 (98.4%) | 335 (76.1%) |
| Total | 2,556 (32.8%) | 5,145 (66.1%) |
Disability Status by Sex by Age in Fort Stockton
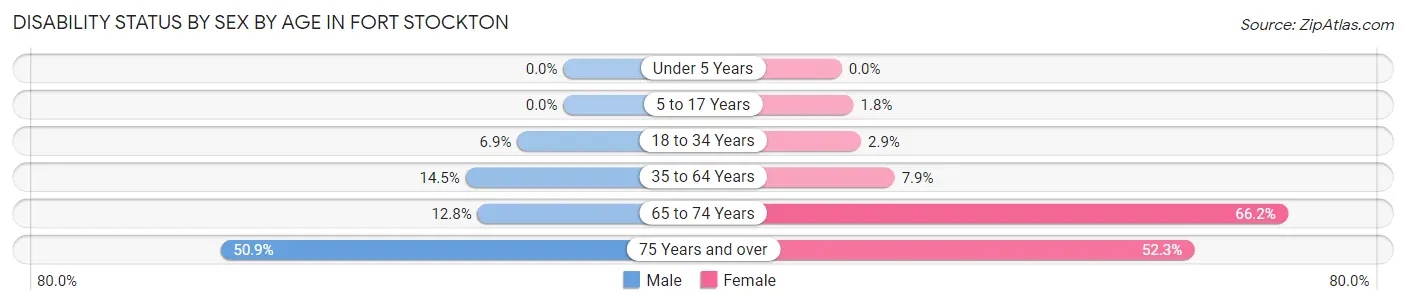
| Age Bracket | Male | Female |
| Under 5 Years | 0 (0.0%) | 0 (0.0%) |
| 5 to 17 Years | 0 (0.0%) | 15 (1.8%) |
| 18 to 34 Years | 54 (6.9%) | 29 (2.9%) |
| 35 to 64 Years | 189 (14.5%) | 113 (7.9%) |
| 65 to 74 Years | 32 (12.8%) | 184 (66.2%) |
| 75 Years and over | 81 (50.9%) | 147 (52.3%) |
Disability Class by Sex by Age in Fort Stockton
Disability Class: Hearing Difficulty
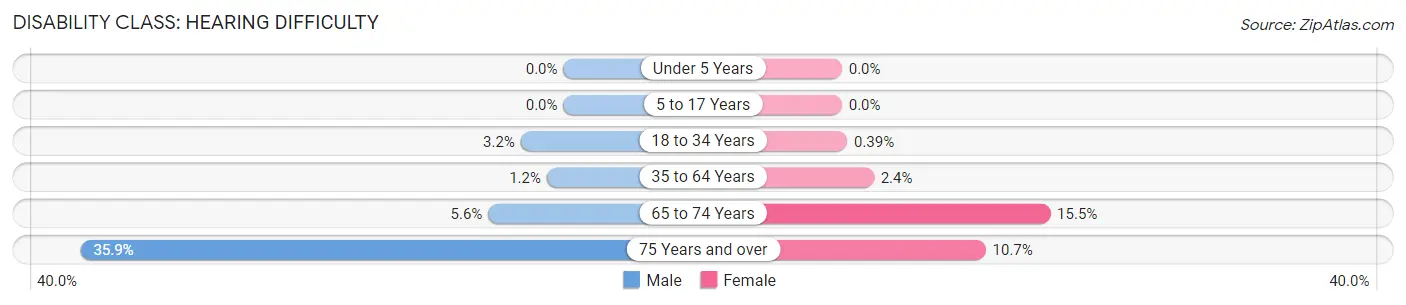
| Age Bracket | Male | Female |
| Under 5 Years | 0 (0.0%) | 0 (0.0%) |
| 5 to 17 Years | 0 (0.0%) | 0 (0.0%) |
| 18 to 34 Years | 25 (3.2%) | 4 (0.4%) |
| 35 to 64 Years | 16 (1.2%) | 34 (2.4%) |
| 65 to 74 Years | 14 (5.6%) | 43 (15.5%) |
| 75 Years and over | 57 (35.8%) | 30 (10.7%) |
Disability Class: Vision Difficulty
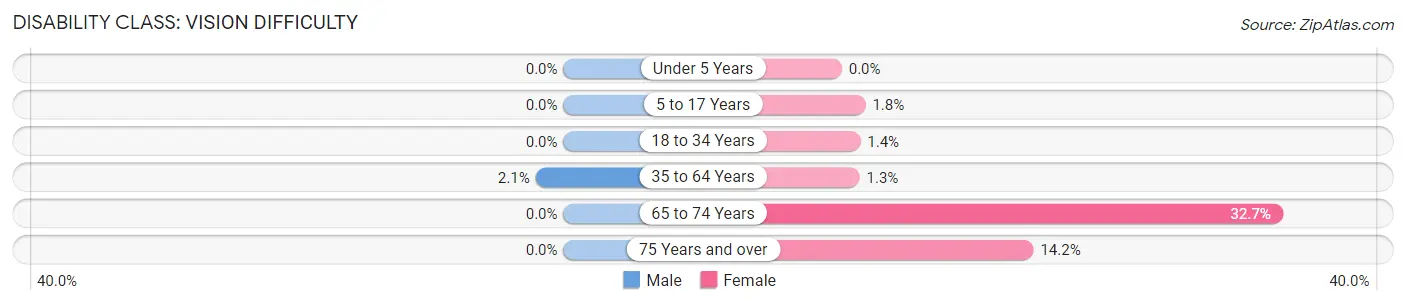
| Age Bracket | Male | Female |
| Under 5 Years | 0 (0.0%) | 0 (0.0%) |
| 5 to 17 Years | 0 (0.0%) | 15 (1.8%) |
| 18 to 34 Years | 0 (0.0%) | 14 (1.4%) |
| 35 to 64 Years | 27 (2.1%) | 19 (1.3%) |
| 65 to 74 Years | 0 (0.0%) | 91 (32.7%) |
| 75 Years and over | 0 (0.0%) | 40 (14.2%) |
Disability Class: Cognitive Difficulty
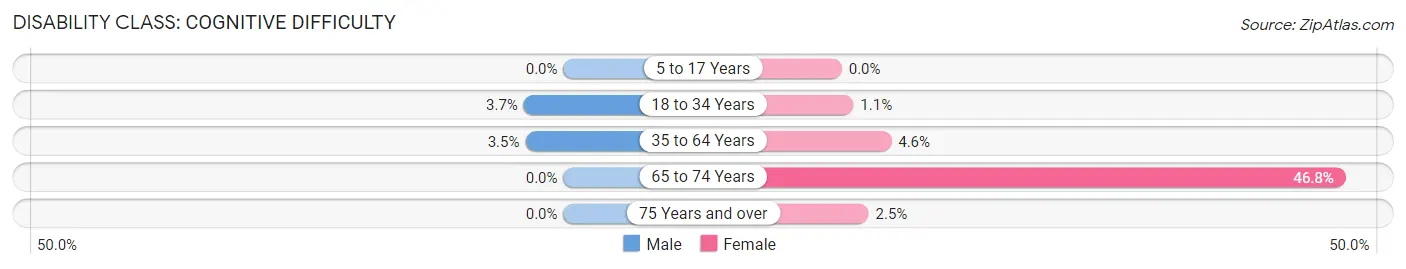
| Age Bracket | Male | Female |
| 5 to 17 Years | 0 (0.0%) | 0 (0.0%) |
| 18 to 34 Years | 29 (3.7%) | 11 (1.1%) |
| 35 to 64 Years | 46 (3.5%) | 66 (4.6%) |
| 65 to 74 Years | 0 (0.0%) | 130 (46.8%) |
| 75 Years and over | 0 (0.0%) | 7 (2.5%) |
Disability Class: Ambulatory Difficulty
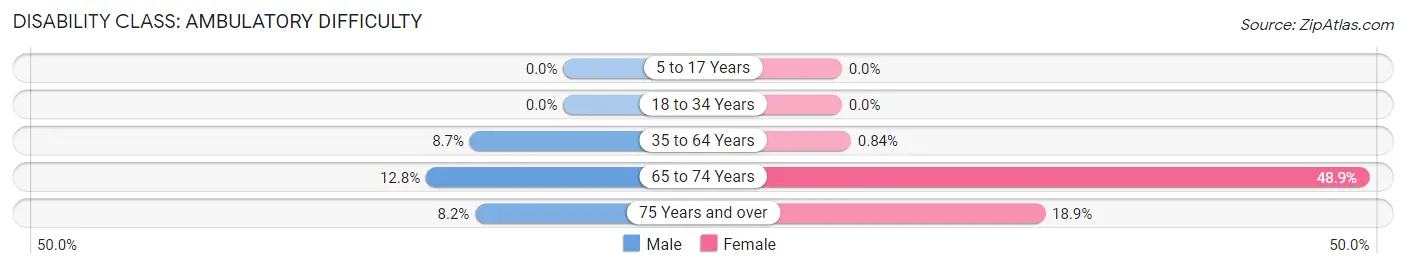
| Age Bracket | Male | Female |
| 5 to 17 Years | 0 (0.0%) | 0 (0.0%) |
| 18 to 34 Years | 0 (0.0%) | 0 (0.0%) |
| 35 to 64 Years | 113 (8.7%) | 12 (0.8%) |
| 65 to 74 Years | 32 (12.8%) | 136 (48.9%) |
| 75 Years and over | 13 (8.2%) | 53 (18.9%) |
Disability Class: Self-Care Difficulty
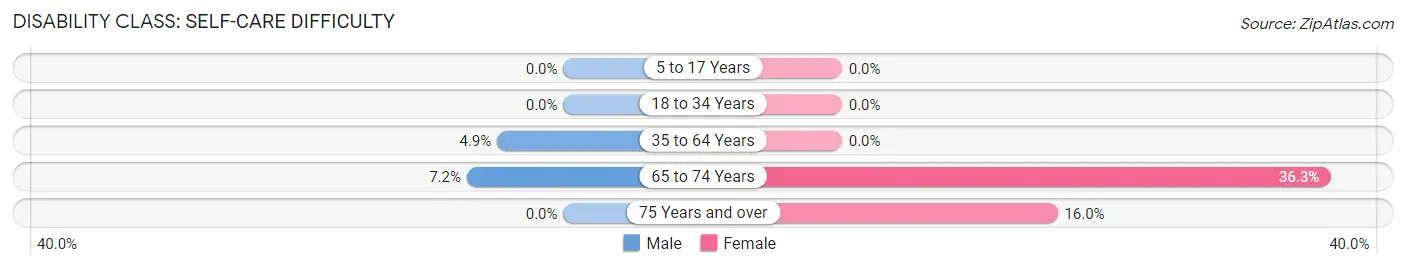
| Age Bracket | Male | Female |
| 5 to 17 Years | 0 (0.0%) | 0 (0.0%) |
| 18 to 34 Years | 0 (0.0%) | 0 (0.0%) |
| 35 to 64 Years | 64 (4.9%) | 0 (0.0%) |
| 65 to 74 Years | 18 (7.2%) | 101 (36.3%) |
| 75 Years and over | 0 (0.0%) | 45 (16.0%) |
Technology Access in Fort Stockton
Computing Device Access in Fort Stockton
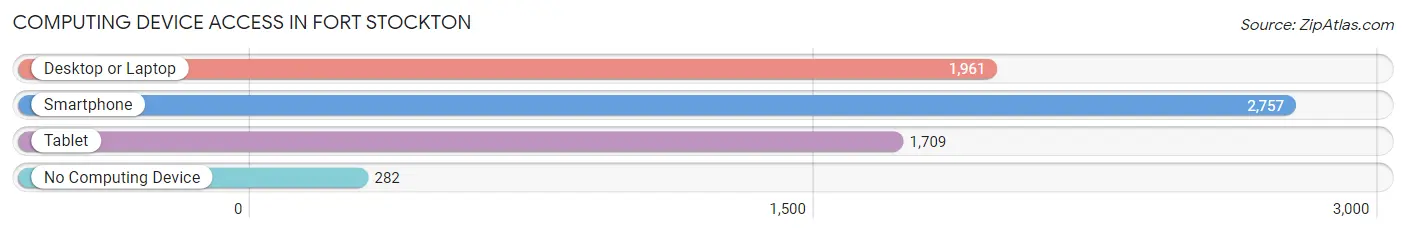
| Device Type | # Households | % Households |
| Desktop or Laptop | 1,961 | 62.3% |
| Smartphone | 2,757 | 87.6% |
| Tablet | 1,709 | 54.3% |
| No Computing Device | 282 | 9.0% |
| Total | 3,147 | 100.0% |
Internet Access in Fort Stockton
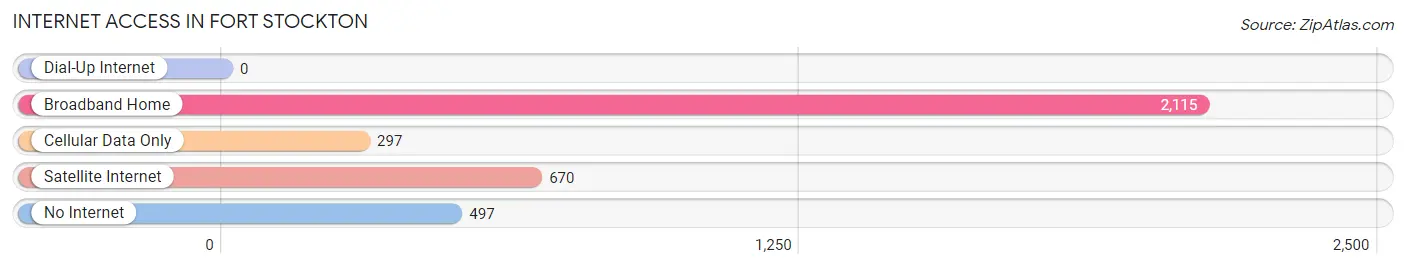
| Internet Type | # Households | % Households |
| Dial-Up Internet | 0 | 0.0% |
| Broadband Home | 2,115 | 67.2% |
| Cellular Data Only | 297 | 9.4% |
| Satellite Internet | 670 | 21.3% |
| No Internet | 497 | 15.8% |
| Total | 3,147 | 100.0% |
Fort Stockton Summary
Fort Stockton is a city located in Pecos County, Texas, United States. It is the county seat of Pecos County and is located on the northern edge of the Chihuahuan Desert. The population of Fort Stockton was 8,283 at the 2010 census.
History
Fort Stockton was established in 1859 as a military post to protect travelers on the San Antonio-El Paso Road. The fort was named after Robert Field Stockton, a United States naval officer and politician. The fort was abandoned in 1883, but the town of Fort Stockton was established in 1886.
The town grew rapidly in the late 19th century, and by 1900, it had a population of 1,200. The town was incorporated in 1909 and by 1910, it had a population of 2,000.
Geography
Fort Stockton is located at the intersection of Interstate 10 and U.S. Route 285 in Pecos County, Texas. It is situated on the northern edge of the Chihuahuan Desert, and is approximately 200 miles west of San Antonio and 250 miles east of El Paso.
The city has a total area of 8.3 square miles, all of which is land. The terrain is mostly flat, with some rolling hills. The climate is semi-arid, with hot summers and mild winters.
Economy
The economy of Fort Stockton is largely based on agriculture and oil and gas production. The city is home to several large oil and gas companies, including Apache Corporation, Chevron, and ExxonMobil.
Agriculture is also an important part of the local economy. The area is known for its production of cotton, sorghum, and wheat.
Demographics
As of the 2010 census, the population of Fort Stockton was 8,283. The racial makeup of the city was 75.3% White, 0.9% African American, 0.7% Native American, 0.4% Asian, 0.1% Pacific Islander, 19.7% from other races, and 3.1% from two or more races. Hispanic or Latino of any race were 57.2% of the population.
The median income for a household in Fort Stockton was $30,938, and the median income for a family was $35,938. The per capita income for the city was $15,938. About 20.3% of families and 24.2% of the population were below the poverty line, including 33.3% of those under age 18 and 16.2% of those age 65 or over.
Conclusion
Fort Stockton is a city located in Pecos County, Texas, United States. It is the county seat of Pecos County and is located on the northern edge of the Chihuahuan Desert. The population of Fort Stockton was 8,283 at the 2010 census. The economy of Fort Stockton is largely based on agriculture and oil and gas production. The racial makeup of the city was 75.3% White, 0.9% African American, 0.7% Native American, 0.4% Asian, 0.1% Pacific Islander, 19.7% from other races, and 3.1% from two or more races. Hispanic or Latino of any race were 57.2% of the population. The median income for a household in Fort Stockton was $30,938, and the median income for a family was $35,938. The per capita income for the city was $15,938. About 20.3% of families and 24.2% of the population were below the poverty line, including 33.3% of those under age 18 and 16.2% of those age 65 or over.
Common Questions
What is Per Capita Income in Fort Stockton?
Per Capita income in Fort Stockton is $30,376.
What is the Median Family Income in Fort Stockton?
Median Family Income in Fort Stockton is $66,950.
What is the Median Household income in Fort Stockton?
Median Household Income in Fort Stockton is $65,657.
What is Income or Wage Gap in Fort Stockton?
Income or Wage Gap in Fort Stockton is 51.9%.
Women in Fort Stockton earn 48.1 cents for every dollar earned by a man.
What is Family Income Deficit in Fort Stockton?
Family Income Deficit in Fort Stockton is $13,039.
Families that are below poverty line in Fort Stockton earn $13,039 less on average than the poverty threshold level.
What is Inequality or Gini Index in Fort Stockton?
Inequality or Gini Index in Fort Stockton is 0.47.
What is the Total Population of Fort Stockton?
Total Population of Fort Stockton is 8,404.
What is the Total Male Population of Fort Stockton?
Total Male Population of Fort Stockton is 4,228.
What is the Total Female Population of Fort Stockton?
Total Female Population of Fort Stockton is 4,176.
What is the Ratio of Males per 100 Females in Fort Stockton?
There are 101.25 Males per 100 Females in Fort Stockton.
What is the Ratio of Females per 100 Males in Fort Stockton?
There are 98.77 Females per 100 Males in Fort Stockton.
What is the Median Population Age in Fort Stockton?
Median Population Age in Fort Stockton is 34.5 Years.
What is the Average Family Size in Fort Stockton
Average Family Size in Fort Stockton is 3.0 People.
What is the Average Household Size in Fort Stockton
Average Household Size in Fort Stockton is 2.5 People.
How Large is the Labor Force in Fort Stockton?
There are 3,948 People in the Labor Forcein in Fort Stockton.
What is the Percentage of People in the Labor Force in Fort Stockton?
62.5% of People are in the Labor Force in Fort Stockton.
What is the Unemployment Rate in Fort Stockton?
Unemployment Rate in Fort Stockton is 1.2%.