White Oak, TX Map & Demographics
White Oak Map
White Oak Overview
$31,491
PER CAPITA INCOME
$93,939
AVG FAMILY INCOME
$94,273
AVG HOUSEHOLD INCOME
36.4%
WAGE / INCOME GAP [ % ]
63.6¢/ $1
WAGE / INCOME GAP [ $ ]
0.39
INEQUALITY / GINI INDEX
6,227
TOTAL POPULATION
3,057
MALE POPULATION
3,170
FEMALE POPULATION
96.44
MALES / 100 FEMALES
103.70
FEMALES / 100 MALES
35.5
MEDIAN AGE
3.1
AVG FAMILY SIZE
2.9
AVG HOUSEHOLD SIZE
3,276
LABOR FORCE [ PEOPLE ]
68.6%
PERCENT IN LABOR FORCE
4.1%
UNEMPLOYMENT RATE
White Oak Zip Codes
White Oak Area Codes
Income in White Oak
Income Overview in White Oak
Per Capita Income in White Oak is $31,491, while median incomes of families and households are $93,939 and $94,273 respectively.
| Characteristic | Number | Measure |
| Per Capita Income | 6,227 | $31,491 |
| Median Family Income | 1,825 | $93,939 |
| Mean Family Income | 1,825 | $98,586 |
| Median Household Income | 2,140 | $94,273 |
| Mean Household Income | 2,140 | $96,512 |
| Income Deficit | 1,825 | $0 |
| Wage / Income Gap (%) | 6,227 | 36.44% |
| Wage / Income Gap ($) | 6,227 | 63.56¢ per $1 |
| Gini / Inequality Index | 6,227 | 0.39 |
Earnings by Sex in White Oak
Average Earnings in White Oak are $33,302, $49,111 for men and $31,217 for women, a difference of 36.4%.
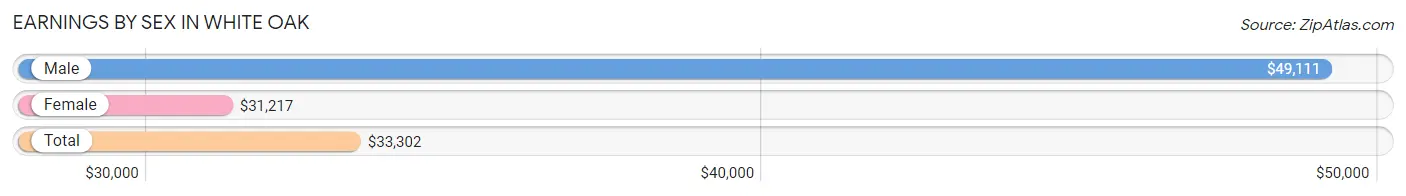
| Sex | Number | Average Earnings |
| Male | 1,709 (48.8%) | $49,111 |
| Female | 1,790 (51.2%) | $31,217 |
| Total | 3,499 (100.0%) | $33,302 |
Earnings by Sex by Income Bracket in White Oak
The most common earnings brackets in White Oak are $75,000 to $99,999 for men (358 | 20.9%) and $30,000 to $34,999 for women (375 | 20.9%).
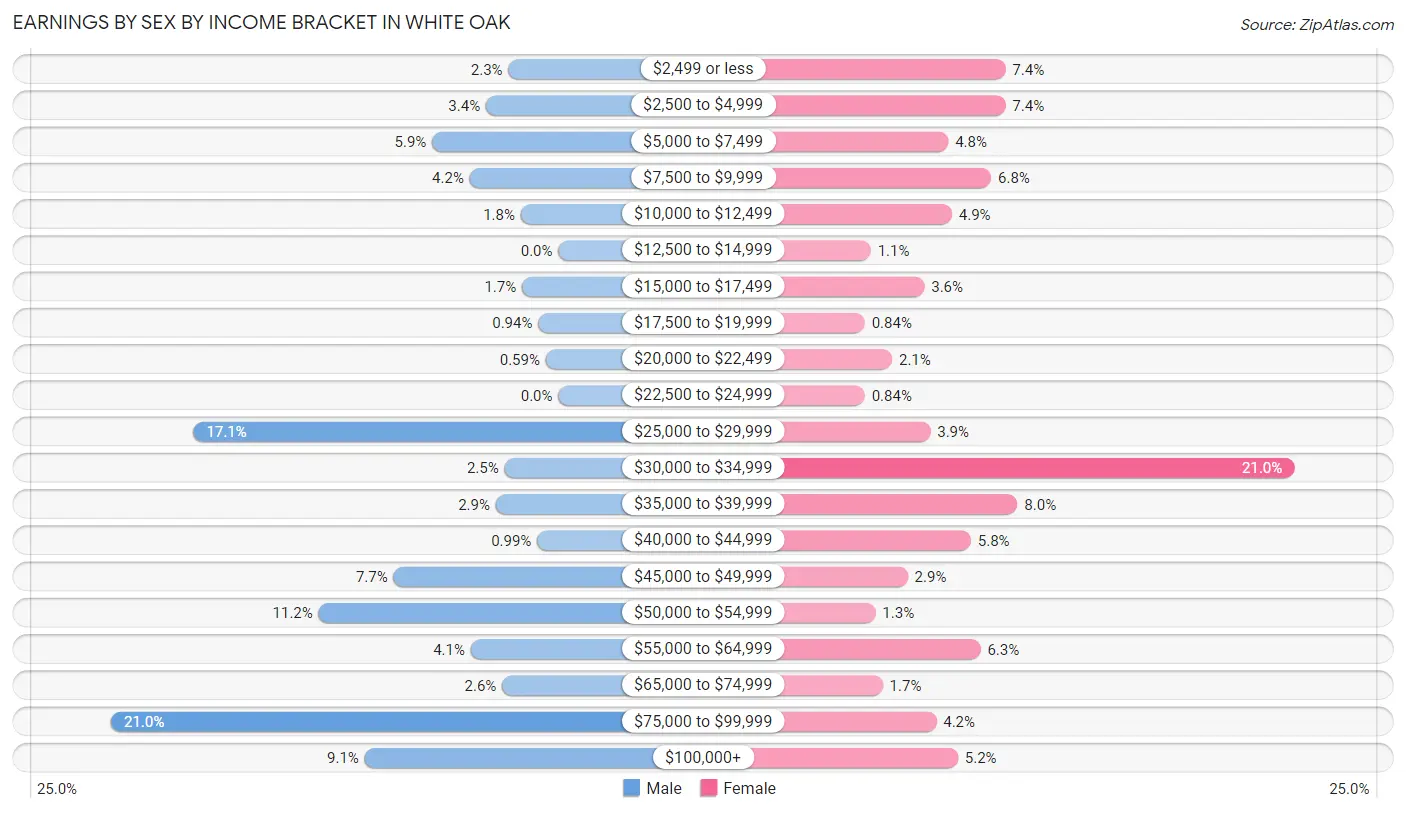
| Income | Male | Female |
| $2,499 or less | 40 (2.3%) | 133 (7.4%) |
| $2,500 to $4,999 | 58 (3.4%) | 133 (7.4%) |
| $5,000 to $7,499 | 101 (5.9%) | 85 (4.8%) |
| $7,500 to $9,999 | 71 (4.2%) | 121 (6.8%) |
| $10,000 to $12,499 | 30 (1.8%) | 88 (4.9%) |
| $12,500 to $14,999 | 0 (0.0%) | 20 (1.1%) |
| $15,000 to $17,499 | 29 (1.7%) | 65 (3.6%) |
| $17,500 to $19,999 | 16 (0.9%) | 15 (0.8%) |
| $20,000 to $22,499 | 10 (0.6%) | 38 (2.1%) |
| $22,500 to $24,999 | 0 (0.0%) | 15 (0.8%) |
| $25,000 to $29,999 | 292 (17.1%) | 70 (3.9%) |
| $30,000 to $34,999 | 43 (2.5%) | 375 (20.9%) |
| $35,000 to $39,999 | 50 (2.9%) | 143 (8.0%) |
| $40,000 to $44,999 | 17 (1.0%) | 104 (5.8%) |
| $45,000 to $49,999 | 132 (7.7%) | 51 (2.9%) |
| $50,000 to $54,999 | 192 (11.2%) | 24 (1.3%) |
| $55,000 to $64,999 | 70 (4.1%) | 112 (6.3%) |
| $65,000 to $74,999 | 45 (2.6%) | 30 (1.7%) |
| $75,000 to $99,999 | 358 (20.9%) | 75 (4.2%) |
| $100,000+ | 155 (9.1%) | 93 (5.2%) |
| Total | 1,709 (100.0%) | 1,790 (100.0%) |
Earnings by Sex by Educational Attainment in White Oak
Average earnings in White Oak are $52,941 for men and $31,935 for women, a difference of 39.7%. Men with an educational attainment of college or associate's degree enjoy the highest average annual earnings of $77,794, while those with less than high school education earn the least with $29,321. Women with an educational attainment of high school diploma earn the most with the average annual earnings of $33,770, while those with less than high school education have the smallest earnings of $4,125.
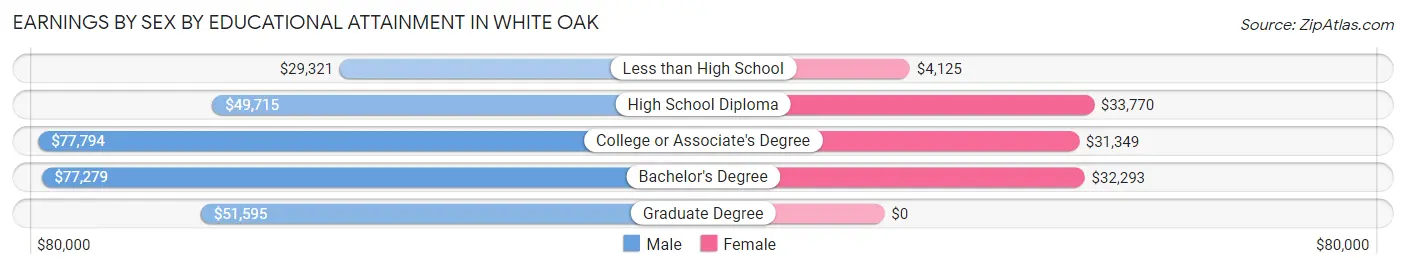
| Educational Attainment | Male Income | Female Income |
| Less than High School | $29,321 | $4,125 |
| High School Diploma | $49,715 | $33,770 |
| College or Associate's Degree | $77,794 | $31,349 |
| Bachelor's Degree | $77,279 | $32,293 |
| Graduate Degree | $51,595 | $0 |
| Total | $52,941 | $31,935 |
Family Income in White Oak
Family Income Brackets in White Oak
According to the White Oak family income data, there are 480 families falling into the $100,000 to $149,999 income range, which is the most common income bracket and makes up 26.3% of all families.
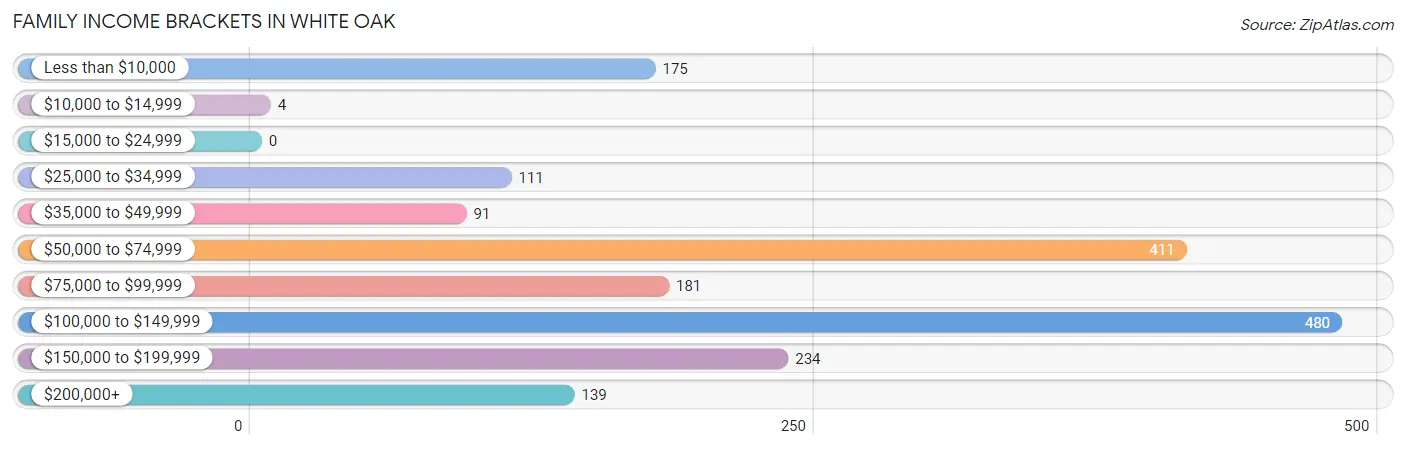
| Income Bracket | # Families | % Families |
| Less than $10,000 | 175 | 9.6% |
| $10,000 to $14,999 | 4 | 0.2% |
| $15,000 to $24,999 | 0 | 0.0% |
| $25,000 to $34,999 | 111 | 6.1% |
| $35,000 to $49,999 | 91 | 5.0% |
| $50,000 to $74,999 | 411 | 22.5% |
| $75,000 to $99,999 | 181 | 9.9% |
| $100,000 to $149,999 | 480 | 26.3% |
| $150,000 to $199,999 | 234 | 12.8% |
| $200,000+ | 139 | 7.6% |
Family Income by Famaliy Size in White Oak
5-person families (288 | 15.8%) account for the highest median family income in White Oak with $175,302 per family, while 5-person families (288 | 15.8%) have the highest median income of $35,060 per family member.
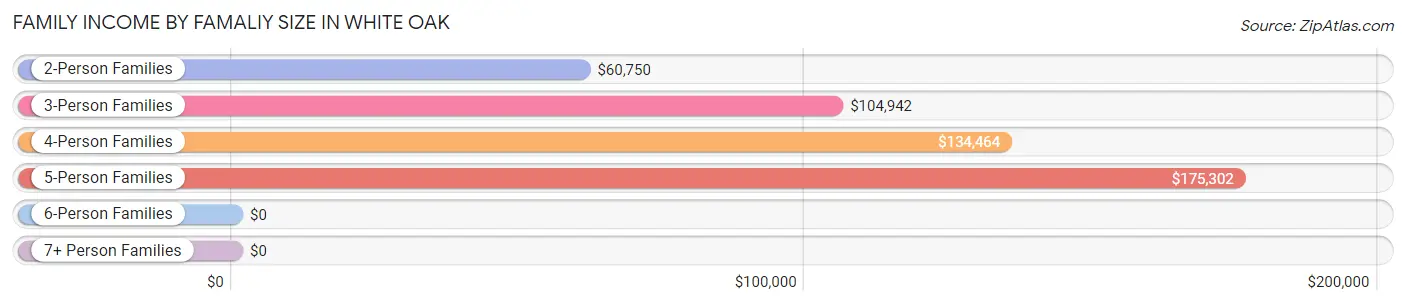
| Income Bracket | # Families | Median Income |
| 2-Person Families | 774 (42.4%) | $60,750 |
| 3-Person Families | 465 (25.5%) | $104,942 |
| 4-Person Families | 179 (9.8%) | $134,464 |
| 5-Person Families | 288 (15.8%) | $175,302 |
| 6-Person Families | 24 (1.3%) | $0 |
| 7+ Person Families | 95 (5.2%) | $0 |
| Total | 1,825 (100.0%) | $93,939 |
Family Income by Number of Earners in White Oak
The median family income in White Oak is $93,939, with families comprising 3+ earners (412) having the highest median family income of $114,412, while families with no earners (193) have the lowest median family income of $52,966, accounting for 22.6% and 10.6% of families, respectively.
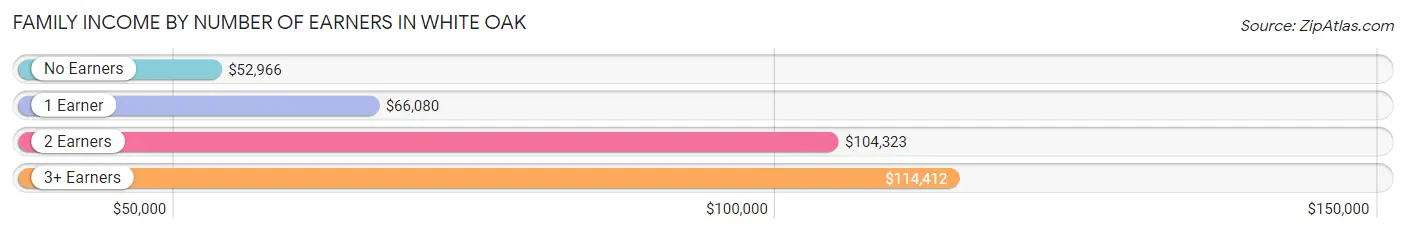
| Number of Earners | # Families | Median Income |
| No Earners | 193 (10.6%) | $52,966 |
| 1 Earner | 533 (29.2%) | $66,080 |
| 2 Earners | 687 (37.6%) | $104,323 |
| 3+ Earners | 412 (22.6%) | $114,412 |
| Total | 1,825 (100.0%) | $93,939 |
Household Income in White Oak
Household Income Brackets in White Oak
With 591 households falling in the category, the $100,000 to $149,999 income range is the most frequent in White Oak, accounting for 27.6% of all households. In contrast, only 15 households (0.7%) fall into the $10,000 to $14,999 income bracket, making it the least populous group.
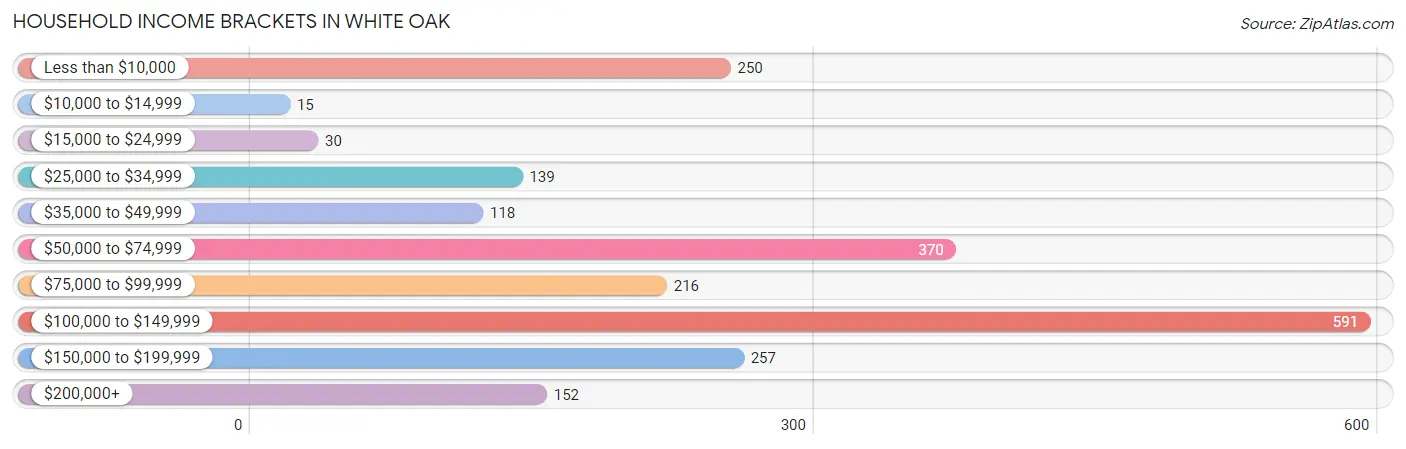
| Income Bracket | # Households | % Households |
| Less than $10,000 | 250 | 11.7% |
| $10,000 to $14,999 | 15 | 0.7% |
| $15,000 to $24,999 | 30 | 1.4% |
| $25,000 to $34,999 | 139 | 6.5% |
| $35,000 to $49,999 | 118 | 5.5% |
| $50,000 to $74,999 | 370 | 17.3% |
| $75,000 to $99,999 | 216 | 10.1% |
| $100,000 to $149,999 | 591 | 27.6% |
| $150,000 to $199,999 | 257 | 12.0% |
| $200,000+ | 152 | 7.1% |
Household Income by Householder Age in White Oak
The median household income in White Oak is $94,273, with the highest median household income of $114,442 found in the 45 to 64 years age bracket for the primary householder. A total of 900 households (42.1%) fall into this category. Meanwhile, the 15 to 24 years age bracket for the primary householder has the lowest median household income of $0, with 12 households (0.6%) in this group.
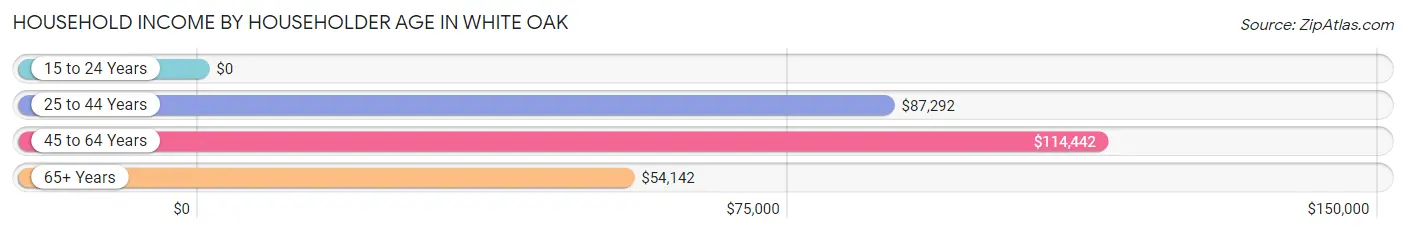
| Income Bracket | # Households | Median Income |
| 15 to 24 Years | 12 (0.6%) | $0 |
| 25 to 44 Years | 780 (36.4%) | $87,292 |
| 45 to 64 Years | 900 (42.1%) | $114,442 |
| 65+ Years | 448 (20.9%) | $54,142 |
| Total | 2,140 (100.0%) | $94,273 |
Poverty in White Oak
Income Below Poverty by Sex and Age in White Oak
With 8.3% poverty level for males and 11.8% for females among the residents of White Oak, 18 to 24 year old males and 18 to 24 year old females are the most vulnerable to poverty, with 83 males (30.3%) and 80 females (69.0%) in their respective age groups living below the poverty level.
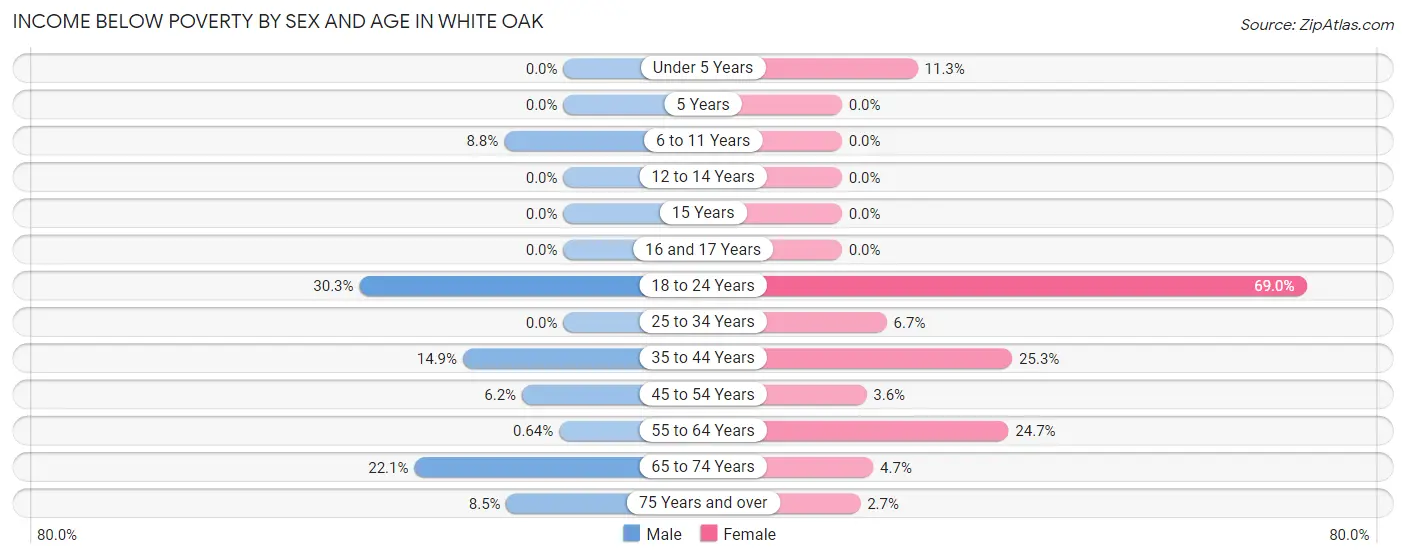
| Age Bracket | Male | Female |
| Under 5 Years | 0 (0.0%) | 34 (11.3%) |
| 5 Years | 0 (0.0%) | 0 (0.0%) |
| 6 to 11 Years | 46 (8.8%) | 0 (0.0%) |
| 12 to 14 Years | 0 (0.0%) | 0 (0.0%) |
| 15 Years | 0 (0.0%) | 0 (0.0%) |
| 16 and 17 Years | 0 (0.0%) | 0 (0.0%) |
| 18 to 24 Years | 83 (30.3%) | 80 (69.0%) |
| 25 to 34 Years | 0 (0.0%) | 40 (6.7%) |
| 35 to 44 Years | 54 (14.9%) | 83 (25.3%) |
| 45 to 54 Years | 28 (6.1%) | 20 (3.6%) |
| 55 to 64 Years | 3 (0.6%) | 96 (24.7%) |
| 65 to 74 Years | 27 (22.1%) | 13 (4.7%) |
| 75 Years and over | 12 (8.5%) | 4 (2.7%) |
| Total | 253 (8.3%) | 370 (11.8%) |
Income Above Poverty by Sex and Age in White Oak
According to the poverty statistics in White Oak, males aged under 5 years and females aged 5 years are the age groups that are most secure financially, with 100.0% of males and 100.0% of females in these age groups living above the poverty line.
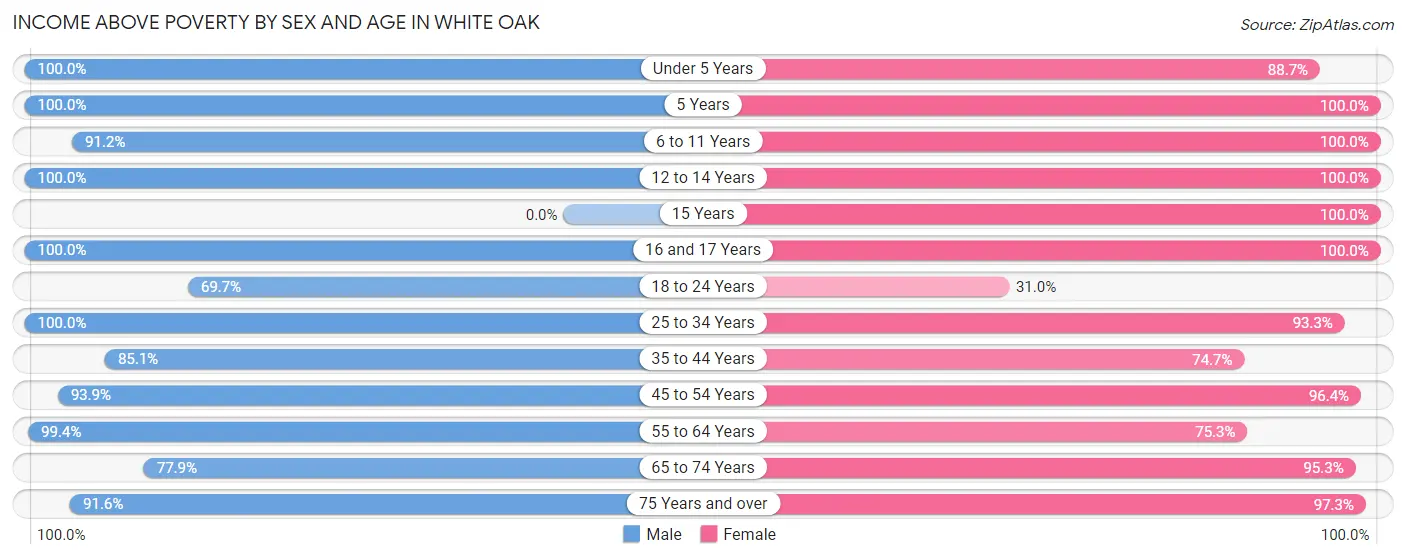
| Age Bracket | Male | Female |
| Under 5 Years | 108 (100.0%) | 268 (88.7%) |
| 5 Years | 24 (100.0%) | 28 (100.0%) |
| 6 to 11 Years | 476 (91.2%) | 209 (100.0%) |
| 12 to 14 Years | 114 (100.0%) | 90 (100.0%) |
| 15 Years | 0 (0.0%) | 27 (100.0%) |
| 16 and 17 Years | 43 (100.0%) | 79 (100.0%) |
| 18 to 24 Years | 191 (69.7%) | 36 (31.0%) |
| 25 to 34 Years | 423 (100.0%) | 561 (93.3%) |
| 35 to 44 Years | 308 (85.1%) | 245 (74.7%) |
| 45 to 54 Years | 427 (93.9%) | 530 (96.4%) |
| 55 to 64 Years | 465 (99.4%) | 292 (75.3%) |
| 65 to 74 Years | 95 (77.9%) | 266 (95.3%) |
| 75 Years and over | 130 (91.5%) | 142 (97.3%) |
| Total | 2,804 (91.7%) | 2,773 (88.2%) |
Income Below Poverty Among Married-Couple Families in White Oak
The poverty statistics for married-couple families in White Oak show that 5.2% or 65 of the total 1,253 families live below the poverty line. Families with no children have the highest poverty rate of 7.5%, comprising of 65 families. On the other hand, families with 1 or 2 children have the lowest poverty rate of 0.0%, which includes 0 families.
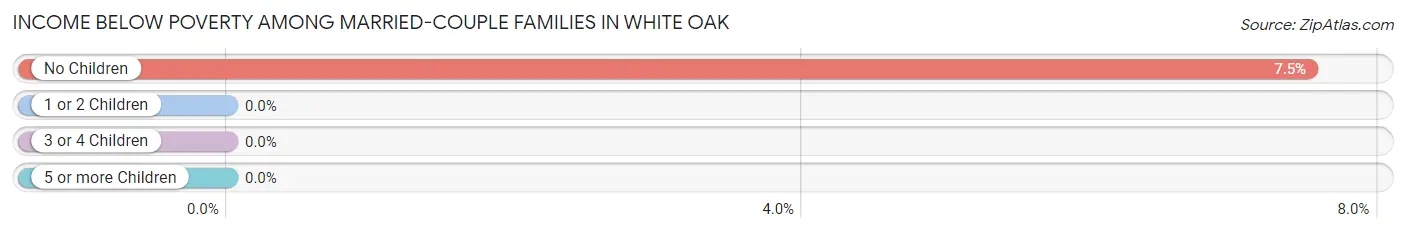
| Children | Above Poverty | Below Poverty |
| No Children | 799 (92.5%) | 65 (7.5%) |
| 1 or 2 Children | 216 (100.0%) | 0 (0.0%) |
| 3 or 4 Children | 173 (100.0%) | 0 (0.0%) |
| 5 or more Children | 0 (0.0%) | 0 (0.0%) |
| Total | 1,188 (94.8%) | 65 (5.2%) |
Income Below Poverty Among Single-Parent Households in White Oak
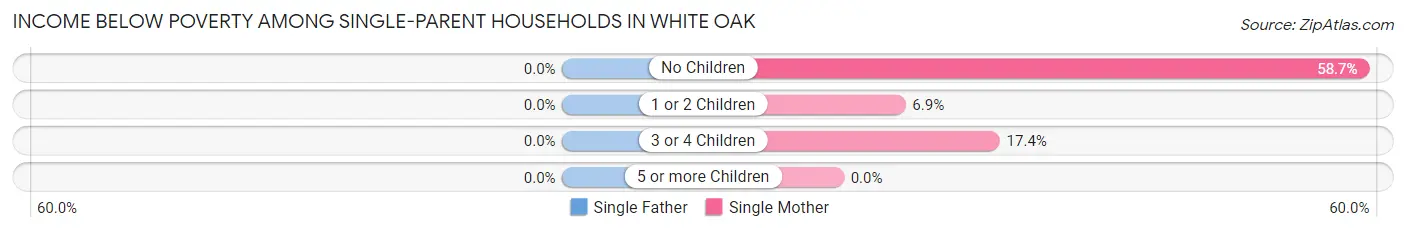
| Children | Single Father | Single Mother |
| No Children | 0 (0.0%) | 84 (58.7%) |
| 1 or 2 Children | 0 (0.0%) | 12 (6.9%) |
| 3 or 4 Children | 0 (0.0%) | 19 (17.4%) |
| 5 or more Children | 0 (0.0%) | 0 (0.0%) |
| Total | 0 (0.0%) | 115 (27.0%) |
Income Below Poverty Among Married-Couple vs Single-Parent Households in White Oak
The poverty data for White Oak shows that 65 of the married-couple family households (5.2%) and 115 of the single-parent households (20.1%) are living below the poverty level. Within the married-couple family households, those with no children have the highest poverty rate, with 65 households (7.5%) falling below the poverty line. Among the single-parent households, those with no children have the highest poverty rate, with 84 household (36.8%) living below poverty.
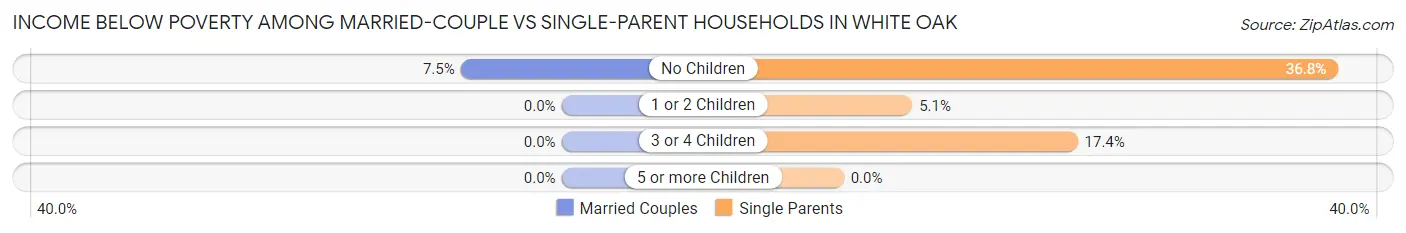
| Children | Married-Couple Families | Single-Parent Households |
| No Children | 65 (7.5%) | 84 (36.8%) |
| 1 or 2 Children | 0 (0.0%) | 12 (5.1%) |
| 3 or 4 Children | 0 (0.0%) | 19 (17.4%) |
| 5 or more Children | 0 (0.0%) | 0 (0.0%) |
| Total | 65 (5.2%) | 115 (20.1%) |
Race in White Oak
The most populous races in White Oak are White / Caucasian (4,700 | 75.5%), Hispanic or Latino (1,325 | 21.3%), and Two or more Races (1,129 | 18.1%).
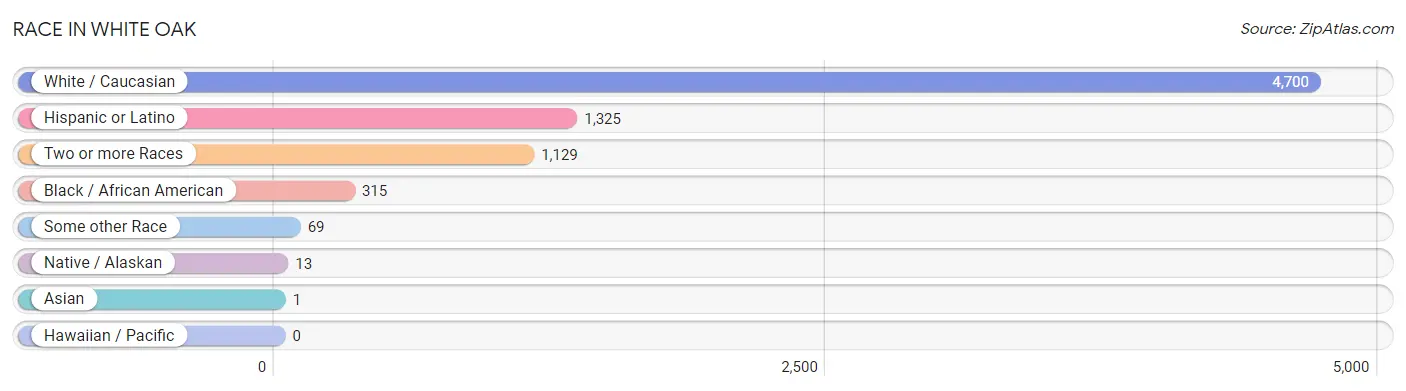
| Race | # Population | % Population |
| Asian | 1 | 0.0% |
| Black / African American | 315 | 5.1% |
| Hawaiian / Pacific | 0 | 0.0% |
| Hispanic or Latino | 1,325 | 21.3% |
| Native / Alaskan | 13 | 0.2% |
| White / Caucasian | 4,700 | 75.5% |
| Two or more Races | 1,129 | 18.1% |
| Some other Race | 69 | 1.1% |
| Total | 6,227 | 100.0% |
Ancestry in White Oak
The most populous ancestries reported in White Oak are American (1,380 | 22.2%), Mexican (1,155 | 18.5%), English (920 | 14.8%), German (595 | 9.6%), and Irish (513 | 8.2%), together accounting for 73.3% of all White Oak residents.
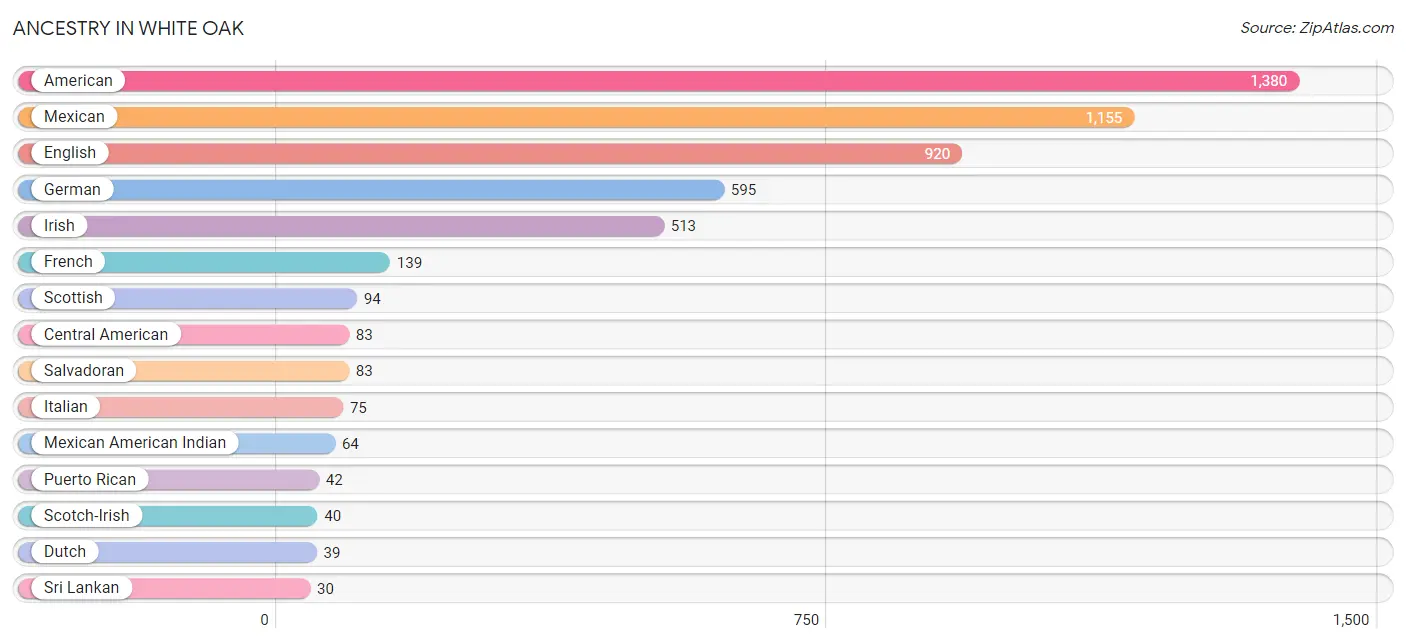
| Ancestry | # Population | % Population |
| American | 1,380 | 22.2% |
| Armenian | 14 | 0.2% |
| Central American | 83 | 1.3% |
| Cherokee | 4 | 0.1% |
| Chippewa | 2 | 0.0% |
| Choctaw | 13 | 0.2% |
| Cuban | 17 | 0.3% |
| Dutch | 39 | 0.6% |
| English | 920 | 14.8% |
| European | 9 | 0.1% |
| French | 139 | 2.2% |
| German | 595 | 9.6% |
| Icelander | 25 | 0.4% |
| Irish | 513 | 8.2% |
| Italian | 75 | 1.2% |
| Mexican | 1,155 | 18.5% |
| Mexican American Indian | 64 | 1.0% |
| New Zealander | 12 | 0.2% |
| Pakistani | 1 | 0.0% |
| Polish | 2 | 0.0% |
| Puerto Rican | 42 | 0.7% |
| Salvadoran | 83 | 1.3% |
| Scotch-Irish | 40 | 0.6% |
| Scottish | 94 | 1.5% |
| Spanish | 3 | 0.1% |
| Sri Lankan | 30 | 0.5% | View All 26 Rows |
Immigrants in White Oak
The most numerous immigrant groups reported in White Oak came from Central America (285 | 4.6%), Latin America (285 | 4.6%), Mexico (285 | 4.6%), Canada (33 | 0.5%), and Oceania (12 | 0.2%), together accounting for 14.5% of all White Oak residents.
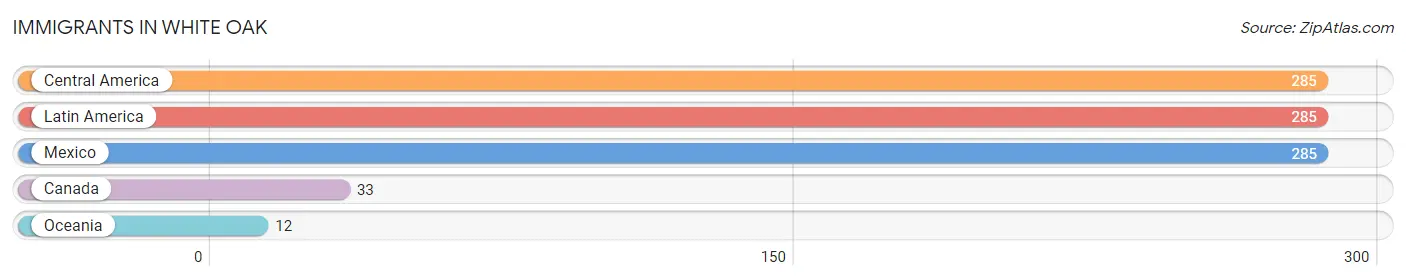
| Immigration Origin | # Population | % Population |
| Canada | 33 | 0.5% |
| Central America | 285 | 4.6% |
| Latin America | 285 | 4.6% |
| Mexico | 285 | 4.6% |
| Oceania | 12 | 0.2% | View All 5 Rows |
Sex and Age in White Oak
Sex and Age in White Oak
The most populous age groups in White Oak are 5 to 9 Years (462 | 15.1%) for men and 50 to 54 Years (431 | 13.6%) for women.
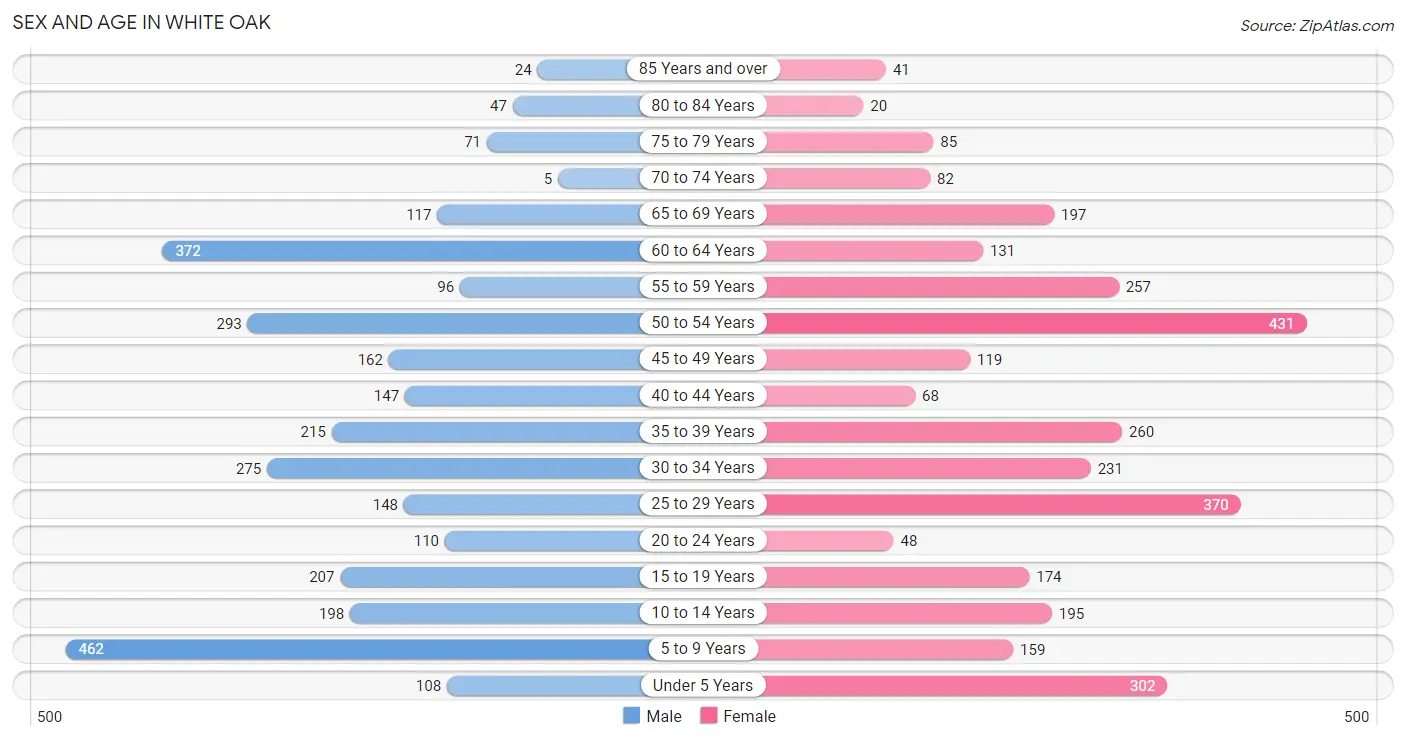
| Age Bracket | Male | Female |
| Under 5 Years | 108 (3.5%) | 302 (9.5%) |
| 5 to 9 Years | 462 (15.1%) | 159 (5.0%) |
| 10 to 14 Years | 198 (6.5%) | 195 (6.1%) |
| 15 to 19 Years | 207 (6.8%) | 174 (5.5%) |
| 20 to 24 Years | 110 (3.6%) | 48 (1.5%) |
| 25 to 29 Years | 148 (4.8%) | 370 (11.7%) |
| 30 to 34 Years | 275 (9.0%) | 231 (7.3%) |
| 35 to 39 Years | 215 (7.0%) | 260 (8.2%) |
| 40 to 44 Years | 147 (4.8%) | 68 (2.1%) |
| 45 to 49 Years | 162 (5.3%) | 119 (3.7%) |
| 50 to 54 Years | 293 (9.6%) | 431 (13.6%) |
| 55 to 59 Years | 96 (3.1%) | 257 (8.1%) |
| 60 to 64 Years | 372 (12.2%) | 131 (4.1%) |
| 65 to 69 Years | 117 (3.8%) | 197 (6.2%) |
| 70 to 74 Years | 5 (0.2%) | 82 (2.6%) |
| 75 to 79 Years | 71 (2.3%) | 85 (2.7%) |
| 80 to 84 Years | 47 (1.5%) | 20 (0.6%) |
| 85 Years and over | 24 (0.8%) | 41 (1.3%) |
| Total | 3,057 (100.0%) | 3,170 (100.0%) |
Families and Households in White Oak
Median Family Size in White Oak
The median family size in White Oak is 3.11 persons per family, with single female/mother families (426 | 23.3%) accounting for the largest median family size of 3.18 persons per family. On the other hand, single male/father families (146 | 8.0%) represent the smallest median family size with 2.76 persons per family.
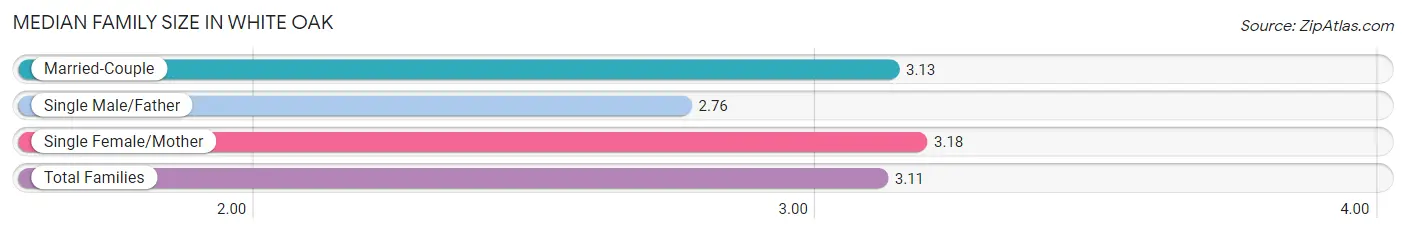
| Family Type | # Families | Family Size |
| Married-Couple | 1,253 (68.7%) | 3.13 |
| Single Male/Father | 146 (8.0%) | 2.76 |
| Single Female/Mother | 426 (23.3%) | 3.18 |
| Total Families | 1,825 (100.0%) | 3.11 |
Median Household Size in White Oak
The median household size in White Oak is 2.91 persons per household, with single female/mother households (426 | 19.9%) accounting for the largest median household size of 3.37 persons per household. non-family households (315 | 14.7%) represent the smallest median household size with 1.43 persons per household.
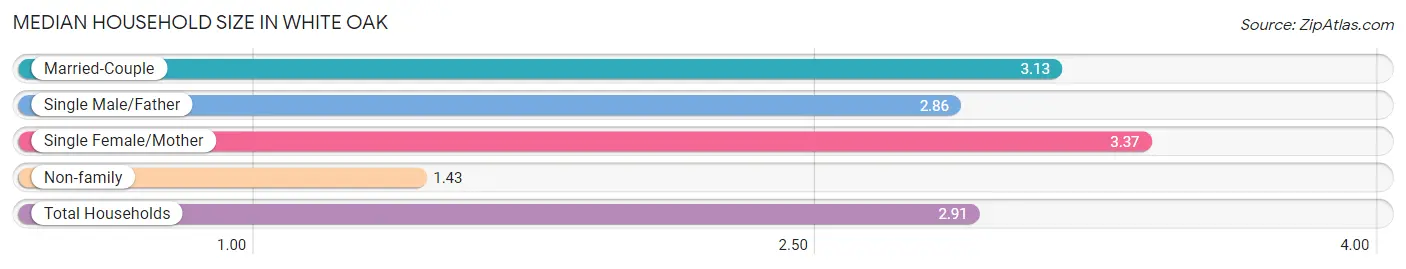
| Household Type | # Households | Household Size |
| Married-Couple | 1,253 (58.6%) | 3.13 |
| Single Male/Father | 146 (6.8%) | 2.86 |
| Single Female/Mother | 426 (19.9%) | 3.37 |
| Non-family | 315 (14.7%) | 1.43 |
| Total Households | 2,140 (100.0%) | 2.91 |
Household Size by Marriage Status in White Oak
Out of a total of 2,140 households in White Oak, 1,825 (85.3%) are family households, while 315 (14.7%) are nonfamily households. The most numerous type of family households are 2-person households, comprising 757, and the most common type of nonfamily households are 1-person households, comprising 219.
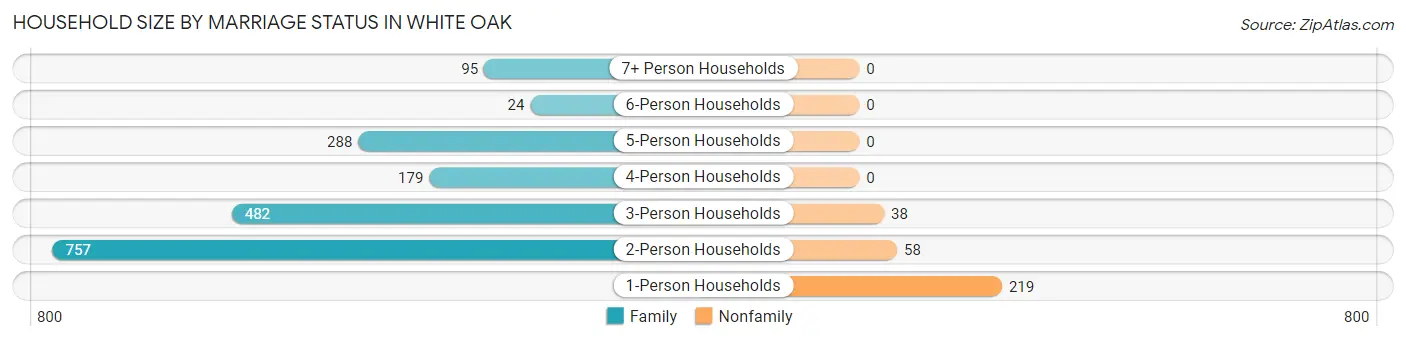
| Household Size | Family Households | Nonfamily Households |
| 1-Person Households | - | 219 (10.2%) |
| 2-Person Households | 757 (35.4%) | 58 (2.7%) |
| 3-Person Households | 482 (22.5%) | 38 (1.8%) |
| 4-Person Households | 179 (8.4%) | 0 (0.0%) |
| 5-Person Households | 288 (13.5%) | 0 (0.0%) |
| 6-Person Households | 24 (1.1%) | 0 (0.0%) |
| 7+ Person Households | 95 (4.4%) | 0 (0.0%) |
| Total | 1,825 (85.3%) | 315 (14.7%) |
Female Fertility in White Oak
Fertility by Age in White Oak
Average fertility rate in White Oak is 20.0 births per 1,000 women. Women in the age bracket of 20 to 34 years have the highest fertility rate with 40.0 births per 1,000 women. Women in the age bracket of 20 to 34 years acount for 100.0% of all women with births.
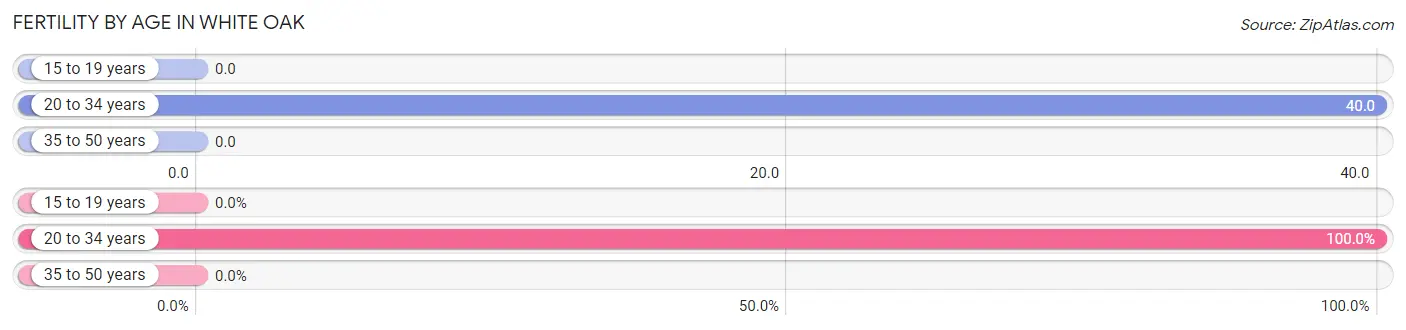
| Age Bracket | Women with Births | Births / 1,000 Women |
| 15 to 19 years | 0 (0.0%) | 0.0 |
| 20 to 34 years | 26 (100.0%) | 40.0 |
| 35 to 50 years | 0 (0.0%) | 0.0 |
| Total | 26 (100.0%) | 20.0 |
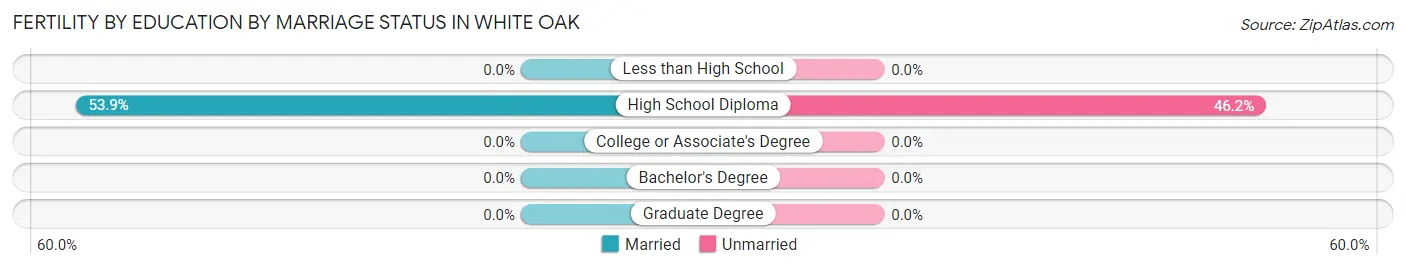
Fertility by Age by Marriage Status in White Oak
53.8% of women with births (26) in White Oak are married. The highest percentage of unmarried women with births falls into 20 to 34 years age bracket with 46.2% of them unmarried at the time of birth, while the lowest percentage of unmarried women with births belong to 20 to 34 years age bracket with 46.2% of them unmarried.
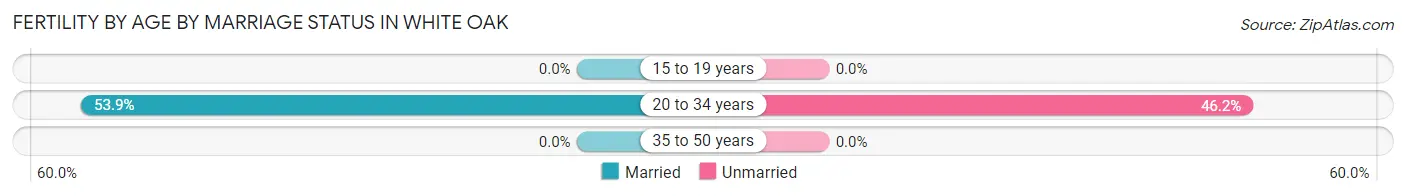
| Age Bracket | Married | Unmarried |
| 15 to 19 years | 0 (0.0%) | 0 (0.0%) |
| 20 to 34 years | 14 (53.8%) | 12 (46.2%) |
| 35 to 50 years | 0 (0.0%) | 0 (0.0%) |
| Total | 14 (53.8%) | 12 (46.2%) |
Fertility by Education in White Oak
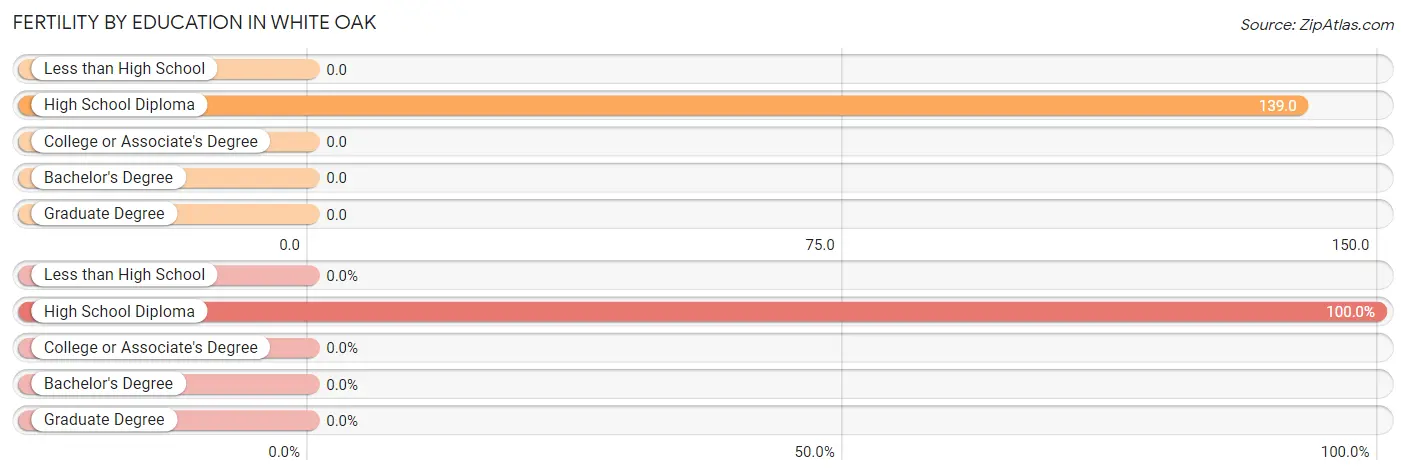
| Educational Attainment | Women with Births | Births / 1,000 Women |
| Less than High School | 0 (0.0%) | 0.0 |
| High School Diploma | 26 (100.0%) | 139.0 |
| College or Associate's Degree | 0 (0.0%) | 0.0 |
| Bachelor's Degree | 0 (0.0%) | 0.0 |
| Graduate Degree | 0 (0.0%) | 0.0 |
| Total | 26 (100.0%) | 20.0 |
Fertility by Education by Marriage Status in White Oak
46.2% of women with births in White Oak are unmarried. Women with the educational attainment of high school diploma are most likely to be married with 53.8% of them married at childbirth, while women with the educational attainment of high school diploma are least likely to be married with 46.2% of them unmarried at childbirth.
| Educational Attainment | Married | Unmarried |
| Less than High School | 0 (0.0%) | 0 (0.0%) |
| High School Diploma | 14 (53.8%) | 12 (46.2%) |
| College or Associate's Degree | 0 (0.0%) | 0 (0.0%) |
| Bachelor's Degree | 0 (0.0%) | 0 (0.0%) |
| Graduate Degree | 0 (0.0%) | 0 (0.0%) |
| Total | 14 (53.8%) | 12 (46.2%) |
Employment Characteristics in White Oak
Employment by Class of Employer in White Oak
Among the 3,111 employed individuals in White Oak, private company employees (2,211 | 71.1%), local government employees (226 | 7.3%), and state government employees (203 | 6.5%) make up the most common classes of employment.
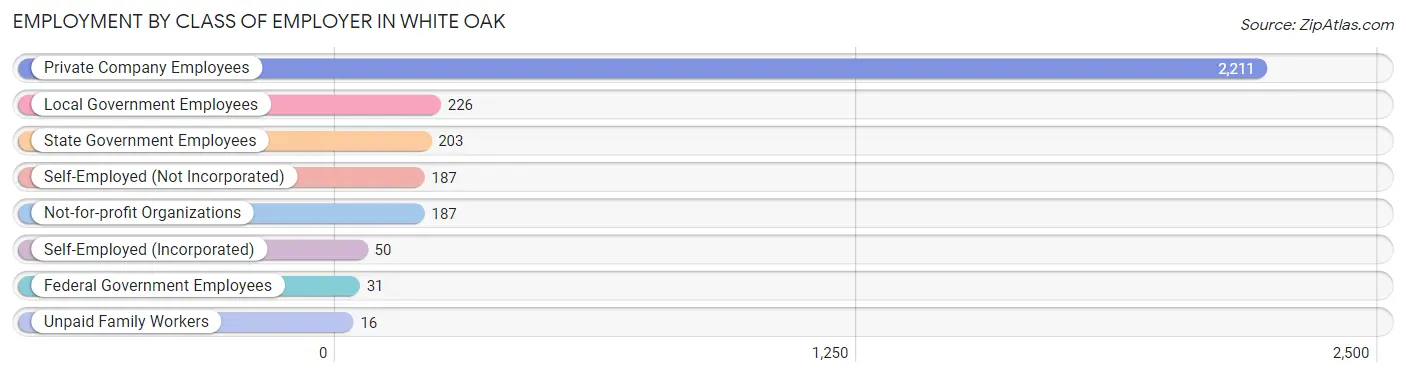
| Employer Class | # Employees | % Employees |
| Private Company Employees | 2,211 | 71.1% |
| Self-Employed (Incorporated) | 50 | 1.6% |
| Self-Employed (Not Incorporated) | 187 | 6.0% |
| Not-for-profit Organizations | 187 | 6.0% |
| Local Government Employees | 226 | 7.3% |
| State Government Employees | 203 | 6.5% |
| Federal Government Employees | 31 | 1.0% |
| Unpaid Family Workers | 16 | 0.5% |
| Total | 3,111 | 100.0% |
Employment Status by Age in White Oak
According to the labor force statistics for White Oak, out of the total population over 16 years of age (4,776), 68.6% or 3,276 individuals are in the labor force, with 4.1% or 134 of them unemployed. The age group with the highest labor force participation rate is 30 to 34 years, with 99.2% or 502 individuals in the labor force. Within the labor force, the 16 to 19 years age range has the highest percentage of unemployed individuals, with 30.8% or 48 of them being unemployed.
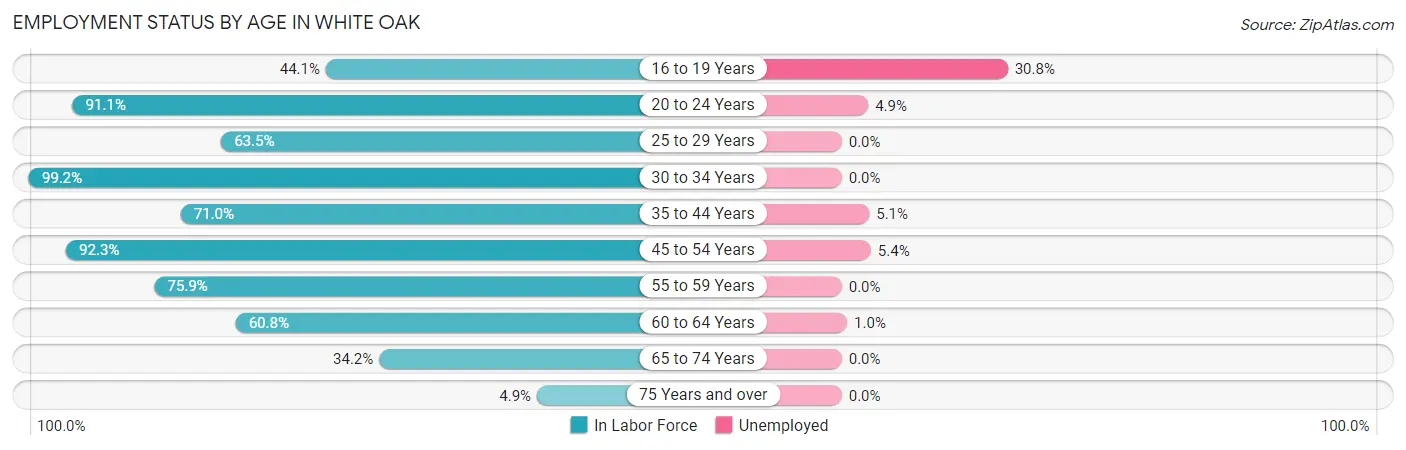
| Age Bracket | In Labor Force | Unemployed |
| 16 to 19 Years | 156 (44.1%) | 48 (30.8%) |
| 20 to 24 Years | 144 (91.1%) | 7 (4.9%) |
| 25 to 29 Years | 329 (63.5%) | 0 (0.0%) |
| 30 to 34 Years | 502 (99.2%) | 0 (0.0%) |
| 35 to 44 Years | 490 (71.0%) | 25 (5.1%) |
| 45 to 54 Years | 928 (92.3%) | 50 (5.4%) |
| 55 to 59 Years | 268 (75.9%) | 0 (0.0%) |
| 60 to 64 Years | 306 (60.8%) | 3 (1.0%) |
| 65 to 74 Years | 137 (34.2%) | 0 (0.0%) |
| 75 Years and over | 14 (4.9%) | 0 (0.0%) |
| Total | 3,276 (68.6%) | 134 (4.1%) |
Employment Status by Educational Attainment in White Oak
According to labor force statistics for White Oak, 79.0% of individuals (2,824) out of the total population between 25 and 64 years of age (3,575) are in the labor force, with 2.8% or 79 of them being unemployed. The group with the highest labor force participation rate are those with the educational attainment of less than high school, with 100.0% or 409 individuals in the labor force. Within the labor force, individuals with bachelor's degree or higher education have the highest percentage of unemployment, with 9.5% or 75 of them being unemployed.
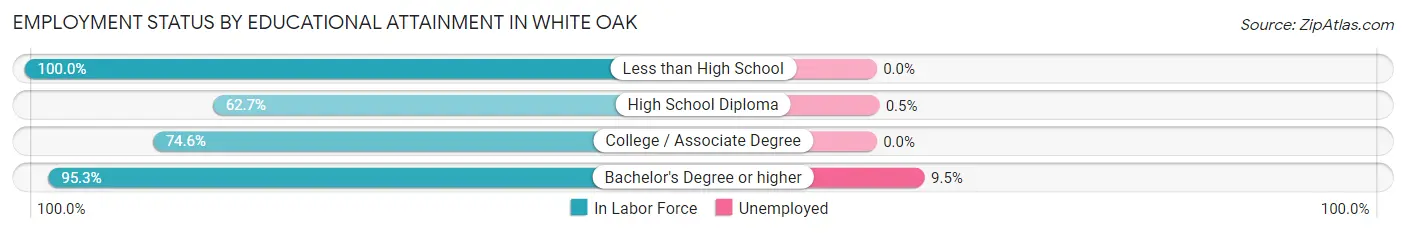
| Educational Attainment | In Labor Force | Unemployed |
| Less than High School | 409 (100.0%) | 0 (0.0%) |
| High School Diploma | 632 (62.7%) | 5 (0.5%) |
| College / Associate Degree | 991 (74.6%) | 0 (0.0%) |
| Bachelor's Degree or higher | 790 (95.3%) | 79 (9.5%) |
| Total | 2,824 (79.0%) | 100 (2.8%) |
Employment Occupations by Sex in White Oak
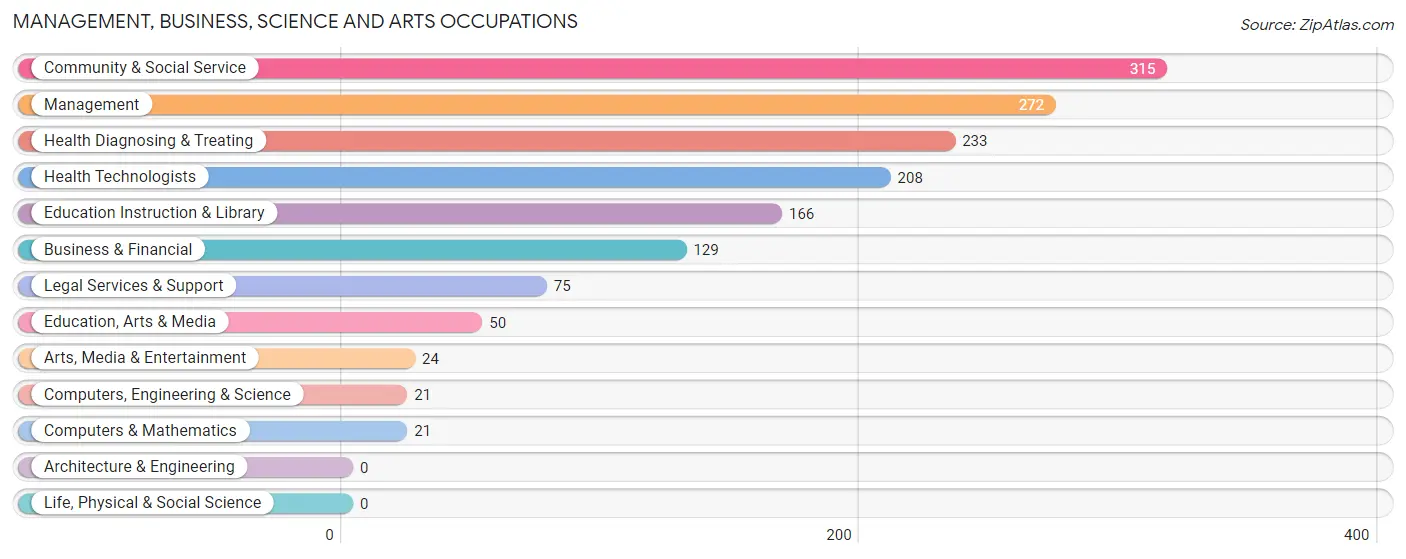
Management, Business, Science and Arts Occupations
The most common Management, Business, Science and Arts occupations in White Oak are Community & Social Service (315 | 10.0%), Management (272 | 8.7%), Health Diagnosing & Treating (233 | 7.4%), Health Technologists (208 | 6.6%), and Education Instruction & Library (166 | 5.3%).
Management, Business, Science and Arts Occupations by Sex
Within the Management, Business, Science and Arts occupations in White Oak, the most male-oriented occupations are Business & Financial (66.7%), Education Instruction & Library (55.4%), and Management (50.4%), while the most female-oriented occupations are Computers, Engineering & Science (100.0%), Computers & Mathematics (100.0%), and Legal Services & Support (100.0%).
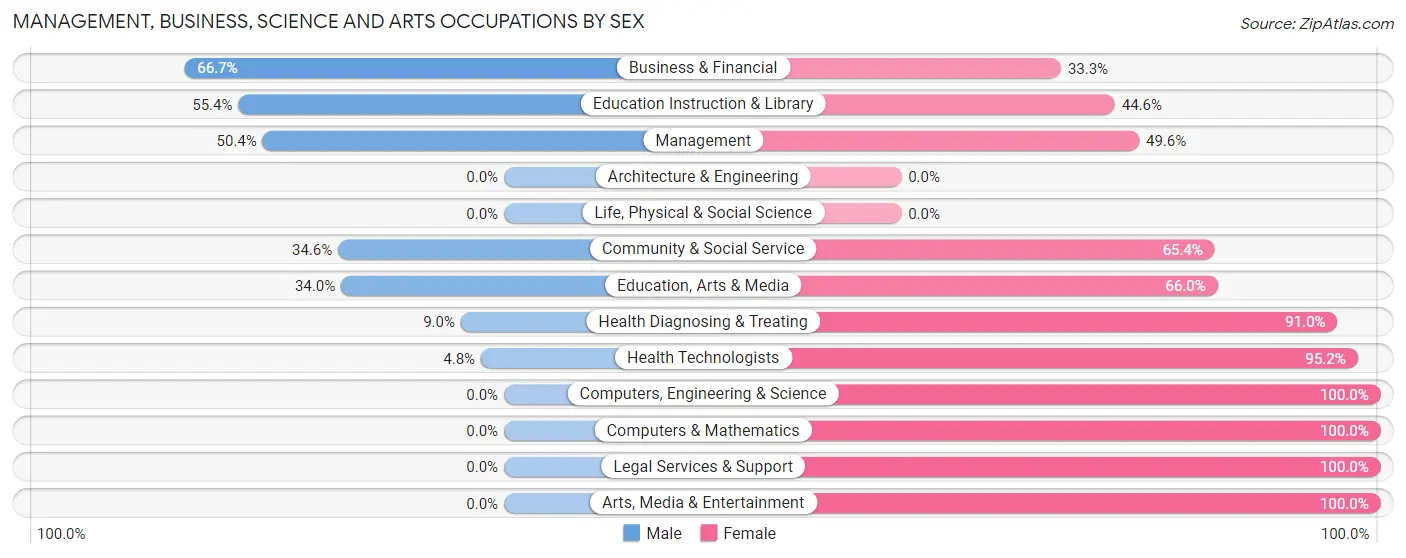
| Occupation | Male | Female |
| Management | 137 (50.4%) | 135 (49.6%) |
| Business & Financial | 86 (66.7%) | 43 (33.3%) |
| Computers, Engineering & Science | 0 (0.0%) | 21 (100.0%) |
| Computers & Mathematics | 0 (0.0%) | 21 (100.0%) |
| Architecture & Engineering | 0 (0.0%) | 0 (0.0%) |
| Life, Physical & Social Science | 0 (0.0%) | 0 (0.0%) |
| Community & Social Service | 109 (34.6%) | 206 (65.4%) |
| Education, Arts & Media | 17 (34.0%) | 33 (66.0%) |
| Legal Services & Support | 0 (0.0%) | 75 (100.0%) |
| Education Instruction & Library | 92 (55.4%) | 74 (44.6%) |
| Arts, Media & Entertainment | 0 (0.0%) | 24 (100.0%) |
| Health Diagnosing & Treating | 21 (9.0%) | 212 (91.0%) |
| Health Technologists | 10 (4.8%) | 198 (95.2%) |
| Total (Category) | 353 (36.4%) | 617 (63.6%) |
| Total (Overall) | 1,462 (46.6%) | 1,679 (53.4%) |
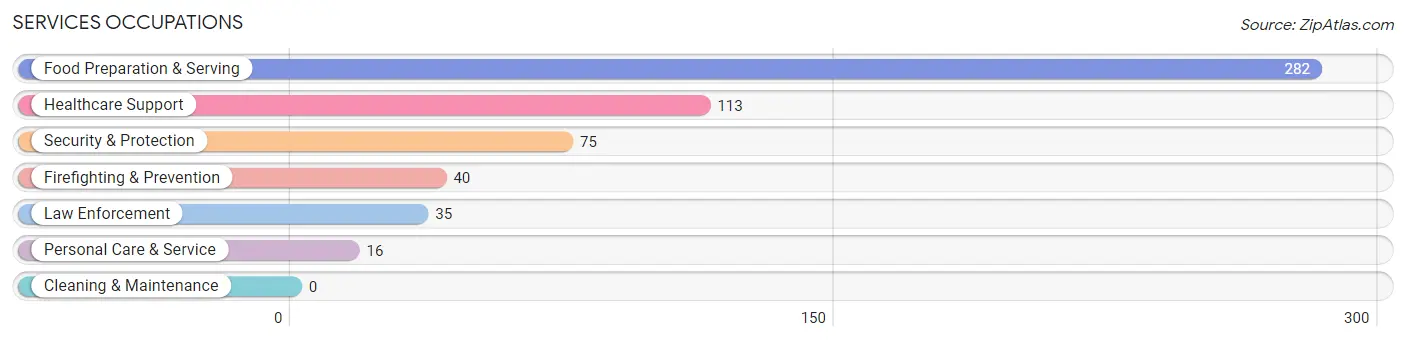
Services Occupations
The most common Services occupations in White Oak are Food Preparation & Serving (282 | 9.0%), Healthcare Support (113 | 3.6%), Security & Protection (75 | 2.4%), Firefighting & Prevention (40 | 1.3%), and Law Enforcement (35 | 1.1%).
Services Occupations by Sex
Within the Services occupations in White Oak, the most male-oriented occupations are Law Enforcement (100.0%), Security & Protection (80.0%), and Firefighting & Prevention (62.5%), while the most female-oriented occupations are Personal Care & Service (100.0%), Food Preparation & Serving (88.6%), and Healthcare Support (84.1%).
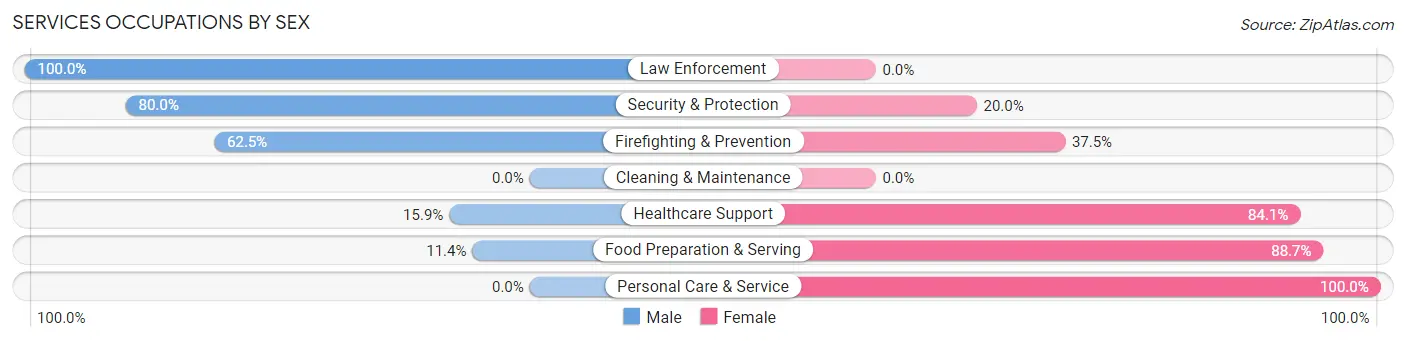
| Occupation | Male | Female |
| Healthcare Support | 18 (15.9%) | 95 (84.1%) |
| Security & Protection | 60 (80.0%) | 15 (20.0%) |
| Firefighting & Prevention | 25 (62.5%) | 15 (37.5%) |
| Law Enforcement | 35 (100.0%) | 0 (0.0%) |
| Food Preparation & Serving | 32 (11.4%) | 250 (88.6%) |
| Cleaning & Maintenance | 0 (0.0%) | 0 (0.0%) |
| Personal Care & Service | 0 (0.0%) | 16 (100.0%) |
| Total (Category) | 110 (22.6%) | 376 (77.4%) |
| Total (Overall) | 1,462 (46.6%) | 1,679 (53.4%) |
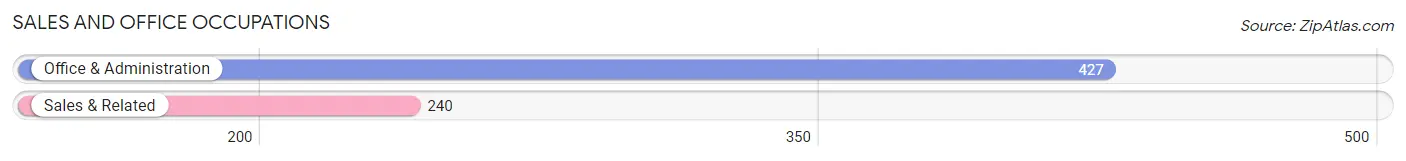
Sales and Office Occupations
The most common Sales and Office occupations in White Oak are Office & Administration (427 | 13.6%), and Sales & Related (240 | 7.6%).
Sales and Office Occupations by Sex
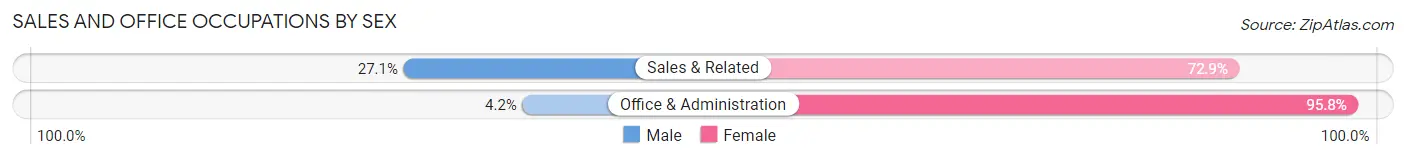
| Occupation | Male | Female |
| Sales & Related | 65 (27.1%) | 175 (72.9%) |
| Office & Administration | 18 (4.2%) | 409 (95.8%) |
| Total (Category) | 83 (12.4%) | 584 (87.6%) |
| Total (Overall) | 1,462 (46.6%) | 1,679 (53.4%) |
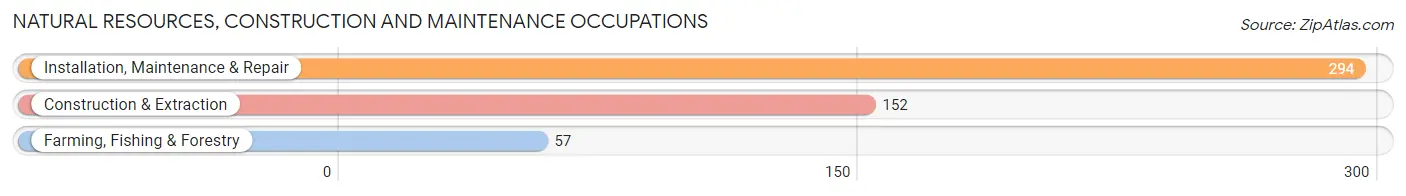
Natural Resources, Construction and Maintenance Occupations
The most common Natural Resources, Construction and Maintenance occupations in White Oak are Installation, Maintenance & Repair (294 | 9.4%), Construction & Extraction (152 | 4.8%), and Farming, Fishing & Forestry (57 | 1.8%).
Natural Resources, Construction and Maintenance Occupations by Sex
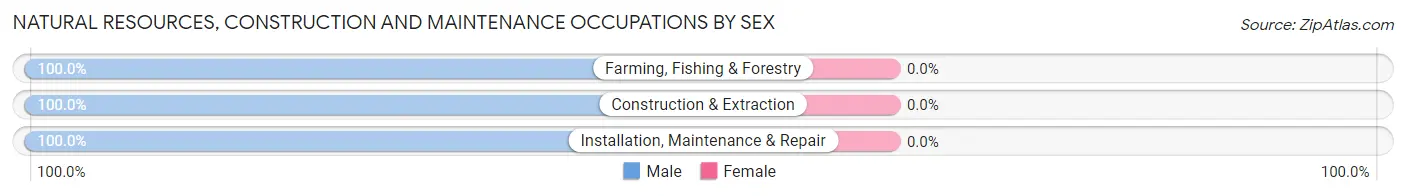
| Occupation | Male | Female |
| Farming, Fishing & Forestry | 57 (100.0%) | 0 (0.0%) |
| Construction & Extraction | 152 (100.0%) | 0 (0.0%) |
| Installation, Maintenance & Repair | 294 (100.0%) | 0 (0.0%) |
| Total (Category) | 503 (100.0%) | 0 (0.0%) |
| Total (Overall) | 1,462 (46.6%) | 1,679 (53.4%) |
Production, Transportation and Moving Occupations
The most common Production, Transportation and Moving occupations in White Oak are Material Moving (213 | 6.8%), Production (177 | 5.6%), and Transportation (125 | 4.0%).
Production, Transportation and Moving Occupations by Sex
| Occupation | Male | Female |
| Production | 87 (49.1%) | 90 (50.8%) |
| Transportation | 125 (100.0%) | 0 (0.0%) |
| Material Moving | 201 (94.4%) | 12 (5.6%) |
| Total (Category) | 413 (80.2%) | 102 (19.8%) |
| Total (Overall) | 1,462 (46.6%) | 1,679 (53.4%) |
Employment Industries by Sex in White Oak
Employment Industries in White Oak
The major employment industries in White Oak include Educational Services (434 | 13.8%), Health Care & Social Assistance (418 | 13.3%), Retail Trade (326 | 10.4%), Manufacturing (324 | 10.3%), and Finance & Insurance (215 | 6.8%).
Employment Industries by Sex in White Oak
The White Oak industries that see more men than women are Construction (100.0%), Utilities (100.0%), and Public Administration (100.0%), whereas the industries that tend to have a higher number of women are Information (100.0%), Real Estate, Rental & Leasing (100.0%), and Finance & Insurance (93.0%).
| Industry | Male | Female |
| Agriculture, Fishing & Hunting | 0 (0.0%) | 0 (0.0%) |
| Mining, Quarrying, & Extraction | 90 (92.8%) | 7 (7.2%) |
| Construction | 206 (100.0%) | 0 (0.0%) |
| Manufacturing | 220 (67.9%) | 104 (32.1%) |
| Wholesale Trade | 81 (79.4%) | 21 (20.6%) |
| Retail Trade | 166 (50.9%) | 160 (49.1%) |
| Transportation & Warehousing | 174 (97.8%) | 4 (2.2%) |
| Utilities | 121 (100.0%) | 0 (0.0%) |
| Information | 0 (0.0%) | 24 (100.0%) |
| Finance & Insurance | 15 (7.0%) | 200 (93.0%) |
| Real Estate, Rental & Leasing | 0 (0.0%) | 58 (100.0%) |
| Professional & Scientific | 48 (23.9%) | 153 (76.1%) |
| Enterprise Management | 0 (0.0%) | 0 (0.0%) |
| Administrative & Support | 18 (29.5%) | 43 (70.5%) |
| Educational Services | 111 (25.6%) | 323 (74.4%) |
| Health Care & Social Assistance | 34 (8.1%) | 384 (91.9%) |
| Arts, Entertainment & Recreation | 0 (0.0%) | 0 (0.0%) |
| Accommodation & Food Services | 32 (22.7%) | 109 (77.3%) |
| Public Administration | 105 (100.0%) | 0 (0.0%) |
| Total | 1,462 (46.6%) | 1,679 (53.4%) |
Education in White Oak
School Enrollment in White Oak
The most common levels of schooling among the 1,608 students in White Oak are elementary school (563 | 35.0%), middle school (369 | 23.0%), and high school (276 | 17.2%).
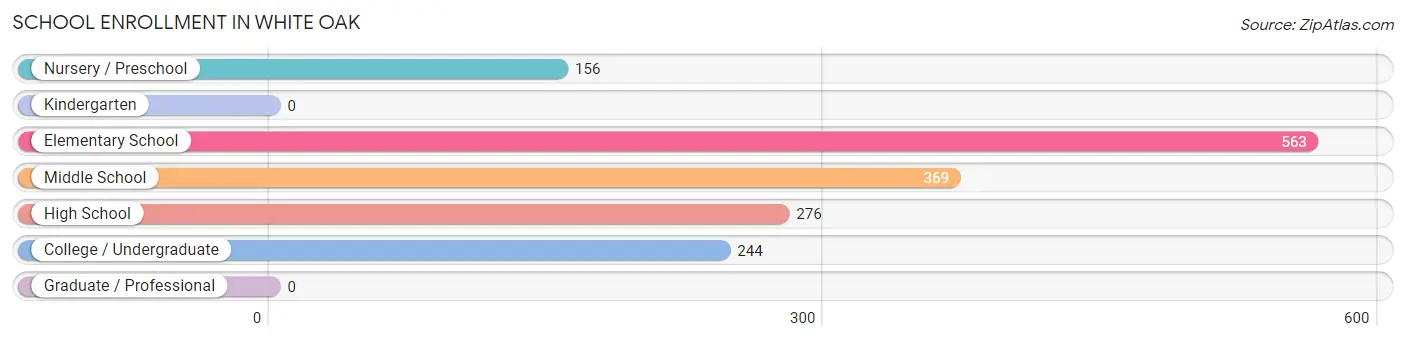
| School Level | # Students | % Students |
| Nursery / Preschool | 156 | 9.7% |
| Kindergarten | 0 | 0.0% |
| Elementary School | 563 | 35.0% |
| Middle School | 369 | 23.0% |
| High School | 276 | 17.2% |
| College / Undergraduate | 244 | 15.2% |
| Graduate / Professional | 0 | 0.0% |
| Total | 1,608 | 100.0% |
School Enrollment by Age by Funding Source in White Oak
Out of a total of 1,608 students who are enrolled in schools in White Oak, 142 (8.8%) attend a private institution, while the remaining 1,466 (91.2%) are enrolled in public schools. The age group of 35 years and over has the highest likelihood of being enrolled in private schools, with 15 (100.0% in the age bracket) enrolled. Conversely, the age group of 3 to 4 year olds has the lowest likelihood of being enrolled in a private school, with 104 (100.0% in the age bracket) attending a public institution.
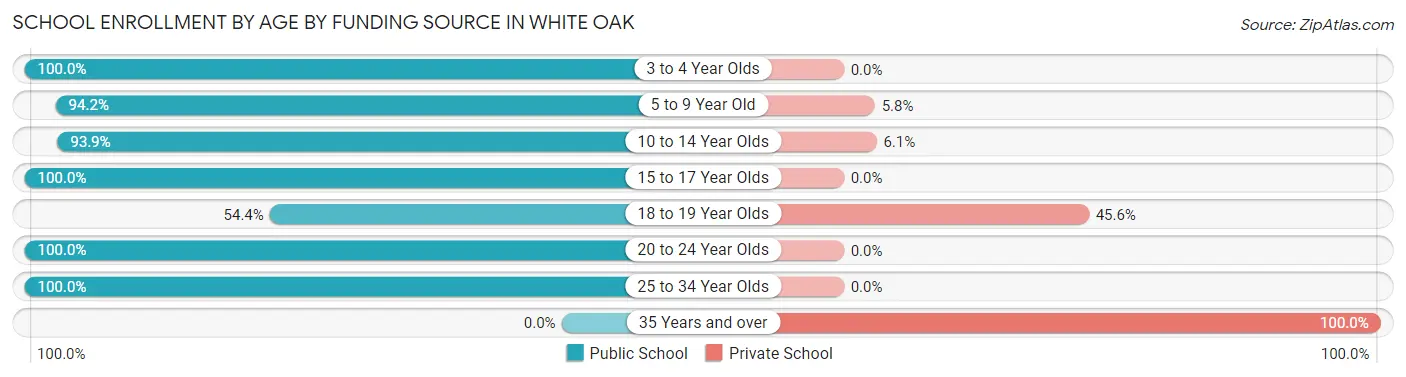
| Age Bracket | Public School | Private School |
| 3 to 4 Year Olds | 104 (100.0%) | 0 (0.0%) |
| 5 to 9 Year Old | 553 (94.2%) | 34 (5.8%) |
| 10 to 14 Year Olds | 369 (93.9%) | 24 (6.1%) |
| 15 to 17 Year Olds | 146 (100.0%) | 0 (0.0%) |
| 18 to 19 Year Olds | 81 (54.4%) | 68 (45.6%) |
| 20 to 24 Year Olds | 67 (100.0%) | 0 (0.0%) |
| 25 to 34 Year Olds | 147 (100.0%) | 0 (0.0%) |
| 35 Years and over | 0 (0.0%) | 15 (100.0%) |
| Total | 1,466 (91.2%) | 142 (8.8%) |
Educational Attainment by Field of Study in White Oak
Science & technology (215 | 21.8%), education (164 | 16.7%), physical & health sciences (128 | 13.0%), arts & humanities (116 | 11.8%), and business (109 | 11.1%) are the most common fields of study among 984 individuals in White Oak who have obtained a bachelor's degree or higher.
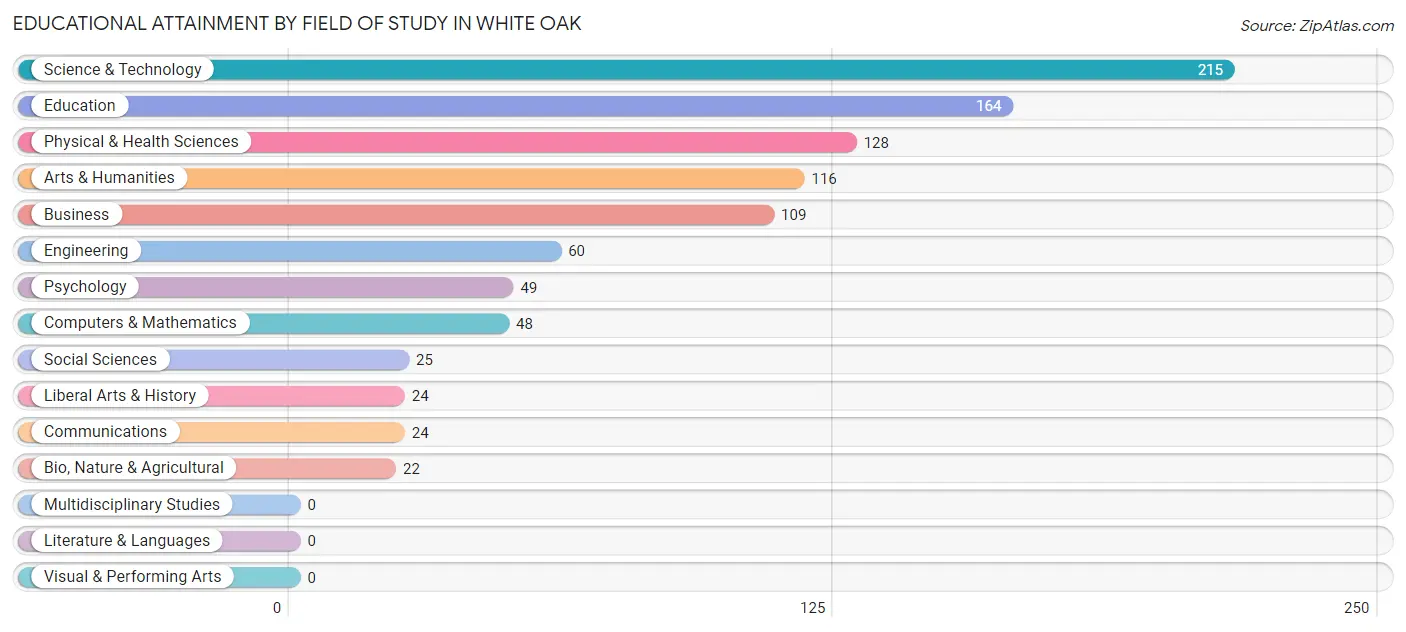
| Field of Study | # Graduates | % Graduates |
| Computers & Mathematics | 48 | 4.9% |
| Bio, Nature & Agricultural | 22 | 2.2% |
| Physical & Health Sciences | 128 | 13.0% |
| Psychology | 49 | 5.0% |
| Social Sciences | 25 | 2.5% |
| Engineering | 60 | 6.1% |
| Multidisciplinary Studies | 0 | 0.0% |
| Science & Technology | 215 | 21.8% |
| Business | 109 | 11.1% |
| Education | 164 | 16.7% |
| Literature & Languages | 0 | 0.0% |
| Liberal Arts & History | 24 | 2.4% |
| Visual & Performing Arts | 0 | 0.0% |
| Communications | 24 | 2.4% |
| Arts & Humanities | 116 | 11.8% |
| Total | 984 | 100.0% |
Transportation & Commute in White Oak
Vehicle Availability by Sex in White Oak
The most prevalent vehicle ownership categories in White Oak are males with 2 vehicles (729, accounting for 49.9%) and females with 2 vehicles (600, making up 44.2%).
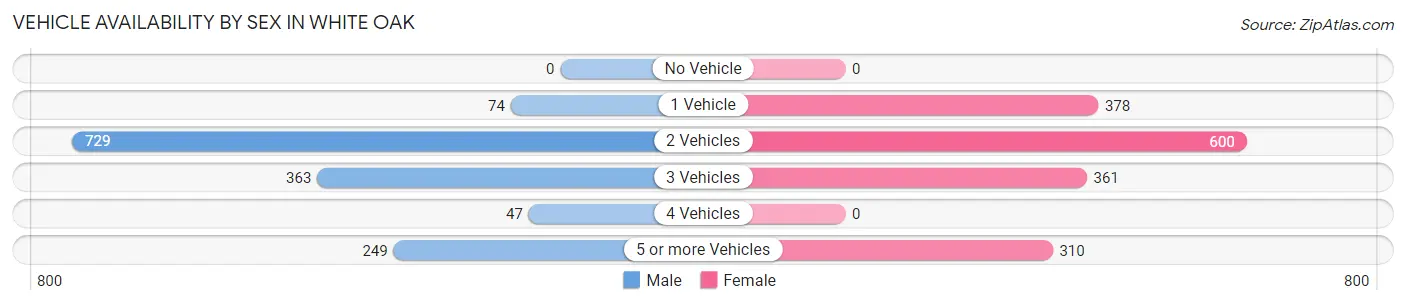
| Vehicles Available | Male | Female |
| No Vehicle | 0 (0.0%) | 0 (0.0%) |
| 1 Vehicle | 74 (5.1%) | 378 (22.9%) |
| 2 Vehicles | 729 (49.9%) | 600 (36.4%) |
| 3 Vehicles | 363 (24.8%) | 361 (21.9%) |
| 4 Vehicles | 47 (3.2%) | 0 (0.0%) |
| 5 or more Vehicles | 249 (17.0%) | 310 (18.8%) |
| Total | 1,462 (100.0%) | 1,649 (100.0%) |
Commute Time in White Oak
The most frequently occuring commute durations in White Oak are 20 to 24 minutes (816 commuters, 27.2%), 15 to 19 minutes (517 commuters, 17.3%), and 30 to 34 minutes (404 commuters, 13.5%).
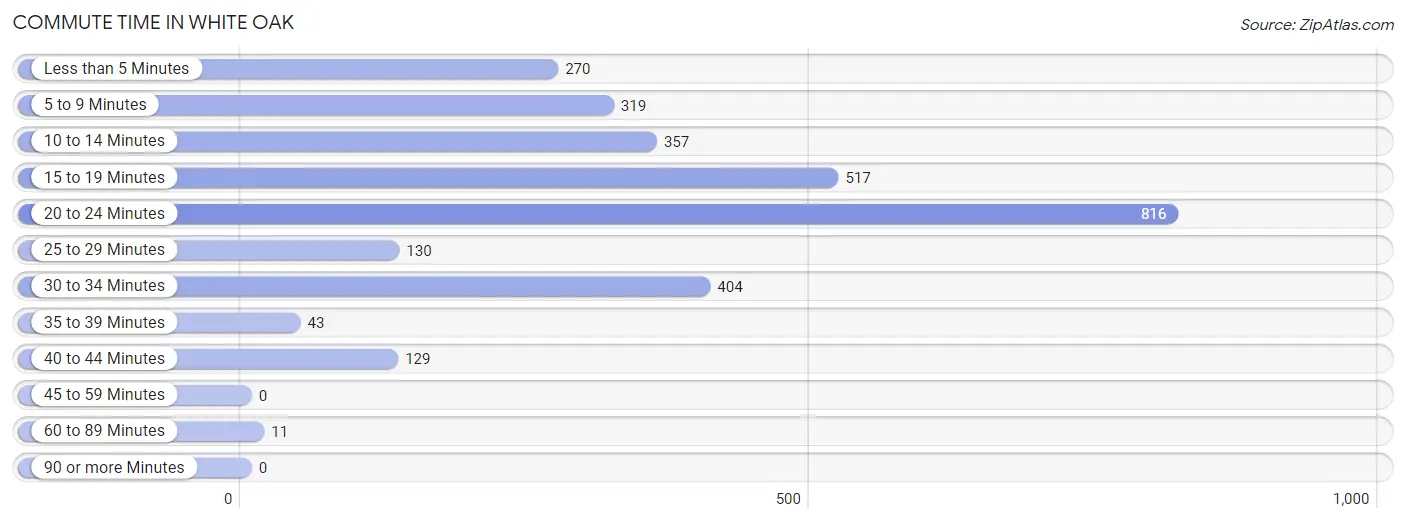
| Commute Time | # Commuters | % Commuters |
| Less than 5 Minutes | 270 | 9.0% |
| 5 to 9 Minutes | 319 | 10.6% |
| 10 to 14 Minutes | 357 | 11.9% |
| 15 to 19 Minutes | 517 | 17.3% |
| 20 to 24 Minutes | 816 | 27.2% |
| 25 to 29 Minutes | 130 | 4.3% |
| 30 to 34 Minutes | 404 | 13.5% |
| 35 to 39 Minutes | 43 | 1.4% |
| 40 to 44 Minutes | 129 | 4.3% |
| 45 to 59 Minutes | 0 | 0.0% |
| 60 to 89 Minutes | 11 | 0.4% |
| 90 or more Minutes | 0 | 0.0% |
Commute Time by Sex in White Oak
The most common commute times in White Oak are 15 to 19 minutes (323 commuters, 23.1%) for males and 20 to 24 minutes (582 commuters, 36.5%) for females.
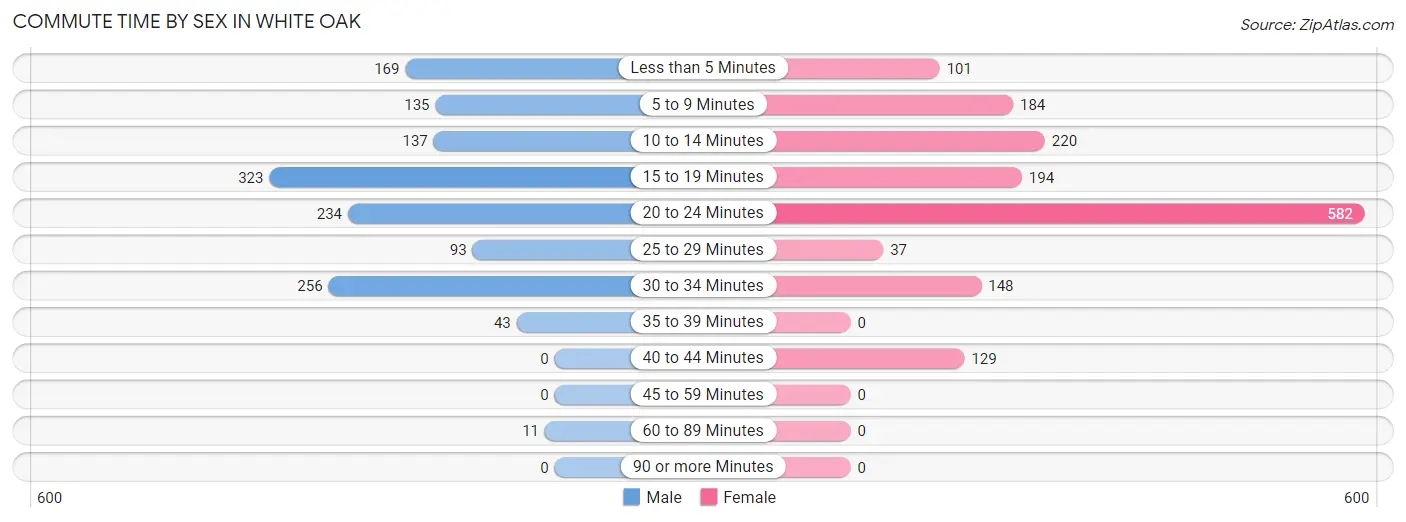
| Commute Time | Male | Female |
| Less than 5 Minutes | 169 (12.1%) | 101 (6.3%) |
| 5 to 9 Minutes | 135 (9.6%) | 184 (11.5%) |
| 10 to 14 Minutes | 137 (9.8%) | 220 (13.8%) |
| 15 to 19 Minutes | 323 (23.1%) | 194 (12.2%) |
| 20 to 24 Minutes | 234 (16.7%) | 582 (36.5%) |
| 25 to 29 Minutes | 93 (6.6%) | 37 (2.3%) |
| 30 to 34 Minutes | 256 (18.3%) | 148 (9.3%) |
| 35 to 39 Minutes | 43 (3.1%) | 0 (0.0%) |
| 40 to 44 Minutes | 0 (0.0%) | 129 (8.1%) |
| 45 to 59 Minutes | 0 (0.0%) | 0 (0.0%) |
| 60 to 89 Minutes | 11 (0.8%) | 0 (0.0%) |
| 90 or more Minutes | 0 (0.0%) | 0 (0.0%) |
Time of Departure to Work by Sex in White Oak
The most frequent times of departure to work in White Oak are 6:00 AM to 6:29 AM (310, 22.1%) for males and 8:00 AM to 8:29 AM (335, 21.0%) for females.
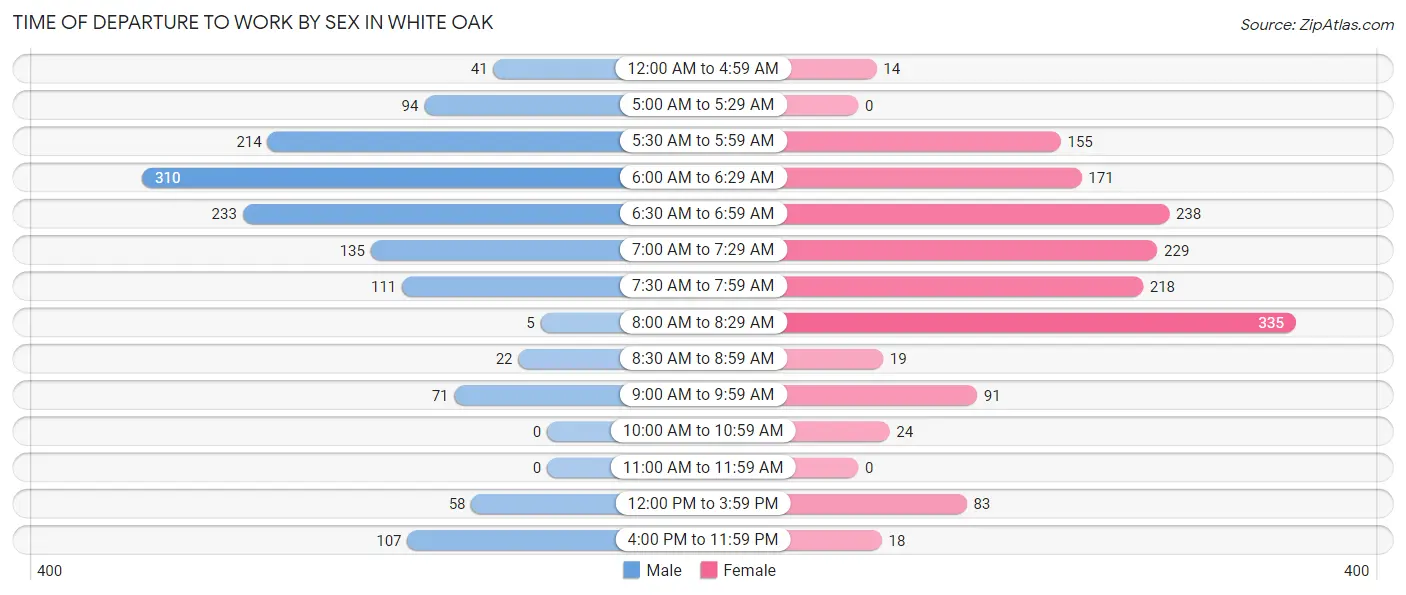
| Time of Departure | Male | Female |
| 12:00 AM to 4:59 AM | 41 (2.9%) | 14 (0.9%) |
| 5:00 AM to 5:29 AM | 94 (6.7%) | 0 (0.0%) |
| 5:30 AM to 5:59 AM | 214 (15.3%) | 155 (9.7%) |
| 6:00 AM to 6:29 AM | 310 (22.1%) | 171 (10.7%) |
| 6:30 AM to 6:59 AM | 233 (16.6%) | 238 (14.9%) |
| 7:00 AM to 7:29 AM | 135 (9.6%) | 229 (14.4%) |
| 7:30 AM to 7:59 AM | 111 (7.9%) | 218 (13.7%) |
| 8:00 AM to 8:29 AM | 5 (0.4%) | 335 (21.0%) |
| 8:30 AM to 8:59 AM | 22 (1.6%) | 19 (1.2%) |
| 9:00 AM to 9:59 AM | 71 (5.1%) | 91 (5.7%) |
| 10:00 AM to 10:59 AM | 0 (0.0%) | 24 (1.5%) |
| 11:00 AM to 11:59 AM | 0 (0.0%) | 0 (0.0%) |
| 12:00 PM to 3:59 PM | 58 (4.1%) | 83 (5.2%) |
| 4:00 PM to 11:59 PM | 107 (7.6%) | 18 (1.1%) |
| Total | 1,401 (100.0%) | 1,595 (100.0%) |
Housing Occupancy in White Oak
Occupancy by Ownership in White Oak
Of the total 2,140 dwellings in White Oak, owner-occupied units account for 1,496 (69.9%), while renter-occupied units make up 644 (30.1%).
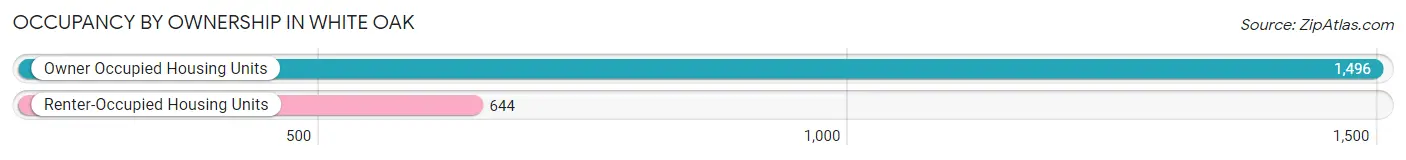
| Occupancy | # Housing Units | % Housing Units |
| Owner Occupied Housing Units | 1,496 | 69.9% |
| Renter-Occupied Housing Units | 644 | 30.1% |
| Total Occupied Housing Units | 2,140 | 100.0% |
Occupancy by Household Size in White Oak
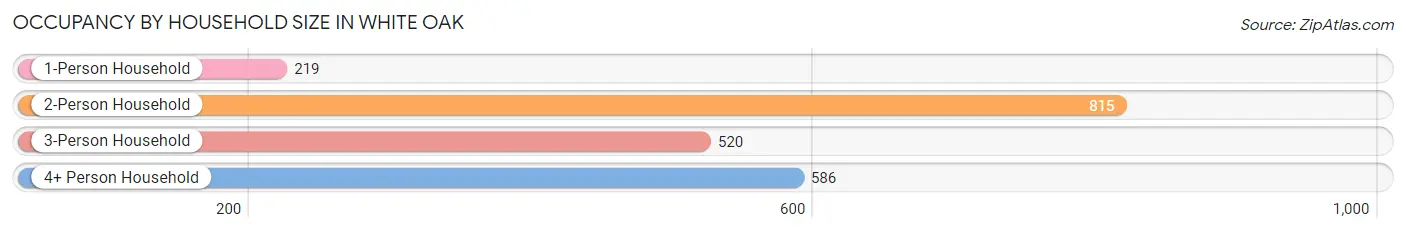
| Household Size | # Housing Units | % Housing Units |
| 1-Person Household | 219 | 10.2% |
| 2-Person Household | 815 | 38.1% |
| 3-Person Household | 520 | 24.3% |
| 4+ Person Household | 586 | 27.4% |
| Total Housing Units | 2,140 | 100.0% |
Occupancy by Ownership by Household Size in White Oak
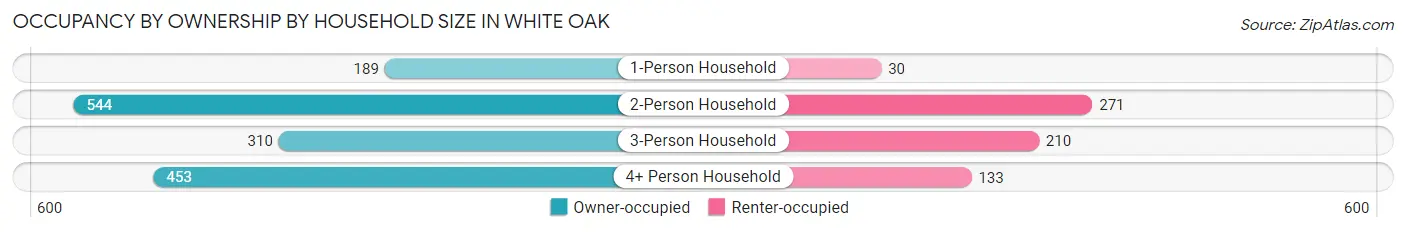
| Household Size | Owner-occupied | Renter-occupied |
| 1-Person Household | 189 (86.3%) | 30 (13.7%) |
| 2-Person Household | 544 (66.7%) | 271 (33.3%) |
| 3-Person Household | 310 (59.6%) | 210 (40.4%) |
| 4+ Person Household | 453 (77.3%) | 133 (22.7%) |
| Total Housing Units | 1,496 (69.9%) | 644 (30.1%) |
Occupancy by Educational Attainment in White Oak
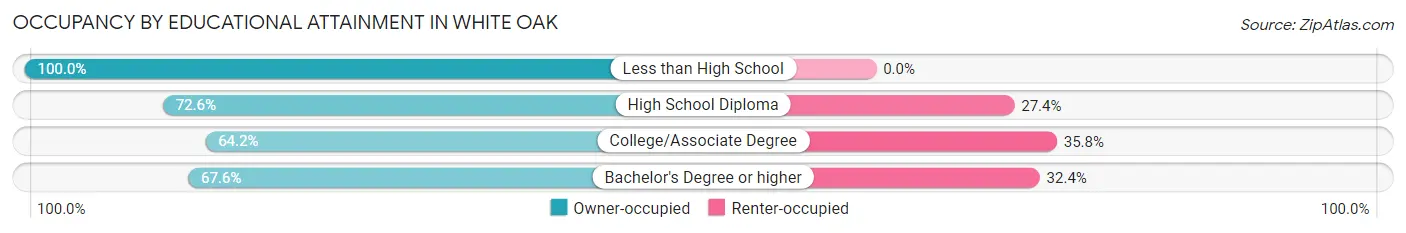
| Household Size | Owner-occupied | Renter-occupied |
| Less than High School | 187 (100.0%) | 0 (0.0%) |
| High School Diploma | 350 (72.6%) | 132 (27.4%) |
| College/Associate Degree | 665 (64.2%) | 371 (35.8%) |
| Bachelor's Degree or higher | 294 (67.6%) | 141 (32.4%) |
Occupancy by Age of Householder in White Oak
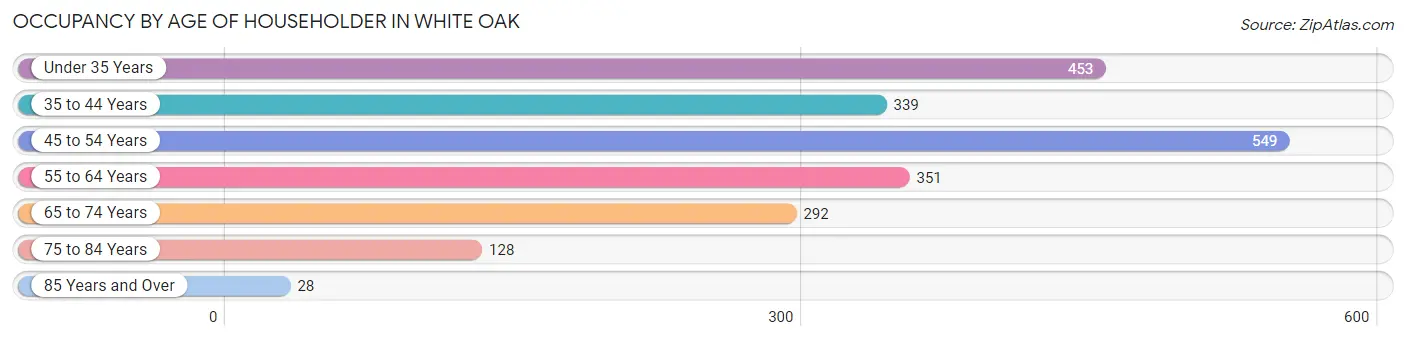
| Age Bracket | # Households | % Households |
| Under 35 Years | 453 | 21.2% |
| 35 to 44 Years | 339 | 15.8% |
| 45 to 54 Years | 549 | 25.7% |
| 55 to 64 Years | 351 | 16.4% |
| 65 to 74 Years | 292 | 13.6% |
| 75 to 84 Years | 128 | 6.0% |
| 85 Years and Over | 28 | 1.3% |
| Total | 2,140 | 100.0% |
Housing Finances in White Oak
Median Income by Occupancy in White Oak
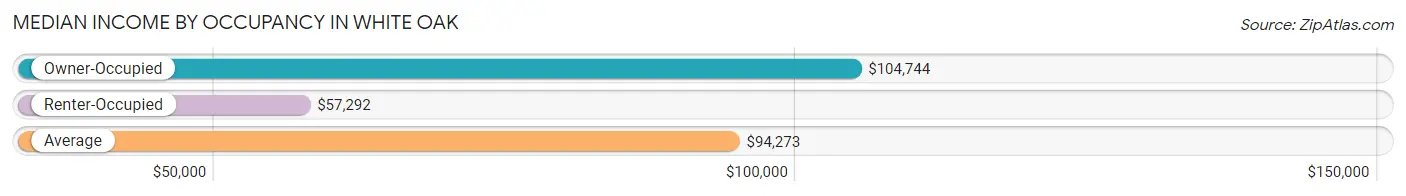
| Occupancy Type | # Households | Median Income |
| Owner-Occupied | 1,496 (69.9%) | $104,744 |
| Renter-Occupied | 644 (30.1%) | $57,292 |
| Average | 2,140 (100.0%) | $94,273 |
Occupancy by Householder Income Bracket in White Oak
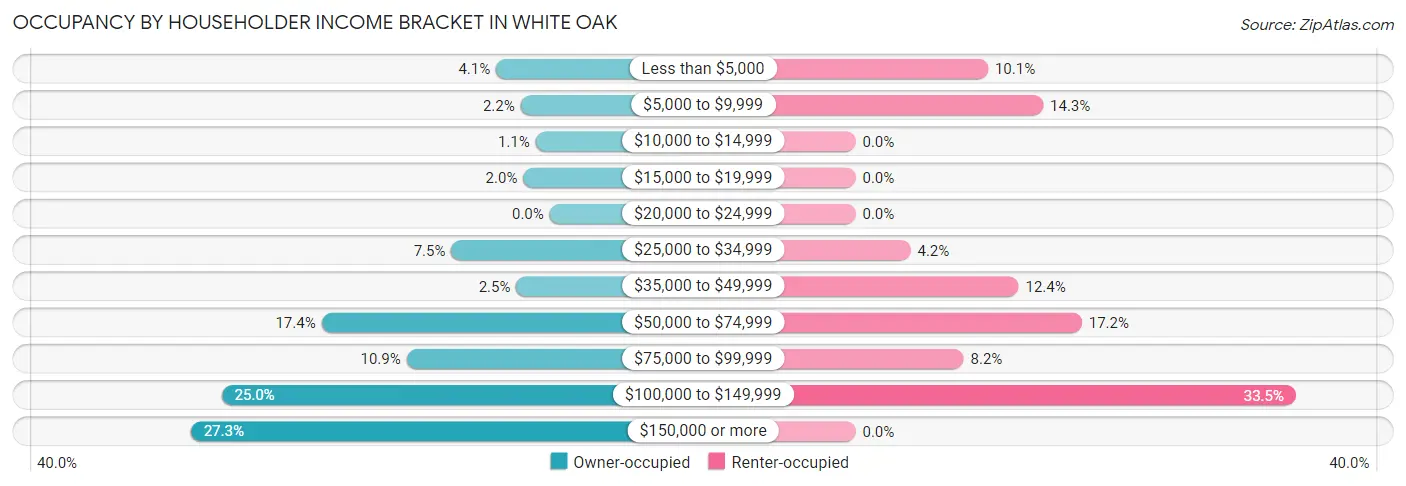
| Income Bracket | Owner-occupied | Renter-occupied |
| Less than $5,000 | 61 (4.1%) | 65 (10.1%) |
| $5,000 to $9,999 | 33 (2.2%) | 92 (14.3%) |
| $10,000 to $14,999 | 16 (1.1%) | 0 (0.0%) |
| $15,000 to $19,999 | 30 (2.0%) | 0 (0.0%) |
| $20,000 to $24,999 | 0 (0.0%) | 0 (0.0%) |
| $25,000 to $34,999 | 112 (7.5%) | 27 (4.2%) |
| $35,000 to $49,999 | 38 (2.5%) | 80 (12.4%) |
| $50,000 to $74,999 | 260 (17.4%) | 111 (17.2%) |
| $75,000 to $99,999 | 163 (10.9%) | 53 (8.2%) |
| $100,000 to $149,999 | 374 (25.0%) | 216 (33.5%) |
| $150,000 or more | 409 (27.3%) | 0 (0.0%) |
| Total | 1,496 (100.0%) | 644 (100.0%) |
Monthly Housing Cost Tiers in White Oak
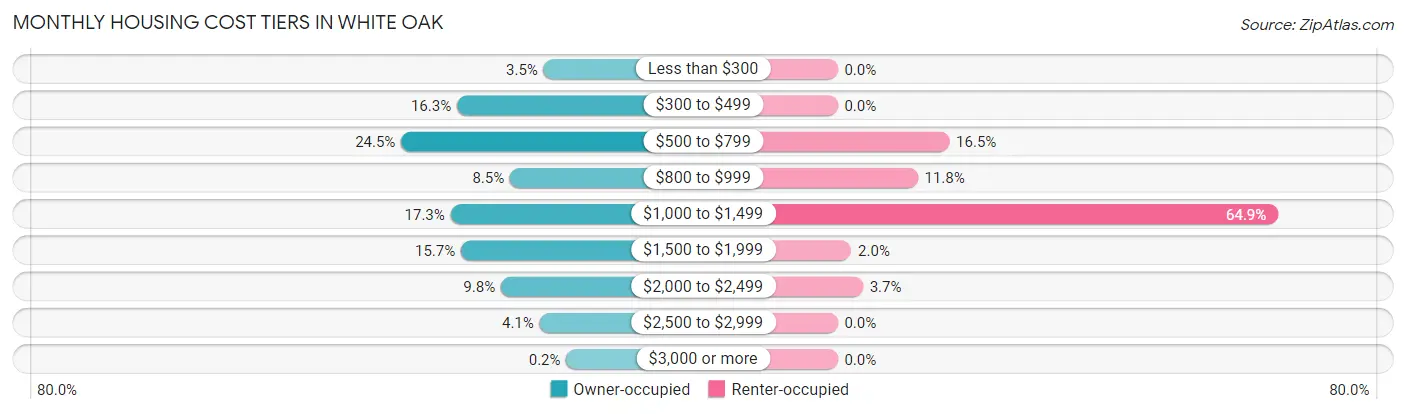
| Monthly Cost | Owner-occupied | Renter-occupied |
| Less than $300 | 53 (3.5%) | 0 (0.0%) |
| $300 to $499 | 244 (16.3%) | 0 (0.0%) |
| $500 to $799 | 367 (24.5%) | 106 (16.5%) |
| $800 to $999 | 127 (8.5%) | 76 (11.8%) |
| $1,000 to $1,499 | 258 (17.2%) | 418 (64.9%) |
| $1,500 to $1,999 | 235 (15.7%) | 13 (2.0%) |
| $2,000 to $2,499 | 147 (9.8%) | 24 (3.7%) |
| $2,500 to $2,999 | 62 (4.1%) | 0 (0.0%) |
| $3,000 or more | 3 (0.2%) | 0 (0.0%) |
| Total | 1,496 (100.0%) | 644 (100.0%) |
Physical Housing Characteristics in White Oak
Housing Structures in White Oak
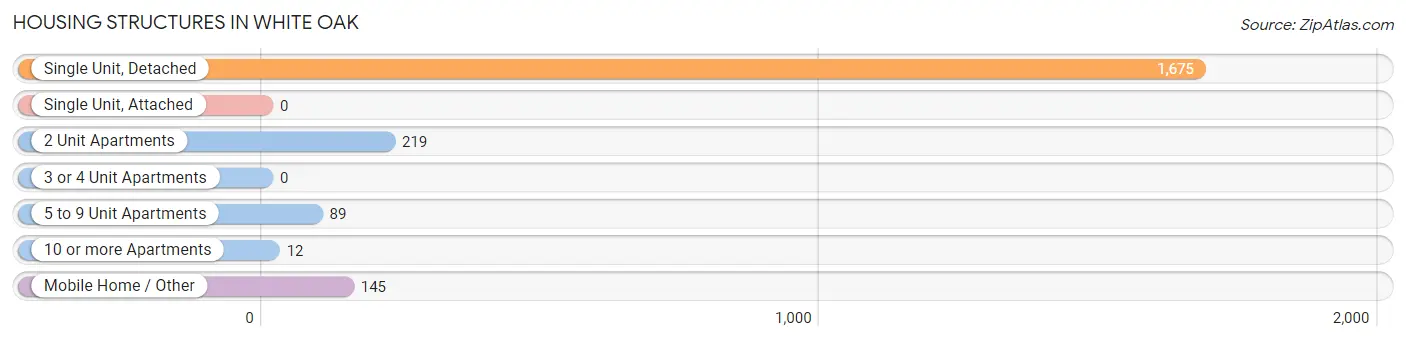
| Structure Type | # Housing Units | % Housing Units |
| Single Unit, Detached | 1,675 | 78.3% |
| Single Unit, Attached | 0 | 0.0% |
| 2 Unit Apartments | 219 | 10.2% |
| 3 or 4 Unit Apartments | 0 | 0.0% |
| 5 to 9 Unit Apartments | 89 | 4.2% |
| 10 or more Apartments | 12 | 0.6% |
| Mobile Home / Other | 145 | 6.8% |
| Total | 2,140 | 100.0% |
Housing Structures by Occupancy in White Oak
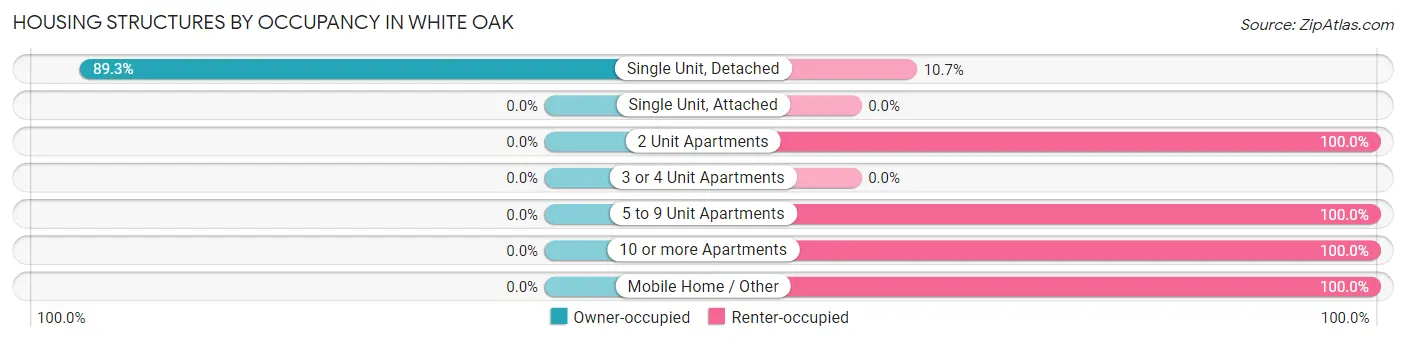
| Structure Type | Owner-occupied | Renter-occupied |
| Single Unit, Detached | 1,496 (89.3%) | 179 (10.7%) |
| Single Unit, Attached | 0 (0.0%) | 0 (0.0%) |
| 2 Unit Apartments | 0 (0.0%) | 219 (100.0%) |
| 3 or 4 Unit Apartments | 0 (0.0%) | 0 (0.0%) |
| 5 to 9 Unit Apartments | 0 (0.0%) | 89 (100.0%) |
| 10 or more Apartments | 0 (0.0%) | 12 (100.0%) |
| Mobile Home / Other | 0 (0.0%) | 145 (100.0%) |
| Total | 1,496 (69.9%) | 644 (30.1%) |
Housing Structures by Number of Rooms in White Oak
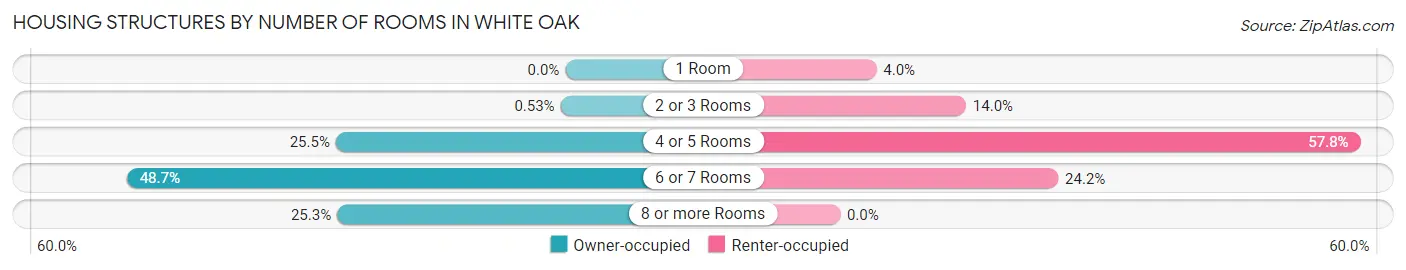
| Number of Rooms | Owner-occupied | Renter-occupied |
| 1 Room | 0 (0.0%) | 26 (4.0%) |
| 2 or 3 Rooms | 8 (0.5%) | 90 (14.0%) |
| 4 or 5 Rooms | 381 (25.5%) | 372 (57.8%) |
| 6 or 7 Rooms | 728 (48.7%) | 156 (24.2%) |
| 8 or more Rooms | 379 (25.3%) | 0 (0.0%) |
| Total | 1,496 (100.0%) | 644 (100.0%) |
Housing Structure by Heating Type in White Oak
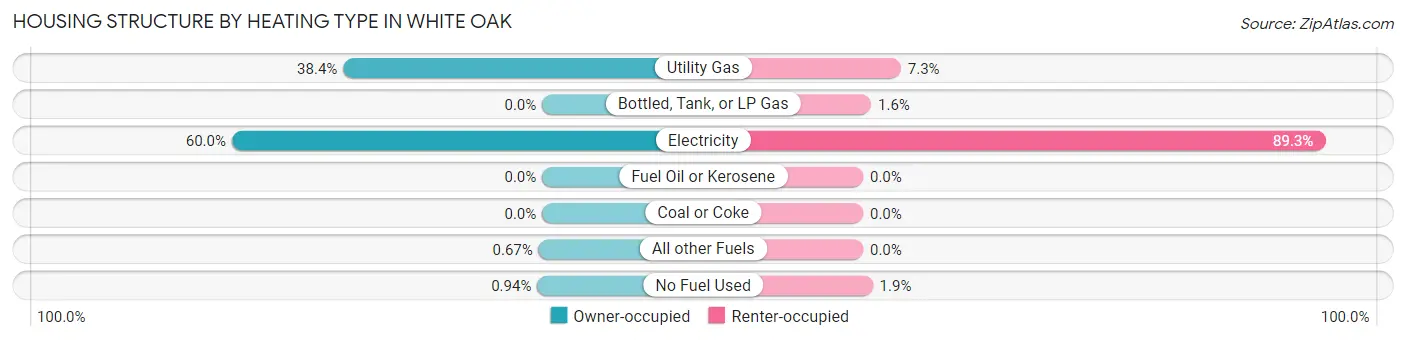
| Heating Type | Owner-occupied | Renter-occupied |
| Utility Gas | 575 (38.4%) | 47 (7.3%) |
| Bottled, Tank, or LP Gas | 0 (0.0%) | 10 (1.5%) |
| Electricity | 897 (60.0%) | 575 (89.3%) |
| Fuel Oil or Kerosene | 0 (0.0%) | 0 (0.0%) |
| Coal or Coke | 0 (0.0%) | 0 (0.0%) |
| All other Fuels | 10 (0.7%) | 0 (0.0%) |
| No Fuel Used | 14 (0.9%) | 12 (1.9%) |
| Total | 1,496 (100.0%) | 644 (100.0%) |
Household Vehicle Usage in White Oak
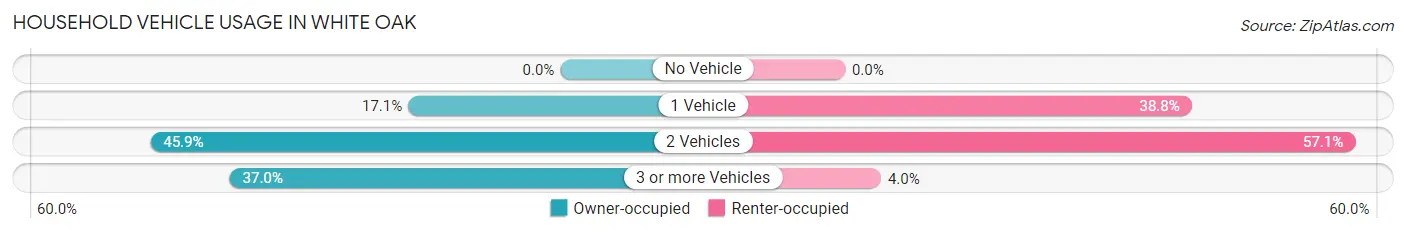
| Vehicles per Household | Owner-occupied | Renter-occupied |
| No Vehicle | 0 (0.0%) | 0 (0.0%) |
| 1 Vehicle | 255 (17.1%) | 250 (38.8%) |
| 2 Vehicles | 687 (45.9%) | 368 (57.1%) |
| 3 or more Vehicles | 554 (37.0%) | 26 (4.0%) |
| Total | 1,496 (100.0%) | 644 (100.0%) |
Real Estate & Mortgages in White Oak
Real Estate and Mortgage Overview in White Oak
| Characteristic | Without Mortgage | With Mortgage |
| Housing Units | 799 | 697 |
| Median Property Value | $164,600 | $223,300 |
| Median Household Income | $112,779 | $154 |
| Monthly Housing Costs | $573 | $0 |
| Real Estate Taxes | $1,497 | $0 |
Property Value by Mortgage Status in White Oak
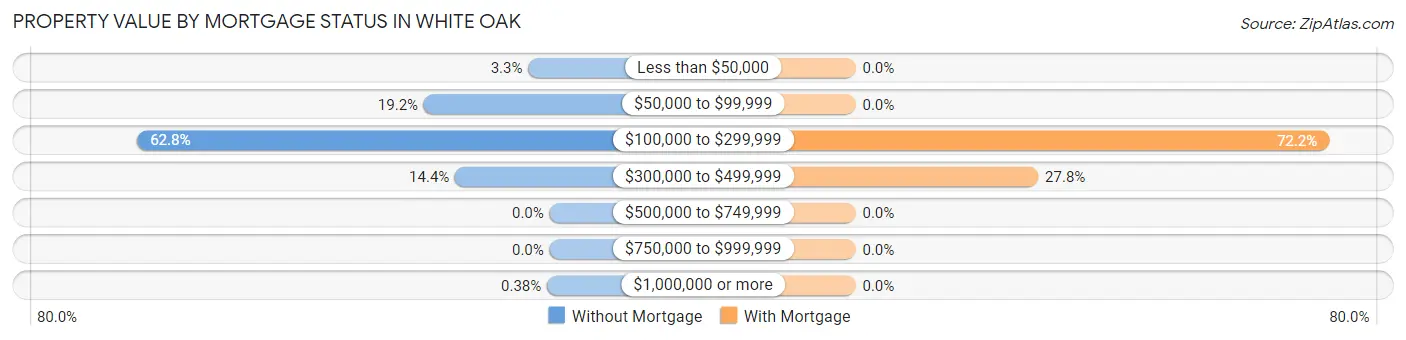
| Property Value | Without Mortgage | With Mortgage |
| Less than $50,000 | 26 (3.3%) | 0 (0.0%) |
| $50,000 to $99,999 | 153 (19.2%) | 0 (0.0%) |
| $100,000 to $299,999 | 502 (62.8%) | 503 (72.2%) |
| $300,000 to $499,999 | 115 (14.4%) | 194 (27.8%) |
| $500,000 to $749,999 | 0 (0.0%) | 0 (0.0%) |
| $750,000 to $999,999 | 0 (0.0%) | 0 (0.0%) |
| $1,000,000 or more | 3 (0.4%) | 0 (0.0%) |
| Total | 799 (100.0%) | 697 (100.0%) |
Household Income by Mortgage Status in White Oak
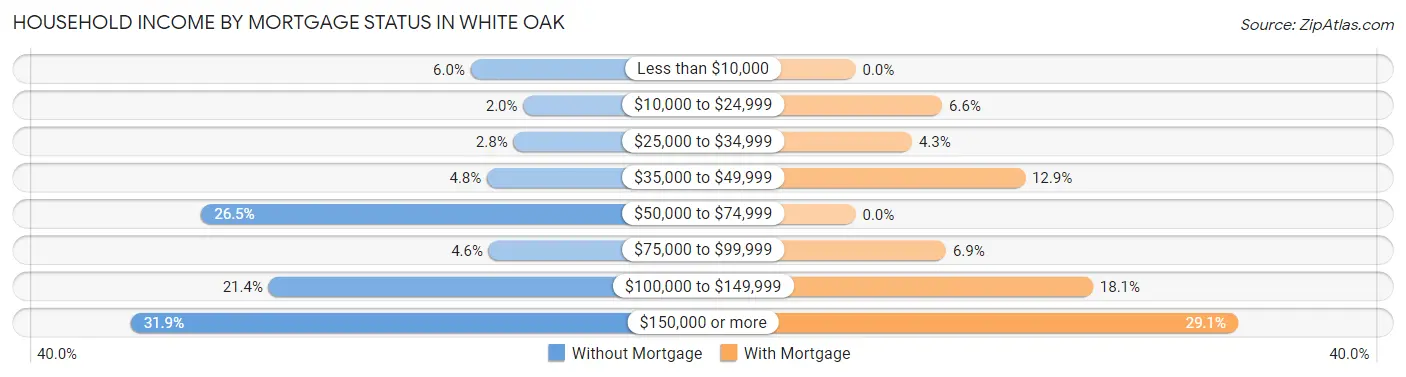
| Household Income | Without Mortgage | With Mortgage |
| Less than $10,000 | 48 (6.0%) | 0 (0.0%) |
| $10,000 to $24,999 | 16 (2.0%) | 46 (6.6%) |
| $25,000 to $34,999 | 22 (2.8%) | 30 (4.3%) |
| $35,000 to $49,999 | 38 (4.8%) | 90 (12.9%) |
| $50,000 to $74,999 | 212 (26.5%) | 0 (0.0%) |
| $75,000 to $99,999 | 37 (4.6%) | 48 (6.9%) |
| $100,000 to $149,999 | 171 (21.4%) | 126 (18.1%) |
| $150,000 or more | 255 (31.9%) | 203 (29.1%) |
| Total | 799 (100.0%) | 697 (100.0%) |
Property Value to Household Income Ratio in White Oak
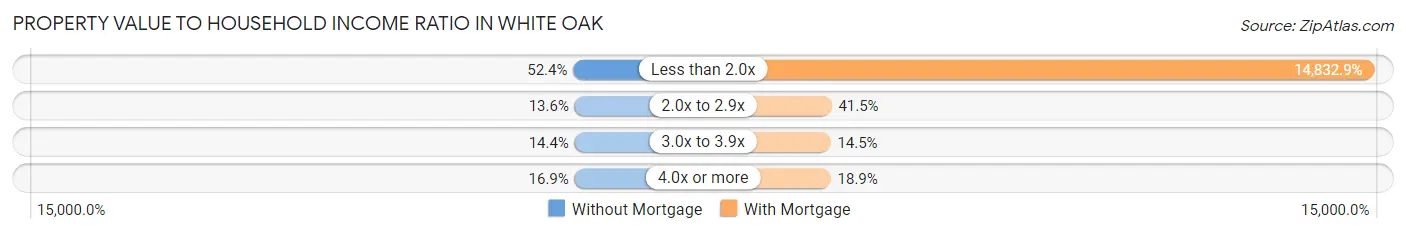
| Value-to-Income Ratio | Without Mortgage | With Mortgage |
| Less than 2.0x | 419 (52.4%) | 103,385 (14,832.9%) |
| 2.0x to 2.9x | 109 (13.6%) | 289 (41.5%) |
| 3.0x to 3.9x | 115 (14.4%) | 101 (14.5%) |
| 4.0x or more | 135 (16.9%) | 132 (18.9%) |
| Total | 799 (100.0%) | 697 (100.0%) |
Real Estate Taxes by Mortgage Status in White Oak
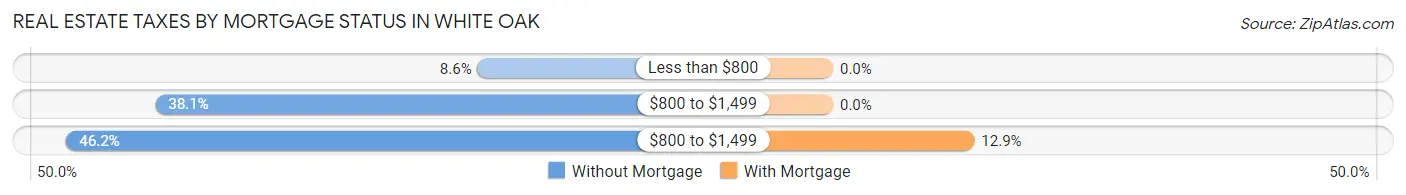
| Property Taxes | Without Mortgage | With Mortgage |
| Less than $800 | 69 (8.6%) | 0 (0.0%) |
| $800 to $1,499 | 304 (38.1%) | 0 (0.0%) |
| $800 to $1,499 | 369 (46.2%) | 90 (12.9%) |
| Total | 799 (100.0%) | 697 (100.0%) |
Health & Disability in White Oak
Health Insurance Coverage by Age in White Oak
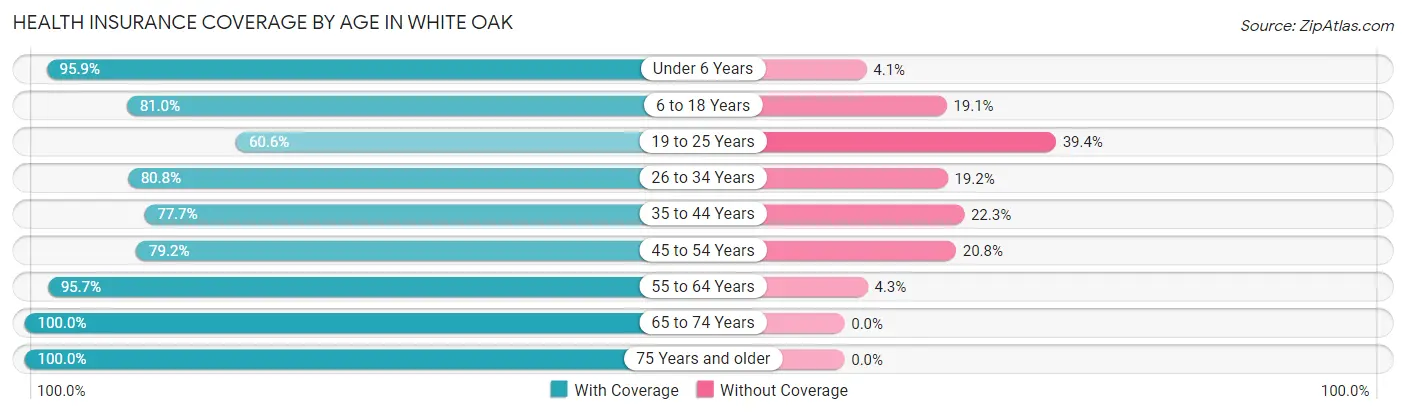
| Age Bracket | With Coverage | Without Coverage |
| Under 6 Years | 443 (95.9%) | 19 (4.1%) |
| 6 to 18 Years | 1,020 (80.9%) | 240 (19.1%) |
| 19 to 25 Years | 146 (60.6%) | 95 (39.4%) |
| 26 to 34 Years | 827 (80.8%) | 197 (19.2%) |
| 35 to 44 Years | 536 (77.7%) | 154 (22.3%) |
| 45 to 54 Years | 796 (79.2%) | 209 (20.8%) |
| 55 to 64 Years | 819 (95.7%) | 37 (4.3%) |
| 65 to 74 Years | 401 (100.0%) | 0 (0.0%) |
| 75 Years and older | 288 (100.0%) | 0 (0.0%) |
| Total | 5,276 (84.7%) | 951 (15.3%) |
Health Insurance Coverage by Citizenship Status in White Oak
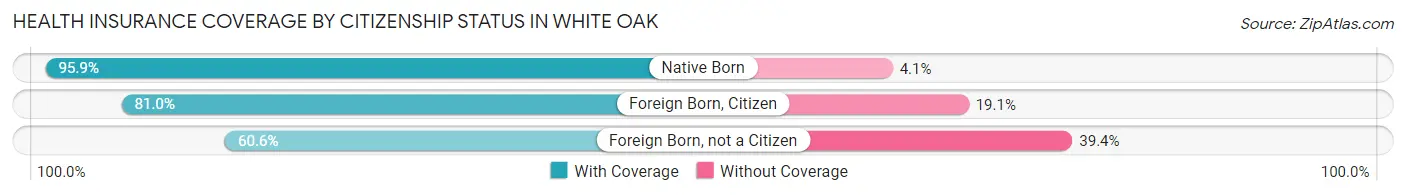
| Citizenship Status | With Coverage | Without Coverage |
| Native Born | 443 (95.9%) | 19 (4.1%) |
| Foreign Born, Citizen | 1,020 (80.9%) | 240 (19.1%) |
| Foreign Born, not a Citizen | 146 (60.6%) | 95 (39.4%) |
Health Insurance Coverage by Household Income in White Oak
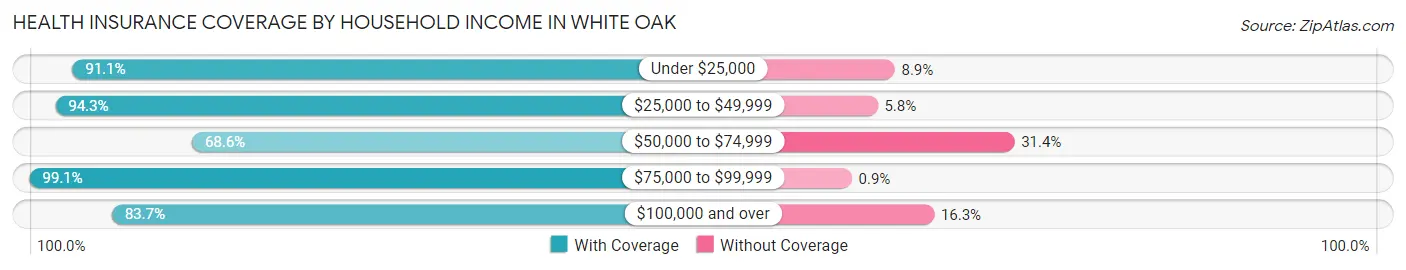
| Household Income | With Coverage | Without Coverage |
| Under $25,000 | 509 (91.1%) | 50 (8.9%) |
| $25,000 to $49,999 | 492 (94.3%) | 30 (5.8%) |
| $50,000 to $74,999 | 696 (68.6%) | 318 (31.4%) |
| $75,000 to $99,999 | 774 (99.1%) | 7 (0.9%) |
| $100,000 and over | 2,797 (83.7%) | 546 (16.3%) |
Public vs Private Health Insurance Coverage by Age in White Oak
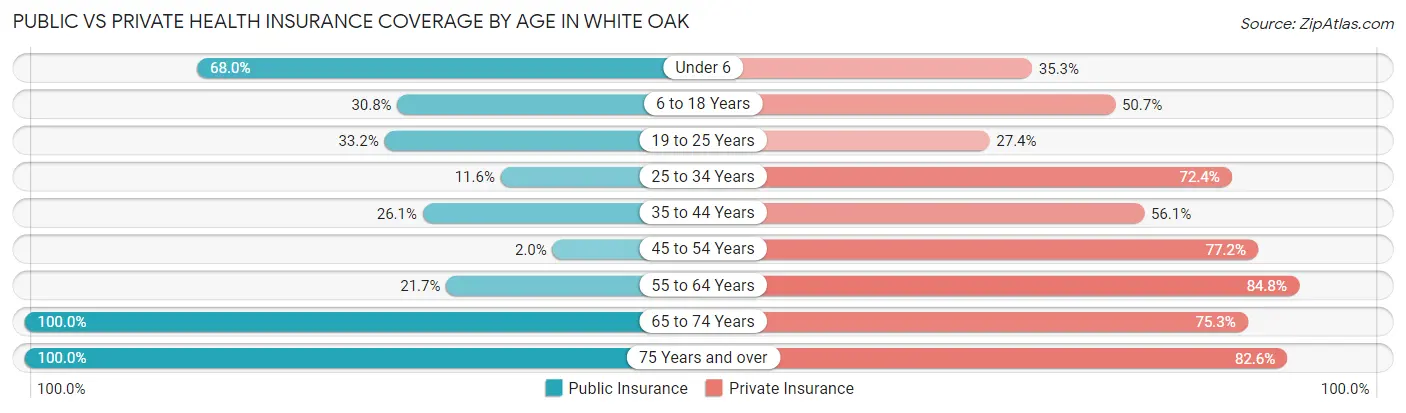
| Age Bracket | Public Insurance | Private Insurance |
| Under 6 | 314 (68.0%) | 163 (35.3%) |
| 6 to 18 Years | 388 (30.8%) | 639 (50.7%) |
| 19 to 25 Years | 80 (33.2%) | 66 (27.4%) |
| 25 to 34 Years | 119 (11.6%) | 741 (72.4%) |
| 35 to 44 Years | 180 (26.1%) | 387 (56.1%) |
| 45 to 54 Years | 20 (2.0%) | 776 (77.2%) |
| 55 to 64 Years | 186 (21.7%) | 726 (84.8%) |
| 65 to 74 Years | 401 (100.0%) | 302 (75.3%) |
| 75 Years and over | 288 (100.0%) | 238 (82.6%) |
| Total | 1,976 (31.7%) | 4,038 (64.8%) |
Disability Status by Sex by Age in White Oak
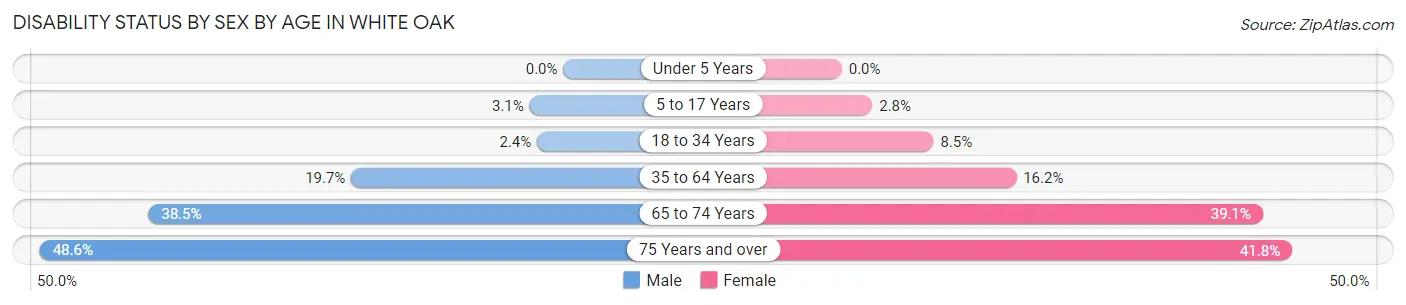
| Age Bracket | Male | Female |
| Under 5 Years | 0 (0.0%) | 0 (0.0%) |
| 5 to 17 Years | 22 (3.1%) | 13 (2.8%) |
| 18 to 34 Years | 17 (2.4%) | 61 (8.5%) |
| 35 to 64 Years | 253 (19.7%) | 205 (16.2%) |
| 65 to 74 Years | 47 (38.5%) | 109 (39.1%) |
| 75 Years and over | 69 (48.6%) | 61 (41.8%) |
Disability Class by Sex by Age in White Oak
Disability Class: Hearing Difficulty
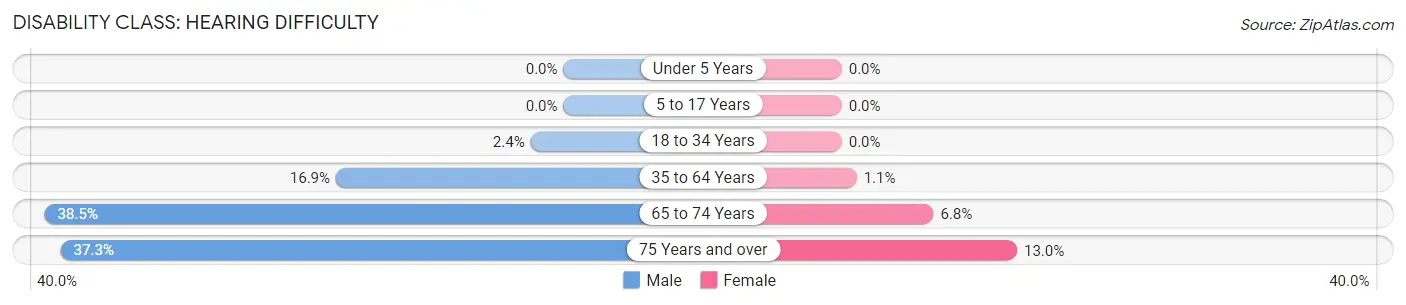
| Age Bracket | Male | Female |
| Under 5 Years | 0 (0.0%) | 0 (0.0%) |
| 5 to 17 Years | 0 (0.0%) | 0 (0.0%) |
| 18 to 34 Years | 17 (2.4%) | 0 (0.0%) |
| 35 to 64 Years | 217 (16.9%) | 14 (1.1%) |
| 65 to 74 Years | 47 (38.5%) | 19 (6.8%) |
| 75 Years and over | 53 (37.3%) | 19 (13.0%) |
Disability Class: Vision Difficulty
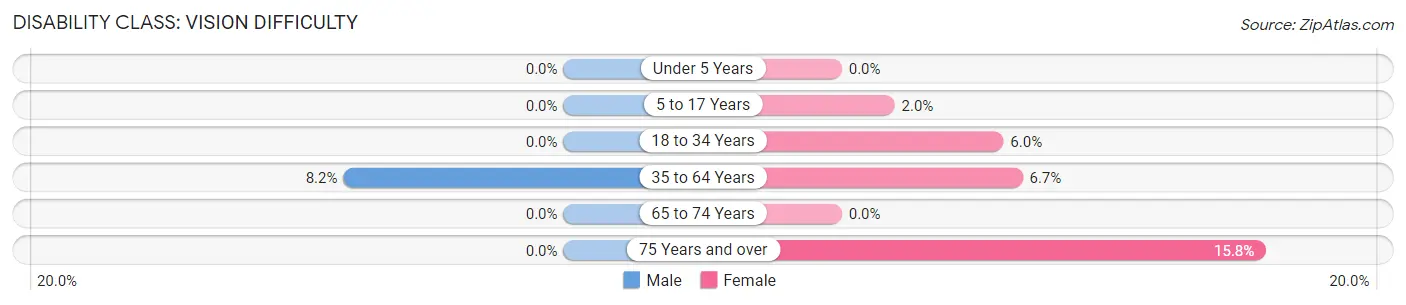
| Age Bracket | Male | Female |
| Under 5 Years | 0 (0.0%) | 0 (0.0%) |
| 5 to 17 Years | 0 (0.0%) | 9 (2.0%) |
| 18 to 34 Years | 0 (0.0%) | 43 (6.0%) |
| 35 to 64 Years | 105 (8.2%) | 85 (6.7%) |
| 65 to 74 Years | 0 (0.0%) | 0 (0.0%) |
| 75 Years and over | 0 (0.0%) | 23 (15.8%) |
Disability Class: Cognitive Difficulty
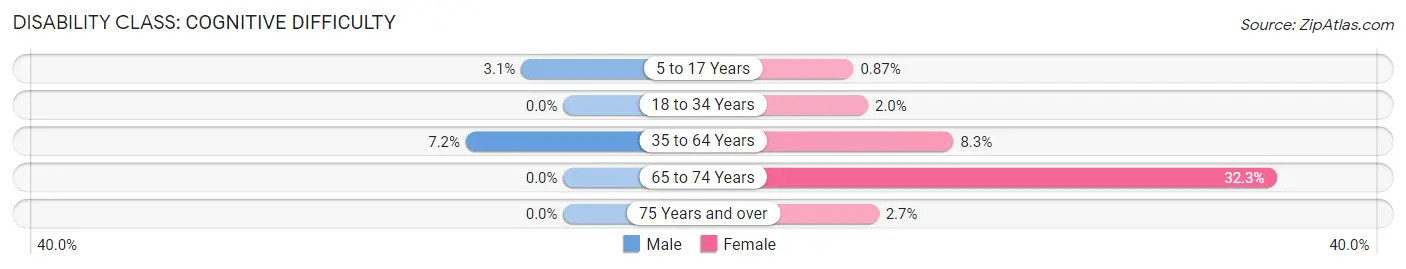
| Age Bracket | Male | Female |
| 5 to 17 Years | 22 (3.1%) | 4 (0.9%) |
| 18 to 34 Years | 0 (0.0%) | 14 (1.9%) |
| 35 to 64 Years | 93 (7.2%) | 105 (8.3%) |
| 65 to 74 Years | 0 (0.0%) | 90 (32.3%) |
| 75 Years and over | 0 (0.0%) | 4 (2.7%) |
Disability Class: Ambulatory Difficulty
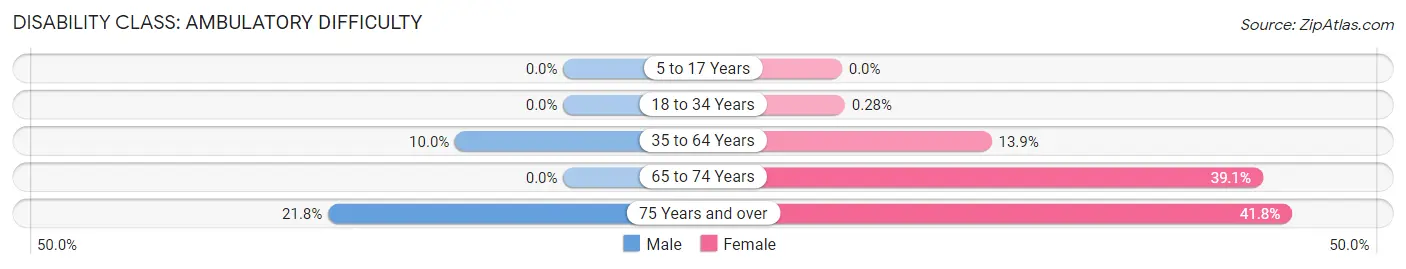
| Age Bracket | Male | Female |
| 5 to 17 Years | 0 (0.0%) | 0 (0.0%) |
| 18 to 34 Years | 0 (0.0%) | 2 (0.3%) |
| 35 to 64 Years | 129 (10.0%) | 176 (13.9%) |
| 65 to 74 Years | 0 (0.0%) | 109 (39.1%) |
| 75 Years and over | 31 (21.8%) | 61 (41.8%) |
Disability Class: Self-Care Difficulty
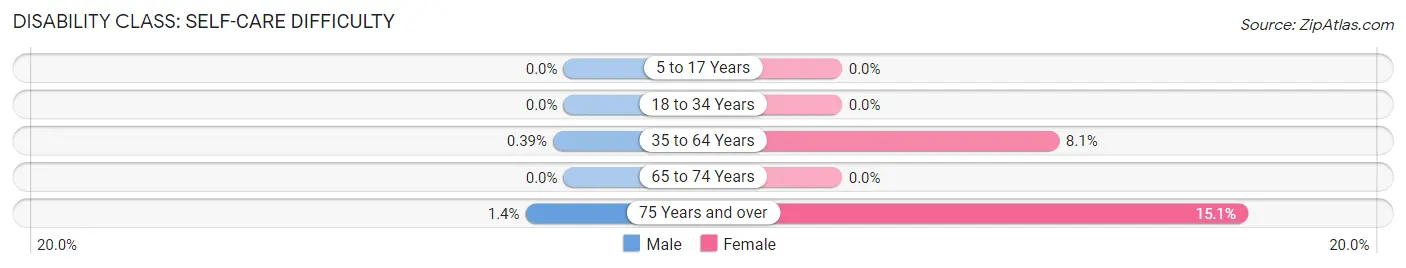
| Age Bracket | Male | Female |
| 5 to 17 Years | 0 (0.0%) | 0 (0.0%) |
| 18 to 34 Years | 0 (0.0%) | 0 (0.0%) |
| 35 to 64 Years | 5 (0.4%) | 102 (8.1%) |
| 65 to 74 Years | 0 (0.0%) | 0 (0.0%) |
| 75 Years and over | 2 (1.4%) | 22 (15.1%) |
Technology Access in White Oak
Computing Device Access in White Oak
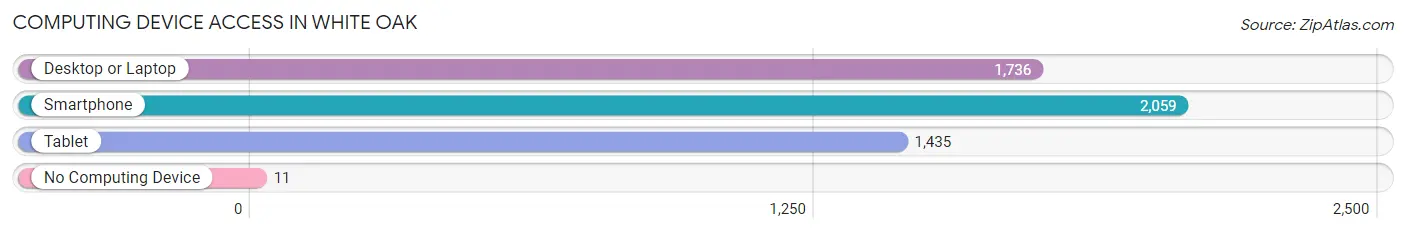
| Device Type | # Households | % Households |
| Desktop or Laptop | 1,736 | 81.1% |
| Smartphone | 2,059 | 96.2% |
| Tablet | 1,435 | 67.1% |
| No Computing Device | 11 | 0.5% |
| Total | 2,140 | 100.0% |
Internet Access in White Oak
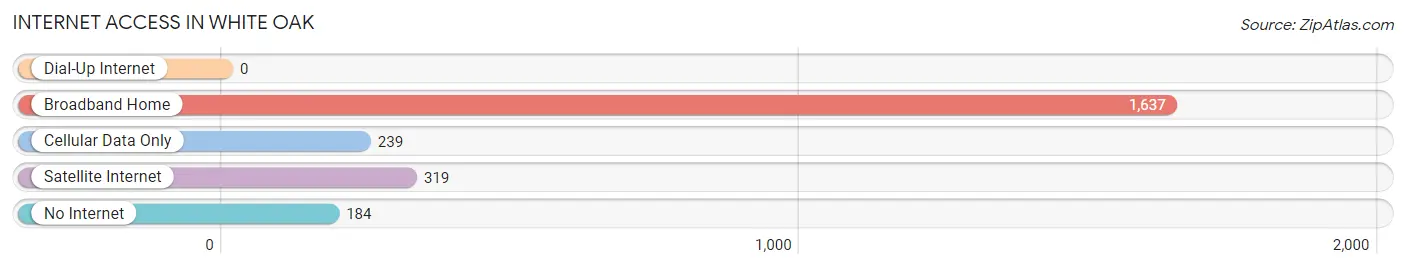
| Internet Type | # Households | % Households |
| Dial-Up Internet | 0 | 0.0% |
| Broadband Home | 1,637 | 76.5% |
| Cellular Data Only | 239 | 11.2% |
| Satellite Internet | 319 | 14.9% |
| No Internet | 184 | 8.6% |
| Total | 2,140 | 100.0% |
White Oak Summary
White Oak is a small city located in Gregg County, Texas. It is situated in the northeastern part of the state, about 20 miles from the Louisiana border. The city has a population of approximately 4,000 people and is part of the Longview Metropolitan Statistical Area.
History
White Oak was founded in 1873 by a group of settlers from Arkansas. The town was named after a white oak tree that was located near the original settlement. The town was incorporated in 1876 and was the first incorporated town in Gregg County.
In the early 1900s, White Oak was a thriving agricultural community. Cotton was the main crop grown in the area, and the town was home to several cotton gins. The town also had a sawmill, a gristmill, and a brickyard.
In the 1920s, the town began to experience a decline in population as many of the residents moved away to find work in larger cities. The Great Depression further exacerbated the decline, and by 1940 the population had dropped to just over 1,000.
In the 1950s, White Oak began to experience a resurgence in population as the oil and gas industry began to boom in the area. The town was also home to several manufacturing plants, including a paper mill and a furniture factory.
Geography
White Oak is located in the northeastern part of Texas, about 20 miles from the Louisiana border. The city is situated in the Piney Woods region of the state, and is surrounded by dense forests of pine and oak trees. The city is located on the banks of the Sabine River, which forms the border between Texas and Louisiana.
The climate in White Oak is humid subtropical, with hot summers and mild winters. The average annual temperature is around 70 degrees Fahrenheit, and the average annual precipitation is around 45 inches.
Economy
White Oak’s economy is largely based on the oil and gas industry. The city is home to several oil and gas companies, as well as several manufacturing plants. The city is also home to a paper mill and a furniture factory.
The city is also home to several retail stores, restaurants, and other businesses. The city is served by the Gregg County Airport, which provides air service to the surrounding area.
Demographics
As of the 2010 census, White Oak had a population of 4,000 people. The racial makeup of the city was 79.3% White, 15.2% African American, 0.7% Native American, 0.7% Asian, and 3.9% from other races. Hispanic or Latino of any race were 6.2% of the population.
The median household income in White Oak was $37,500, and the median family income was $45,000. The per capita income was $19,000. About 17.3% of the population was below the poverty line.
White Oak is served by the White Oak Independent School District. The district has three elementary schools, one middle school, and one high school. The city is also home to several private schools, including a Catholic school and a Christian school.
Common Questions
What is Per Capita Income in White Oak?
Per Capita income in White Oak is $31,491.
What is the Median Family Income in White Oak?
Median Family Income in White Oak is $93,939.
What is the Median Household income in White Oak?
Median Household Income in White Oak is $94,273.
What is Income or Wage Gap in White Oak?
Income or Wage Gap in White Oak is 36.4%.
Women in White Oak earn 63.6 cents for every dollar earned by a man.
What is Inequality or Gini Index in White Oak?
Inequality or Gini Index in White Oak is 0.39.
What is the Total Population of White Oak?
Total Population of White Oak is 6,227.
What is the Total Male Population of White Oak?
Total Male Population of White Oak is 3,057.
What is the Total Female Population of White Oak?
Total Female Population of White Oak is 3,170.
What is the Ratio of Males per 100 Females in White Oak?
There are 96.44 Males per 100 Females in White Oak.
What is the Ratio of Females per 100 Males in White Oak?
There are 103.70 Females per 100 Males in White Oak.
What is the Median Population Age in White Oak?
Median Population Age in White Oak is 35.5 Years.
What is the Average Family Size in White Oak
Average Family Size in White Oak is 3.1 People.
What is the Average Household Size in White Oak
Average Household Size in White Oak is 2.9 People.
How Large is the Labor Force in White Oak?
There are 3,276 People in the Labor Forcein in White Oak.
What is the Percentage of People in the Labor Force in White Oak?
68.6% of People are in the Labor Force in White Oak.
What is the Unemployment Rate in White Oak?
Unemployment Rate in White Oak is 4.1%.