Lancaster, TX Map & Demographics
Lancaster Map
Lancaster Overview
$28,707
PER CAPITA INCOME
$73,527
AVG FAMILY INCOME
$65,323
AVG HOUSEHOLD INCOME
2.3%
WAGE / INCOME GAP [ % ]
97.7¢/ $1
WAGE / INCOME GAP [ $ ]
$13,475
FAMILY INCOME DEFICIT
0.41
INEQUALITY / GINI INDEX
40,958
TOTAL POPULATION
18,318
MALE POPULATION
22,640
FEMALE POPULATION
80.91
MALES / 100 FEMALES
123.59
FEMALES / 100 MALES
31.7
MEDIAN AGE
3.5
AVG FAMILY SIZE
2.9
AVG HOUSEHOLD SIZE
20,300
LABOR FORCE [ PEOPLE ]
69.1%
PERCENT IN LABOR FORCE
6.9%
UNEMPLOYMENT RATE
Lancaster Area Codes
Income in Lancaster
Income Overview in Lancaster
Per Capita Income in Lancaster is $28,707, while median incomes of families and households are $73,527 and $65,323 respectively.
| Characteristic | Number | Measure |
| Per Capita Income | 40,958 | $28,707 |
| Median Family Income | 9,865 | $73,527 |
| Mean Family Income | 9,865 | $87,303 |
| Median Household Income | 14,052 | $65,323 |
| Mean Household Income | 14,052 | $80,657 |
| Income Deficit | 9,865 | $13,475 |
| Wage / Income Gap (%) | 40,958 | 2.32% |
| Wage / Income Gap ($) | 40,958 | 97.68¢ per $1 |
| Gini / Inequality Index | 40,958 | 0.41 |
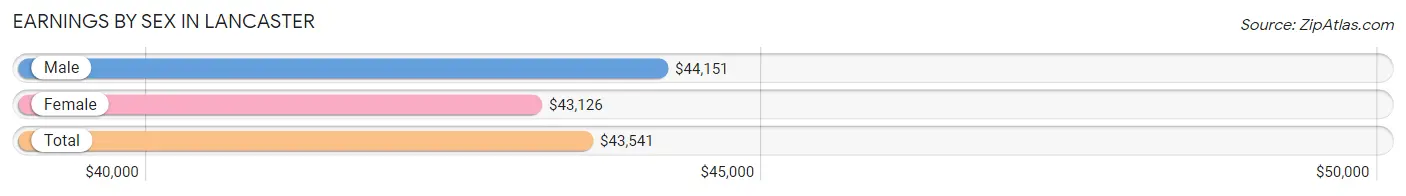
Earnings by Sex in Lancaster
Average Earnings in Lancaster are $43,541, $44,151 for men and $43,126 for women, a difference of 2.3%.
| Sex | Number | Average Earnings |
| Male | 9,313 (45.5%) | $44,151 |
| Female | 11,161 (54.5%) | $43,126 |
| Total | 20,474 (100.0%) | $43,541 |
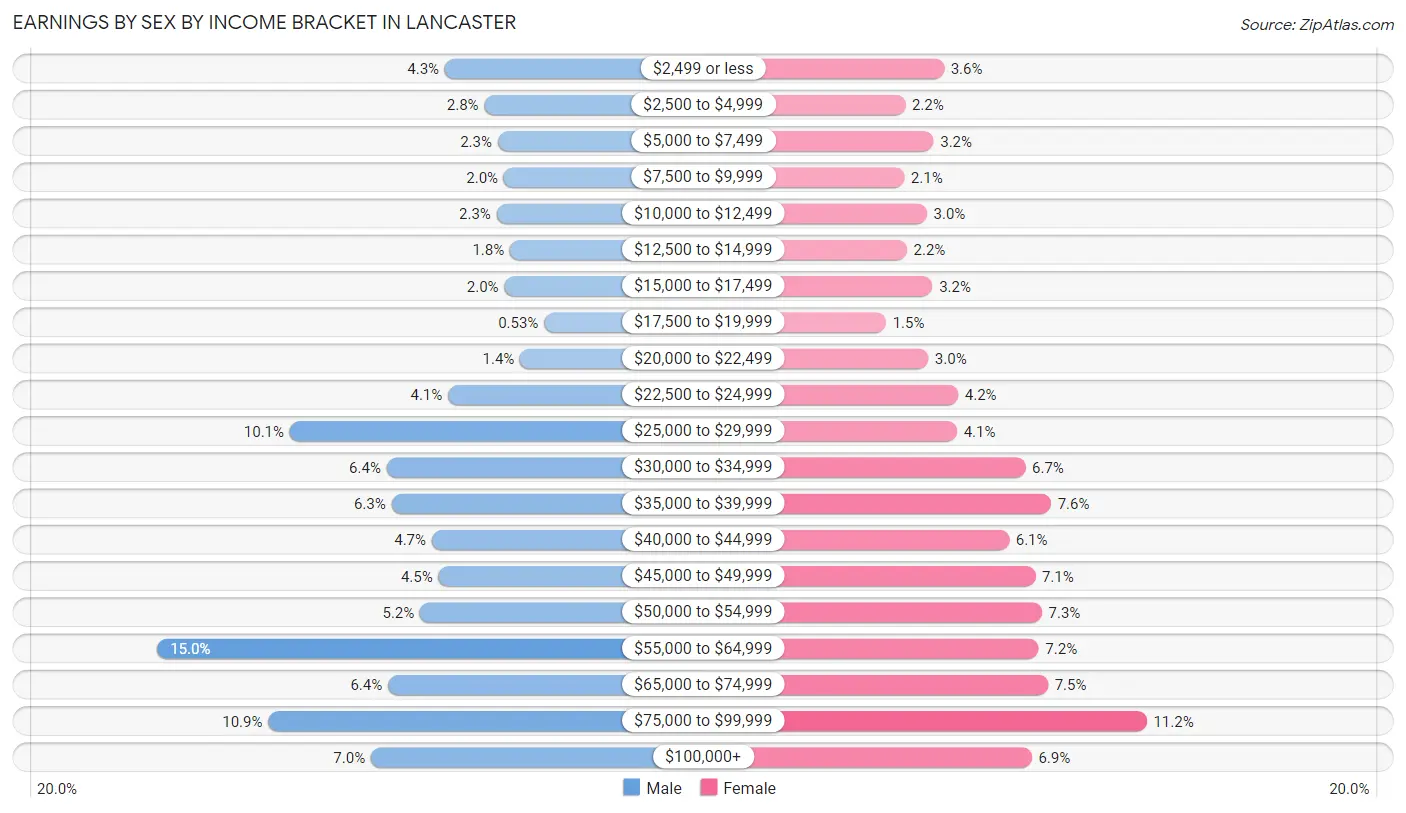
Earnings by Sex by Income Bracket in Lancaster
The most common earnings brackets in Lancaster are $55,000 to $64,999 for men (1,400 | 15.0%) and $75,000 to $99,999 for women (1,253 | 11.2%).
| Income | Male | Female |
| $2,499 or less | 396 (4.3%) | 405 (3.6%) |
| $2,500 to $4,999 | 258 (2.8%) | 243 (2.2%) |
| $5,000 to $7,499 | 211 (2.3%) | 362 (3.2%) |
| $7,500 to $9,999 | 190 (2.0%) | 239 (2.1%) |
| $10,000 to $12,499 | 215 (2.3%) | 334 (3.0%) |
| $12,500 to $14,999 | 169 (1.8%) | 250 (2.2%) |
| $15,000 to $17,499 | 188 (2.0%) | 357 (3.2%) |
| $17,500 to $19,999 | 49 (0.5%) | 163 (1.5%) |
| $20,000 to $22,499 | 133 (1.4%) | 339 (3.0%) |
| $22,500 to $24,999 | 385 (4.1%) | 464 (4.2%) |
| $25,000 to $29,999 | 937 (10.1%) | 460 (4.1%) |
| $30,000 to $34,999 | 599 (6.4%) | 746 (6.7%) |
| $35,000 to $39,999 | 582 (6.2%) | 853 (7.6%) |
| $40,000 to $44,999 | 441 (4.7%) | 678 (6.1%) |
| $45,000 to $49,999 | 418 (4.5%) | 787 (7.0%) |
| $50,000 to $54,999 | 482 (5.2%) | 815 (7.3%) |
| $55,000 to $64,999 | 1,400 (15.0%) | 801 (7.2%) |
| $65,000 to $74,999 | 594 (6.4%) | 840 (7.5%) |
| $75,000 to $99,999 | 1,012 (10.9%) | 1,253 (11.2%) |
| $100,000+ | 654 (7.0%) | 772 (6.9%) |
| Total | 9,313 (100.0%) | 11,161 (100.0%) |
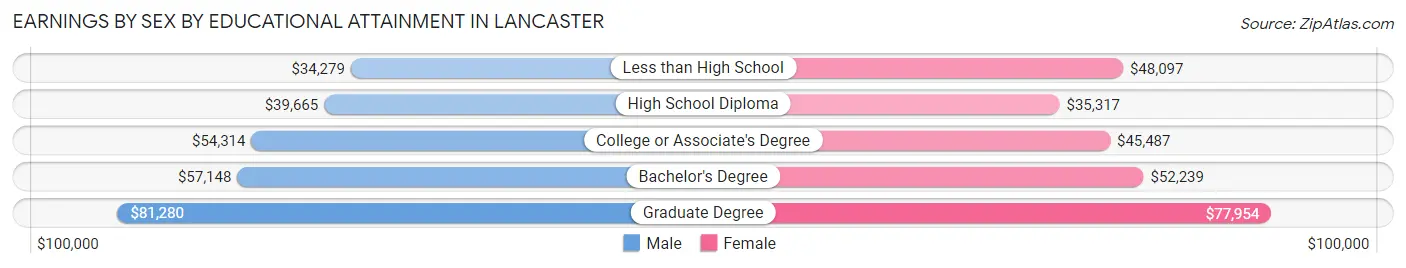
Earnings by Sex by Educational Attainment in Lancaster
Average earnings in Lancaster are $50,069 for men and $46,150 for women, a difference of 7.8%. Men with an educational attainment of graduate degree enjoy the highest average annual earnings of $81,280, while those with less than high school education earn the least with $34,279. Women with an educational attainment of graduate degree earn the most with the average annual earnings of $77,954, while those with high school diploma education have the smallest earnings of $35,317.
| Educational Attainment | Male Income | Female Income |
| Less than High School | $34,279 | $48,097 |
| High School Diploma | $39,665 | $35,317 |
| College or Associate's Degree | $54,314 | $45,487 |
| Bachelor's Degree | $57,148 | $52,239 |
| Graduate Degree | $81,280 | $77,954 |
| Total | $50,069 | $46,150 |
Family Income in Lancaster
Family Income Brackets in Lancaster
According to the Lancaster family income data, there are 2,160 families falling into the $100,000 to $149,999 income range, which is the most common income bracket and makes up 21.9% of all families. Conversely, the $10,000 to $14,999 income bracket is the least frequent group with only 39 families (0.4%) belonging to this category.
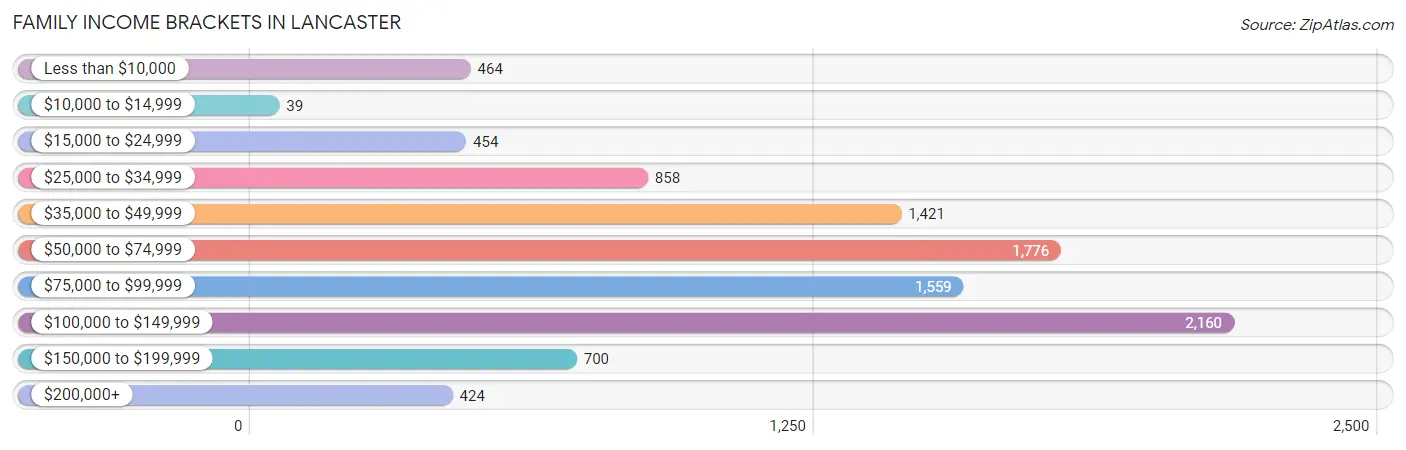
| Income Bracket | # Families | % Families |
| Less than $10,000 | 464 | 4.7% |
| $10,000 to $14,999 | 39 | 0.4% |
| $15,000 to $24,999 | 454 | 4.6% |
| $25,000 to $34,999 | 858 | 8.7% |
| $35,000 to $49,999 | 1,421 | 14.4% |
| $50,000 to $74,999 | 1,776 | 18.0% |
| $75,000 to $99,999 | 1,559 | 15.8% |
| $100,000 to $149,999 | 2,160 | 21.9% |
| $150,000 to $199,999 | 700 | 7.1% |
| $200,000+ | 424 | 4.3% |
Family Income by Famaliy Size in Lancaster
6-person families (490 | 5.0%) account for the highest median family income in Lancaster with $147,750 per family, while 2-person families (3,354 | 34.0%) have the highest median income of $34,511 per family member.
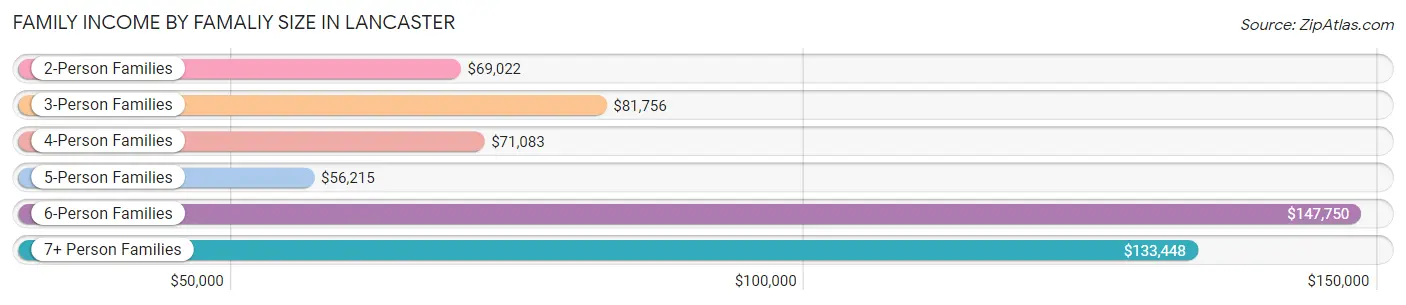
| Income Bracket | # Families | Median Income |
| 2-Person Families | 3,354 (34.0%) | $69,022 |
| 3-Person Families | 2,931 (29.7%) | $81,756 |
| 4-Person Families | 1,933 (19.6%) | $71,083 |
| 5-Person Families | 1,027 (10.4%) | $56,215 |
| 6-Person Families | 490 (5.0%) | $147,750 |
| 7+ Person Families | 130 (1.3%) | $133,448 |
| Total | 9,865 (100.0%) | $73,527 |
Family Income by Number of Earners in Lancaster
The median family income in Lancaster is $73,527, with families comprising 3+ earners (1,189) having the highest median family income of $149,981, while families with no earners (864) have the lowest median family income of $19,518, accounting for 12.0% and 8.8% of families, respectively.
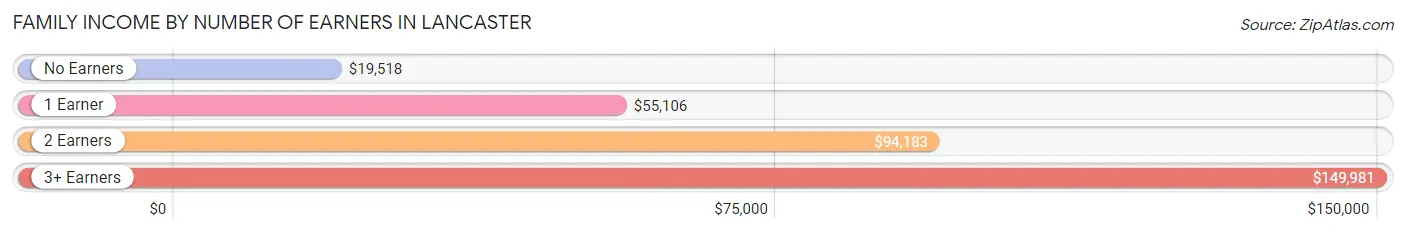
| Number of Earners | # Families | Median Income |
| No Earners | 864 (8.8%) | $19,518 |
| 1 Earner | 4,094 (41.5%) | $55,106 |
| 2 Earners | 3,718 (37.7%) | $94,183 |
| 3+ Earners | 1,189 (12.0%) | $149,981 |
| Total | 9,865 (100.0%) | $73,527 |
Household Income in Lancaster
Household Income Brackets in Lancaster
With 3,007 households falling in the category, the $50,000 to $74,999 income range is the most frequent in Lancaster, accounting for 21.4% of all households. In contrast, only 520 households (3.7%) fall into the $200,000+ income bracket, making it the least populous group.
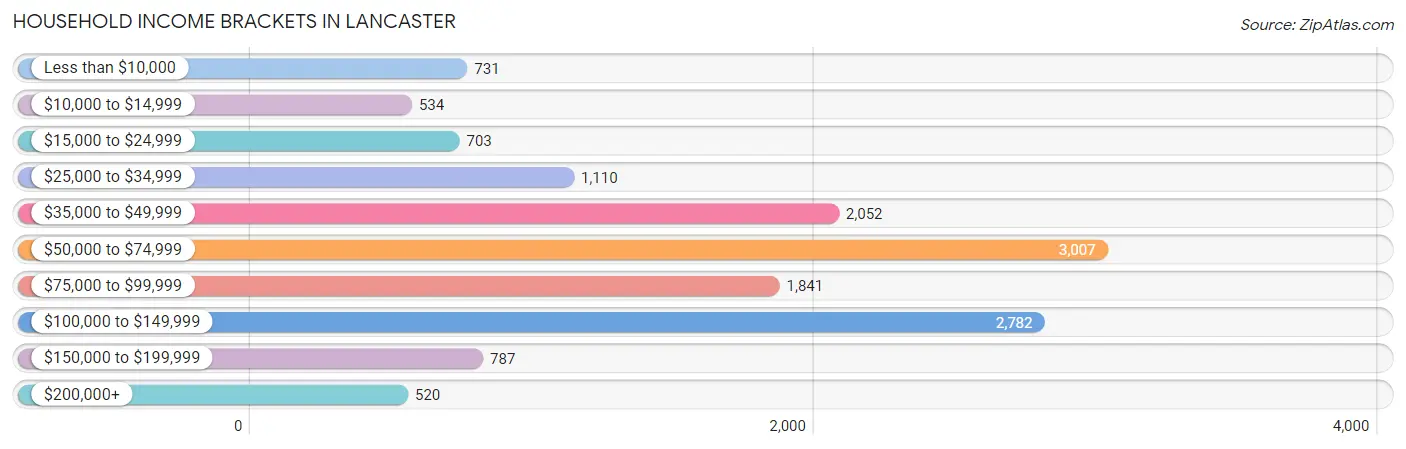
| Income Bracket | # Households | % Households |
| Less than $10,000 | 731 | 5.2% |
| $10,000 to $14,999 | 534 | 3.8% |
| $15,000 to $24,999 | 703 | 5.0% |
| $25,000 to $34,999 | 1,110 | 7.9% |
| $35,000 to $49,999 | 2,052 | 14.6% |
| $50,000 to $74,999 | 3,007 | 21.4% |
| $75,000 to $99,999 | 1,841 | 13.1% |
| $100,000 to $149,999 | 2,782 | 19.8% |
| $150,000 to $199,999 | 787 | 5.6% |
| $200,000+ | 520 | 3.7% |
Household Income by Householder Age in Lancaster
The median household income in Lancaster is $65,323, with the highest median household income of $70,461 found in the 45 to 64 years age bracket for the primary householder. A total of 5,598 households (39.8%) fall into this category. Meanwhile, the 15 to 24 years age bracket for the primary householder has the lowest median household income of $33,478, with 147 households (1.1%) in this group.
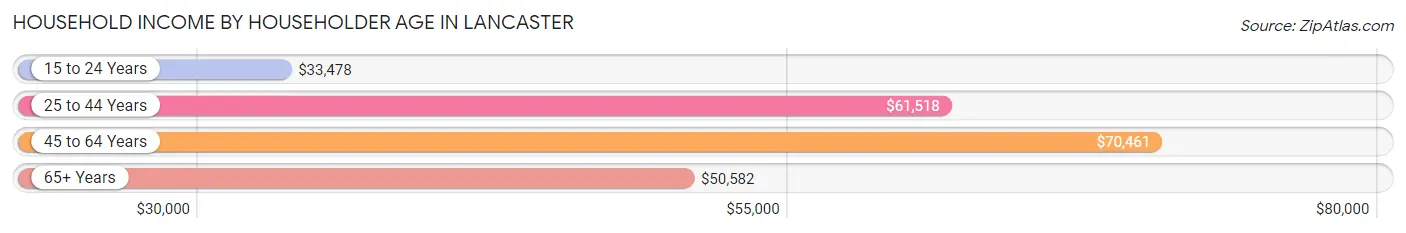
| Income Bracket | # Households | Median Income |
| 15 to 24 Years | 147 (1.1%) | $33,478 |
| 25 to 44 Years | 6,029 (42.9%) | $61,518 |
| 45 to 64 Years | 5,598 (39.8%) | $70,461 |
| 65+ Years | 2,278 (16.2%) | $50,582 |
| Total | 14,052 (100.0%) | $65,323 |
Poverty in Lancaster
Income Below Poverty by Sex and Age in Lancaster
With 13.4% poverty level for males and 15.8% for females among the residents of Lancaster, 5 year old males and under 5 year old females are the most vulnerable to poverty, with 101 males (60.5%) and 595 females (29.6%) in their respective age groups living below the poverty level.
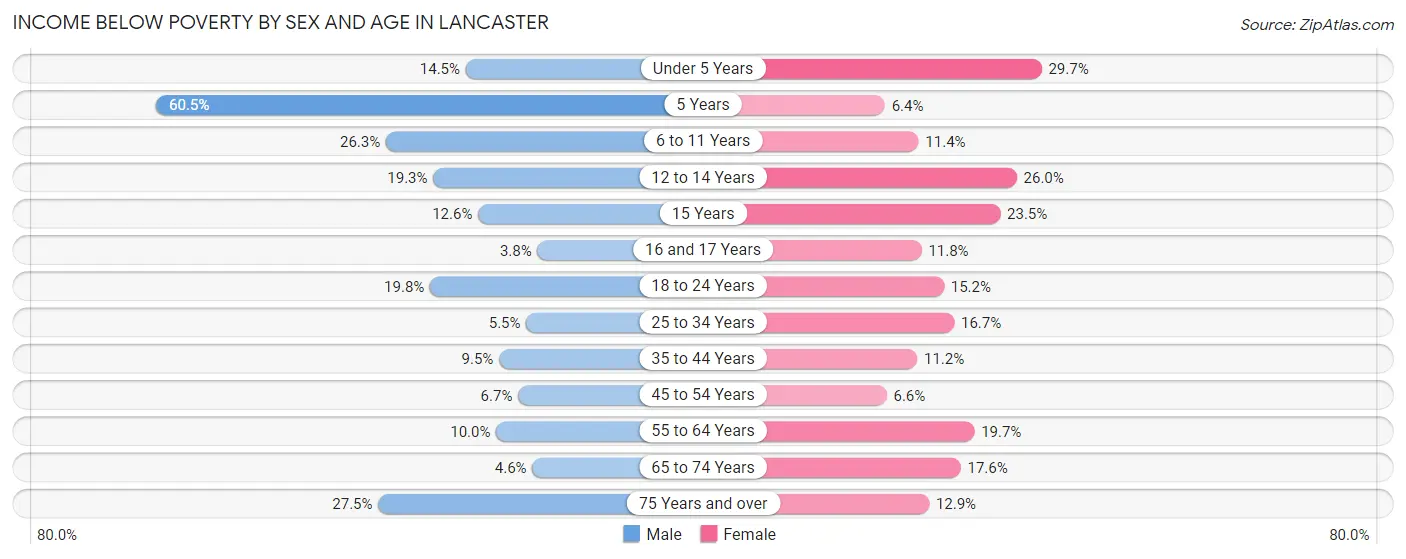
| Age Bracket | Male | Female |
| Under 5 Years | 297 (14.5%) | 595 (29.6%) |
| 5 Years | 101 (60.5%) | 40 (6.4%) |
| 6 to 11 Years | 582 (26.3%) | 198 (11.4%) |
| 12 to 14 Years | 182 (19.3%) | 258 (26.0%) |
| 15 Years | 46 (12.6%) | 95 (23.5%) |
| 16 and 17 Years | 18 (3.8%) | 86 (11.8%) |
| 18 to 24 Years | 343 (19.8%) | 252 (15.1%) |
| 25 to 34 Years | 126 (5.5%) | 623 (16.7%) |
| 35 to 44 Years | 202 (9.5%) | 359 (11.2%) |
| 45 to 54 Years | 155 (6.7%) | 163 (6.6%) |
| 55 to 64 Years | 236 (10.0%) | 497 (19.7%) |
| 65 to 74 Years | 32 (4.6%) | 269 (17.6%) |
| 75 Years and over | 100 (27.5%) | 88 (12.9%) |
| Total | 2,420 (13.4%) | 3,523 (15.8%) |
Income Above Poverty by Sex and Age in Lancaster
According to the poverty statistics in Lancaster, males aged 16 and 17 years and females aged 5 years are the age groups that are most secure financially, with 96.2% of males and 93.6% of females in these age groups living above the poverty line.
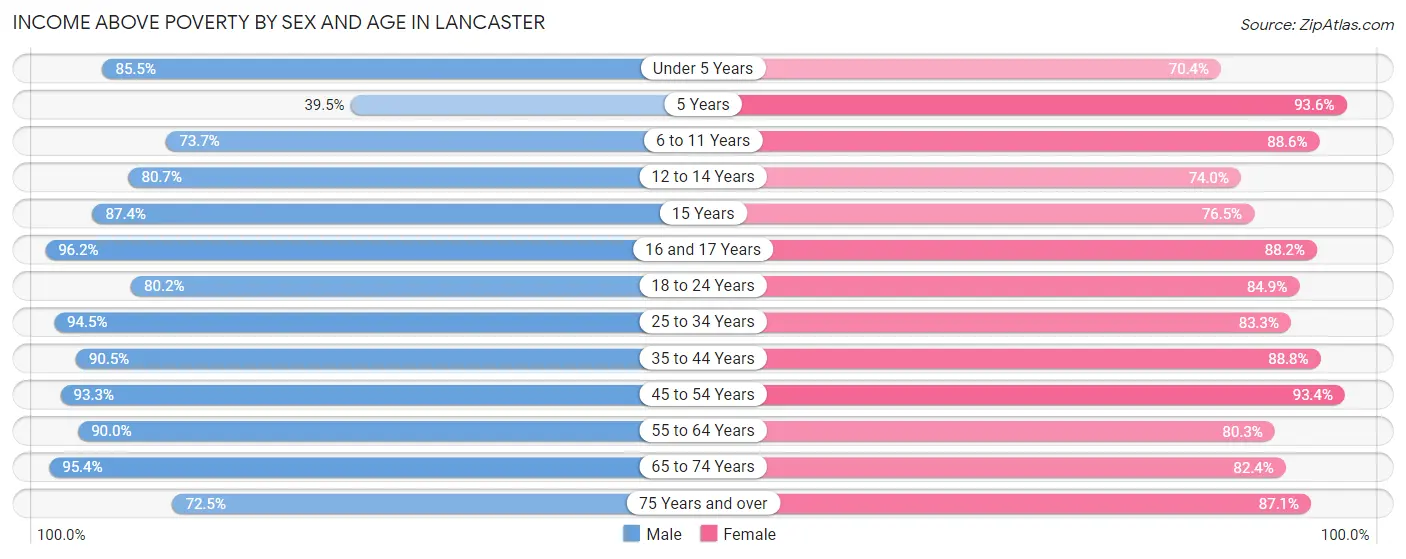
| Age Bracket | Male | Female |
| Under 5 Years | 1,754 (85.5%) | 1,412 (70.4%) |
| 5 Years | 66 (39.5%) | 588 (93.6%) |
| 6 to 11 Years | 1,628 (73.7%) | 1,542 (88.6%) |
| 12 to 14 Years | 761 (80.7%) | 736 (74.0%) |
| 15 Years | 318 (87.4%) | 309 (76.5%) |
| 16 and 17 Years | 452 (96.2%) | 641 (88.2%) |
| 18 to 24 Years | 1,391 (80.2%) | 1,411 (84.9%) |
| 25 to 34 Years | 2,170 (94.5%) | 3,114 (83.3%) |
| 35 to 44 Years | 1,917 (90.5%) | 2,851 (88.8%) |
| 45 to 54 Years | 2,159 (93.3%) | 2,290 (93.4%) |
| 55 to 64 Years | 2,133 (90.0%) | 2,031 (80.3%) |
| 65 to 74 Years | 665 (95.4%) | 1,257 (82.4%) |
| 75 Years and over | 264 (72.5%) | 592 (87.1%) |
| Total | 15,678 (86.6%) | 18,774 (84.2%) |
Income Below Poverty Among Married-Couple Families in Lancaster
The poverty statistics for married-couple families in Lancaster show that 4.4% or 244 of the total 5,562 families live below the poverty line. Families with 5 or more children have the highest poverty rate of 38.5%, comprising of 5 families. On the other hand, families with 1 or 2 children have the lowest poverty rate of 2.7%, which includes 76 families.
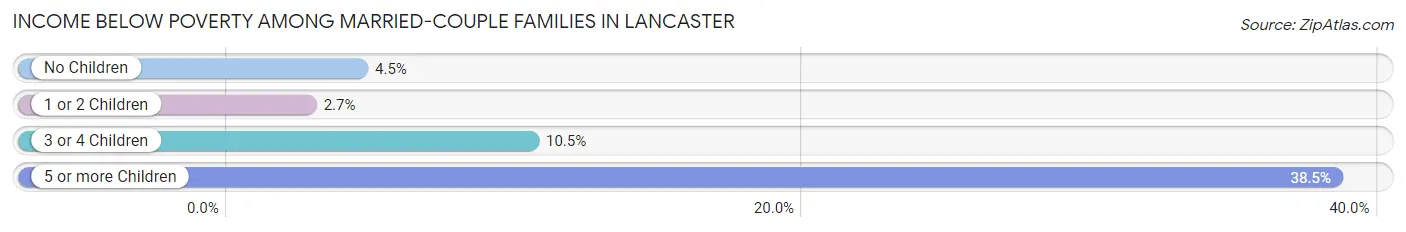
| Children | Above Poverty | Below Poverty |
| No Children | 2,044 (95.5%) | 97 (4.5%) |
| 1 or 2 Children | 2,702 (97.3%) | 76 (2.7%) |
| 3 or 4 Children | 564 (89.5%) | 66 (10.5%) |
| 5 or more Children | 8 (61.5%) | 5 (38.5%) |
| Total | 5,318 (95.6%) | 244 (4.4%) |
Income Below Poverty Among Single-Parent Households in Lancaster
According to the poverty data in Lancaster, 15.1% or 137 single-father households and 19.7% or 668 single-mother households are living below the poverty line. Among single-father households, those with 3 or 4 children have the highest poverty rate, with 6 households (23.1%) experiencing poverty. Likewise, among single-mother households, those with 3 or 4 children have the highest poverty rate, with 379 households (79.0%) falling below the poverty line.
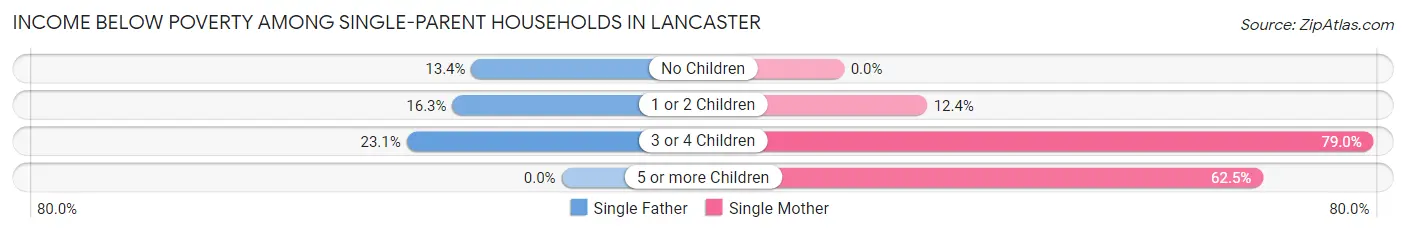
| Children | Single Father | Single Mother |
| No Children | 58 (13.4%) | 0 (0.0%) |
| 1 or 2 Children | 73 (16.3%) | 264 (12.4%) |
| 3 or 4 Children | 6 (23.1%) | 379 (79.0%) |
| 5 or more Children | 0 (0.0%) | 25 (62.5%) |
| Total | 137 (15.1%) | 668 (19.7%) |
Income Below Poverty Among Married-Couple vs Single-Parent Households in Lancaster
The poverty data for Lancaster shows that 244 of the married-couple family households (4.4%) and 805 of the single-parent households (18.7%) are living below the poverty level. Within the married-couple family households, those with 5 or more children have the highest poverty rate, with 5 households (38.5%) falling below the poverty line. Among the single-parent households, those with 3 or 4 children have the highest poverty rate, with 385 household (76.1%) living below poverty.
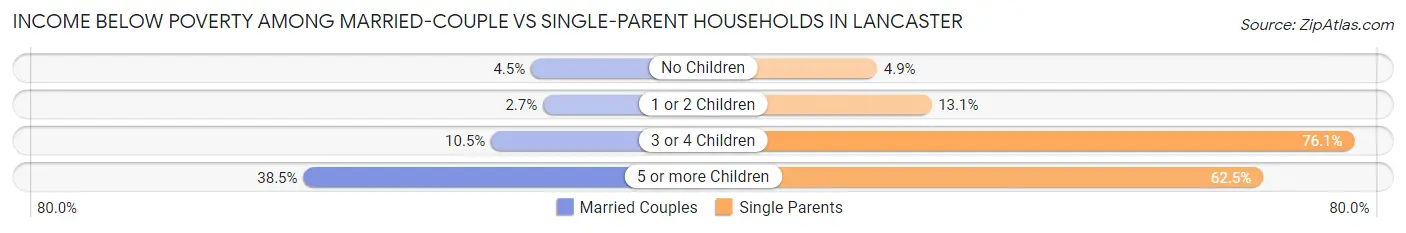
| Children | Married-Couple Families | Single-Parent Households |
| No Children | 97 (4.5%) | 58 (4.9%) |
| 1 or 2 Children | 76 (2.7%) | 337 (13.1%) |
| 3 or 4 Children | 66 (10.5%) | 385 (76.1%) |
| 5 or more Children | 5 (38.5%) | 25 (62.5%) |
| Total | 244 (4.4%) | 805 (18.7%) |
Race in Lancaster
The most populous races in Lancaster are Black / African American (27,660 | 67.5%), Hispanic or Latino (8,864 | 21.6%), and White / Caucasian (7,508 | 18.3%).
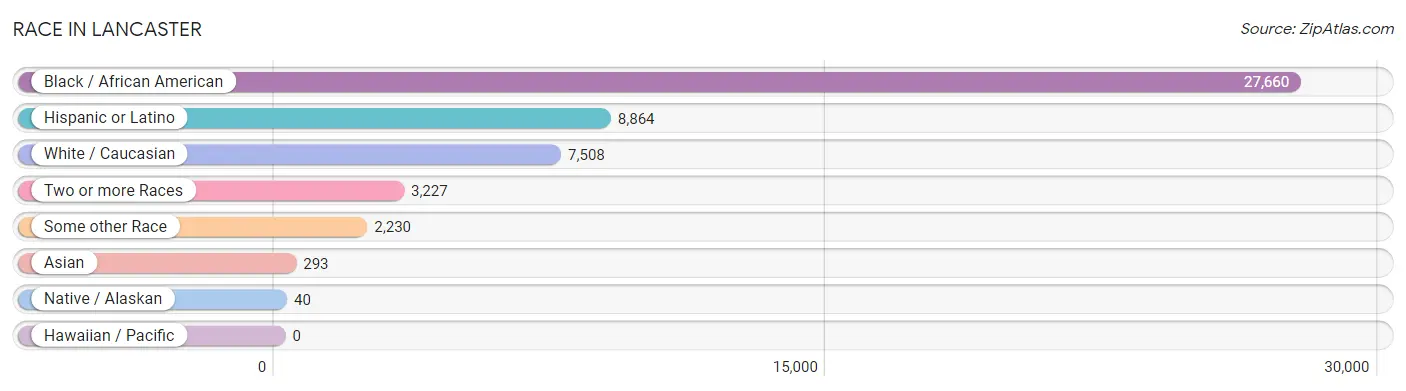
| Race | # Population | % Population |
| Asian | 293 | 0.7% |
| Black / African American | 27,660 | 67.5% |
| Hawaiian / Pacific | 0 | 0.0% |
| Hispanic or Latino | 8,864 | 21.6% |
| Native / Alaskan | 40 | 0.1% |
| White / Caucasian | 7,508 | 18.3% |
| Two or more Races | 3,227 | 7.9% |
| Some other Race | 2,230 | 5.4% |
| Total | 40,958 | 100.0% |
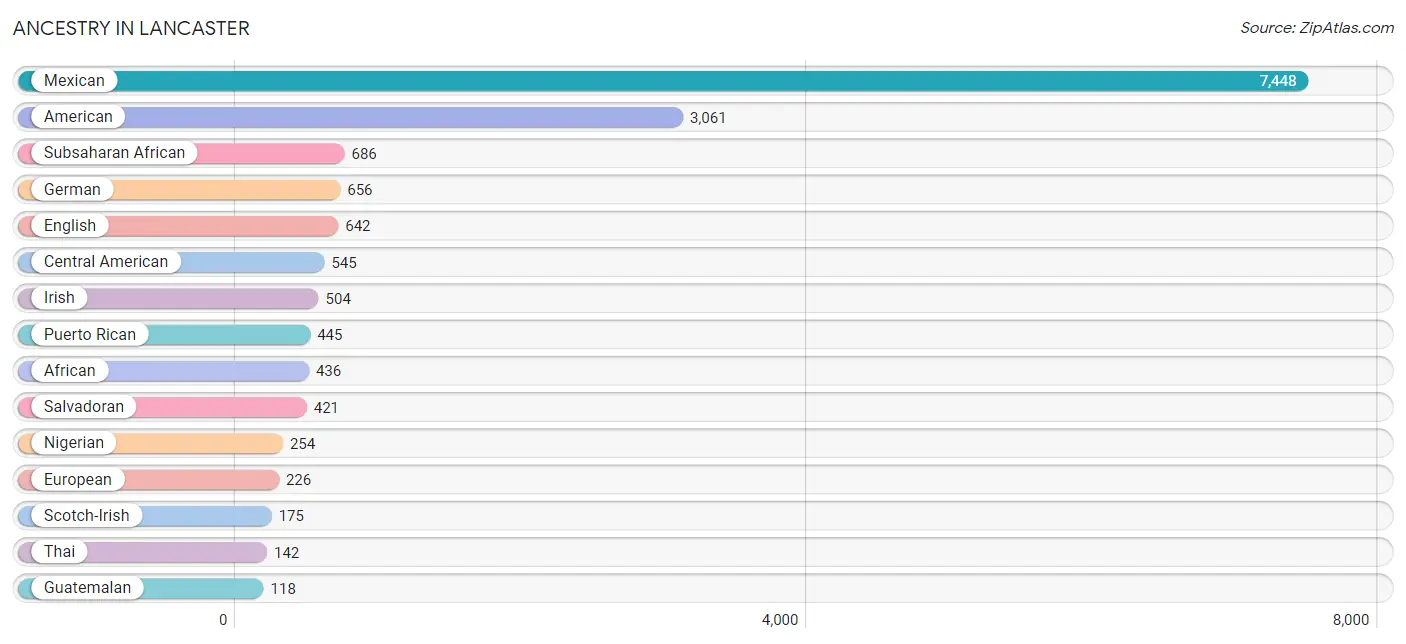
Ancestry in Lancaster
The most populous ancestries reported in Lancaster are Mexican (7,448 | 18.2%), American (3,061 | 7.5%), Subsaharan African (686 | 1.7%), German (656 | 1.6%), and English (642 | 1.6%), together accounting for 30.5% of all Lancaster residents.
| Ancestry | # Population | % Population |
| African | 436 | 1.1% |
| American | 3,061 | 7.5% |
| Argentinean | 12 | 0.0% |
| Belizean | 44 | 0.1% |
| Blackfeet | 110 | 0.3% |
| British | 36 | 0.1% |
| Burmese | 13 | 0.0% |
| Central American | 545 | 1.3% |
| Cherokee | 101 | 0.3% |
| Colombian | 4 | 0.0% |
| Czech | 36 | 0.1% |
| Czechoslovakian | 6 | 0.0% |
| Dutch | 107 | 0.3% |
| Dutch West Indian | 9 | 0.0% |
| English | 642 | 1.6% |
| European | 226 | 0.5% |
| French | 41 | 0.1% |
| German | 656 | 1.6% |
| Guatemalan | 118 | 0.3% |
| Guyanese | 8 | 0.0% |
| Honduran | 6 | 0.0% |
| Irish | 504 | 1.2% |
| Italian | 85 | 0.2% |
| Jamaican | 30 | 0.1% |
| Korean | 91 | 0.2% |
| Malaysian | 34 | 0.1% |
| Mexican | 7,448 | 18.2% |
| Mexican American Indian | 55 | 0.1% |
| Nigerian | 254 | 0.6% |
| Northern European | 15 | 0.0% |
| Polish | 5 | 0.0% |
| Puerto Rican | 445 | 1.1% |
| Salvadoran | 421 | 1.0% |
| Scotch-Irish | 175 | 0.4% |
| Scottish | 83 | 0.2% |
| Sioux | 58 | 0.1% |
| South American | 26 | 0.1% |
| Spaniard | 15 | 0.0% |
| Spanish | 77 | 0.2% |
| Sri Lankan | 7 | 0.0% |
| Subsaharan African | 686 | 1.7% |
| Swedish | 39 | 0.1% |
| Thai | 142 | 0.4% |
| Venezuelan | 10 | 0.0% |
| Welsh | 57 | 0.1% |
| West Indian | 58 | 0.1% | View All 46 Rows |
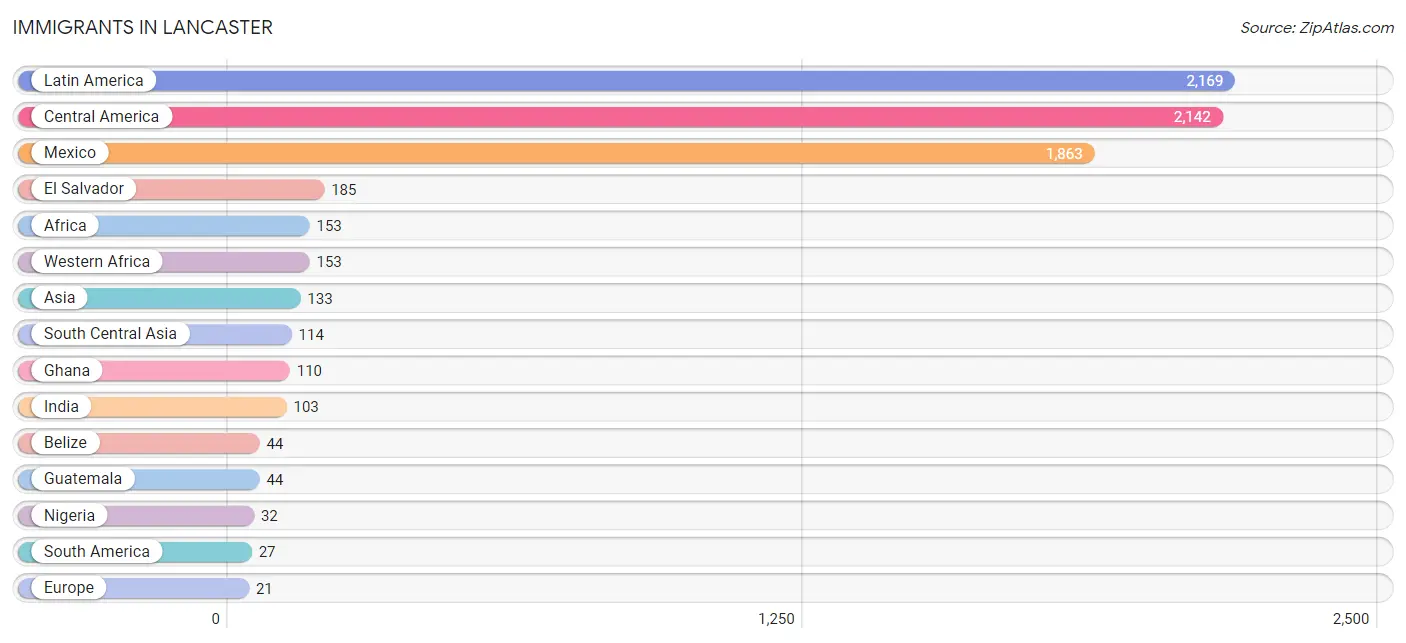
Immigrants in Lancaster
The most numerous immigrant groups reported in Lancaster came from Latin America (2,169 | 5.3%), Central America (2,142 | 5.2%), Mexico (1,863 | 4.5%), El Salvador (185 | 0.4%), and Africa (153 | 0.4%), together accounting for 15.9% of all Lancaster residents.
| Immigration Origin | # Population | % Population |
| Africa | 153 | 0.4% |
| Asia | 133 | 0.3% |
| Austria | 9 | 0.0% |
| Belize | 44 | 0.1% |
| Central America | 2,142 | 5.2% |
| Colombia | 4 | 0.0% |
| El Salvador | 185 | 0.4% |
| Europe | 21 | 0.1% |
| Ghana | 110 | 0.3% |
| Guatemala | 44 | 0.1% |
| Guyana | 13 | 0.0% |
| Honduras | 6 | 0.0% |
| India | 103 | 0.3% |
| Ireland | 12 | 0.0% |
| Laos | 18 | 0.0% |
| Latin America | 2,169 | 5.3% |
| Mexico | 1,863 | 4.5% |
| Nigeria | 32 | 0.1% |
| Northern Europe | 12 | 0.0% |
| Pakistan | 11 | 0.0% |
| South America | 27 | 0.1% |
| South Central Asia | 114 | 0.3% |
| South Eastern Asia | 19 | 0.1% |
| Venezuela | 10 | 0.0% |
| Vietnam | 1 | 0.0% |
| Western Africa | 153 | 0.4% |
| Western Europe | 9 | 0.0% | View All 27 Rows |
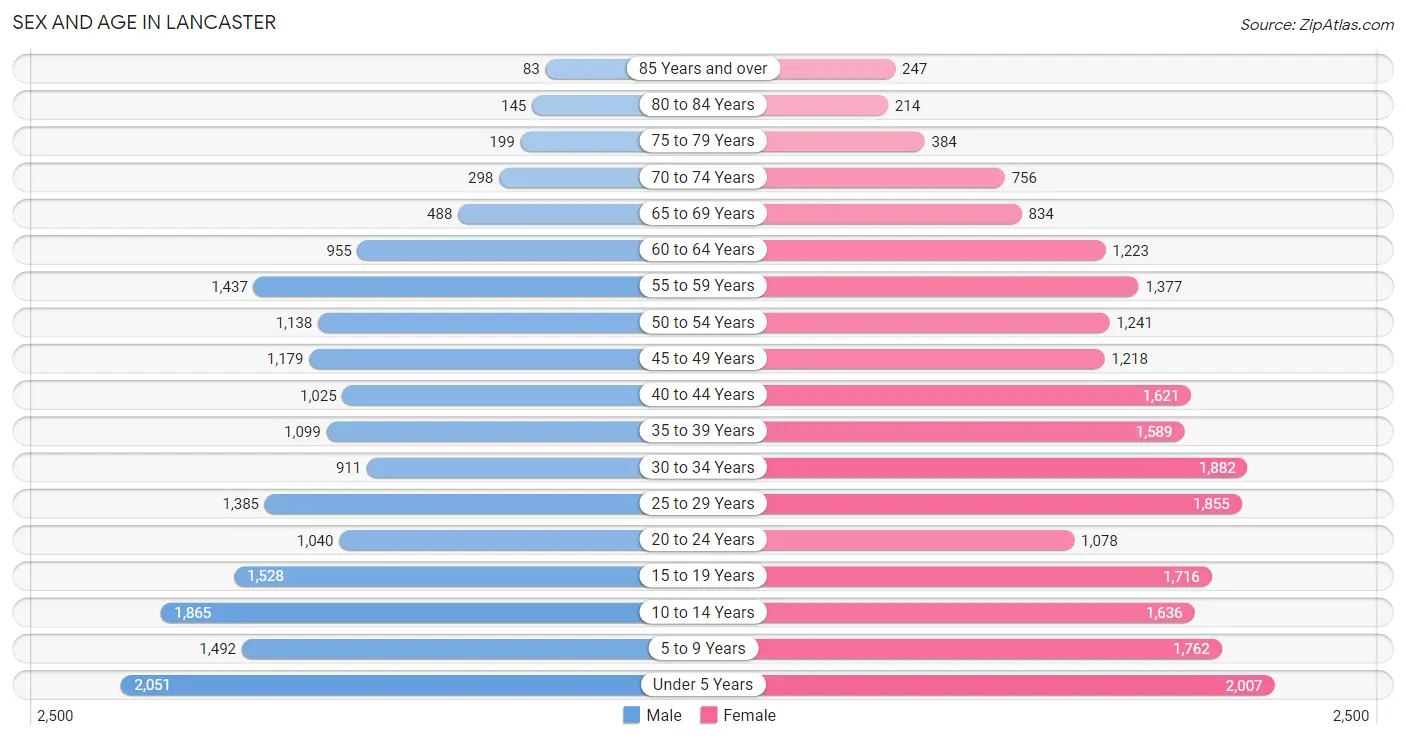
Sex and Age in Lancaster
Sex and Age in Lancaster
The most populous age groups in Lancaster are Under 5 Years (2,051 | 11.2%) for men and Under 5 Years (2,007 | 8.9%) for women.
| Age Bracket | Male | Female |
| Under 5 Years | 2,051 (11.2%) | 2,007 (8.9%) |
| 5 to 9 Years | 1,492 (8.1%) | 1,762 (7.8%) |
| 10 to 14 Years | 1,865 (10.2%) | 1,636 (7.2%) |
| 15 to 19 Years | 1,528 (8.3%) | 1,716 (7.6%) |
| 20 to 24 Years | 1,040 (5.7%) | 1,078 (4.8%) |
| 25 to 29 Years | 1,385 (7.6%) | 1,855 (8.2%) |
| 30 to 34 Years | 911 (5.0%) | 1,882 (8.3%) |
| 35 to 39 Years | 1,099 (6.0%) | 1,589 (7.0%) |
| 40 to 44 Years | 1,025 (5.6%) | 1,621 (7.2%) |
| 45 to 49 Years | 1,179 (6.4%) | 1,218 (5.4%) |
| 50 to 54 Years | 1,138 (6.2%) | 1,241 (5.5%) |
| 55 to 59 Years | 1,437 (7.8%) | 1,377 (6.1%) |
| 60 to 64 Years | 955 (5.2%) | 1,223 (5.4%) |
| 65 to 69 Years | 488 (2.7%) | 834 (3.7%) |
| 70 to 74 Years | 298 (1.6%) | 756 (3.3%) |
| 75 to 79 Years | 199 (1.1%) | 384 (1.7%) |
| 80 to 84 Years | 145 (0.8%) | 214 (0.9%) |
| 85 Years and over | 83 (0.4%) | 247 (1.1%) |
| Total | 18,318 (100.0%) | 22,640 (100.0%) |
Families and Households in Lancaster
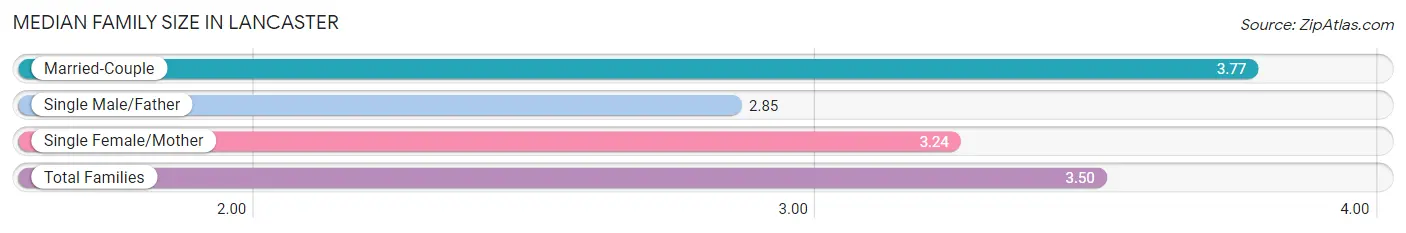
Median Family Size in Lancaster
The median family size in Lancaster is 3.50 persons per family, with married-couple families (5,562 | 56.4%) accounting for the largest median family size of 3.77 persons per family. On the other hand, single male/father families (907 | 9.2%) represent the smallest median family size with 2.85 persons per family.
| Family Type | # Families | Family Size |
| Married-Couple | 5,562 (56.4%) | 3.77 |
| Single Male/Father | 907 (9.2%) | 2.85 |
| Single Female/Mother | 3,396 (34.4%) | 3.24 |
| Total Families | 9,865 (100.0%) | 3.50 |
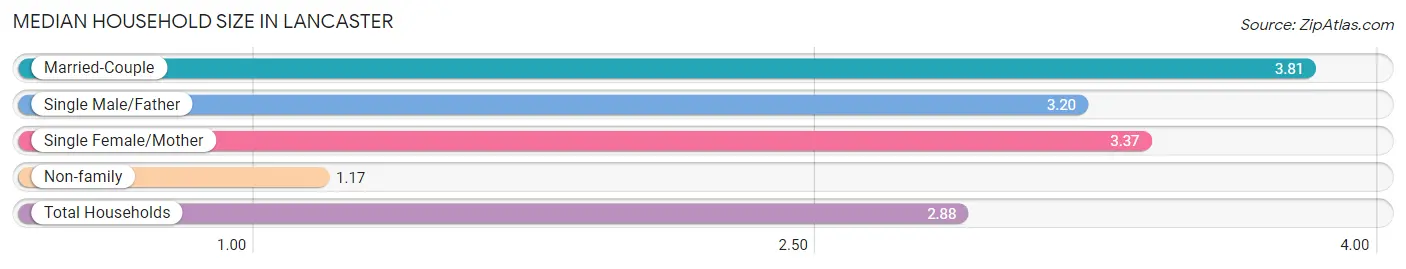
Median Household Size in Lancaster
The median household size in Lancaster is 2.88 persons per household, with married-couple households (5,562 | 39.6%) accounting for the largest median household size of 3.81 persons per household. non-family households (4,187 | 29.8%) represent the smallest median household size with 1.17 persons per household.
| Household Type | # Households | Household Size |
| Married-Couple | 5,562 (39.6%) | 3.81 |
| Single Male/Father | 907 (6.5%) | 3.20 |
| Single Female/Mother | 3,396 (24.2%) | 3.37 |
| Non-family | 4,187 (29.8%) | 1.17 |
| Total Households | 14,052 (100.0%) | 2.88 |
Household Size by Marriage Status in Lancaster
Out of a total of 14,052 households in Lancaster, 9,865 (70.2%) are family households, while 4,187 (29.8%) are nonfamily households. The most numerous type of family households are 3-person households, comprising 3,038, and the most common type of nonfamily households are 1-person households, comprising 3,747.
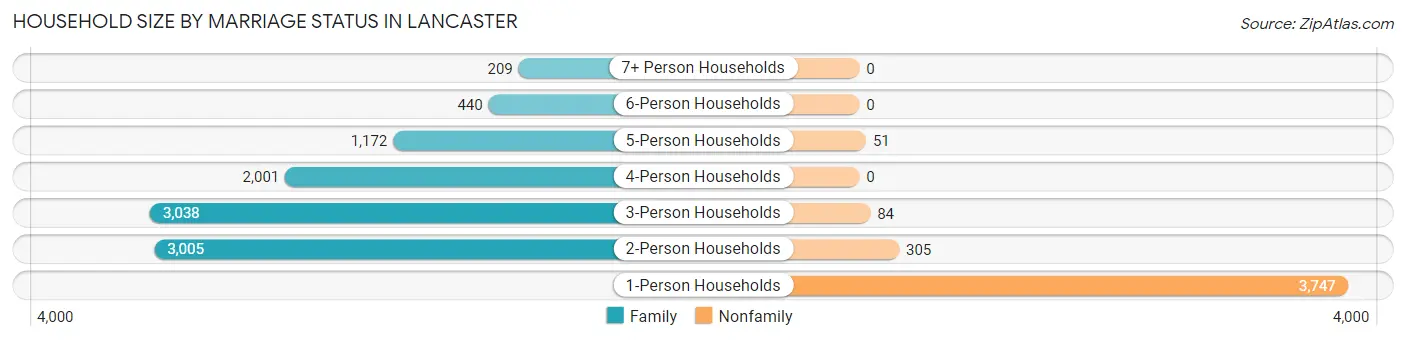
| Household Size | Family Households | Nonfamily Households |
| 1-Person Households | - | 3,747 (26.7%) |
| 2-Person Households | 3,005 (21.4%) | 305 (2.2%) |
| 3-Person Households | 3,038 (21.6%) | 84 (0.6%) |
| 4-Person Households | 2,001 (14.2%) | 0 (0.0%) |
| 5-Person Households | 1,172 (8.3%) | 51 (0.4%) |
| 6-Person Households | 440 (3.1%) | 0 (0.0%) |
| 7+ Person Households | 209 (1.5%) | 0 (0.0%) |
| Total | 9,865 (70.2%) | 4,187 (29.8%) |
Female Fertility in Lancaster
Fertility by Age in Lancaster
Average fertility rate in Lancaster is 106.0 births per 1,000 women. Women in the age bracket of 20 to 34 years have the highest fertility rate with 225.0 births per 1,000 women. Women in the age bracket of 20 to 34 years acount for 91.5% of all women with births.
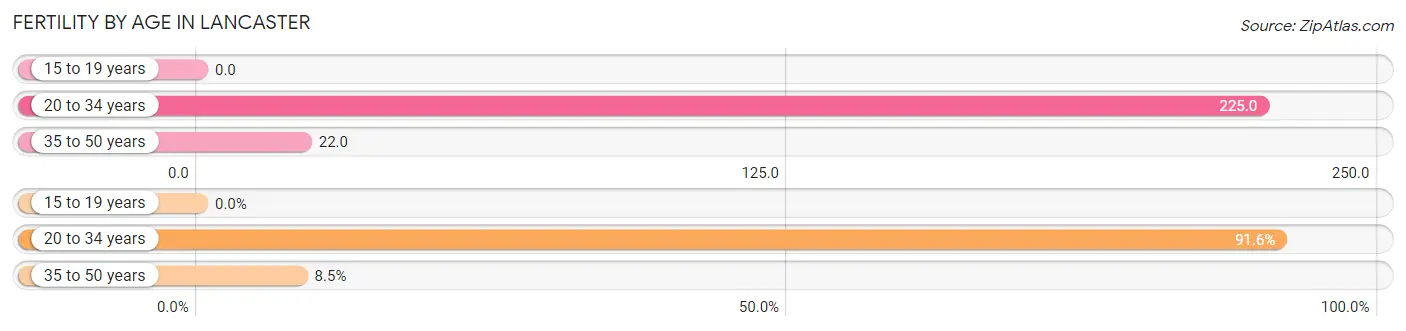
| Age Bracket | Women with Births | Births / 1,000 Women |
| 15 to 19 years | 0 (0.0%) | 0.0 |
| 20 to 34 years | 1,084 (91.5%) | 225.0 |
| 35 to 50 years | 100 (8.5%) | 22.0 |
| Total | 1,184 (100.0%) | 106.0 |
Fertility by Age by Marriage Status in Lancaster
73.6% of women with births (1,184) in Lancaster are married. The highest percentage of unmarried women with births falls into 35 to 50 years age bracket with 52.0% of them unmarried at the time of birth, while the lowest percentage of unmarried women with births belong to 20 to 34 years age bracket with 24.1% of them unmarried.
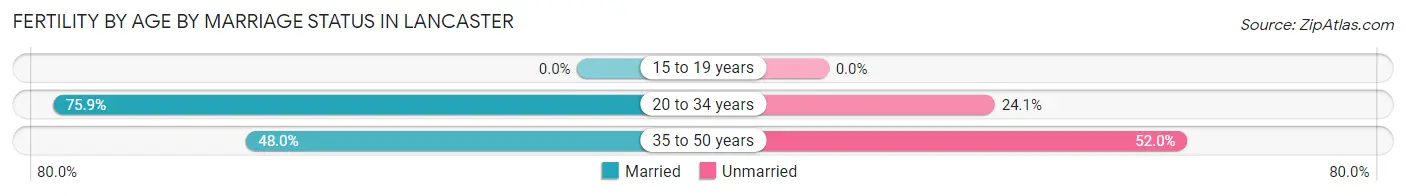
| Age Bracket | Married | Unmarried |
| 15 to 19 years | 0 (0.0%) | 0 (0.0%) |
| 20 to 34 years | 823 (75.9%) | 261 (24.1%) |
| 35 to 50 years | 48 (48.0%) | 52 (52.0%) |
| Total | 871 (73.6%) | 313 (26.4%) |
Fertility by Education in Lancaster
Average fertility rate in Lancaster is 106.0 births per 1,000 women. Women with the education attainment of college or associate's degree have the highest fertility rate of 189.0 births per 1,000 women, while women with the education attainment of less than high school have the lowest fertility at 9.0 births per 1,000 women. Women with the education attainment of college or associate's degree represent 59.3% of all women with births.
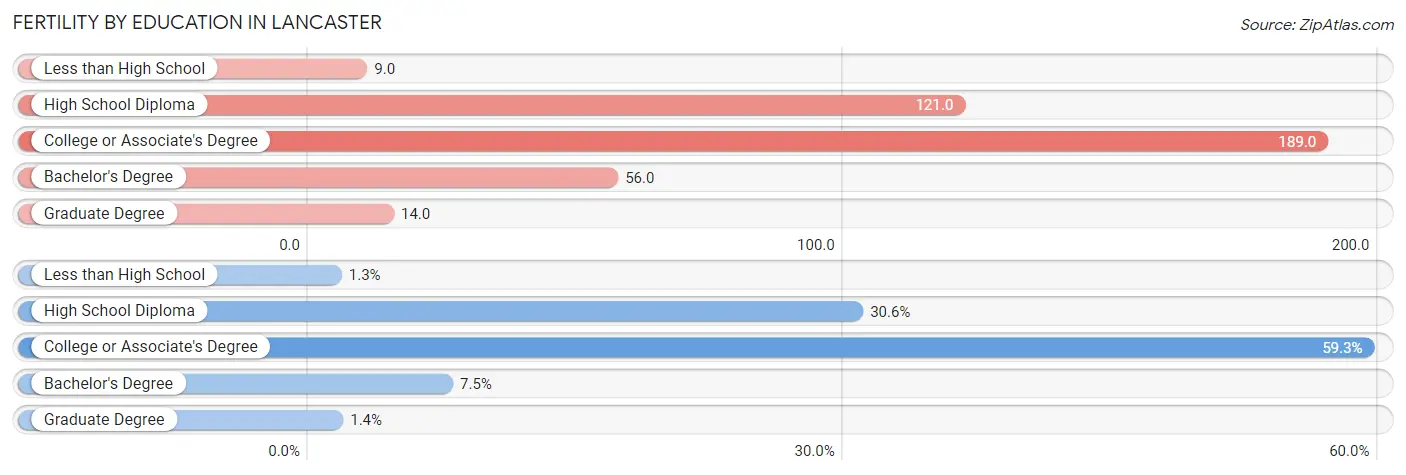
| Educational Attainment | Women with Births | Births / 1,000 Women |
| Less than High School | 15 (1.3%) | 9.0 |
| High School Diploma | 362 (30.6%) | 121.0 |
| College or Associate's Degree | 702 (59.3%) | 189.0 |
| Bachelor's Degree | 89 (7.5%) | 56.0 |
| Graduate Degree | 16 (1.3%) | 14.0 |
| Total | 1,184 (100.0%) | 106.0 |
Fertility by Education by Marriage Status in Lancaster
26.4% of women with births in Lancaster are unmarried. Women with the educational attainment of bachelor's degree are most likely to be married with 100.0% of them married at childbirth, while women with the educational attainment of less than high school are least likely to be married with 100.0% of them unmarried at childbirth.
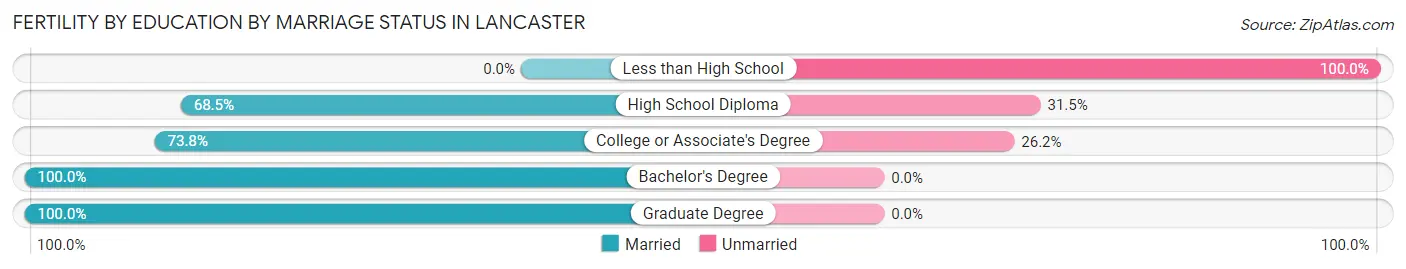
| Educational Attainment | Married | Unmarried |
| Less than High School | 0 (0.0%) | 15 (100.0%) |
| High School Diploma | 248 (68.5%) | 114 (31.5%) |
| College or Associate's Degree | 518 (73.8%) | 184 (26.2%) |
| Bachelor's Degree | 89 (100.0%) | 0 (0.0%) |
| Graduate Degree | 16 (100.0%) | 0 (0.0%) |
| Total | 871 (73.6%) | 313 (26.4%) |
Employment Characteristics in Lancaster
Employment by Class of Employer in Lancaster
Among the 17,848 employed individuals in Lancaster, private company employees (12,941 | 72.5%), local government employees (1,509 | 8.5%), and self-employed (not incorporated) (1,153 | 6.5%) make up the most common classes of employment.
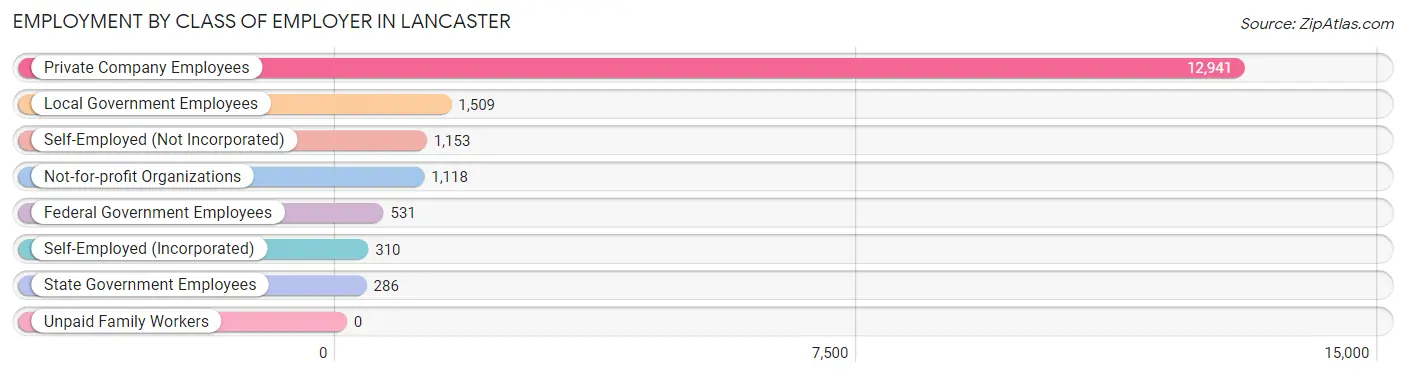
| Employer Class | # Employees | % Employees |
| Private Company Employees | 12,941 | 72.5% |
| Self-Employed (Incorporated) | 310 | 1.7% |
| Self-Employed (Not Incorporated) | 1,153 | 6.5% |
| Not-for-profit Organizations | 1,118 | 6.3% |
| Local Government Employees | 1,509 | 8.5% |
| State Government Employees | 286 | 1.6% |
| Federal Government Employees | 531 | 3.0% |
| Unpaid Family Workers | 0 | 0.0% |
| Total | 17,848 | 100.0% |
Employment Status by Age in Lancaster
According to the labor force statistics for Lancaster, out of the total population over 16 years of age (29,377), 69.1% or 20,300 individuals are in the labor force, with 6.9% or 1,401 of them unemployed. The age group with the highest labor force participation rate is 35 to 44 years, with 91.9% or 4,902 individuals in the labor force. Within the labor force, the 16 to 19 years age range has the highest percentage of unemployed individuals, with 21.4% or 191 of them being unemployed.
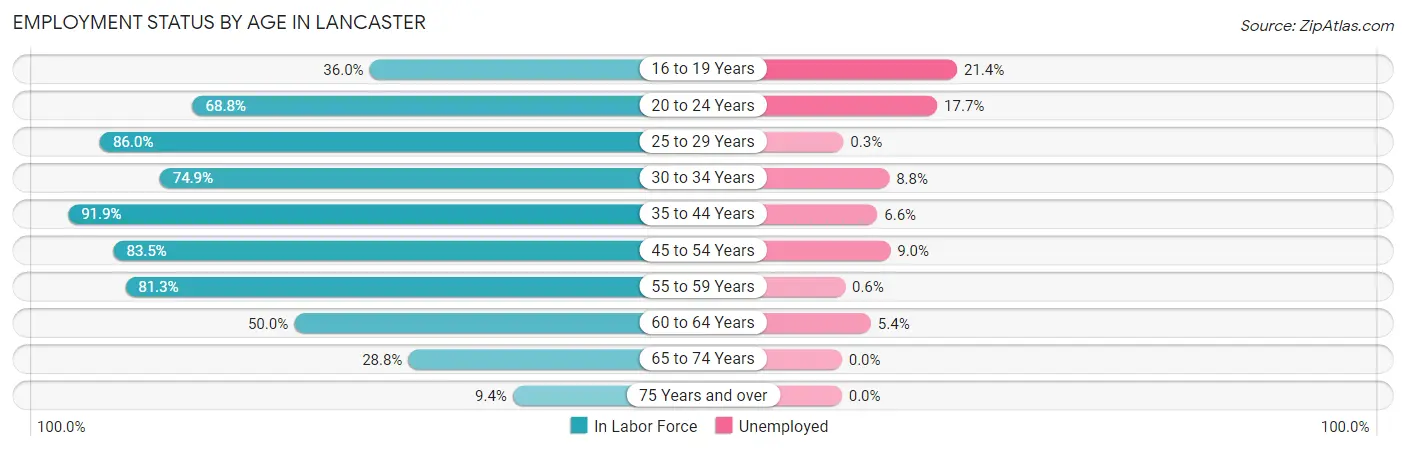
| Age Bracket | In Labor Force | Unemployed |
| 16 to 19 Years | 891 (36.0%) | 191 (21.4%) |
| 20 to 24 Years | 1,457 (68.8%) | 258 (17.7%) |
| 25 to 29 Years | 2,786 (86.0%) | 8 (0.3%) |
| 30 to 34 Years | 2,092 (74.9%) | 184 (8.8%) |
| 35 to 44 Years | 4,902 (91.9%) | 324 (6.6%) |
| 45 to 54 Years | 3,988 (83.5%) | 359 (9.0%) |
| 55 to 59 Years | 2,288 (81.3%) | 14 (0.6%) |
| 60 to 64 Years | 1,089 (50.0%) | 59 (5.4%) |
| 65 to 74 Years | 684 (28.8%) | 0 (0.0%) |
| 75 Years and over | 120 (9.4%) | 0 (0.0%) |
| Total | 20,300 (69.1%) | 1,401 (6.9%) |
Employment Status by Educational Attainment in Lancaster
According to labor force statistics for Lancaster, 81.1% of individuals (17,140) out of the total population between 25 and 64 years of age (21,135) are in the labor force, with 5.5% or 943 of them being unemployed. The group with the highest labor force participation rate are those with the educational attainment of bachelor's degree or higher, with 92.8% or 4,788 individuals in the labor force. Within the labor force, individuals with high school diploma education have the highest percentage of unemployment, with 12.9% or 539 of them being unemployed.
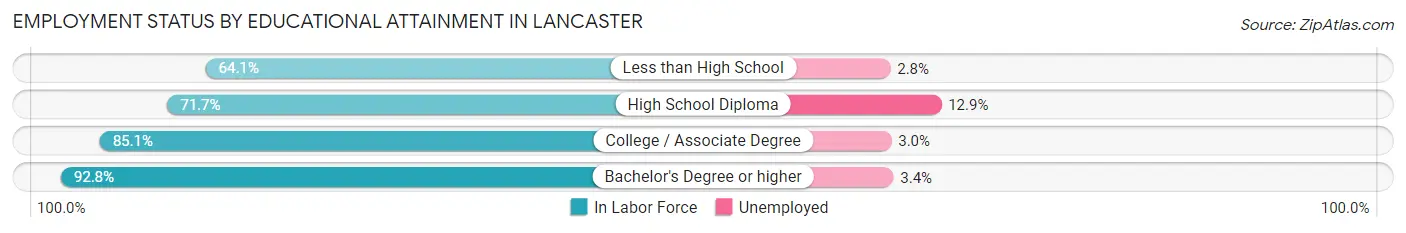
| Educational Attainment | In Labor Force | Unemployed |
| Less than High School | 1,378 (64.1%) | 60 (2.8%) |
| High School Diploma | 4,181 (71.7%) | 752 (12.9%) |
| College / Associate Degree | 6,804 (85.1%) | 240 (3.0%) |
| Bachelor's Degree or higher | 4,788 (92.8%) | 175 (3.4%) |
| Total | 17,140 (81.1%) | 1,162 (5.5%) |
Employment Occupations by Sex in Lancaster
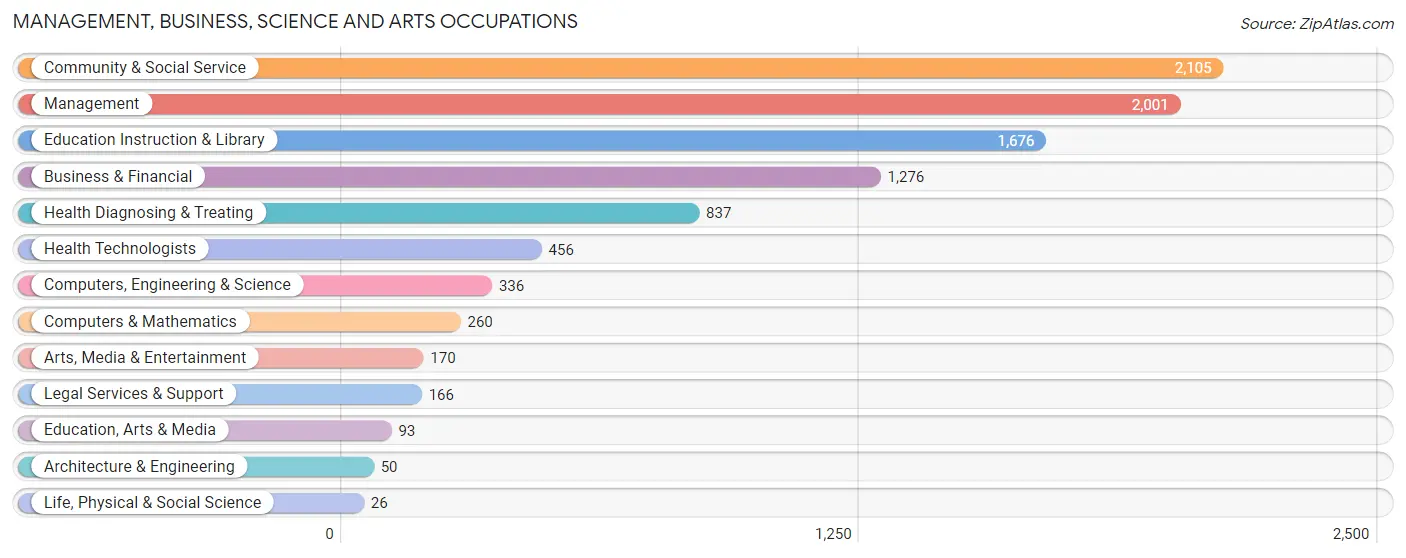
Management, Business, Science and Arts Occupations
The most common Management, Business, Science and Arts occupations in Lancaster are Community & Social Service (2,105 | 11.2%), Management (2,001 | 10.6%), Education Instruction & Library (1,676 | 8.9%), Business & Financial (1,276 | 6.8%), and Health Diagnosing & Treating (837 | 4.4%).
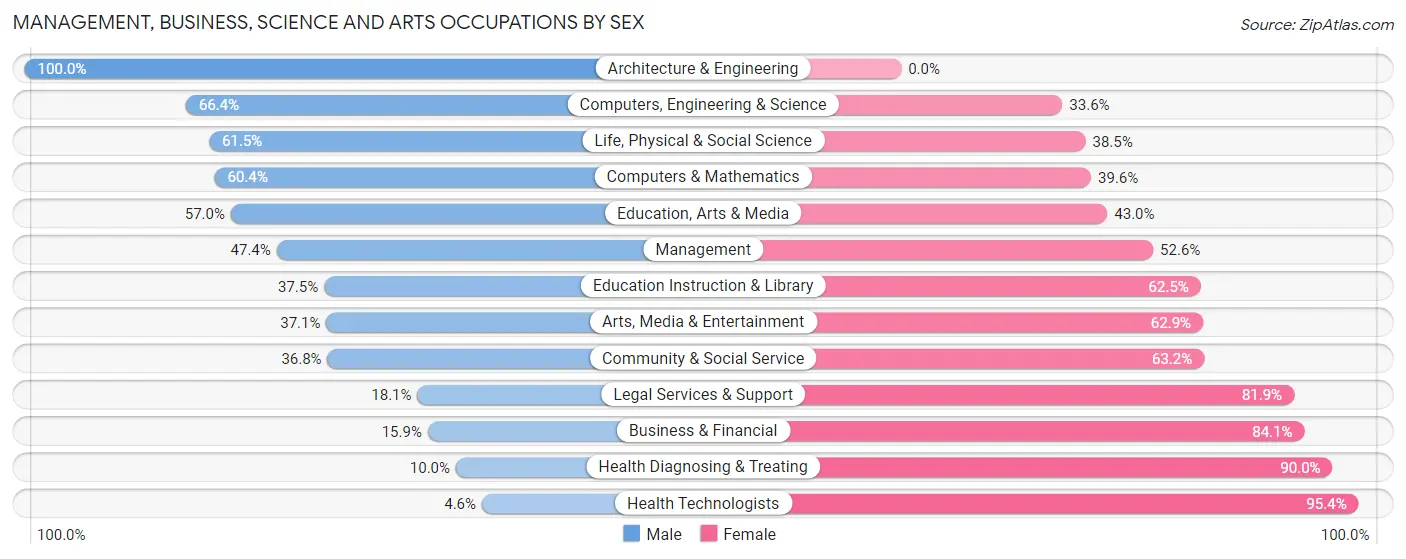
Management, Business, Science and Arts Occupations by Sex
Within the Management, Business, Science and Arts occupations in Lancaster, the most male-oriented occupations are Architecture & Engineering (100.0%), Computers, Engineering & Science (66.4%), and Life, Physical & Social Science (61.5%), while the most female-oriented occupations are Health Technologists (95.4%), Health Diagnosing & Treating (90.0%), and Business & Financial (84.1%).
| Occupation | Male | Female |
| Management | 949 (47.4%) | 1,052 (52.6%) |
| Business & Financial | 203 (15.9%) | 1,073 (84.1%) |
| Computers, Engineering & Science | 223 (66.4%) | 113 (33.6%) |
| Computers & Mathematics | 157 (60.4%) | 103 (39.6%) |
| Architecture & Engineering | 50 (100.0%) | 0 (0.0%) |
| Life, Physical & Social Science | 16 (61.5%) | 10 (38.5%) |
| Community & Social Service | 775 (36.8%) | 1,330 (63.2%) |
| Education, Arts & Media | 53 (57.0%) | 40 (43.0%) |
| Legal Services & Support | 30 (18.1%) | 136 (81.9%) |
| Education Instruction & Library | 629 (37.5%) | 1,047 (62.5%) |
| Arts, Media & Entertainment | 63 (37.1%) | 107 (62.9%) |
| Health Diagnosing & Treating | 84 (10.0%) | 753 (90.0%) |
| Health Technologists | 21 (4.6%) | 435 (95.4%) |
| Total (Category) | 2,234 (34.1%) | 4,321 (65.9%) |
| Total (Overall) | 8,801 (46.7%) | 10,042 (53.3%) |
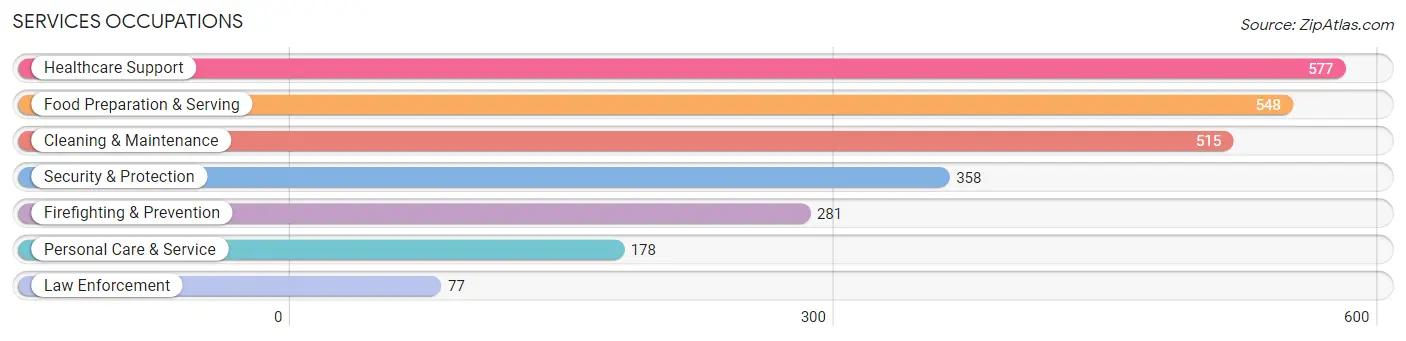
Services Occupations
The most common Services occupations in Lancaster are Healthcare Support (577 | 3.1%), Food Preparation & Serving (548 | 2.9%), Cleaning & Maintenance (515 | 2.7%), Security & Protection (358 | 1.9%), and Firefighting & Prevention (281 | 1.5%).
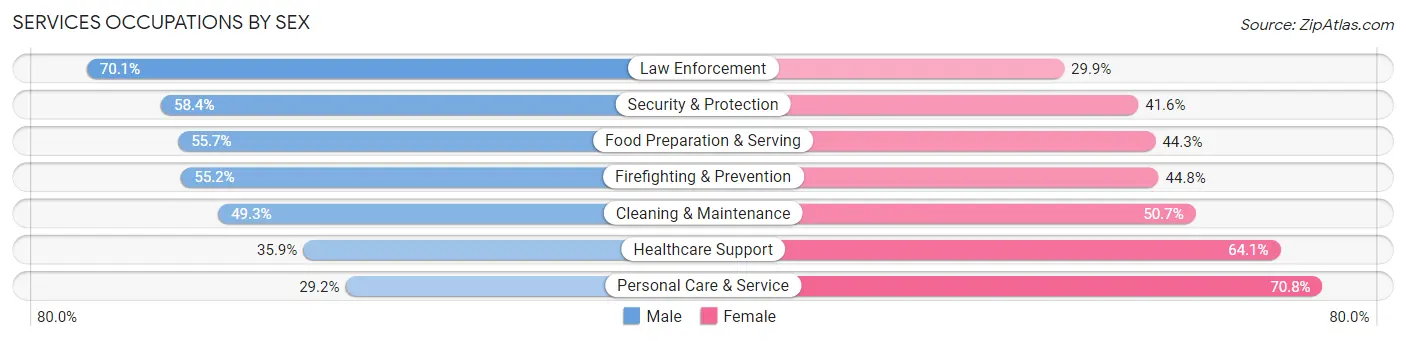
Services Occupations by Sex
Within the Services occupations in Lancaster, the most male-oriented occupations are Law Enforcement (70.1%), Security & Protection (58.4%), and Food Preparation & Serving (55.7%), while the most female-oriented occupations are Personal Care & Service (70.8%), Healthcare Support (64.1%), and Cleaning & Maintenance (50.7%).
| Occupation | Male | Female |
| Healthcare Support | 207 (35.9%) | 370 (64.1%) |
| Security & Protection | 209 (58.4%) | 149 (41.6%) |
| Firefighting & Prevention | 155 (55.2%) | 126 (44.8%) |
| Law Enforcement | 54 (70.1%) | 23 (29.9%) |
| Food Preparation & Serving | 305 (55.7%) | 243 (44.3%) |
| Cleaning & Maintenance | 254 (49.3%) | 261 (50.7%) |
| Personal Care & Service | 52 (29.2%) | 126 (70.8%) |
| Total (Category) | 1,027 (47.2%) | 1,149 (52.8%) |
| Total (Overall) | 8,801 (46.7%) | 10,042 (53.3%) |
Sales and Office Occupations
The most common Sales and Office occupations in Lancaster are Office & Administration (2,868 | 15.2%), and Sales & Related (1,659 | 8.8%).
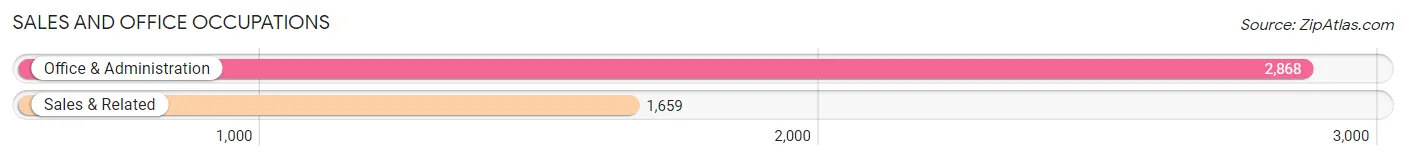
Sales and Office Occupations by Sex

| Occupation | Male | Female |
| Sales & Related | 501 (30.2%) | 1,158 (69.8%) |
| Office & Administration | 563 (19.6%) | 2,305 (80.4%) |
| Total (Category) | 1,064 (23.5%) | 3,463 (76.5%) |
| Total (Overall) | 8,801 (46.7%) | 10,042 (53.3%) |
Natural Resources, Construction and Maintenance Occupations
The most common Natural Resources, Construction and Maintenance occupations in Lancaster are Construction & Extraction (1,032 | 5.5%), and Installation, Maintenance & Repair (534 | 2.8%).
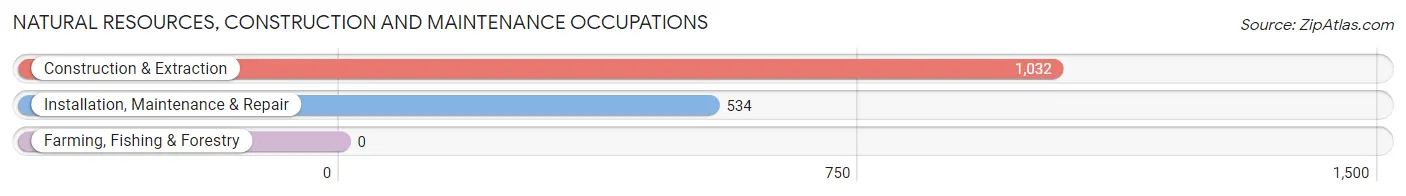
Natural Resources, Construction and Maintenance Occupations by Sex
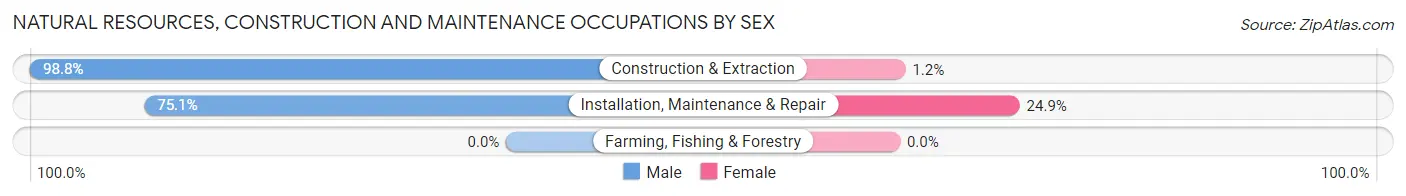
| Occupation | Male | Female |
| Farming, Fishing & Forestry | 0 (0.0%) | 0 (0.0%) |
| Construction & Extraction | 1,020 (98.8%) | 12 (1.2%) |
| Installation, Maintenance & Repair | 401 (75.1%) | 133 (24.9%) |
| Total (Category) | 1,421 (90.7%) | 145 (9.3%) |
| Total (Overall) | 8,801 (46.7%) | 10,042 (53.3%) |
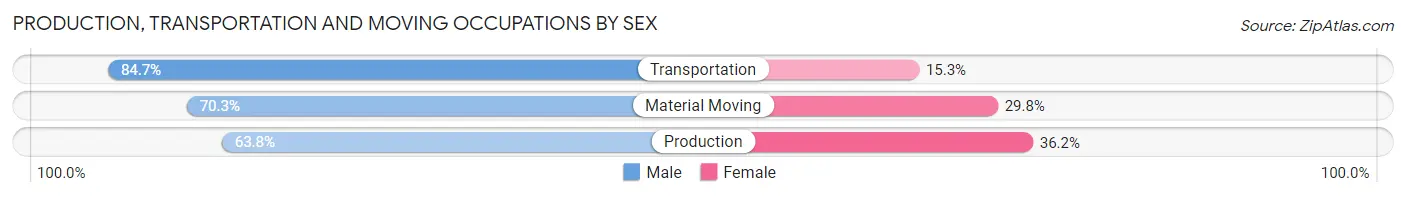
Production, Transportation and Moving Occupations
The most common Production, Transportation and Moving occupations in Lancaster are Transportation (1,921 | 10.2%), Material Moving (1,385 | 7.3%), and Production (713 | 3.8%).
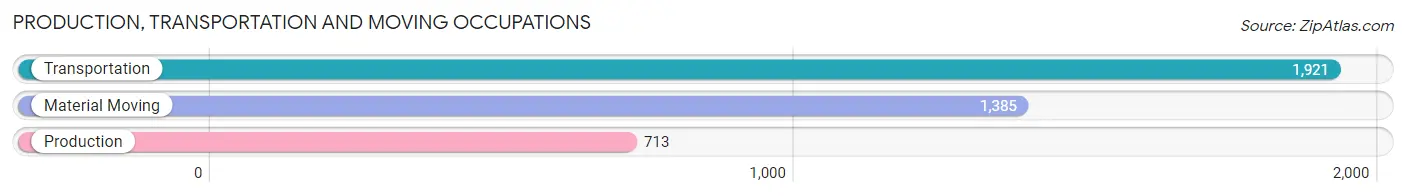
Production, Transportation and Moving Occupations by Sex
| Occupation | Male | Female |
| Production | 455 (63.8%) | 258 (36.2%) |
| Transportation | 1,627 (84.7%) | 294 (15.3%) |
| Material Moving | 973 (70.3%) | 412 (29.7%) |
| Total (Category) | 3,055 (76.0%) | 964 (24.0%) |
| Total (Overall) | 8,801 (46.7%) | 10,042 (53.3%) |
Employment Industries by Sex in Lancaster
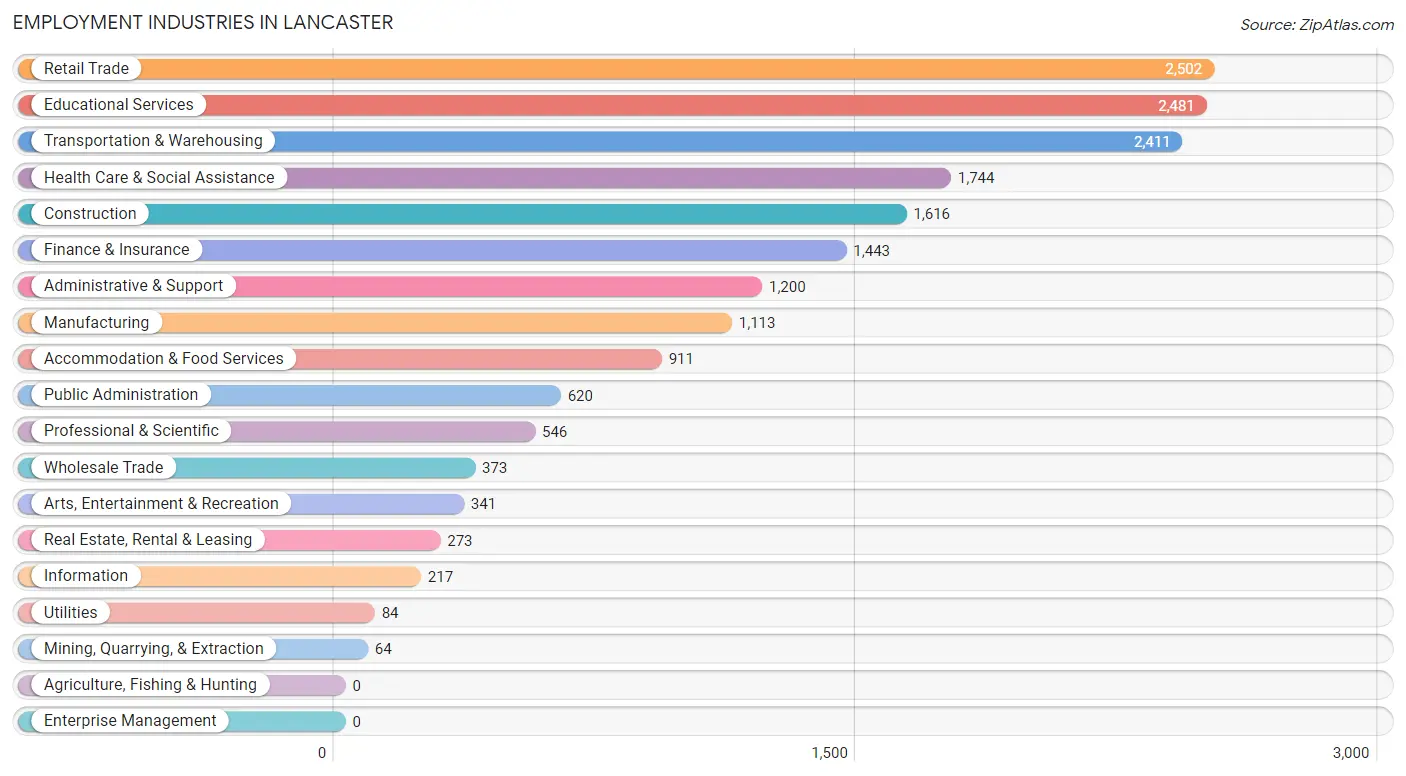
Employment Industries in Lancaster
The major employment industries in Lancaster include Retail Trade (2,502 | 13.3%), Educational Services (2,481 | 13.2%), Transportation & Warehousing (2,411 | 12.8%), Health Care & Social Assistance (1,744 | 9.3%), and Construction (1,616 | 8.6%).
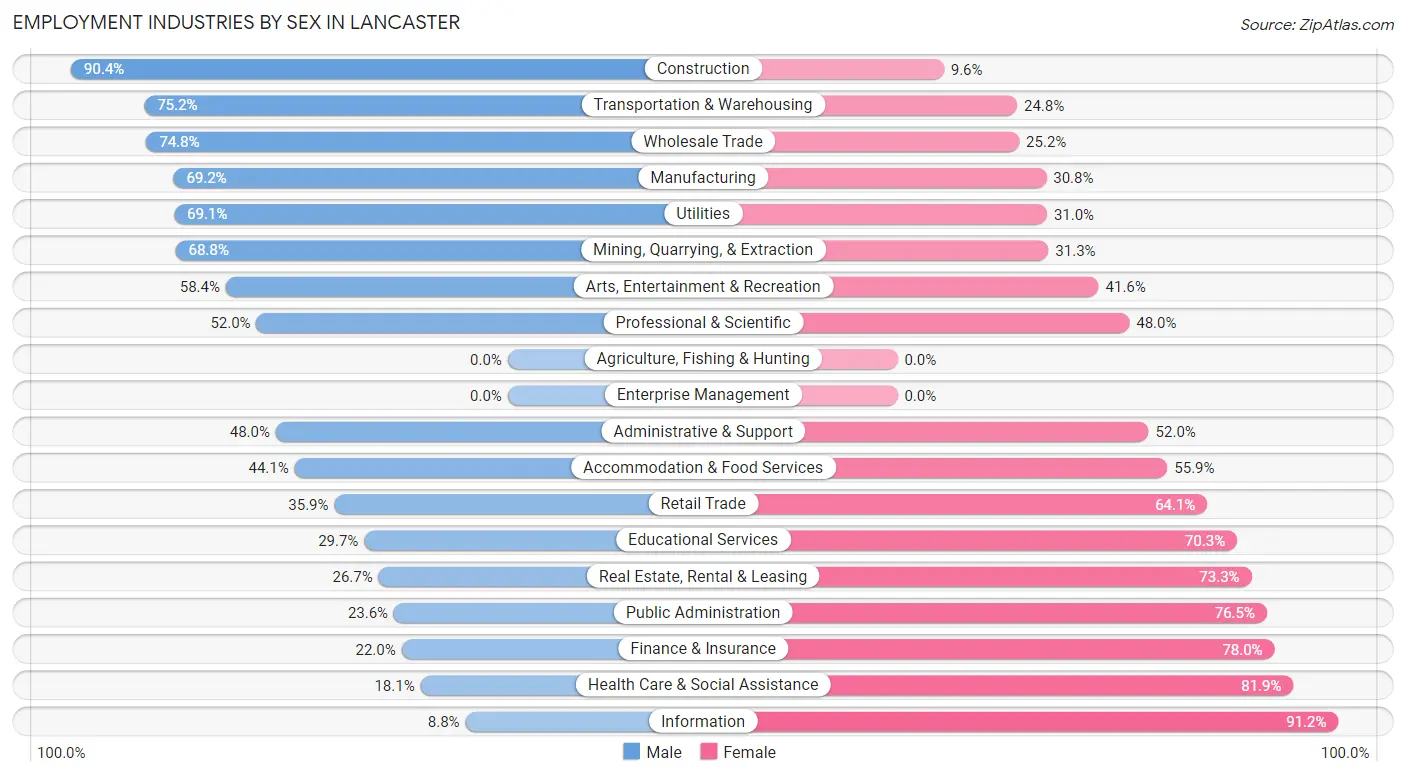
Employment Industries by Sex in Lancaster
The Lancaster industries that see more men than women are Construction (90.4%), Transportation & Warehousing (75.2%), and Wholesale Trade (74.8%), whereas the industries that tend to have a higher number of women are Information (91.2%), Health Care & Social Assistance (81.9%), and Finance & Insurance (78.0%).
| Industry | Male | Female |
| Agriculture, Fishing & Hunting | 0 (0.0%) | 0 (0.0%) |
| Mining, Quarrying, & Extraction | 44 (68.8%) | 20 (31.2%) |
| Construction | 1,461 (90.4%) | 155 (9.6%) |
| Manufacturing | 770 (69.2%) | 343 (30.8%) |
| Wholesale Trade | 279 (74.8%) | 94 (25.2%) |
| Retail Trade | 898 (35.9%) | 1,604 (64.1%) |
| Transportation & Warehousing | 1,814 (75.2%) | 597 (24.8%) |
| Utilities | 58 (69.1%) | 26 (30.9%) |
| Information | 19 (8.8%) | 198 (91.2%) |
| Finance & Insurance | 317 (22.0%) | 1,126 (78.0%) |
| Real Estate, Rental & Leasing | 73 (26.7%) | 200 (73.3%) |
| Professional & Scientific | 284 (52.0%) | 262 (48.0%) |
| Enterprise Management | 0 (0.0%) | 0 (0.0%) |
| Administrative & Support | 576 (48.0%) | 624 (52.0%) |
| Educational Services | 737 (29.7%) | 1,744 (70.3%) |
| Health Care & Social Assistance | 315 (18.1%) | 1,429 (81.9%) |
| Arts, Entertainment & Recreation | 199 (58.4%) | 142 (41.6%) |
| Accommodation & Food Services | 402 (44.1%) | 509 (55.9%) |
| Public Administration | 146 (23.5%) | 474 (76.4%) |
| Total | 8,801 (46.7%) | 10,042 (53.3%) |
Education in Lancaster
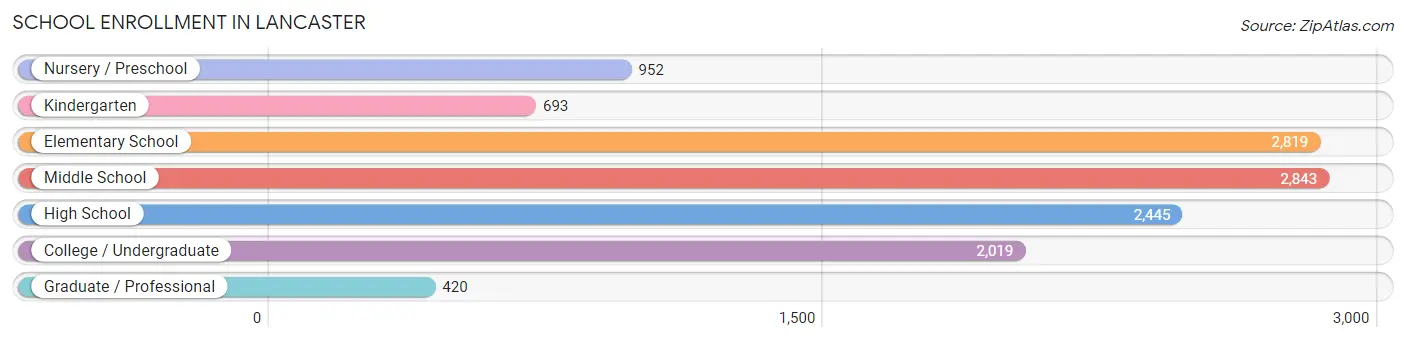
School Enrollment in Lancaster
The most common levels of schooling among the 12,191 students in Lancaster are middle school (2,843 | 23.3%), elementary school (2,819 | 23.1%), and high school (2,445 | 20.1%).
| School Level | # Students | % Students |
| Nursery / Preschool | 952 | 7.8% |
| Kindergarten | 693 | 5.7% |
| Elementary School | 2,819 | 23.1% |
| Middle School | 2,843 | 23.3% |
| High School | 2,445 | 20.1% |
| College / Undergraduate | 2,019 | 16.6% |
| Graduate / Professional | 420 | 3.5% |
| Total | 12,191 | 100.0% |
School Enrollment by Age by Funding Source in Lancaster
Out of a total of 12,191 students who are enrolled in schools in Lancaster, 1,256 (10.3%) attend a private institution, while the remaining 10,935 (89.7%) are enrolled in public schools. The age group of 25 to 34 year olds has the highest likelihood of being enrolled in private schools, with 257 (39.1% in the age bracket) enrolled. Conversely, the age group of 15 to 17 year olds has the lowest likelihood of being enrolled in a private school, with 1,912 (100.0% in the age bracket) attending a public institution.
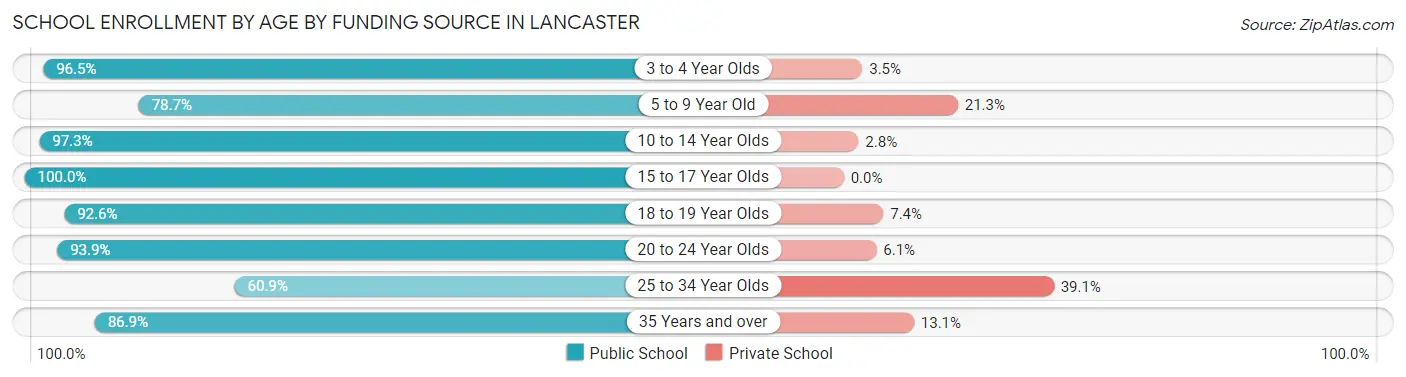
| Age Bracket | Public School | Private School |
| 3 to 4 Year Olds | 751 (96.5%) | 27 (3.5%) |
| 5 to 9 Year Old | 2,530 (78.7%) | 683 (21.3%) |
| 10 to 14 Year Olds | 3,396 (97.3%) | 96 (2.8%) |
| 15 to 17 Year Olds | 1,912 (100.0%) | 0 (0.0%) |
| 18 to 19 Year Olds | 791 (92.6%) | 63 (7.4%) |
| 20 to 24 Year Olds | 510 (93.9%) | 33 (6.1%) |
| 25 to 34 Year Olds | 400 (60.9%) | 257 (39.1%) |
| 35 Years and over | 645 (86.9%) | 97 (13.1%) |
| Total | 10,935 (89.7%) | 1,256 (10.3%) |
Educational Attainment by Field of Study in Lancaster
Business (1,632 | 27.6%), education (1,030 | 17.4%), science & technology (575 | 9.7%), arts & humanities (548 | 9.3%), and physical & health sciences (328 | 5.6%) are the most common fields of study among 5,913 individuals in Lancaster who have obtained a bachelor's degree or higher.
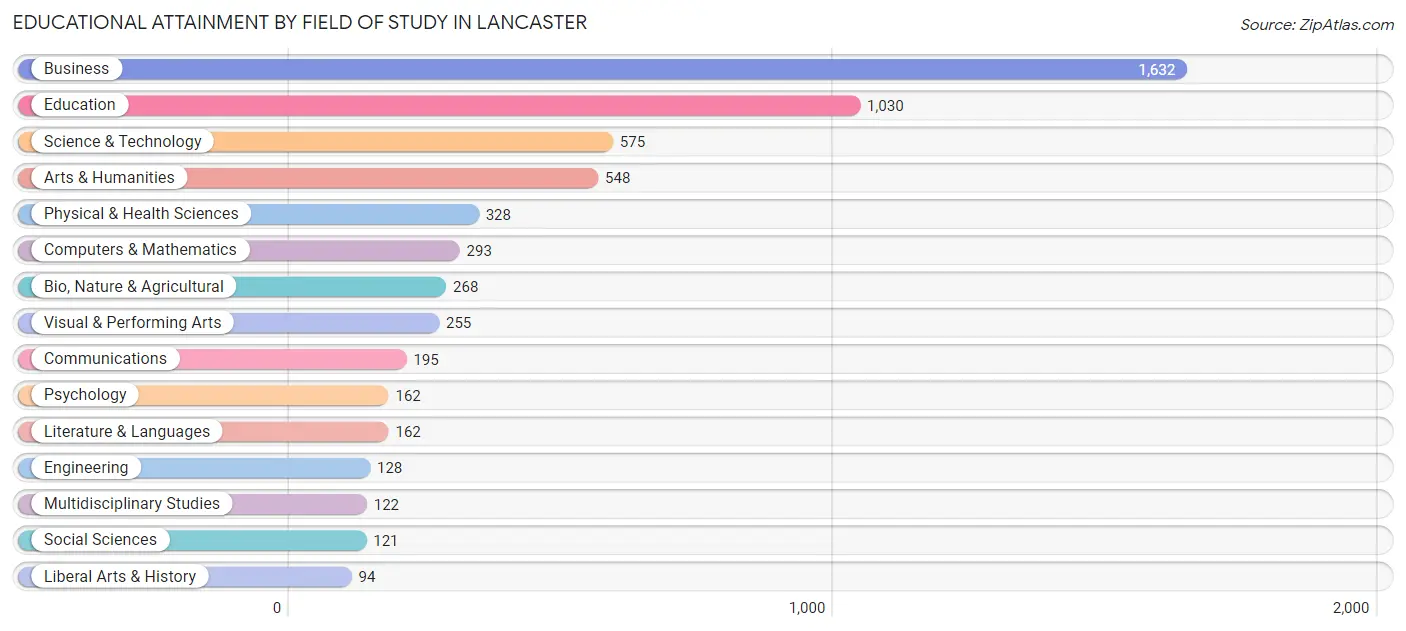
| Field of Study | # Graduates | % Graduates |
| Computers & Mathematics | 293 | 5.0% |
| Bio, Nature & Agricultural | 268 | 4.5% |
| Physical & Health Sciences | 328 | 5.6% |
| Psychology | 162 | 2.7% |
| Social Sciences | 121 | 2.1% |
| Engineering | 128 | 2.2% |
| Multidisciplinary Studies | 122 | 2.1% |
| Science & Technology | 575 | 9.7% |
| Business | 1,632 | 27.6% |
| Education | 1,030 | 17.4% |
| Literature & Languages | 162 | 2.7% |
| Liberal Arts & History | 94 | 1.6% |
| Visual & Performing Arts | 255 | 4.3% |
| Communications | 195 | 3.3% |
| Arts & Humanities | 548 | 9.3% |
| Total | 5,913 | 100.0% |
Transportation & Commute in Lancaster
Vehicle Availability by Sex in Lancaster
The most prevalent vehicle ownership categories in Lancaster are males with 2 vehicles (3,159, accounting for 38.9%) and females with 2 vehicles (3,263, making up 32.5%).
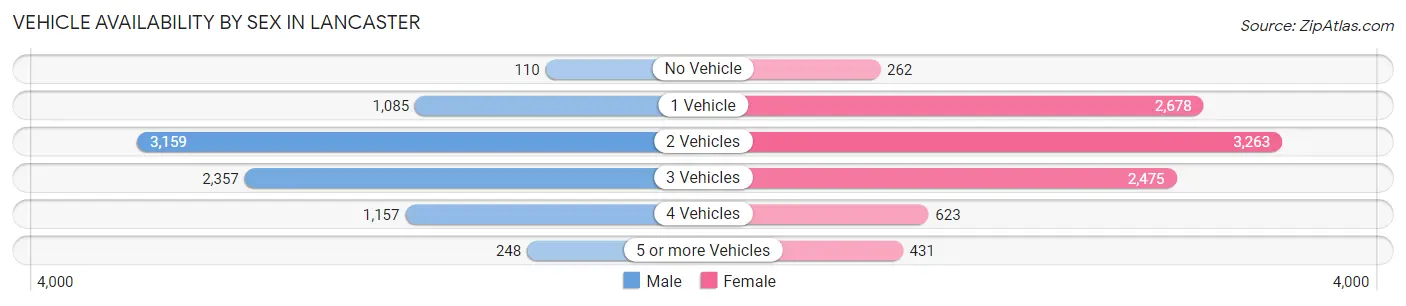
| Vehicles Available | Male | Female |
| No Vehicle | 110 (1.4%) | 262 (2.7%) |
| 1 Vehicle | 1,085 (13.4%) | 2,678 (27.5%) |
| 2 Vehicles | 3,159 (38.9%) | 3,263 (33.5%) |
| 3 Vehicles | 2,357 (29.0%) | 2,475 (25.4%) |
| 4 Vehicles | 1,157 (14.3%) | 623 (6.4%) |
| 5 or more Vehicles | 248 (3.1%) | 431 (4.4%) |
| Total | 8,116 (100.0%) | 9,732 (100.0%) |
Commute Time in Lancaster
The most frequently occuring commute durations in Lancaster are 30 to 34 minutes (3,852 commuters, 22.8%), 15 to 19 minutes (2,340 commuters, 13.9%), and 20 to 24 minutes (2,224 commuters, 13.2%).
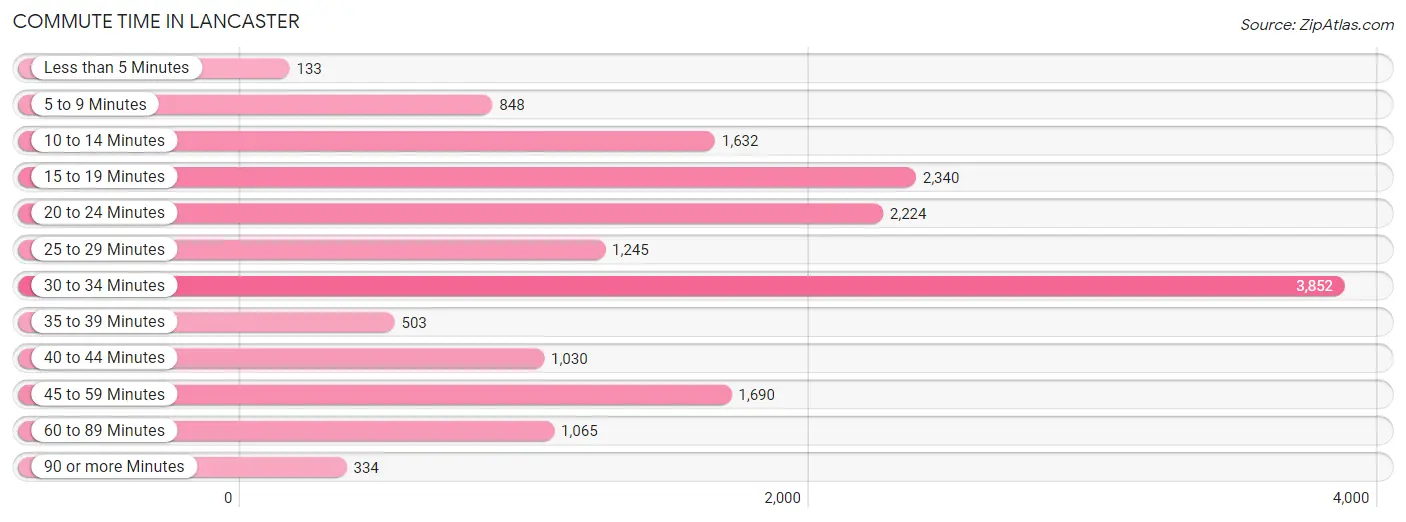
| Commute Time | # Commuters | % Commuters |
| Less than 5 Minutes | 133 | 0.8% |
| 5 to 9 Minutes | 848 | 5.0% |
| 10 to 14 Minutes | 1,632 | 9.7% |
| 15 to 19 Minutes | 2,340 | 13.9% |
| 20 to 24 Minutes | 2,224 | 13.2% |
| 25 to 29 Minutes | 1,245 | 7.4% |
| 30 to 34 Minutes | 3,852 | 22.8% |
| 35 to 39 Minutes | 503 | 3.0% |
| 40 to 44 Minutes | 1,030 | 6.1% |
| 45 to 59 Minutes | 1,690 | 10.0% |
| 60 to 89 Minutes | 1,065 | 6.3% |
| 90 or more Minutes | 334 | 2.0% |
Commute Time by Sex in Lancaster
The most common commute times in Lancaster are 30 to 34 minutes (1,578 commuters, 20.3%) for males and 30 to 34 minutes (2,274 commuters, 24.9%) for females.
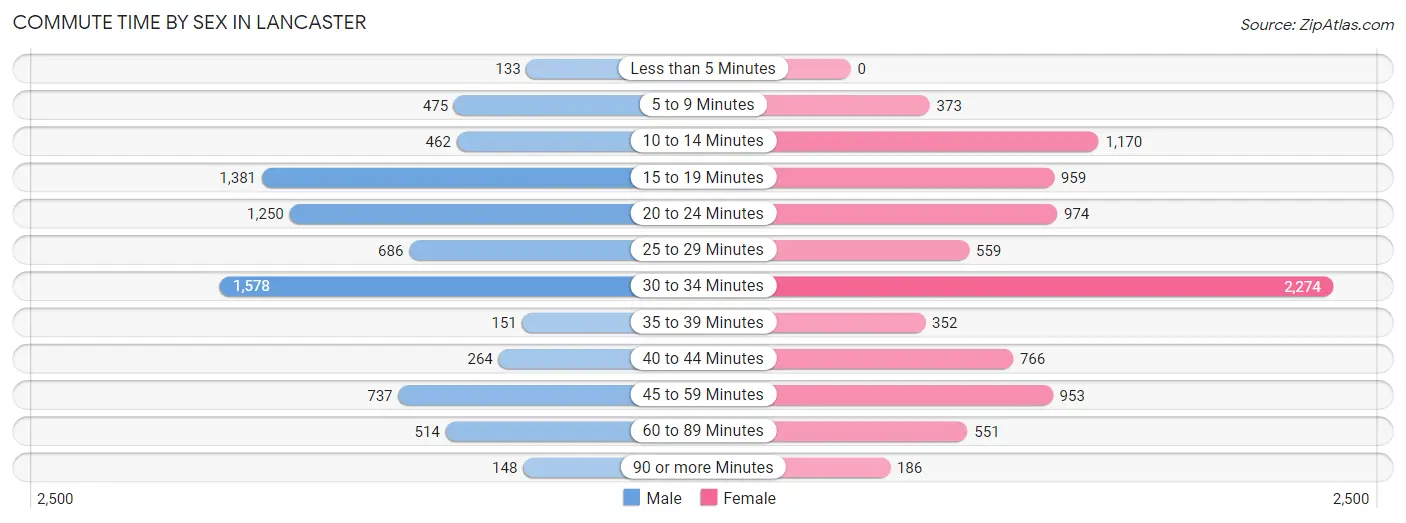
| Commute Time | Male | Female |
| Less than 5 Minutes | 133 (1.7%) | 0 (0.0%) |
| 5 to 9 Minutes | 475 (6.1%) | 373 (4.1%) |
| 10 to 14 Minutes | 462 (5.9%) | 1,170 (12.8%) |
| 15 to 19 Minutes | 1,381 (17.7%) | 959 (10.5%) |
| 20 to 24 Minutes | 1,250 (16.1%) | 974 (10.7%) |
| 25 to 29 Minutes | 686 (8.8%) | 559 (6.1%) |
| 30 to 34 Minutes | 1,578 (20.3%) | 2,274 (24.9%) |
| 35 to 39 Minutes | 151 (1.9%) | 352 (3.9%) |
| 40 to 44 Minutes | 264 (3.4%) | 766 (8.4%) |
| 45 to 59 Minutes | 737 (9.5%) | 953 (10.4%) |
| 60 to 89 Minutes | 514 (6.6%) | 551 (6.0%) |
| 90 or more Minutes | 148 (1.9%) | 186 (2.0%) |
Time of Departure to Work by Sex in Lancaster
The most frequent times of departure to work in Lancaster are 7:00 AM to 7:29 AM (1,324, 17.0%) for males and 7:00 AM to 7:29 AM (1,733, 19.0%) for females.
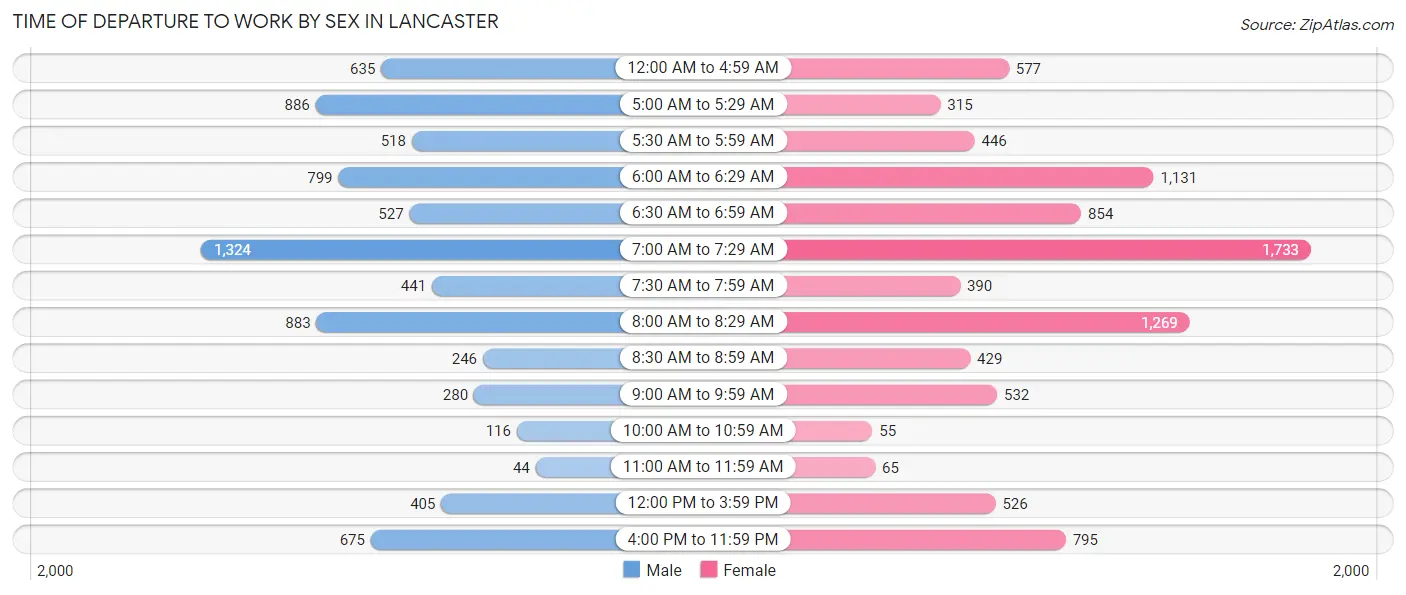
| Time of Departure | Male | Female |
| 12:00 AM to 4:59 AM | 635 (8.2%) | 577 (6.3%) |
| 5:00 AM to 5:29 AM | 886 (11.4%) | 315 (3.5%) |
| 5:30 AM to 5:59 AM | 518 (6.7%) | 446 (4.9%) |
| 6:00 AM to 6:29 AM | 799 (10.3%) | 1,131 (12.4%) |
| 6:30 AM to 6:59 AM | 527 (6.8%) | 854 (9.4%) |
| 7:00 AM to 7:29 AM | 1,324 (17.0%) | 1,733 (19.0%) |
| 7:30 AM to 7:59 AM | 441 (5.7%) | 390 (4.3%) |
| 8:00 AM to 8:29 AM | 883 (11.4%) | 1,269 (13.9%) |
| 8:30 AM to 8:59 AM | 246 (3.2%) | 429 (4.7%) |
| 9:00 AM to 9:59 AM | 280 (3.6%) | 532 (5.8%) |
| 10:00 AM to 10:59 AM | 116 (1.5%) | 55 (0.6%) |
| 11:00 AM to 11:59 AM | 44 (0.6%) | 65 (0.7%) |
| 12:00 PM to 3:59 PM | 405 (5.2%) | 526 (5.8%) |
| 4:00 PM to 11:59 PM | 675 (8.7%) | 795 (8.7%) |
| Total | 7,779 (100.0%) | 9,117 (100.0%) |
Housing Occupancy in Lancaster
Occupancy by Ownership in Lancaster
Of the total 14,052 dwellings in Lancaster, owner-occupied units account for 9,003 (64.1%), while renter-occupied units make up 5,049 (35.9%).
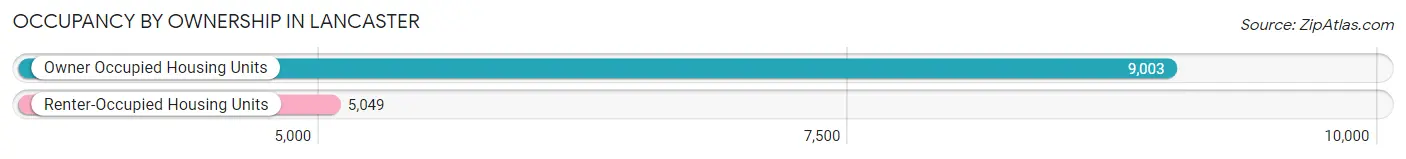
| Occupancy | # Housing Units | % Housing Units |
| Owner Occupied Housing Units | 9,003 | 64.1% |
| Renter-Occupied Housing Units | 5,049 | 35.9% |
| Total Occupied Housing Units | 14,052 | 100.0% |
Occupancy by Household Size in Lancaster
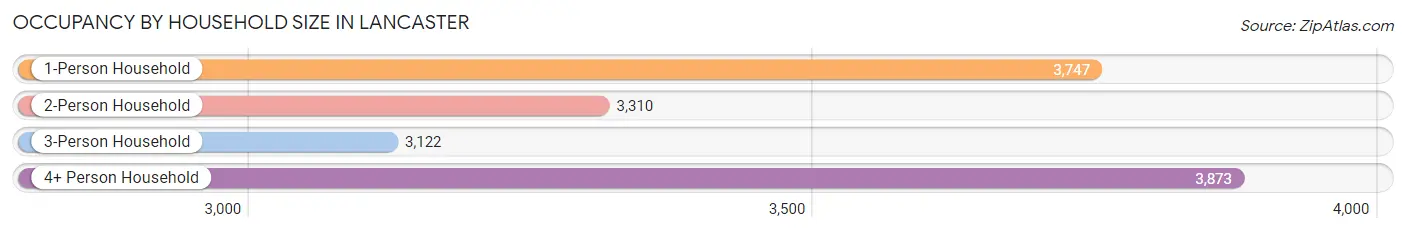
| Household Size | # Housing Units | % Housing Units |
| 1-Person Household | 3,747 | 26.7% |
| 2-Person Household | 3,310 | 23.6% |
| 3-Person Household | 3,122 | 22.2% |
| 4+ Person Household | 3,873 | 27.6% |
| Total Housing Units | 14,052 | 100.0% |
Occupancy by Ownership by Household Size in Lancaster
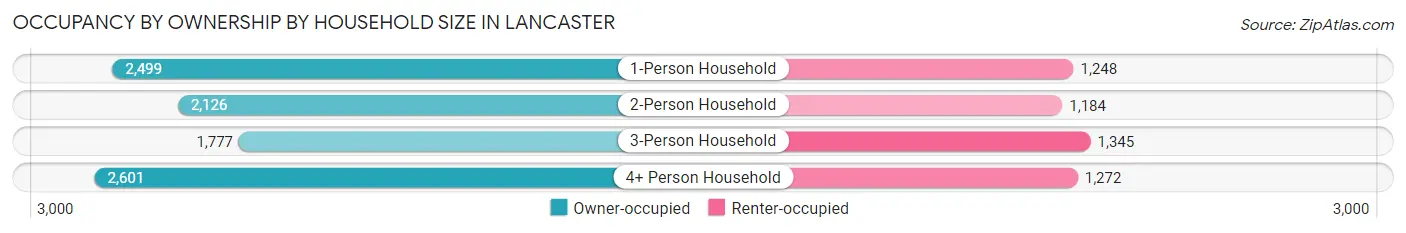
| Household Size | Owner-occupied | Renter-occupied |
| 1-Person Household | 2,499 (66.7%) | 1,248 (33.3%) |
| 2-Person Household | 2,126 (64.2%) | 1,184 (35.8%) |
| 3-Person Household | 1,777 (56.9%) | 1,345 (43.1%) |
| 4+ Person Household | 2,601 (67.2%) | 1,272 (32.8%) |
| Total Housing Units | 9,003 (64.1%) | 5,049 (35.9%) |
Occupancy by Educational Attainment in Lancaster
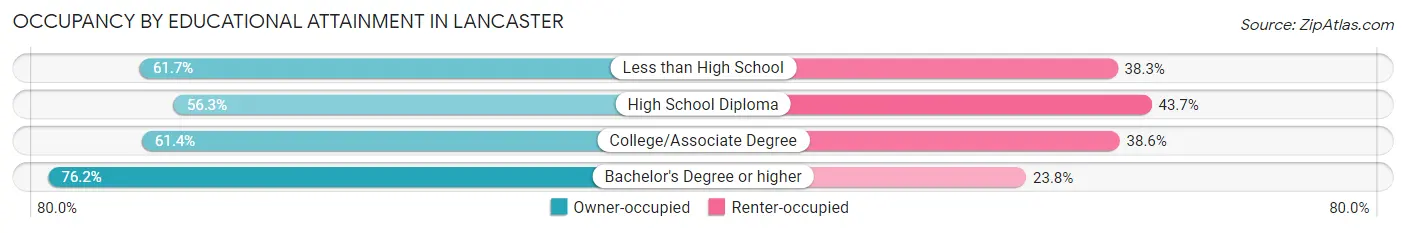
| Household Size | Owner-occupied | Renter-occupied |
| Less than High School | 675 (61.7%) | 419 (38.3%) |
| High School Diploma | 2,124 (56.3%) | 1,647 (43.7%) |
| College/Associate Degree | 3,306 (61.4%) | 2,079 (38.6%) |
| Bachelor's Degree or higher | 2,898 (76.2%) | 904 (23.8%) |
Occupancy by Age of Householder in Lancaster
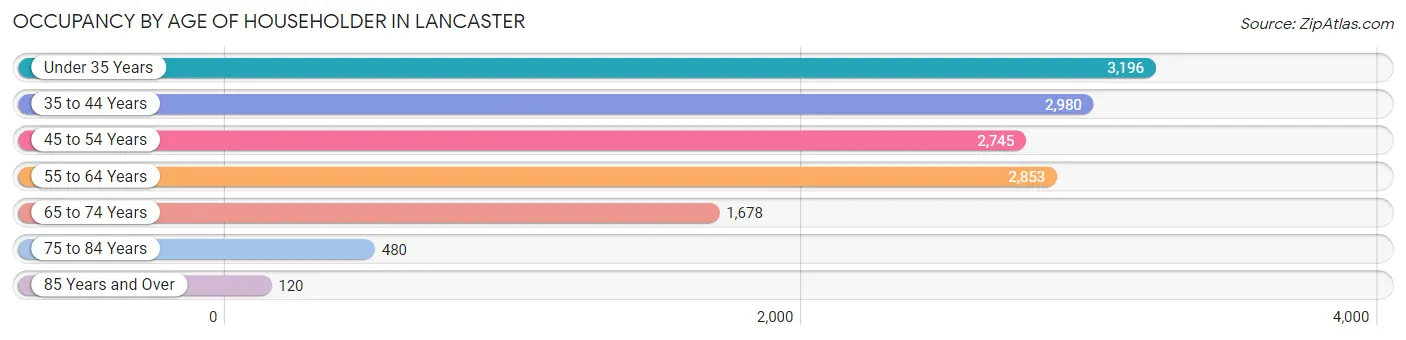
| Age Bracket | # Households | % Households |
| Under 35 Years | 3,196 | 22.7% |
| 35 to 44 Years | 2,980 | 21.2% |
| 45 to 54 Years | 2,745 | 19.5% |
| 55 to 64 Years | 2,853 | 20.3% |
| 65 to 74 Years | 1,678 | 11.9% |
| 75 to 84 Years | 480 | 3.4% |
| 85 Years and Over | 120 | 0.9% |
| Total | 14,052 | 100.0% |
Housing Finances in Lancaster
Median Income by Occupancy in Lancaster
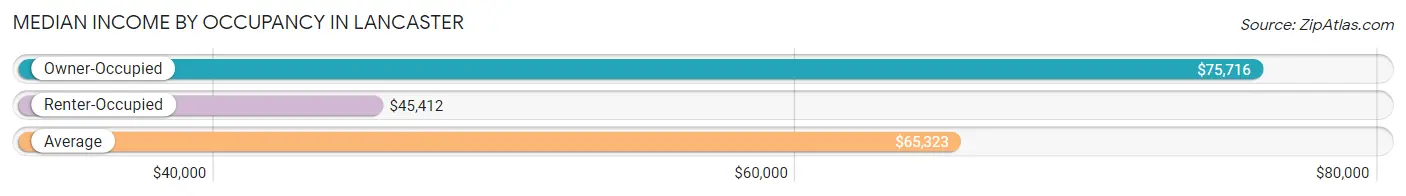
| Occupancy Type | # Households | Median Income |
| Owner-Occupied | 9,003 (64.1%) | $75,716 |
| Renter-Occupied | 5,049 (35.9%) | $45,412 |
| Average | 14,052 (100.0%) | $65,323 |
Occupancy by Householder Income Bracket in Lancaster
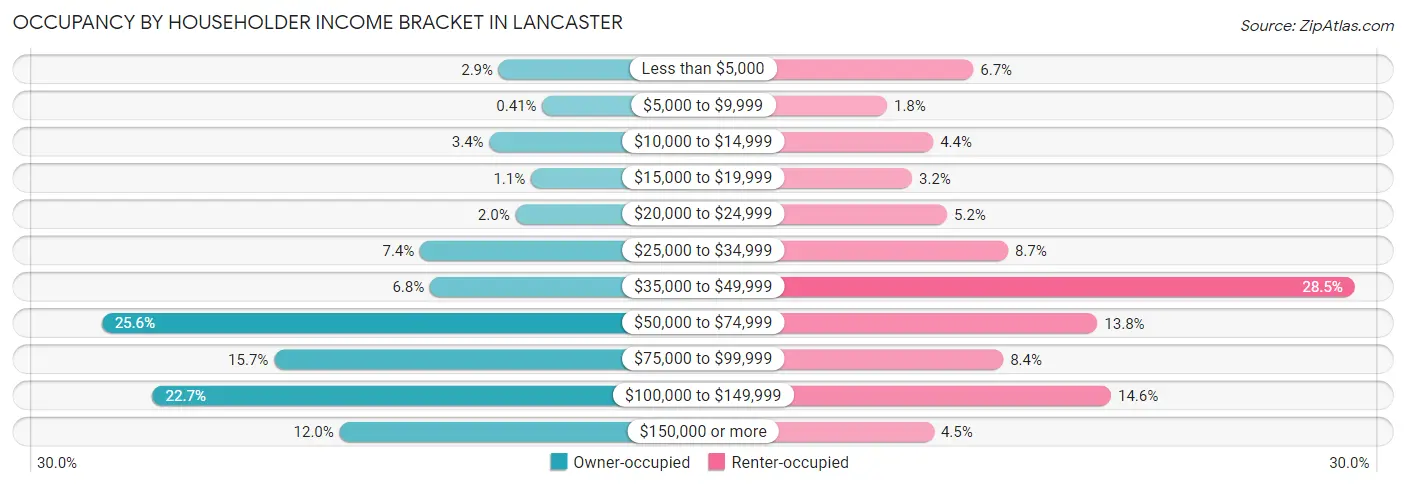
| Income Bracket | Owner-occupied | Renter-occupied |
| Less than $5,000 | 261 (2.9%) | 340 (6.7%) |
| $5,000 to $9,999 | 37 (0.4%) | 91 (1.8%) |
| $10,000 to $14,999 | 310 (3.4%) | 224 (4.4%) |
| $15,000 to $19,999 | 95 (1.1%) | 163 (3.2%) |
| $20,000 to $24,999 | 176 (1.9%) | 264 (5.2%) |
| $25,000 to $34,999 | 666 (7.4%) | 440 (8.7%) |
| $35,000 to $49,999 | 615 (6.8%) | 1,440 (28.5%) |
| $50,000 to $74,999 | 2,304 (25.6%) | 698 (13.8%) |
| $75,000 to $99,999 | 1,417 (15.7%) | 426 (8.4%) |
| $100,000 to $149,999 | 2,042 (22.7%) | 737 (14.6%) |
| $150,000 or more | 1,080 (12.0%) | 226 (4.5%) |
| Total | 9,003 (100.0%) | 5,049 (100.0%) |
Monthly Housing Cost Tiers in Lancaster
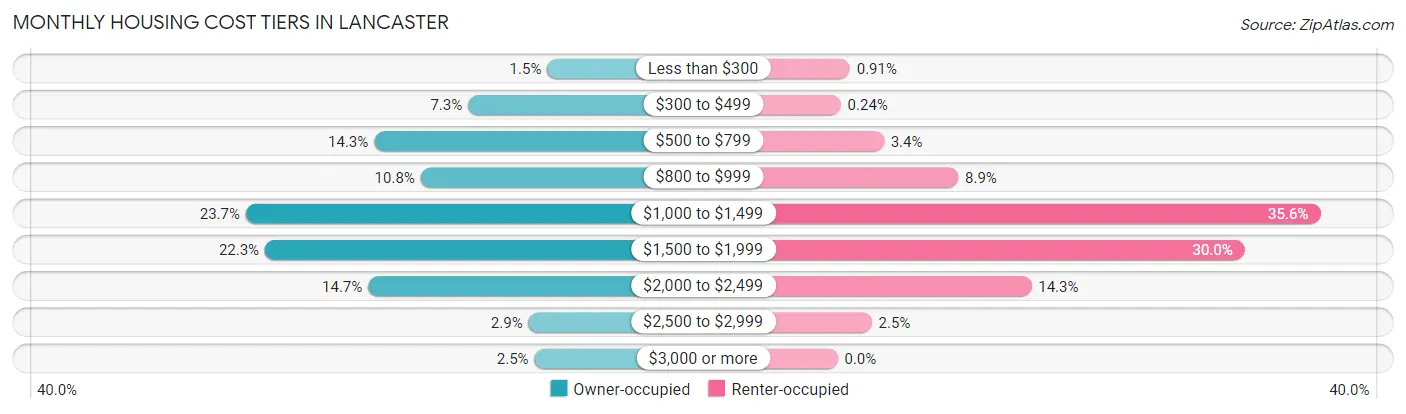
| Monthly Cost | Owner-occupied | Renter-occupied |
| Less than $300 | 136 (1.5%) | 46 (0.9%) |
| $300 to $499 | 661 (7.3%) | 12 (0.2%) |
| $500 to $799 | 1,284 (14.3%) | 172 (3.4%) |
| $800 to $999 | 975 (10.8%) | 449 (8.9%) |
| $1,000 to $1,499 | 2,135 (23.7%) | 1,795 (35.5%) |
| $1,500 to $1,999 | 2,008 (22.3%) | 1,514 (30.0%) |
| $2,000 to $2,499 | 1,323 (14.7%) | 721 (14.3%) |
| $2,500 to $2,999 | 260 (2.9%) | 127 (2.5%) |
| $3,000 or more | 221 (2.5%) | 0 (0.0%) |
| Total | 9,003 (100.0%) | 5,049 (100.0%) |
Physical Housing Characteristics in Lancaster
Housing Structures in Lancaster
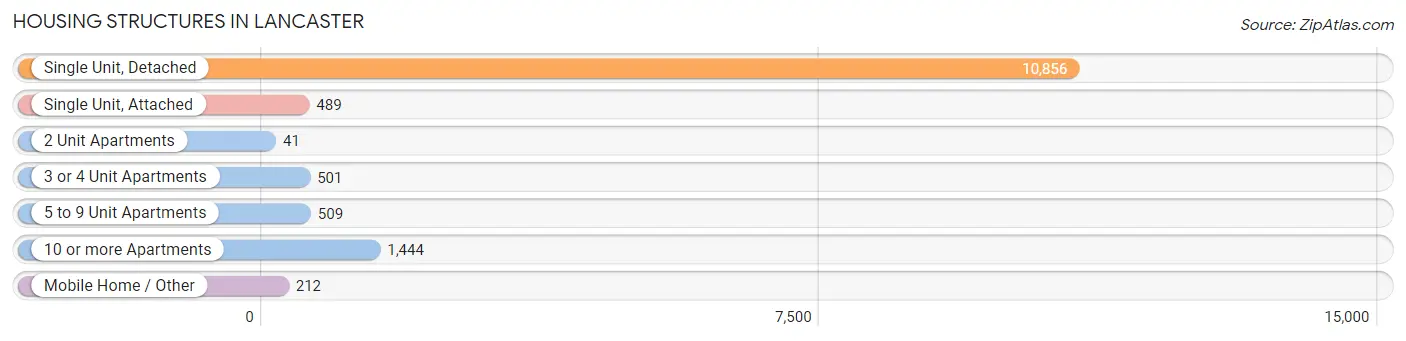
| Structure Type | # Housing Units | % Housing Units |
| Single Unit, Detached | 10,856 | 77.3% |
| Single Unit, Attached | 489 | 3.5% |
| 2 Unit Apartments | 41 | 0.3% |
| 3 or 4 Unit Apartments | 501 | 3.6% |
| 5 to 9 Unit Apartments | 509 | 3.6% |
| 10 or more Apartments | 1,444 | 10.3% |
| Mobile Home / Other | 212 | 1.5% |
| Total | 14,052 | 100.0% |
Housing Structures by Occupancy in Lancaster
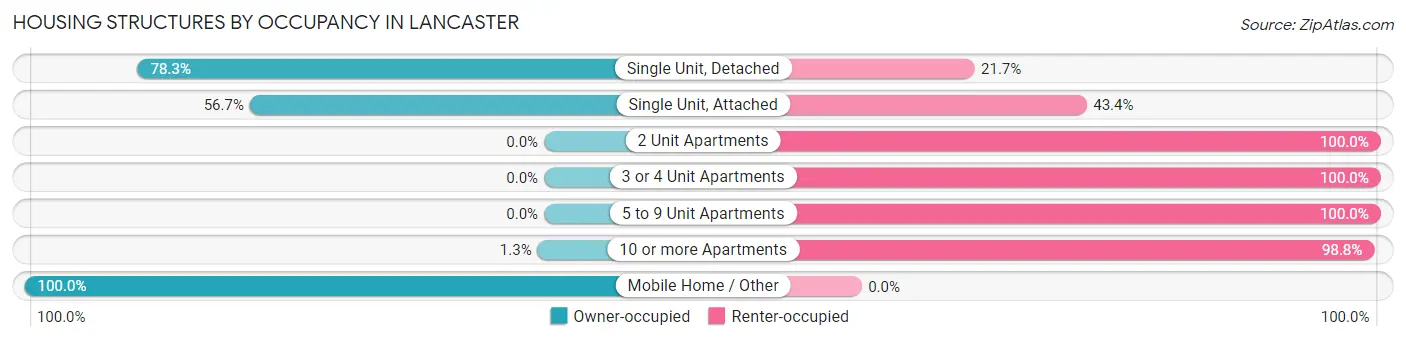
| Structure Type | Owner-occupied | Renter-occupied |
| Single Unit, Detached | 8,496 (78.3%) | 2,360 (21.7%) |
| Single Unit, Attached | 277 (56.7%) | 212 (43.3%) |
| 2 Unit Apartments | 0 (0.0%) | 41 (100.0%) |
| 3 or 4 Unit Apartments | 0 (0.0%) | 501 (100.0%) |
| 5 to 9 Unit Apartments | 0 (0.0%) | 509 (100.0%) |
| 10 or more Apartments | 18 (1.3%) | 1,426 (98.8%) |
| Mobile Home / Other | 212 (100.0%) | 0 (0.0%) |
| Total | 9,003 (64.1%) | 5,049 (35.9%) |
Housing Structures by Number of Rooms in Lancaster
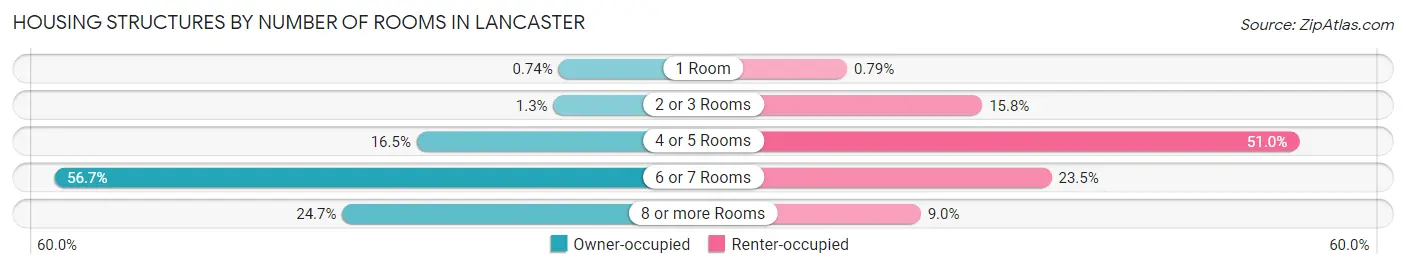
| Number of Rooms | Owner-occupied | Renter-occupied |
| 1 Room | 67 (0.7%) | 40 (0.8%) |
| 2 or 3 Rooms | 118 (1.3%) | 797 (15.8%) |
| 4 or 5 Rooms | 1,484 (16.5%) | 2,573 (51.0%) |
| 6 or 7 Rooms | 5,107 (56.7%) | 1,186 (23.5%) |
| 8 or more Rooms | 2,227 (24.7%) | 453 (9.0%) |
| Total | 9,003 (100.0%) | 5,049 (100.0%) |
Housing Structure by Heating Type in Lancaster
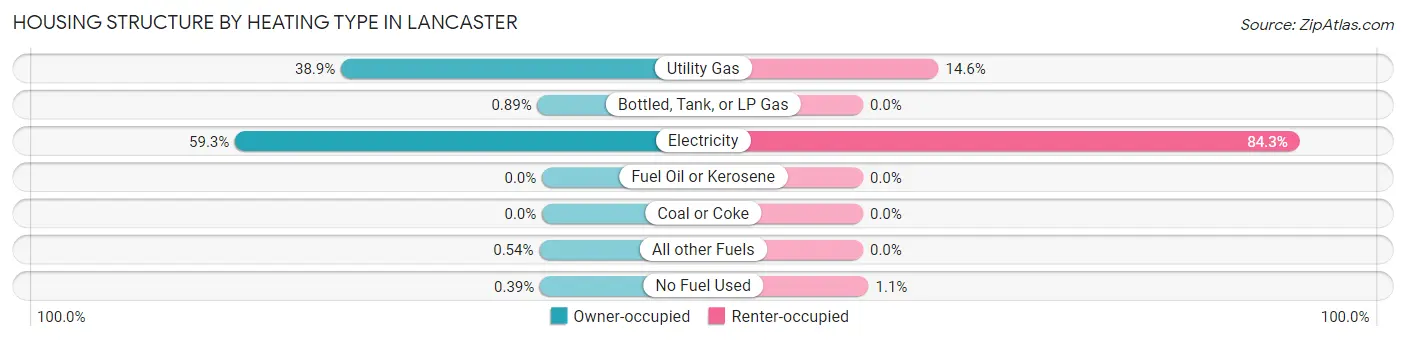
| Heating Type | Owner-occupied | Renter-occupied |
| Utility Gas | 3,498 (38.9%) | 737 (14.6%) |
| Bottled, Tank, or LP Gas | 80 (0.9%) | 0 (0.0%) |
| Electricity | 5,341 (59.3%) | 4,258 (84.3%) |
| Fuel Oil or Kerosene | 0 (0.0%) | 0 (0.0%) |
| Coal or Coke | 0 (0.0%) | 0 (0.0%) |
| All other Fuels | 49 (0.5%) | 0 (0.0%) |
| No Fuel Used | 35 (0.4%) | 54 (1.1%) |
| Total | 9,003 (100.0%) | 5,049 (100.0%) |
Household Vehicle Usage in Lancaster
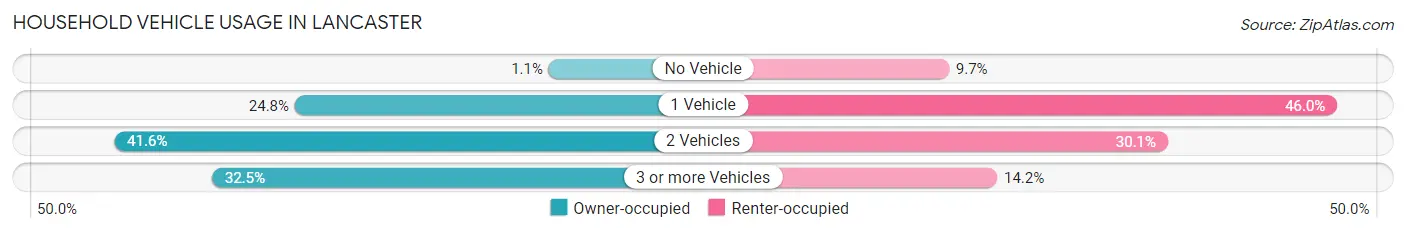
| Vehicles per Household | Owner-occupied | Renter-occupied |
| No Vehicle | 96 (1.1%) | 490 (9.7%) |
| 1 Vehicle | 2,230 (24.8%) | 2,320 (46.0%) |
| 2 Vehicles | 3,749 (41.6%) | 1,522 (30.1%) |
| 3 or more Vehicles | 2,928 (32.5%) | 717 (14.2%) |
| Total | 9,003 (100.0%) | 5,049 (100.0%) |
Real Estate & Mortgages in Lancaster
Real Estate and Mortgage Overview in Lancaster
| Characteristic | Without Mortgage | With Mortgage |
| Housing Units | 2,788 | 6,215 |
| Median Property Value | $180,000 | $206,700 |
| Median Household Income | $69,110 | $857 |
| Monthly Housing Costs | $666 | $208 |
| Real Estate Taxes | $3,201 | $144 |
Property Value by Mortgage Status in Lancaster
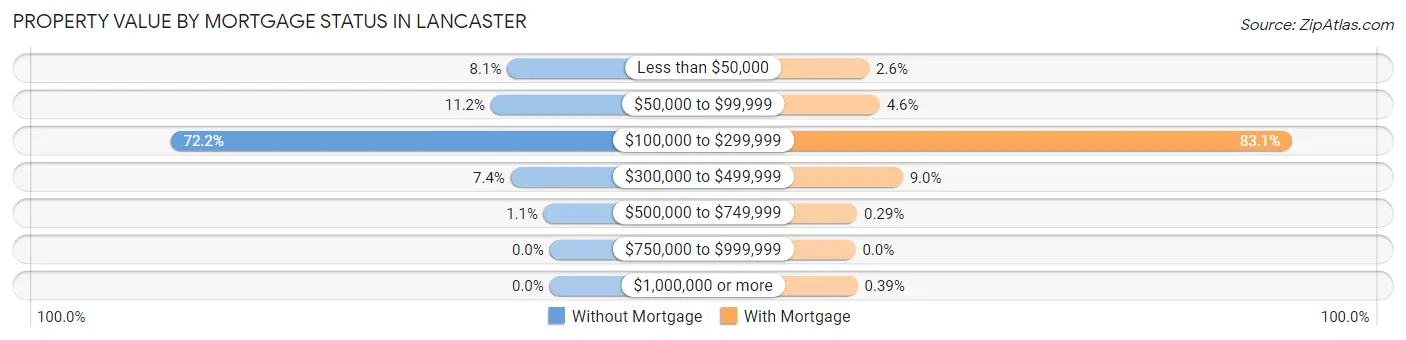
| Property Value | Without Mortgage | With Mortgage |
| Less than $50,000 | 225 (8.1%) | 161 (2.6%) |
| $50,000 to $99,999 | 312 (11.2%) | 287 (4.6%) |
| $100,000 to $299,999 | 2,013 (72.2%) | 5,167 (83.1%) |
| $300,000 to $499,999 | 207 (7.4%) | 558 (9.0%) |
| $500,000 to $749,999 | 31 (1.1%) | 18 (0.3%) |
| $750,000 to $999,999 | 0 (0.0%) | 0 (0.0%) |
| $1,000,000 or more | 0 (0.0%) | 24 (0.4%) |
| Total | 2,788 (100.0%) | 6,215 (100.0%) |
Household Income by Mortgage Status in Lancaster
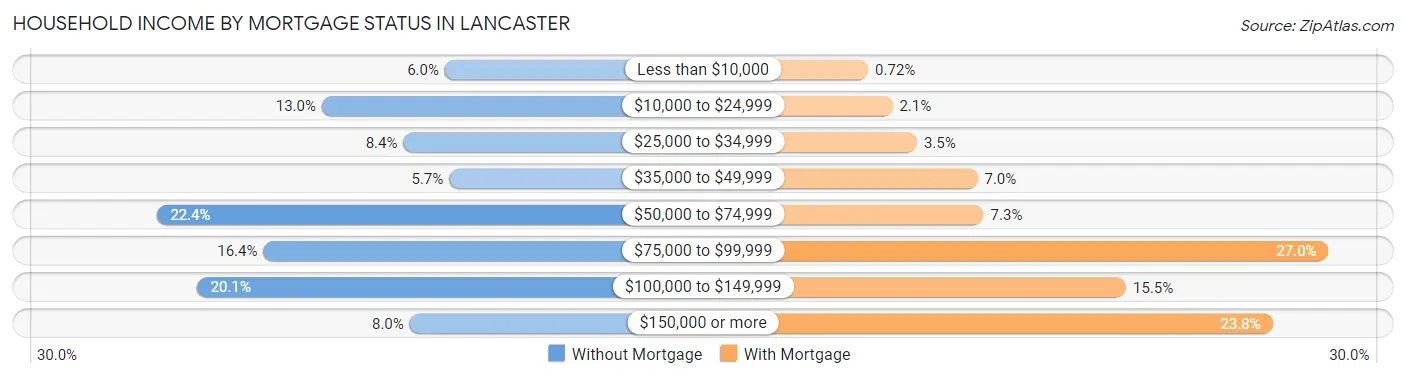
| Household Income | Without Mortgage | With Mortgage |
| Less than $10,000 | 167 (6.0%) | 45 (0.7%) |
| $10,000 to $24,999 | 363 (13.0%) | 131 (2.1%) |
| $25,000 to $34,999 | 233 (8.4%) | 218 (3.5%) |
| $35,000 to $49,999 | 160 (5.7%) | 433 (7.0%) |
| $50,000 to $74,999 | 625 (22.4%) | 455 (7.3%) |
| $75,000 to $99,999 | 456 (16.4%) | 1,679 (27.0%) |
| $100,000 to $149,999 | 561 (20.1%) | 961 (15.5%) |
| $150,000 or more | 223 (8.0%) | 1,481 (23.8%) |
| Total | 2,788 (100.0%) | 6,215 (100.0%) |
Property Value to Household Income Ratio in Lancaster
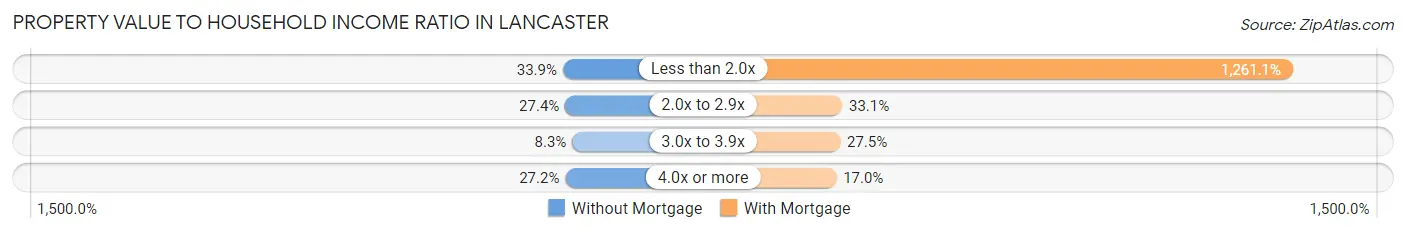
| Value-to-Income Ratio | Without Mortgage | With Mortgage |
| Less than 2.0x | 946 (33.9%) | 78,374 (1,261.1%) |
| 2.0x to 2.9x | 763 (27.4%) | 2,059 (33.1%) |
| 3.0x to 3.9x | 230 (8.3%) | 1,711 (27.5%) |
| 4.0x or more | 759 (27.2%) | 1,059 (17.0%) |
| Total | 2,788 (100.0%) | 6,215 (100.0%) |
Real Estate Taxes by Mortgage Status in Lancaster
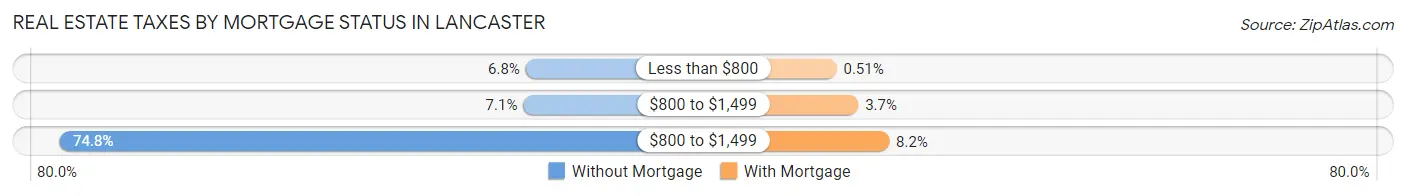
| Property Taxes | Without Mortgage | With Mortgage |
| Less than $800 | 189 (6.8%) | 32 (0.5%) |
| $800 to $1,499 | 199 (7.1%) | 229 (3.7%) |
| $800 to $1,499 | 2,086 (74.8%) | 509 (8.2%) |
| Total | 2,788 (100.0%) | 6,215 (100.0%) |
Health & Disability in Lancaster
Health Insurance Coverage by Age in Lancaster
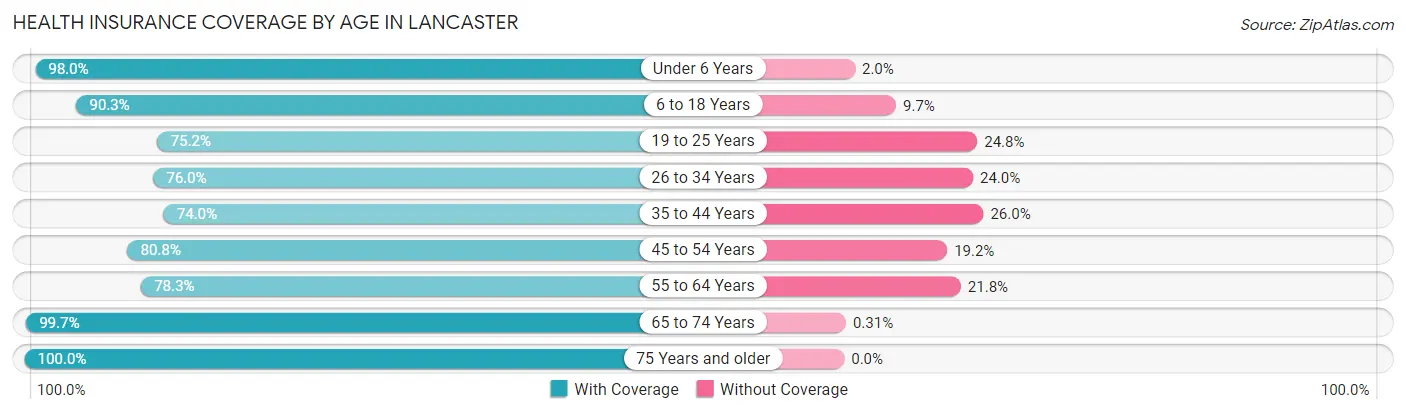
| Age Bracket | With Coverage | Without Coverage |
| Under 6 Years | 4,756 (98.0%) | 97 (2.0%) |
| 6 to 18 Years | 7,780 (90.3%) | 832 (9.7%) |
| 19 to 25 Years | 2,291 (75.2%) | 756 (24.8%) |
| 26 to 34 Years | 4,302 (76.0%) | 1,359 (24.0%) |
| 35 to 44 Years | 3,921 (74.0%) | 1,375 (26.0%) |
| 45 to 54 Years | 3,852 (80.8%) | 915 (19.2%) |
| 55 to 64 Years | 3,832 (78.2%) | 1,065 (21.7%) |
| 65 to 74 Years | 2,216 (99.7%) | 7 (0.3%) |
| 75 Years and older | 1,044 (100.0%) | 0 (0.0%) |
| Total | 33,994 (84.1%) | 6,406 (15.9%) |
Health Insurance Coverage by Citizenship Status in Lancaster
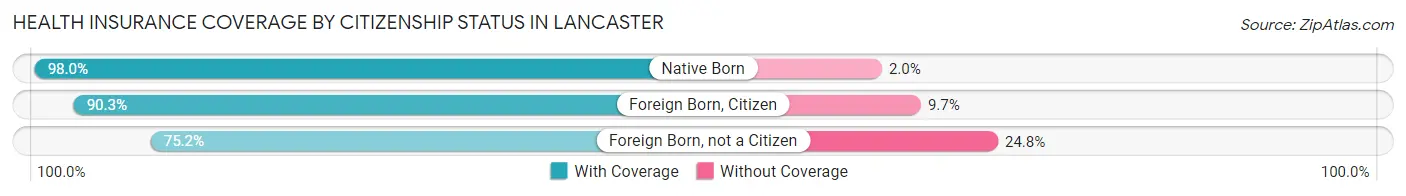
| Citizenship Status | With Coverage | Without Coverage |
| Native Born | 4,756 (98.0%) | 97 (2.0%) |
| Foreign Born, Citizen | 7,780 (90.3%) | 832 (9.7%) |
| Foreign Born, not a Citizen | 2,291 (75.2%) | 756 (24.8%) |
Health Insurance Coverage by Household Income in Lancaster
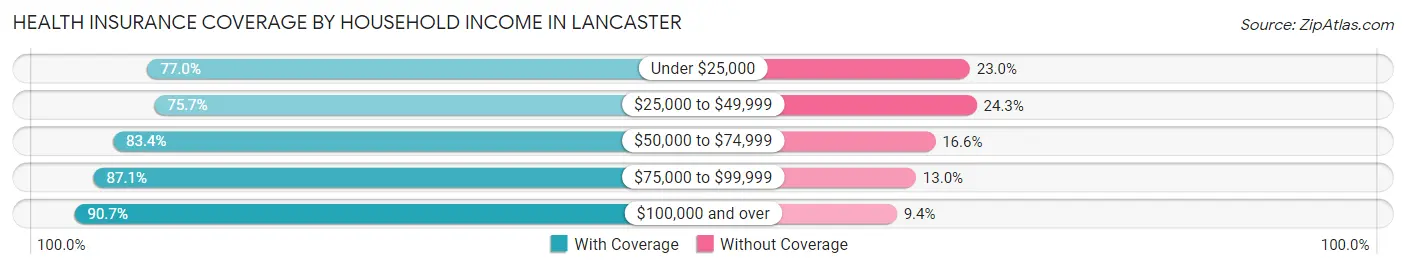
| Household Income | With Coverage | Without Coverage |
| Under $25,000 | 3,310 (77.0%) | 991 (23.0%) |
| $25,000 to $49,999 | 6,592 (75.7%) | 2,118 (24.3%) |
| $50,000 to $74,999 | 6,451 (83.4%) | 1,281 (16.6%) |
| $75,000 to $99,999 | 4,324 (87.1%) | 643 (13.0%) |
| $100,000 and over | 13,317 (90.6%) | 1,373 (9.3%) |
Public vs Private Health Insurance Coverage by Age in Lancaster
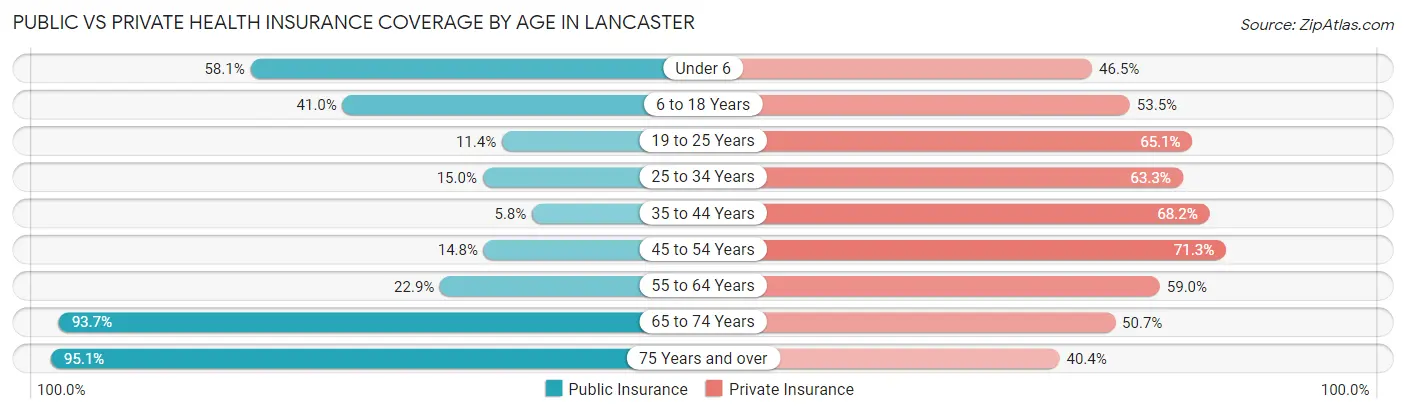
| Age Bracket | Public Insurance | Private Insurance |
| Under 6 | 2,818 (58.1%) | 2,255 (46.5%) |
| 6 to 18 Years | 3,528 (41.0%) | 4,606 (53.5%) |
| 19 to 25 Years | 347 (11.4%) | 1,983 (65.1%) |
| 25 to 34 Years | 847 (15.0%) | 3,581 (63.3%) |
| 35 to 44 Years | 307 (5.8%) | 3,614 (68.2%) |
| 45 to 54 Years | 704 (14.8%) | 3,400 (71.3%) |
| 55 to 64 Years | 1,120 (22.9%) | 2,891 (59.0%) |
| 65 to 74 Years | 2,082 (93.7%) | 1,128 (50.7%) |
| 75 Years and over | 993 (95.1%) | 422 (40.4%) |
| Total | 12,746 (31.6%) | 23,880 (59.1%) |
Disability Status by Sex by Age in Lancaster
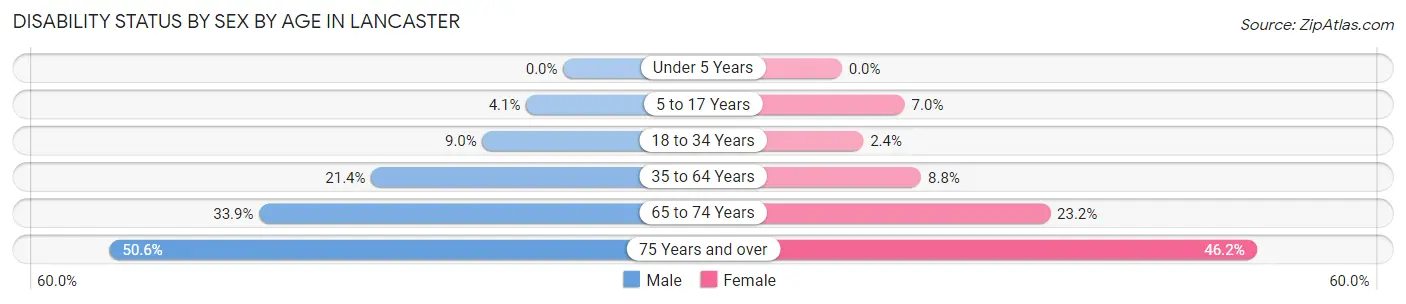
| Age Bracket | Male | Female |
| Under 5 Years | 0 (0.0%) | 0 (0.0%) |
| 5 to 17 Years | 173 (4.1%) | 317 (7.0%) |
| 18 to 34 Years | 359 (9.0%) | 129 (2.4%) |
| 35 to 64 Years | 1,447 (21.4%) | 723 (8.8%) |
| 65 to 74 Years | 236 (33.9%) | 354 (23.2%) |
| 75 Years and over | 184 (50.5%) | 314 (46.2%) |
Disability Class by Sex by Age in Lancaster
Disability Class: Hearing Difficulty
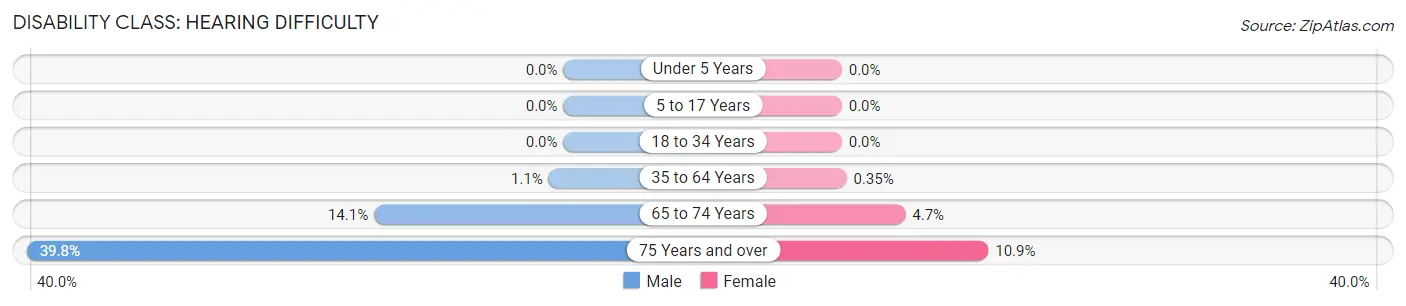
| Age Bracket | Male | Female |
| Under 5 Years | 0 (0.0%) | 0 (0.0%) |
| 5 to 17 Years | 0 (0.0%) | 0 (0.0%) |
| 18 to 34 Years | 0 (0.0%) | 0 (0.0%) |
| 35 to 64 Years | 74 (1.1%) | 29 (0.4%) |
| 65 to 74 Years | 98 (14.1%) | 72 (4.7%) |
| 75 Years and over | 145 (39.8%) | 74 (10.9%) |
Disability Class: Vision Difficulty
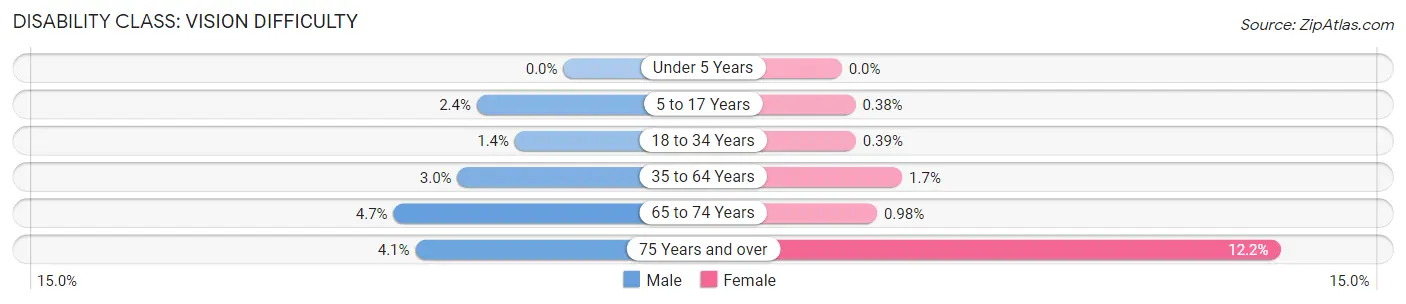
| Age Bracket | Male | Female |
| Under 5 Years | 0 (0.0%) | 0 (0.0%) |
| 5 to 17 Years | 101 (2.4%) | 17 (0.4%) |
| 18 to 34 Years | 54 (1.3%) | 21 (0.4%) |
| 35 to 64 Years | 200 (2.9%) | 138 (1.7%) |
| 65 to 74 Years | 33 (4.7%) | 15 (1.0%) |
| 75 Years and over | 15 (4.1%) | 83 (12.2%) |
Disability Class: Cognitive Difficulty
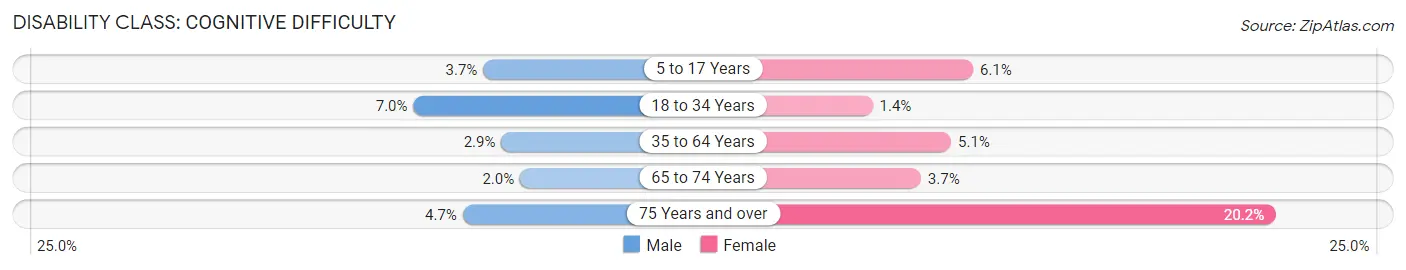
| Age Bracket | Male | Female |
| 5 to 17 Years | 156 (3.7%) | 276 (6.1%) |
| 18 to 34 Years | 278 (7.0%) | 77 (1.4%) |
| 35 to 64 Years | 195 (2.9%) | 415 (5.1%) |
| 65 to 74 Years | 14 (2.0%) | 56 (3.7%) |
| 75 Years and over | 17 (4.7%) | 137 (20.2%) |
Disability Class: Ambulatory Difficulty
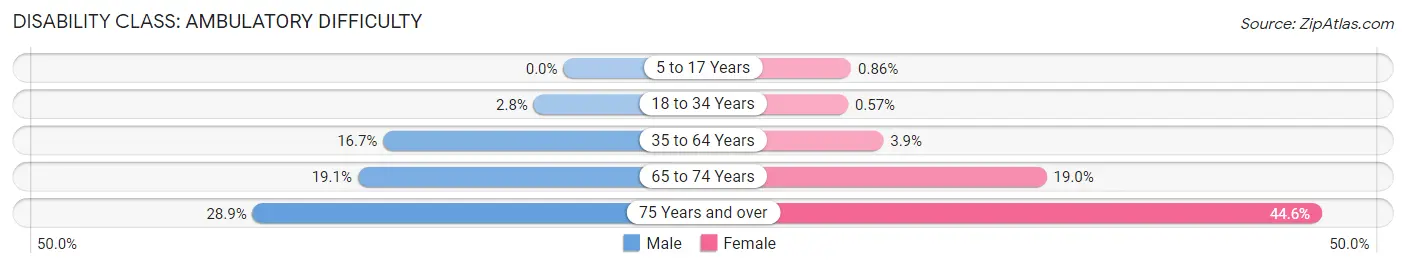
| Age Bracket | Male | Female |
| 5 to 17 Years | 0 (0.0%) | 39 (0.9%) |
| 18 to 34 Years | 110 (2.8%) | 31 (0.6%) |
| 35 to 64 Years | 1,132 (16.7%) | 315 (3.8%) |
| 65 to 74 Years | 133 (19.1%) | 290 (19.0%) |
| 75 Years and over | 105 (28.8%) | 303 (44.6%) |
Disability Class: Self-Care Difficulty
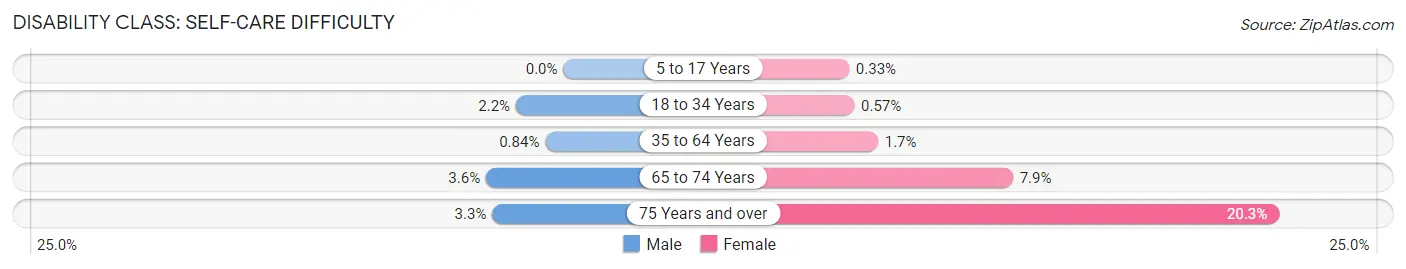
| Age Bracket | Male | Female |
| 5 to 17 Years | 0 (0.0%) | 15 (0.3%) |
| 18 to 34 Years | 88 (2.2%) | 31 (0.6%) |
| 35 to 64 Years | 57 (0.8%) | 137 (1.7%) |
| 65 to 74 Years | 25 (3.6%) | 121 (7.9%) |
| 75 Years and over | 12 (3.3%) | 138 (20.3%) |
Technology Access in Lancaster
Computing Device Access in Lancaster
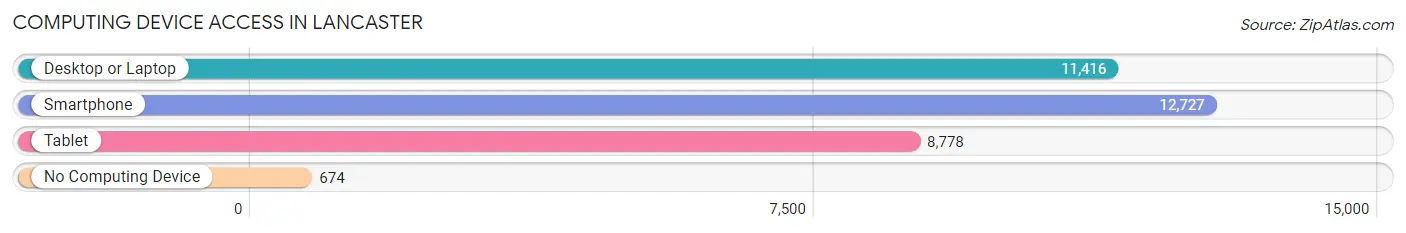
| Device Type | # Households | % Households |
| Desktop or Laptop | 11,416 | 81.2% |
| Smartphone | 12,727 | 90.6% |
| Tablet | 8,778 | 62.5% |
| No Computing Device | 674 | 4.8% |
| Total | 14,052 | 100.0% |
Internet Access in Lancaster
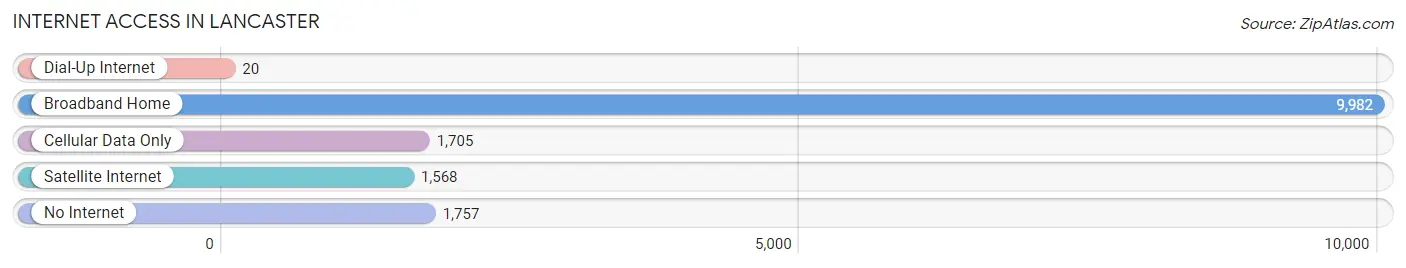
| Internet Type | # Households | % Households |
| Dial-Up Internet | 20 | 0.1% |
| Broadband Home | 9,982 | 71.0% |
| Cellular Data Only | 1,705 | 12.1% |
| Satellite Internet | 1,568 | 11.2% |
| No Internet | 1,757 | 12.5% |
| Total | 14,052 | 100.0% |
Lancaster Summary
Lancaster, Texas is a city located in Dallas County, Texas, United States. The city is part of the Dallas–Fort Worth–Arlington metropolitan area and is located approximately 20 miles south of downtown Dallas. As of the 2010 census, the population of Lancaster was 36,361, making it the second-largest city in Dallas County.
History
The area that is now Lancaster was first settled in the 1840s by a group of settlers from Kentucky. The settlement was originally known as "Cedar Hill" and was located near the present-day intersection of Main Street and Dallas Avenue. In 1852, the settlement was renamed "Lancaster" after the city of Lancaster, Pennsylvania.
The city of Lancaster was officially incorporated in 1873. During the late 19th century, the city experienced rapid growth due to the arrival of the railroad. The city was also home to a number of cotton gins and other businesses.
In the early 20th century, Lancaster was a center for the oil and gas industry. The city was also home to a number of manufacturing plants, including a cotton mill and a brick factory.
Geography
Lancaster is located in Dallas County, Texas, at the intersection of Interstate 20 and U.S. Highway 67. The city is situated approximately 20 miles south of downtown Dallas.
The city has a total area of 16.2 square miles, of which 16.1 square miles is land and 0.1 square miles is water. The city is located in the Blackland Prairie region of Texas, which is characterized by flat terrain and fertile soil.
Economy
Lancaster is a major economic center in the Dallas–Fort Worth–Arlington metropolitan area. The city is home to a number of major employers, including Lancaster ISD, Lancaster Regional Medical Center, and the Lancaster Independent School District.
The city is also home to a number of retail and commercial businesses, including a Walmart Supercenter, a Lowe's Home Improvement store, and a number of restaurants and other retail establishments.
Demographics
As of the 2010 census, the population of Lancaster was 36,361. The racial makeup of the city was 57.2% White, 28.2% African American, 0.7% Native American, 1.3% Asian, 0.1% Pacific Islander, 9.7% from other races, and 2.8% from two or more races. Hispanic or Latino of any race were 24.2% of the population.
The median income for a household in the city was $41,945, and the median income for a family was $50,945. The per capita income for the city was $20,945. About 17.2% of families and 21.3% of the population were below the poverty line, including 28.3% of those under age 18 and 11.3% of those age 65 or over.
Common Questions
What is Per Capita Income in Lancaster?
Per Capita income in Lancaster is $28,707.
What is the Median Family Income in Lancaster?
Median Family Income in Lancaster is $73,527.
What is the Median Household income in Lancaster?
Median Household Income in Lancaster is $65,323.
What is Income or Wage Gap in Lancaster?
Income or Wage Gap in Lancaster is 2.3%.
Women in Lancaster earn 97.7 cents for every dollar earned by a man.
What is Family Income Deficit in Lancaster?
Family Income Deficit in Lancaster is $13,475.
Families that are below poverty line in Lancaster earn $13,475 less on average than the poverty threshold level.
What is Inequality or Gini Index in Lancaster?
Inequality or Gini Index in Lancaster is 0.41.
What is the Total Population of Lancaster?
Total Population of Lancaster is 40,958.
What is the Total Male Population of Lancaster?
Total Male Population of Lancaster is 18,318.
What is the Total Female Population of Lancaster?
Total Female Population of Lancaster is 22,640.
What is the Ratio of Males per 100 Females in Lancaster?
There are 80.91 Males per 100 Females in Lancaster.
What is the Ratio of Females per 100 Males in Lancaster?
There are 123.59 Females per 100 Males in Lancaster.
What is the Median Population Age in Lancaster?
Median Population Age in Lancaster is 31.7 Years.
What is the Average Family Size in Lancaster
Average Family Size in Lancaster is 3.5 People.
What is the Average Household Size in Lancaster
Average Household Size in Lancaster is 2.9 People.
How Large is the Labor Force in Lancaster?
There are 20,300 People in the Labor Forcein in Lancaster.
What is the Percentage of People in the Labor Force in Lancaster?
69.1% of People are in the Labor Force in Lancaster.
What is the Unemployment Rate in Lancaster?
Unemployment Rate in Lancaster is 6.9%.