Zip Codes with the Highest Percentage of Population with a Degree in Social Sciences in Crossville, TN
RELATED REPORTS & OPTIONS
Social Sciences
Crossville
Compare Zip Codes
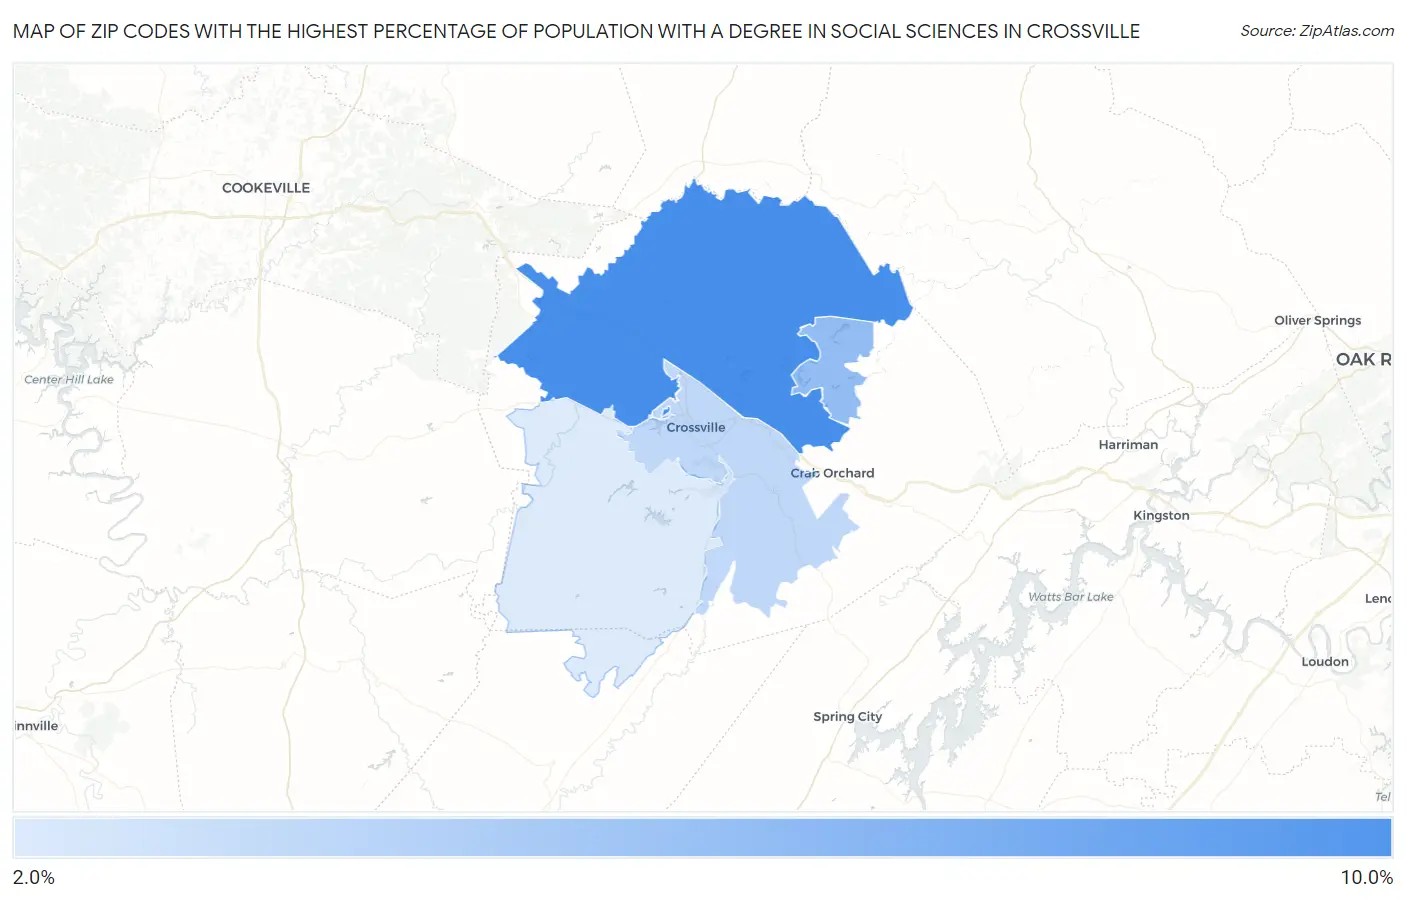
Map of Zip Codes with the Highest Percentage of Population with a Degree in Social Sciences in Crossville
2.3%
8.9%
Zip Codes with the Highest Percentage of Population with a Degree in Social Sciences in Crossville, TN
| Zip Code | % Graduates | vs State | vs National | |
| 1. | 38571 | 8.9% | 5.8%(+3.09)#91 | 8.1%(+0.824)#7,124 |
| 2. | 38558 | 5.6% | 5.8%(-0.255)#219 | 8.1%(-2.52)#14,456 |
| 3. | 38555 | 3.6% | 5.8%(-2.16)#346 | 8.1%(-4.42)#19,024 |
| 4. | 38572 | 2.3% | 5.8%(-3.47)#413 | 8.1%(-5.73)#21,588 |
1
Common Questions
What are the Top 3 Zip Codes with the Highest Percentage of Population with a Degree in Social Sciences in Crossville, TN?
Top 3 Zip Codes with the Highest Percentage of Population with a Degree in Social Sciences in Crossville, TN are:
What zip code has the Highest Percentage of Population with a Degree in Social Sciences in Crossville, TN?
38571 has the Highest Percentage of Population with a Degree in Social Sciences in Crossville, TN with 8.9%.
What is the Percentage of Population with a Degree in Social Sciences in Crossville, TN?
Percentage of Population with a Degree in Social Sciences in Crossville is 10.0%.
What is the Percentage of Population with a Degree in Social Sciences in Tennessee?
Percentage of Population with a Degree in Social Sciences in Tennessee is 5.8%.
What is the Percentage of Population with a Degree in Social Sciences in the United States?
Percentage of Population with a Degree in Social Sciences in the United States is 8.1%.