Zip Codes with the Highest Percentage of Population with a Degree in Physical and Health Sciences in Crossville, TN
RELATED REPORTS & OPTIONS
Physical and Health Sciences
Crossville
Compare Zip Codes
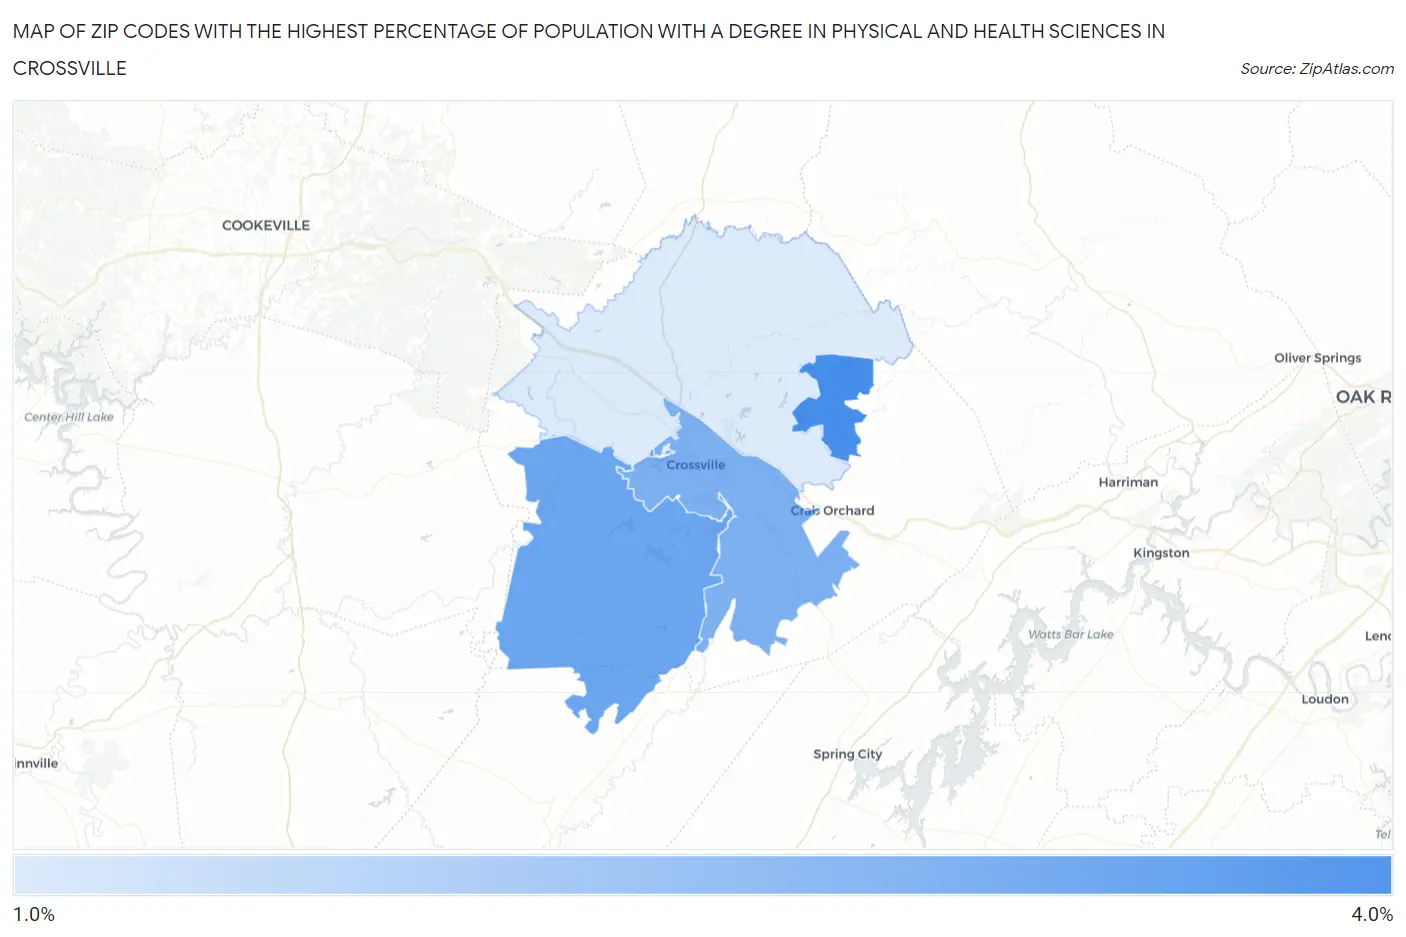
Map of Zip Codes with the Highest Percentage of Population with a Degree in Physical and Health Sciences in Crossville
1.5%
4.0%
Zip Codes with the Highest Percentage of Population with a Degree in Physical and Health Sciences in Crossville, TN
| Zip Code | % Graduates | vs State | vs National | |
| 1. | 38558 | 4.0% | 3.1%(+0.807)#139 | 3.1%(+0.857)#6,881 |
| 2. | 38572 | 3.3% | 3.1%(+0.186)#174 | 3.1%(+0.236)#9,052 |
| 3. | 38555 | 3.1% | 3.1%(-0.092)#198 | 3.1%(-0.042)#10,169 |
| 4. | 38571 | 1.5% | 3.1%(-1.68)#337 | 3.1%(-1.63)#17,411 |
1
Common Questions
What are the Top 3 Zip Codes with the Highest Percentage of Population with a Degree in Physical and Health Sciences in Crossville, TN?
Top 3 Zip Codes with the Highest Percentage of Population with a Degree in Physical and Health Sciences in Crossville, TN are:
What zip code has the Highest Percentage of Population with a Degree in Physical and Health Sciences in Crossville, TN?
38558 has the Highest Percentage of Population with a Degree in Physical and Health Sciences in Crossville, TN with 4.0%.
What is the Percentage of Population with a Degree in Physical and Health Sciences in Crossville, TN?
Percentage of Population with a Degree in Physical and Health Sciences in Crossville is 2.5%.
What is the Percentage of Population with a Degree in Physical and Health Sciences in Tennessee?
Percentage of Population with a Degree in Physical and Health Sciences in Tennessee is 3.1%.
What is the Percentage of Population with a Degree in Physical and Health Sciences in the United States?
Percentage of Population with a Degree in Physical and Health Sciences in the United States is 3.1%.