Zip Codes with the Highest Percentage of Families with Income Above $100,000 in Roswell, NM
RELATED REPORTS & OPTIONS
Family Income | $100k+
Roswell
Compare Zip Codes
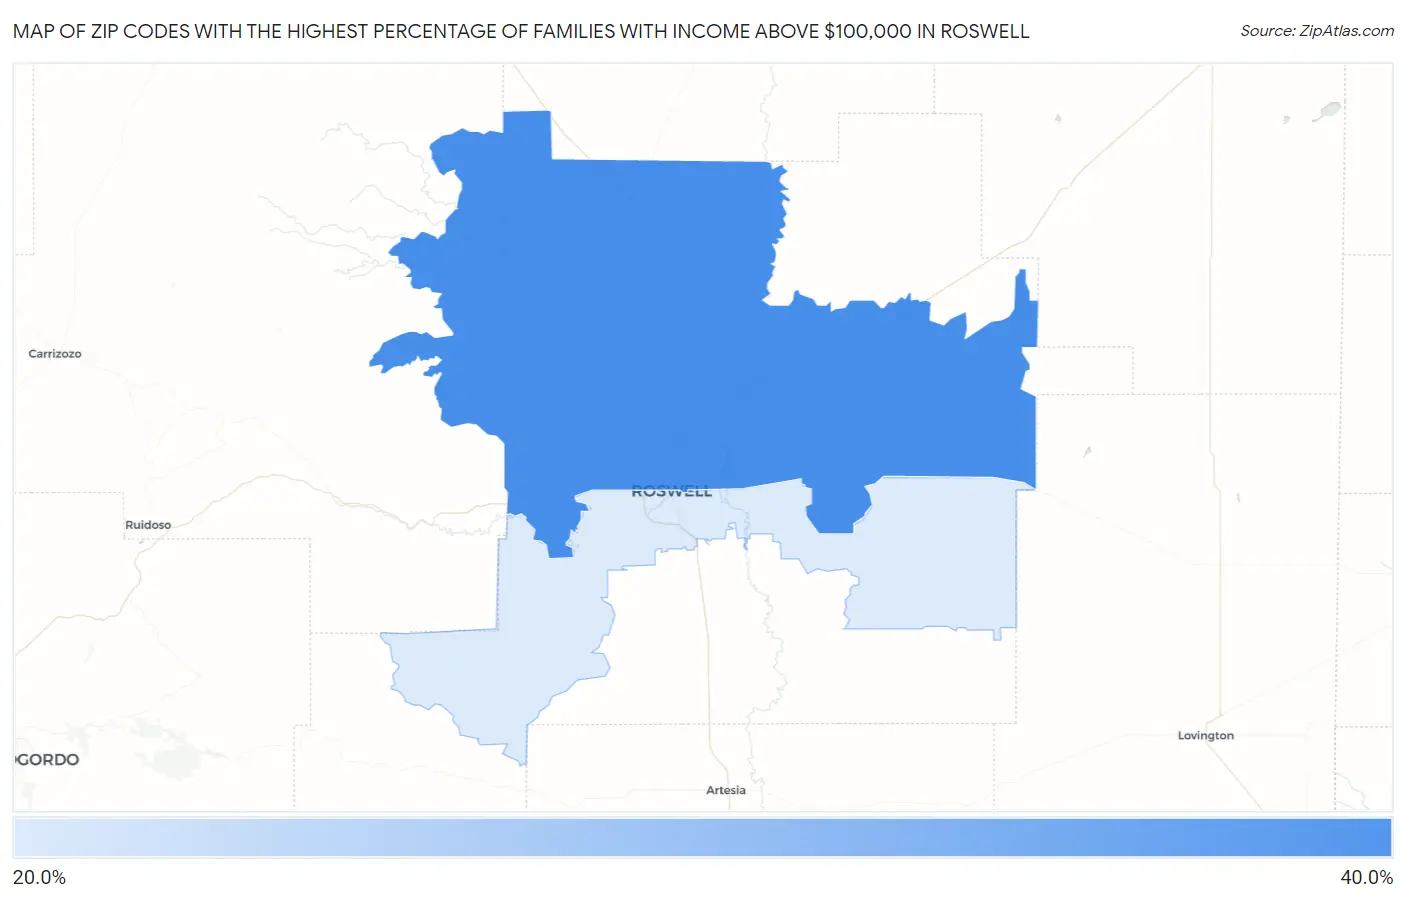
Map of Zip Codes with the Highest Percentage of Families with Income Above $100,000 in Roswell
22.4%
37.4%
Zip Codes with the Highest Percentage of Families with Income Above $100,000 in Roswell, NM
| Zip Code | Families with Income > $100k | vs State | vs National | |
| 1. | 88201 | 37.4% | 34.7%(+2.70)#96 | 46.1%(-8.70)#16,192 |
| 2. | 88203 | 22.4% | 34.7%(-12.3)#186 | 46.1%(-23.7)#26,091 |
1
Common Questions
What are the Top Zip Codes with the Highest Percentage of Families with Income Above $100,000 in Roswell, NM?
Top Zip Codes with the Highest Percentage of Families with Income Above $100,000 in Roswell, NM are:
What zip code has the Highest Percentage of Families with Income Above $100,000 in Roswell, NM?
88201 has the Highest Percentage of Families with Income Above $100,000 in Roswell, NM with 37.4%.
What is the Percentage of Families with Income Above $100,000 in Roswell, NM?
Percentage of Families with Income Above $100,000 in Roswell is 27.5%.
What is the Percentage of Families with Income Above $100,000 in New Mexico?
Percentage of Families with Income Above $100,000 in New Mexico is 34.7%.
What is the Percentage of Families with Income Above $100,000 in the United States?
Percentage of Families with Income Above $100,000 in the United States is 46.1%.