Zip Codes with the Highest Percentage of Families with Income Above $100,000 in Albuquerque, NM

RELATED REPORTS & OPTIONS

Family Income | $100k+
Population
Families and Households
Female Fertility
Female Fertility (Unmarried)
Race (Community Size)
Race (Percentage)
Ancestry (Community Size)
AfghanAfricanAlaskan AthabascanAmericanApacheArabArgentineanArmenianAustralianAustrianBasqueBelgianBhutaneseBlackfeetBolivianBrazilianBritishBulgarianBurmeseCajunCambodianCanadianCelticCentral AmericanCentral American IndianCherokeeCheyenneChickasawChileanChippewaChoctawColombianComancheCosta RicanCreeCreekCroatianCubanCzechCzechoslovakianDanishDominicanDutchEastern EuropeanEcuadorianEgyptianEnglishEstonianEthiopianEuropeanFilipinoFinnishFrenchFrench CanadianGermanGhanaianGreekGuamanian / ChamorroGuatemalanGuyaneseHaitianHonduranHopiHungarianIcelanderIndian (Asian)InupiatIranianIraqiIrishIroquoisIsraeliItalianJamaicanJapaneseJordanianKenyanKiowaKoreanLaotianLatvianLebaneseLiberianLithuanianLumbeeLuxembourgerMalaysianMalteseMexicanMexican American IndianMoroccanNative HawaiianNavajoNew ZealanderNicaraguanNigerianNorthern EuropeanNorwegianOsagePaiutePakistaniPalestinianPanamanianPennsylvania GermanPeruvianPimaPolishPortuguesePotawatomiPuebloPuerto RicanRomanianRussianSalvadoranSamoanScandinavianScotch-IrishScottishSeminoleSerbianShoshoneSiouxSlavicSlovakSloveneSouth AfricanSouth AmericanSouth American IndianSpaniardSpanishSpanish AmericanSpanish American IndianSri LankanSubsaharan AfricanSwedishSwissSyrianThaiTlingit-HaidaTohono O'OdhamTrinidadian and TobagonianTurkishUgandanUkrainianUteVenezuelanVietnameseWelshWest IndianYaquiYugoslavianYuman
Ancestry (Percentage)
AfghanAfricanAlaskan AthabascanAmericanApacheArabArgentineanArmenianAustralianAustrianBasqueBelgianBhutaneseBlackfeetBolivianBrazilianBritishBulgarianBurmeseCajunCambodianCanadianCelticCentral AmericanCentral American IndianCherokeeCheyenneChickasawChileanChippewaChoctawColombianComancheCosta RicanCreeCreekCroatianCubanCzechCzechoslovakianDanishDominicanDutchEastern EuropeanEcuadorianEgyptianEnglishEstonianEthiopianEuropeanFilipinoFinnishFrenchFrench CanadianGermanGhanaianGreekGuamanian / ChamorroGuatemalanGuyaneseHaitianHonduranHopiHungarianIcelanderIndian (Asian)InupiatIranianIraqiIrishIroquoisIsraeliItalianJamaicanJapaneseJordanianKenyanKiowaKoreanLaotianLatvianLebaneseLiberianLithuanianLumbeeLuxembourgerMalaysianMalteseMexicanMexican American IndianMoroccanNative HawaiianNavajoNew ZealanderNicaraguanNigerianNorthern EuropeanNorwegianOsagePaiutePakistaniPalestinianPanamanianPennsylvania GermanPeruvianPimaPolishPortuguesePotawatomiPuebloPuerto RicanRomanianRussianSalvadoranSamoanScandinavianScotch-IrishScottishSeminoleSerbianShoshoneSiouxSlavicSlovakSloveneSouth AfricanSouth AmericanSouth American IndianSpaniardSpanishSpanish AmericanSpanish American IndianSri LankanSubsaharan AfricanSwedishSwissSyrianThaiTlingit-HaidaTohono O'OdhamTrinidadian and TobagonianTurkishUgandanUkrainianUteVenezuelanVietnameseWelshWest IndianYaquiYugoslavianYuman
Immigrant Origin (Total)
AfghanistanAfricaArgentinaArmeniaAsiaAustraliaAustriaBangladeshBelgiumBoliviaBrazilBulgariaCambodiaCameroonCanadaCaribbeanCentral AmericaChileChinaColombiaCubaCzechoslovakiaDominican RepublicEastern AfricaEastern AsiaEastern EuropeEcuadorEgyptEl SalvadorEnglandEthiopiaEuropeFranceGermanyGhanaGreeceGuatemalaHaitiHondurasHong KongHungaryIndiaIndonesiaIranIraqIrelandIsraelItalyJamaicaJapanJordanKazakhstanKenyaKoreaLaosLatin AmericaLebanonLiberiaMalaysiaMexicoMiddle AfricaMoroccoNepalNetherlandsNicaraguaNigeriaNorthern AfricaNorthern EuropeNorwayOceaniaPakistanPanamaPeruPhilippinesPolandPortugalRomaniaRussiaSaudi ArabiaScotlandSerbiaSouth AfricaSouth AmericaSouth Central AsiaSouth Eastern AsiaSouthern EuropeSpainSri LankaSwedenSwitzerlandSyriaTaiwanThailandTrinidad and TobagoTurkeyUgandaUkraineUzbekistanVenezuelaVietnamWest IndiesWestern AfricaWestern AsiaWestern EuropeZaireZimbabwe
Immigrant Origin (Percentage)
AfghanistanAfricaArgentinaArmeniaAsiaAustraliaAustriaBangladeshBelgiumBoliviaBrazilBulgariaCambodiaCameroonCanadaCaribbeanCentral AmericaChileChinaColombiaCubaCzechoslovakiaDominican RepublicEastern AfricaEastern AsiaEastern EuropeEcuadorEgyptEl SalvadorEnglandEthiopiaEuropeFranceGermanyGhanaGreeceGuatemalaHaitiHondurasHong KongHungaryIndiaIndonesiaIranIraqIrelandIsraelItalyJamaicaJapanJordanKazakhstanKenyaKoreaLaosLatin AmericaLebanonLiberiaMalaysiaMexicoMiddle AfricaMoroccoNepalNetherlandsNicaraguaNigeriaNorthern AfricaNorthern EuropeNorwayOceaniaPakistanPanamaPeruPhilippinesPolandPortugalRomaniaRussiaSaudi ArabiaScotlandSerbiaSouth AfricaSouth AmericaSouth Central AsiaSouth Eastern AsiaSouthern EuropeSpainSri LankaSwedenSwitzerlandSyriaTaiwanThailandTrinidad and TobagoTurkeyUgandaUkraineUzbekistanVenezuelaVietnamWest IndiesWestern AfricaWestern AsiaWestern EuropeZaireZimbabwe
Income
Income (Families)
Income (Households)
Poverty
Poverty (Families)
Unemployment
Employment Occupations
Employment Industries
Employer Class
Commute Time
Commute Means
School Enrollment
Education by Degree Field
Occupancy
Finances
Physical Characteristics
Albuquerque
Compare Zip Codes
Comparison Subject

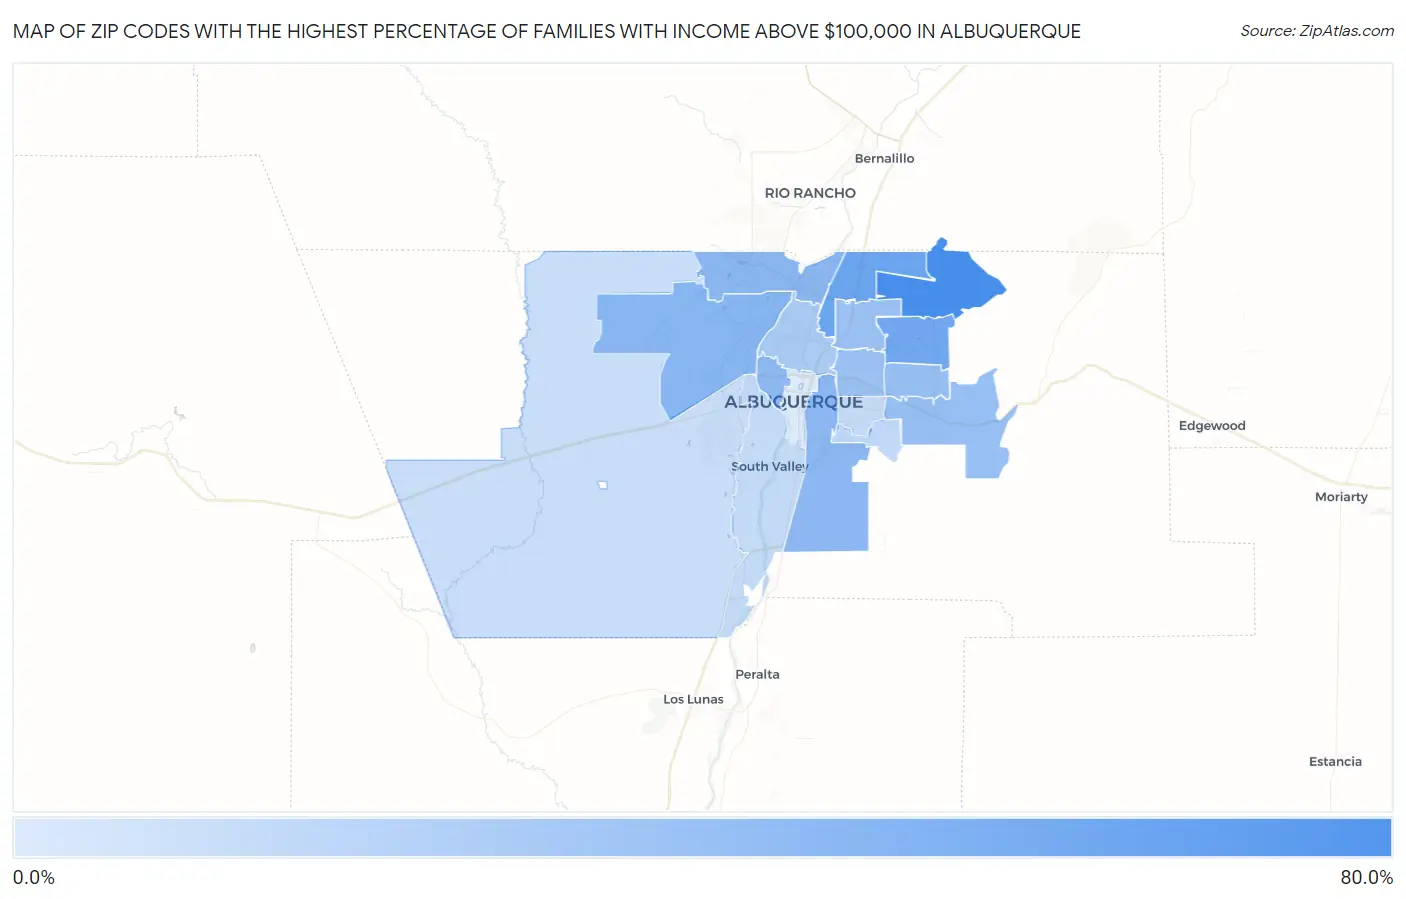
Map of Zip Codes with the Highest Percentage of Families with Income Above $100,000 in Albuquerque

0.0%
80.0%
Zip Codes with the Highest Percentage of Families with Income Above $100,000 in Albuquerque Map

Zip Codes with the Highest Percentage of Families with Income Above $100,000 in Albuquerque, NM

Zip Code Families with Income > $100k vs State vs National
1.8712275.9%34.7%(+41.2)#2046.1%(+29.8)#1,576
2.8711357.5%34.7%(+22.8)#3446.1%(+11.4)#5,951
3.8711155.4%34.7%(+20.7)#3646.1%(+9.30)#6,647
4.8712045.9%34.7%(+11.2)#6446.1%(-0.200)#10,862
5.8711444.4%34.7%(+9.70)#6646.1%(-1.70)#11,654
6.8710643.1%34.7%(+8.40)#6946.1%(-3.00)#12,420
7.8710442.8%34.7%(+8.10)#7246.1%(-3.30)#12,621
8.8712339.0%34.7%(+4.30)#8546.1%(-7.10)#15,062
9.8711238.8%34.7%(+4.10)#8846.1%(-7.30)#15,204
10.8710937.8%34.7%(+3.10)#9446.1%(-8.30)#15,891
11.8711037.6%34.7%(+2.90)#9546.1%(-8.50)#16,035
12.8710731.2%34.7%(-3.50)#13246.1%(-14.9)#20,584
13.8711622.7%34.7%(-12.0)#18446.1%(-23.4)#25,967
14.8710522.3%34.7%(-12.4)#18746.1%(-23.8)#26,147
15.8710821.1%34.7%(-13.6)#19746.1%(-25.0)#26,751
16.8712120.1%34.7%(-14.6)#20646.1%(-26.0)#27,180
17.8710213.3%34.7%(-21.4)#25146.1%(-32.8)#29,607

Common Questions

What are the Top 10 Zip Codes with the Highest Percentage of Families with Income Above $100,000 in Albuquerque, NM?
Top 10 Zip Codes with the Highest Percentage of Families with Income Above $100,000 in Albuquerque, NM are:
#1
75.9%
#2
57.5%
#3
55.4%
#4
45.9%
#5
44.4%
#6
43.1%
#7
42.8%
#8
39.0%
#9
38.8%
#10
37.8%
What zip code has the Highest Percentage of Families with Income Above $100,000 in Albuquerque, NM?
87122 has the Highest Percentage of Families with Income Above $100,000 in Albuquerque, NM with 75.9%.
What is the Percentage of Families with Income Above $100,000 in Albuquerque, NM?
Percentage of Families with Income Above $100,000 in Albuquerque is 38.4%.
What is the Percentage of Families with Income Above $100,000 in New Mexico?
Percentage of Families with Income Above $100,000 in New Mexico is 34.7%.
What is the Percentage of Families with Income Above $100,000 in the United States?
Percentage of Families with Income Above $100,000 in the United States is 46.1%.