Zip Codes with the Highest Percentage of Population with a Degree in Visual and Performing Arts in Columbus, MS
RELATED REPORTS & OPTIONS
Visual and Performing Arts
Columbus
Compare Zip Codes
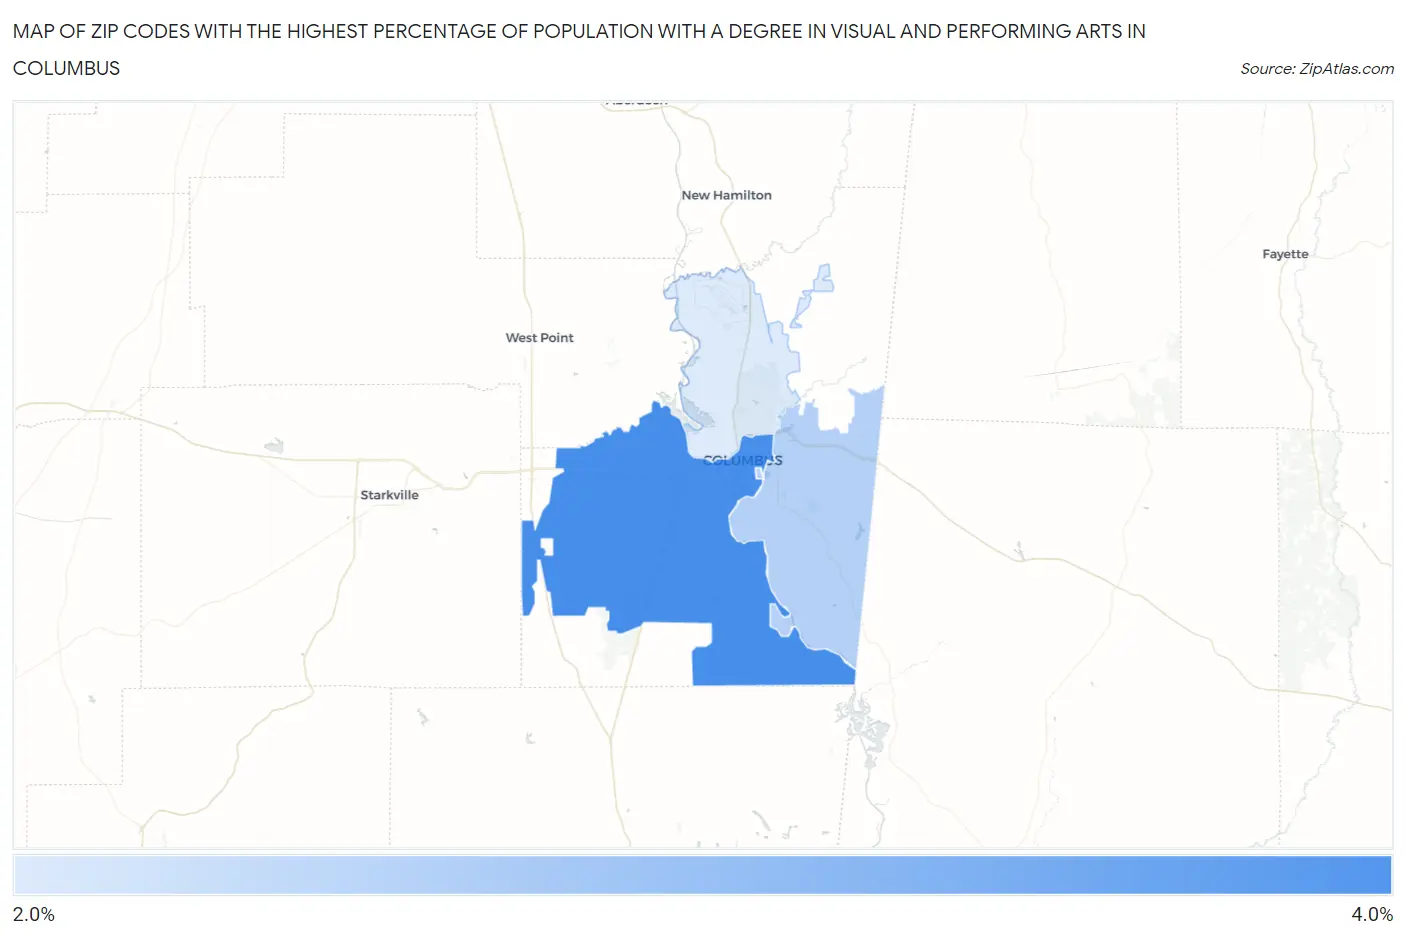
Map of Zip Codes with the Highest Percentage of Population with a Degree in Visual and Performing Arts in Columbus
2.3%
3.4%
Zip Codes with the Highest Percentage of Population with a Degree in Visual and Performing Arts in Columbus, MS
| Zip Code | % Graduates | vs State | vs National | |
| 1. | 39701 | 3.4% | 2.4%(+0.978)#62 | 4.3%(-0.896)#11,402 |
| 2. | 39702 | 2.6% | 2.4%(+0.221)#87 | 4.3%(-1.65)#14,263 |
| 3. | 39705 | 2.3% | 2.4%(-0.067)#100 | 4.3%(-1.94)#15,340 |
1
Common Questions
What are the Top Zip Codes with the Highest Percentage of Population with a Degree in Visual and Performing Arts in Columbus, MS?
Top Zip Codes with the Highest Percentage of Population with a Degree in Visual and Performing Arts in Columbus, MS are:
What zip code has the Highest Percentage of Population with a Degree in Visual and Performing Arts in Columbus, MS?
39701 has the Highest Percentage of Population with a Degree in Visual and Performing Arts in Columbus, MS with 3.4%.
What is the Percentage of Population with a Degree in Visual and Performing Arts in Columbus, MS?
Percentage of Population with a Degree in Visual and Performing Arts in Columbus is 2.8%.
What is the Percentage of Population with a Degree in Visual and Performing Arts in Mississippi?
Percentage of Population with a Degree in Visual and Performing Arts in Mississippi is 2.4%.
What is the Percentage of Population with a Degree in Visual and Performing Arts in the United States?
Percentage of Population with a Degree in Visual and Performing Arts in the United States is 4.3%.