Zip Codes with the Highest Percentage of Population with a Degree in Visual and Performing Arts in Jackson, MS
RELATED REPORTS & OPTIONS
Visual and Performing Arts
Jackson
Compare Zip Codes
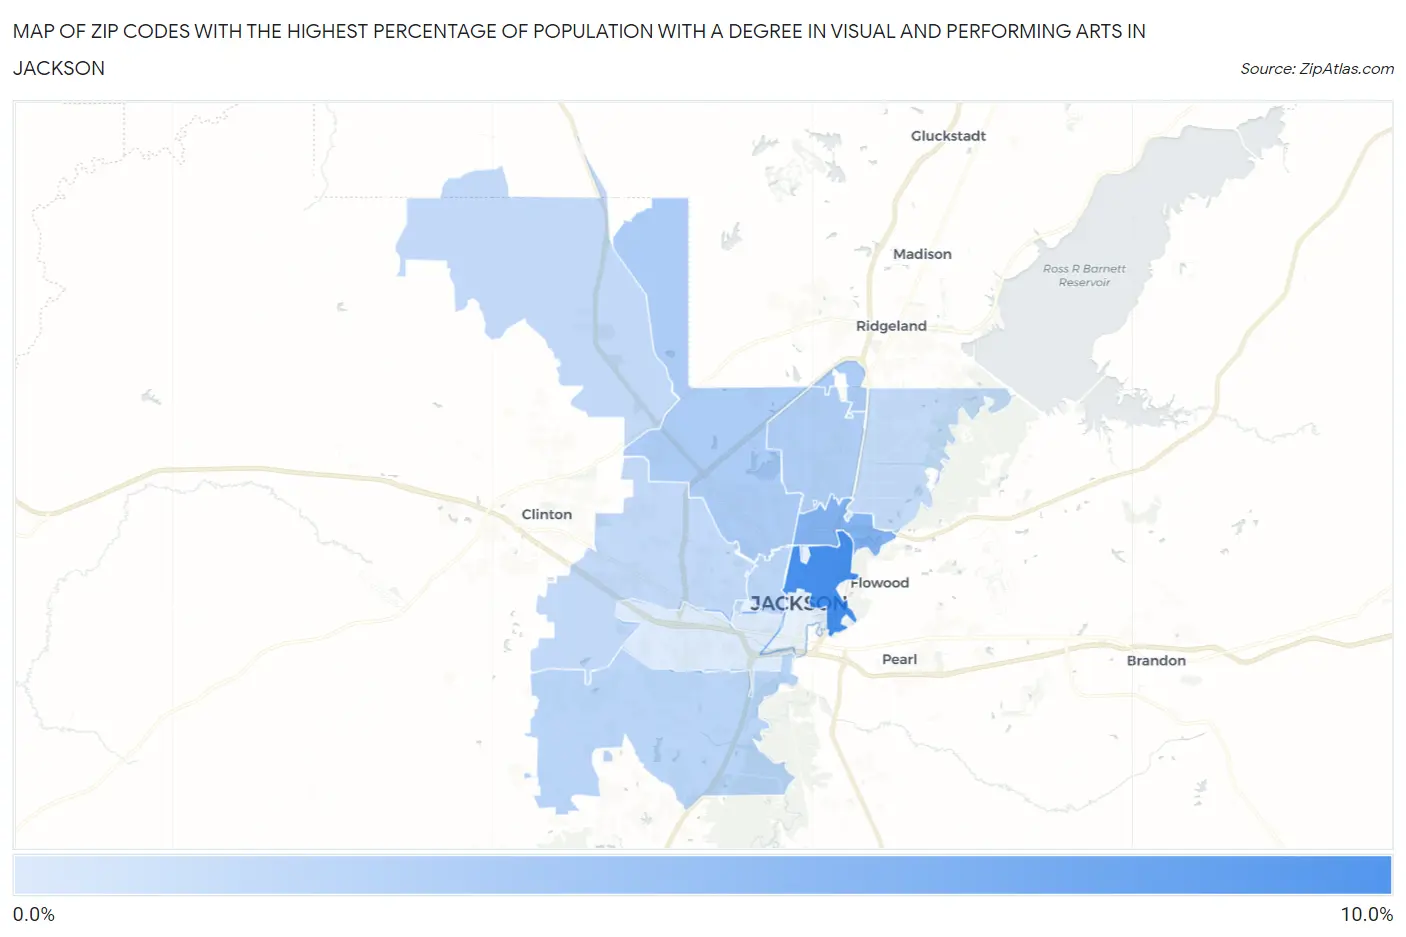
Map of Zip Codes with the Highest Percentage of Population with a Degree in Visual and Performing Arts in Jackson
0.85%
9.3%
Zip Codes with the Highest Percentage of Population with a Degree in Visual and Performing Arts in Jackson, MS
| Zip Code | % Graduates | vs State | vs National | |
| 1. | 39202 | 9.3% | 2.4%(+6.96)#15 | 4.3%(+5.09)#2,085 |
| 2. | 39216 | 5.9% | 2.4%(+3.52)#31 | 4.3%(+1.64)#5,018 |
| 3. | 39213 | 3.5% | 2.4%(+1.17)#58 | 4.3%(-0.706)#10,718 |
| 4. | 39206 | 3.4% | 2.4%(+1.04)#61 | 4.3%(-0.831)#11,177 |
| 5. | 39212 | 2.7% | 2.4%(+0.349)#80 | 4.3%(-1.53)#13,789 |
| 6. | 39203 | 2.6% | 2.4%(+0.229)#86 | 4.3%(-1.65)#14,243 |
| 7. | 39209 | 2.4% | 2.4%(+0.021)#95 | 4.3%(-1.85)#15,007 |
| 8. | 39211 | 2.3% | 2.4%(-0.096)#102 | 4.3%(-1.97)#15,429 |
| 9. | 39204 | 0.85% | 2.4%(-1.53)#162 | 4.3%(-3.40)#20,050 |
1
Common Questions
What are the Top 10 Zip Codes with the Highest Percentage of Population with a Degree in Visual and Performing Arts in Jackson, MS?
Top 10 Zip Codes with the Highest Percentage of Population with a Degree in Visual and Performing Arts in Jackson, MS are:
What zip code has the Highest Percentage of Population with a Degree in Visual and Performing Arts in Jackson, MS?
39202 has the Highest Percentage of Population with a Degree in Visual and Performing Arts in Jackson, MS with 9.3%.
What is the Percentage of Population with a Degree in Visual and Performing Arts in Jackson, MS?
Percentage of Population with a Degree in Visual and Performing Arts in Jackson is 3.1%.
What is the Percentage of Population with a Degree in Visual and Performing Arts in Mississippi?
Percentage of Population with a Degree in Visual and Performing Arts in Mississippi is 2.4%.
What is the Percentage of Population with a Degree in Visual and Performing Arts in the United States?
Percentage of Population with a Degree in Visual and Performing Arts in the United States is 4.3%.