Prentiss, MS Map & Demographics
Prentiss Map
Prentiss Overview
$17,134
PER CAPITA INCOME
$36,500
AVG FAMILY INCOME
$25,859
AVG HOUSEHOLD INCOME
52.6%
WAGE / INCOME GAP [ % ]
47.4¢/ $1
WAGE / INCOME GAP [ $ ]
0.46
INEQUALITY / GINI INDEX
985
TOTAL POPULATION
483
MALE POPULATION
502
FEMALE POPULATION
96.22
MALES / 100 FEMALES
103.93
FEMALES / 100 MALES
48.4
MEDIAN AGE
3.4
AVG FAMILY SIZE
2.3
AVG HOUSEHOLD SIZE
247
LABOR FORCE [ PEOPLE ]
31.3%
PERCENT IN LABOR FORCE
6.1%
UNEMPLOYMENT RATE
Prentiss Zip Codes
Prentiss Area Codes
Income in Prentiss
Income Overview in Prentiss
Per Capita Income in Prentiss is $17,134, while median incomes of families and households are $36,500 and $25,859 respectively.
| Characteristic | Number | Measure |
| Per Capita Income | 985 | $17,134 |
| Median Family Income | 198 | $36,500 |
| Mean Family Income | 198 | $48,606 |
| Median Household Income | 367 | $25,859 |
| Mean Household Income | 367 | $37,337 |
| Income Deficit | 198 | $0 |
| Wage / Income Gap (%) | 985 | 52.59% |
| Wage / Income Gap ($) | 985 | 47.41¢ per $1 |
| Gini / Inequality Index | 985 | 0.46 |
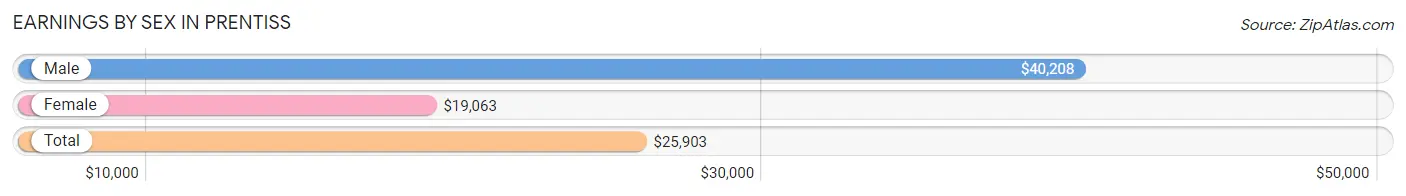
Earnings by Sex in Prentiss
Average Earnings in Prentiss are $25,903, $40,208 for men and $19,063 for women, a difference of 52.6%.
| Sex | Number | Average Earnings |
| Male | 128 (49.0%) | $40,208 |
| Female | 133 (51.0%) | $19,063 |
| Total | 261 (100.0%) | $25,903 |
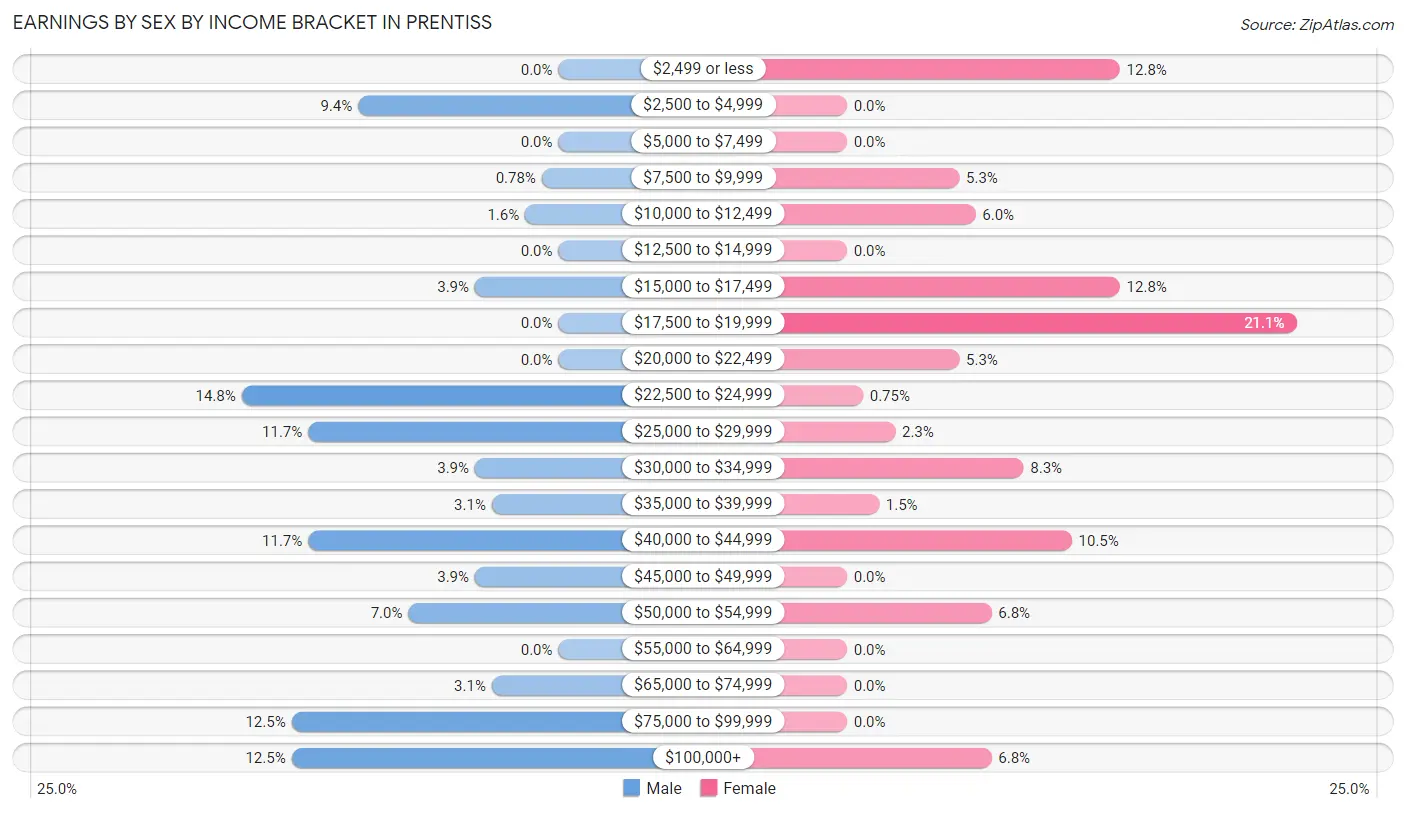
Earnings by Sex by Income Bracket in Prentiss
The most common earnings brackets in Prentiss are $22,500 to $24,999 for men (19 | 14.8%) and $17,500 to $19,999 for women (28 | 21.0%).
| Income | Male | Female |
| $2,499 or less | 0 (0.0%) | 17 (12.8%) |
| $2,500 to $4,999 | 12 (9.4%) | 0 (0.0%) |
| $5,000 to $7,499 | 0 (0.0%) | 0 (0.0%) |
| $7,500 to $9,999 | 1 (0.8%) | 7 (5.3%) |
| $10,000 to $12,499 | 2 (1.6%) | 8 (6.0%) |
| $12,500 to $14,999 | 0 (0.0%) | 0 (0.0%) |
| $15,000 to $17,499 | 5 (3.9%) | 17 (12.8%) |
| $17,500 to $19,999 | 0 (0.0%) | 28 (21.0%) |
| $20,000 to $22,499 | 0 (0.0%) | 7 (5.3%) |
| $22,500 to $24,999 | 19 (14.8%) | 1 (0.7%) |
| $25,000 to $29,999 | 15 (11.7%) | 3 (2.3%) |
| $30,000 to $34,999 | 5 (3.9%) | 11 (8.3%) |
| $35,000 to $39,999 | 4 (3.1%) | 2 (1.5%) |
| $40,000 to $44,999 | 15 (11.7%) | 14 (10.5%) |
| $45,000 to $49,999 | 5 (3.9%) | 0 (0.0%) |
| $50,000 to $54,999 | 9 (7.0%) | 9 (6.8%) |
| $55,000 to $64,999 | 0 (0.0%) | 0 (0.0%) |
| $65,000 to $74,999 | 4 (3.1%) | 0 (0.0%) |
| $75,000 to $99,999 | 16 (12.5%) | 0 (0.0%) |
| $100,000+ | 16 (12.5%) | 9 (6.8%) |
| Total | 128 (100.0%) | 133 (100.0%) |
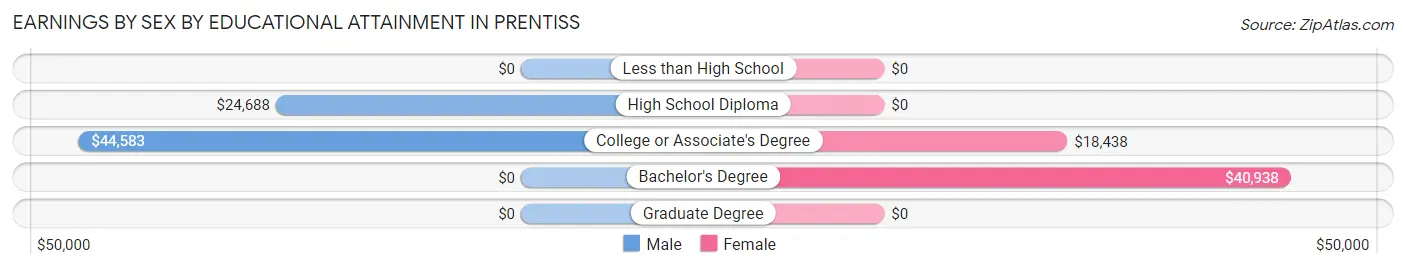
Earnings by Sex by Educational Attainment in Prentiss
Average earnings in Prentiss are $41,979 for men and $19,196 for women, a difference of 54.3%. Men with an educational attainment of college or associate's degree enjoy the highest average annual earnings of $44,583, while those with high school diploma education earn the least with $24,688. Women with an educational attainment of bachelor's degree earn the most with the average annual earnings of $40,938, while those with college or associate's degree education have the smallest earnings of $18,438.
| Educational Attainment | Male Income | Female Income |
| Less than High School | - | - |
| High School Diploma | $24,688 | $0 |
| College or Associate's Degree | $44,583 | $18,438 |
| Bachelor's Degree | - | - |
| Graduate Degree | - | - |
| Total | $41,979 | $19,196 |
Family Income in Prentiss
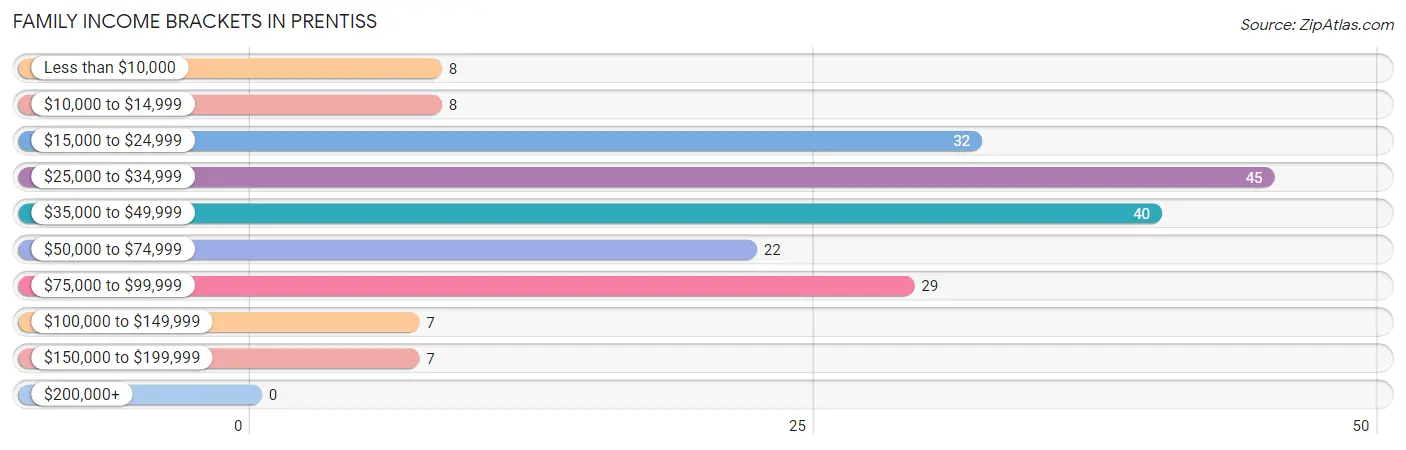
Family Income Brackets in Prentiss
According to the Prentiss family income data, there are 45 families falling into the $25,000 to $34,999 income range, which is the most common income bracket and makes up 22.7% of all families.
| Income Bracket | # Families | % Families |
| Less than $10,000 | 8 | 4.0% |
| $10,000 to $14,999 | 8 | 4.0% |
| $15,000 to $24,999 | 32 | 16.2% |
| $25,000 to $34,999 | 45 | 22.7% |
| $35,000 to $49,999 | 40 | 20.2% |
| $50,000 to $74,999 | 22 | 11.1% |
| $75,000 to $99,999 | 29 | 14.6% |
| $100,000 to $149,999 | 7 | 3.5% |
| $150,000 to $199,999 | 7 | 3.5% |
| $200,000+ | 0 | 0.0% |
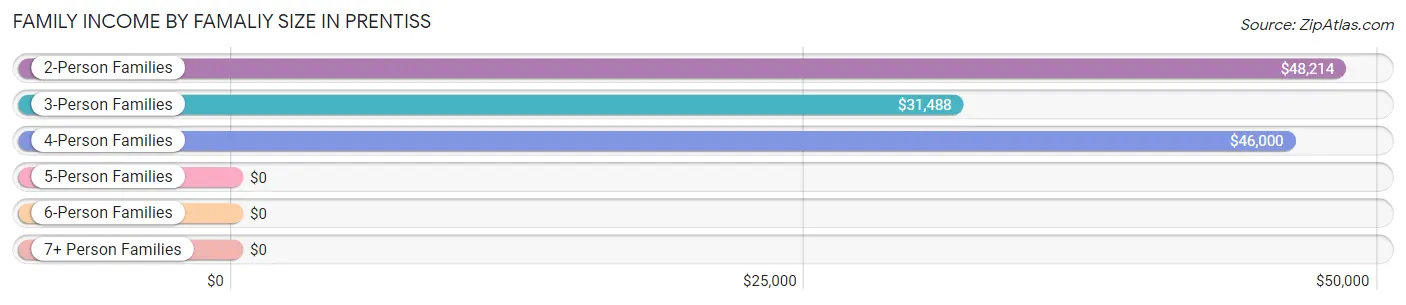
Family Income by Famaliy Size in Prentiss
2-person families (94 | 47.5%) account for the highest median family income in Prentiss with $48,214 per family, while 2-person families (94 | 47.5%) have the highest median income of $24,107 per family member.
| Income Bracket | # Families | Median Income |
| 2-Person Families | 94 (47.5%) | $48,214 |
| 3-Person Families | 59 (29.8%) | $31,488 |
| 4-Person Families | 30 (15.1%) | $46,000 |
| 5-Person Families | 8 (4.0%) | $0 |
| 6-Person Families | 7 (3.5%) | $0 |
| 7+ Person Families | 0 (0.0%) | $0 |
| Total | 198 (100.0%) | $36,500 |
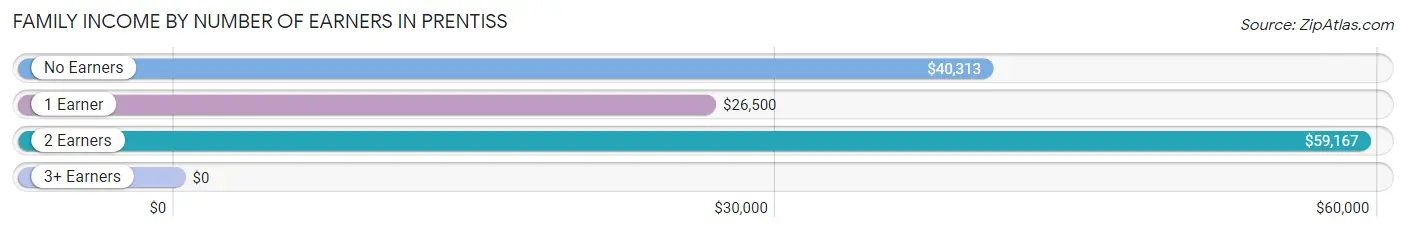
Family Income by Number of Earners in Prentiss
| Number of Earners | # Families | Median Income |
| No Earners | 70 (35.3%) | $40,313 |
| 1 Earner | 86 (43.4%) | $26,500 |
| 2 Earners | 32 (16.2%) | $59,167 |
| 3+ Earners | 10 (5.1%) | $0 |
| Total | 198 (100.0%) | $36,500 |
Household Income in Prentiss
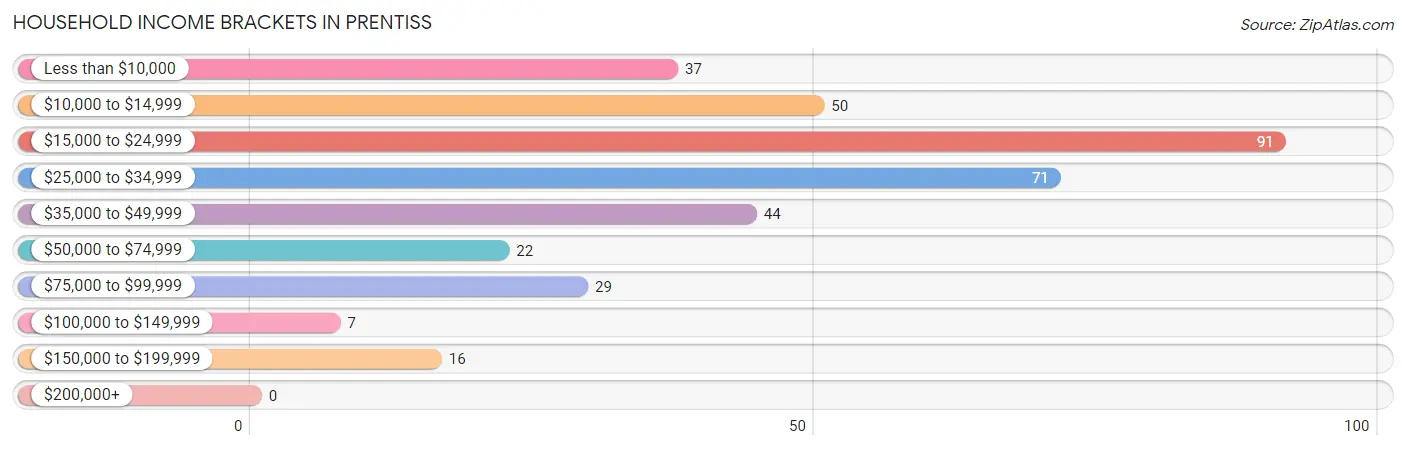
Household Income Brackets in Prentiss
With 91 households falling in the category, the $15,000 to $24,999 income range is the most frequent in Prentiss, accounting for 24.8% of all households.
| Income Bracket | # Households | % Households |
| Less than $10,000 | 37 | 10.1% |
| $10,000 to $14,999 | 50 | 13.6% |
| $15,000 to $24,999 | 91 | 24.8% |
| $25,000 to $34,999 | 71 | 19.3% |
| $35,000 to $49,999 | 44 | 12.0% |
| $50,000 to $74,999 | 22 | 6.0% |
| $75,000 to $99,999 | 29 | 7.9% |
| $100,000 to $149,999 | 7 | 1.9% |
| $150,000 to $199,999 | 16 | 4.4% |
| $200,000+ | 0 | 0.0% |
Household Income by Householder Age in Prentiss
The median household income in Prentiss is $25,859, with the highest median household income of $31,458 found in the 65+ years age bracket for the primary householder. A total of 152 households (41.4%) fall into this category. Meanwhile, the 15 to 24 years age bracket for the primary householder has the lowest median household income of $0, with 23 households (6.3%) in this group.
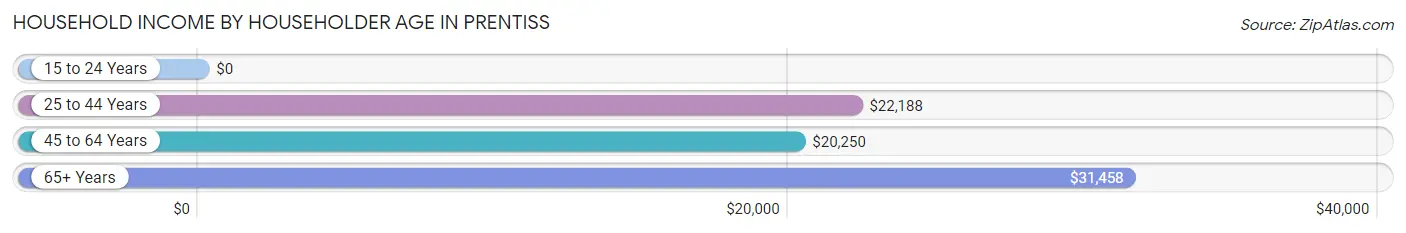
| Income Bracket | # Households | Median Income |
| 15 to 24 Years | 23 (6.3%) | $0 |
| 25 to 44 Years | 70 (19.1%) | $22,188 |
| 45 to 64 Years | 122 (33.2%) | $20,250 |
| 65+ Years | 152 (41.4%) | $31,458 |
| Total | 367 (100.0%) | $25,859 |
Poverty in Prentiss
Income Below Poverty by Sex and Age in Prentiss
With 25.5% poverty level for males and 39.9% for females among the residents of Prentiss, 5 year old males and 15 year old females are the most vulnerable to poverty, with 4 males (100.0%) and 6 females (100.0%) in their respective age groups living below the poverty level.
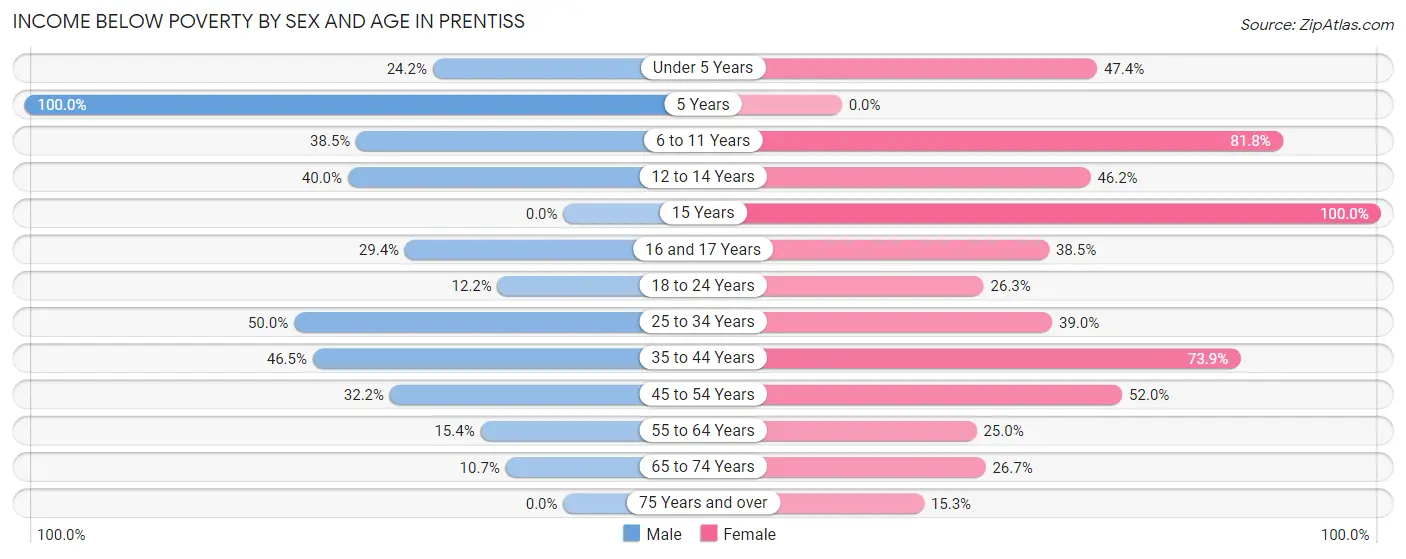
| Age Bracket | Male | Female |
| Under 5 Years | 8 (24.2%) | 27 (47.4%) |
| 5 Years | 4 (100.0%) | 0 (0.0%) |
| 6 to 11 Years | 10 (38.5%) | 18 (81.8%) |
| 12 to 14 Years | 10 (40.0%) | 6 (46.2%) |
| 15 Years | 0 (0.0%) | 6 (100.0%) |
| 16 and 17 Years | 5 (29.4%) | 5 (38.5%) |
| 18 to 24 Years | 5 (12.2%) | 10 (26.3%) |
| 25 to 34 Years | 5 (50.0%) | 16 (39.0%) |
| 35 to 44 Years | 20 (46.5%) | 17 (73.9%) |
| 45 to 54 Years | 19 (32.2%) | 51 (52.0%) |
| 55 to 64 Years | 6 (15.4%) | 17 (25.0%) |
| 65 to 74 Years | 6 (10.7%) | 12 (26.7%) |
| 75 Years and over | 0 (0.0%) | 9 (15.2%) |
| Total | 98 (25.5%) | 194 (39.9%) |
Income Above Poverty by Sex and Age in Prentiss
According to the poverty statistics in Prentiss, males aged 75 years and over and females aged 5 years are the age groups that are most secure financially, with 100.0% of males and 100.0% of females in these age groups living above the poverty line.
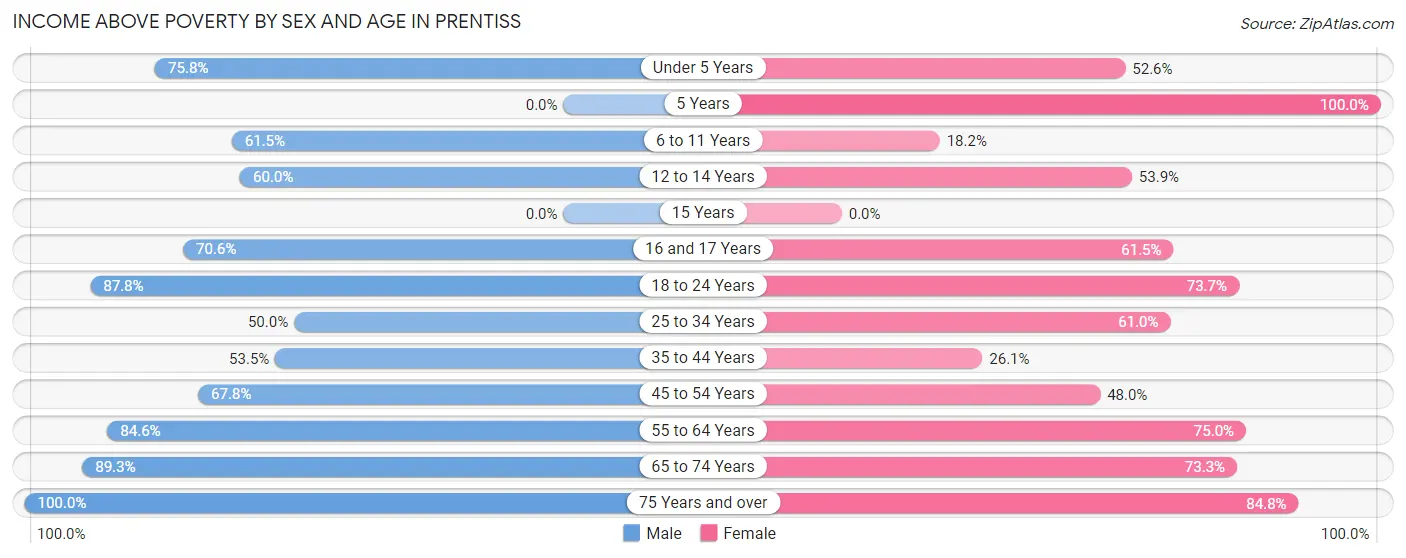
| Age Bracket | Male | Female |
| Under 5 Years | 25 (75.8%) | 30 (52.6%) |
| 5 Years | 0 (0.0%) | 3 (100.0%) |
| 6 to 11 Years | 16 (61.5%) | 4 (18.2%) |
| 12 to 14 Years | 15 (60.0%) | 7 (53.8%) |
| 15 Years | 0 (0.0%) | 0 (0.0%) |
| 16 and 17 Years | 12 (70.6%) | 8 (61.5%) |
| 18 to 24 Years | 36 (87.8%) | 28 (73.7%) |
| 25 to 34 Years | 5 (50.0%) | 25 (61.0%) |
| 35 to 44 Years | 23 (53.5%) | 6 (26.1%) |
| 45 to 54 Years | 40 (67.8%) | 47 (48.0%) |
| 55 to 64 Years | 33 (84.6%) | 51 (75.0%) |
| 65 to 74 Years | 50 (89.3%) | 33 (73.3%) |
| 75 Years and over | 31 (100.0%) | 50 (84.8%) |
| Total | 286 (74.5%) | 292 (60.1%) |
Income Below Poverty Among Married-Couple Families in Prentiss
The poverty statistics for married-couple families in Prentiss show that 16.0% or 19 of the total 119 families live below the poverty line. Families with 3 or 4 children have the highest poverty rate of 42.9%, comprising of 3 families. On the other hand, families with no children have the lowest poverty rate of 6.9%, which includes 5 families.
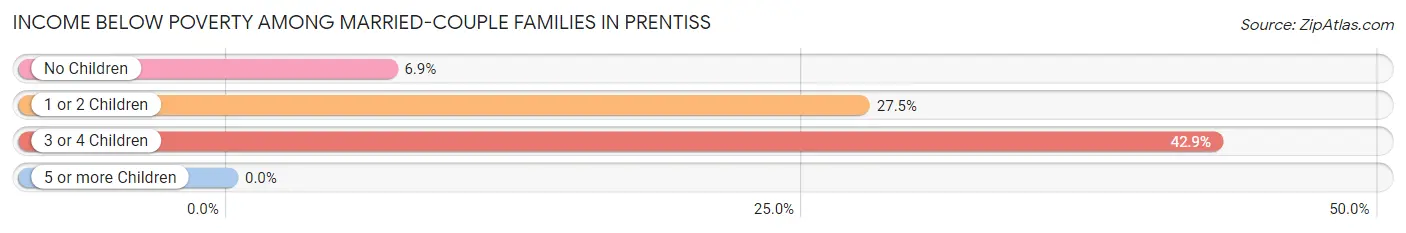
| Children | Above Poverty | Below Poverty |
| No Children | 67 (93.1%) | 5 (6.9%) |
| 1 or 2 Children | 29 (72.5%) | 11 (27.5%) |
| 3 or 4 Children | 4 (57.1%) | 3 (42.9%) |
| 5 or more Children | 0 (0.0%) | 0 (0.0%) |
| Total | 100 (84.0%) | 19 (16.0%) |
Income Below Poverty Among Single-Parent Households in Prentiss
According to the poverty data in Prentiss, 19.2% or 5 single-father households and 54.7% or 29 single-mother households are living below the poverty line. Among single-father households, those with 1 or 2 children have the highest poverty rate, with 5 households (55.6%) experiencing poverty. Likewise, among single-mother households, those with 1 or 2 children have the highest poverty rate, with 29 households (64.4%) falling below the poverty line.
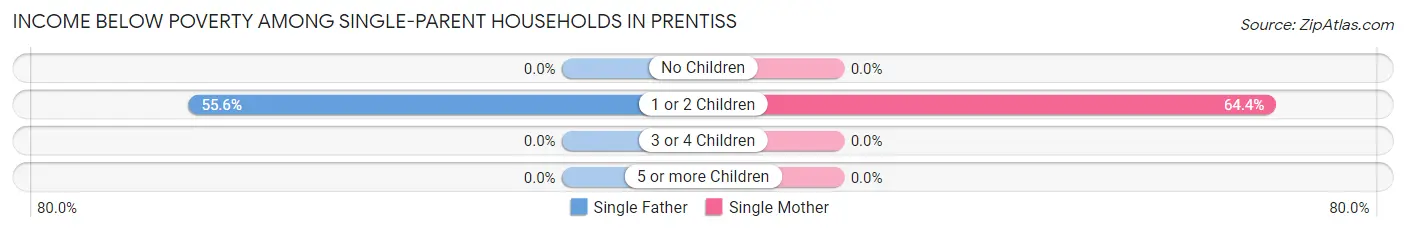
| Children | Single Father | Single Mother |
| No Children | 0 (0.0%) | 0 (0.0%) |
| 1 or 2 Children | 5 (55.6%) | 29 (64.4%) |
| 3 or 4 Children | 0 (0.0%) | 0 (0.0%) |
| 5 or more Children | 0 (0.0%) | 0 (0.0%) |
| Total | 5 (19.2%) | 29 (54.7%) |
Income Below Poverty Among Married-Couple vs Single-Parent Households in Prentiss
The poverty data for Prentiss shows that 19 of the married-couple family households (16.0%) and 34 of the single-parent households (43.0%) are living below the poverty level. Within the married-couple family households, those with 3 or 4 children have the highest poverty rate, with 3 households (42.9%) falling below the poverty line. Among the single-parent households, those with 1 or 2 children have the highest poverty rate, with 34 household (63.0%) living below poverty.
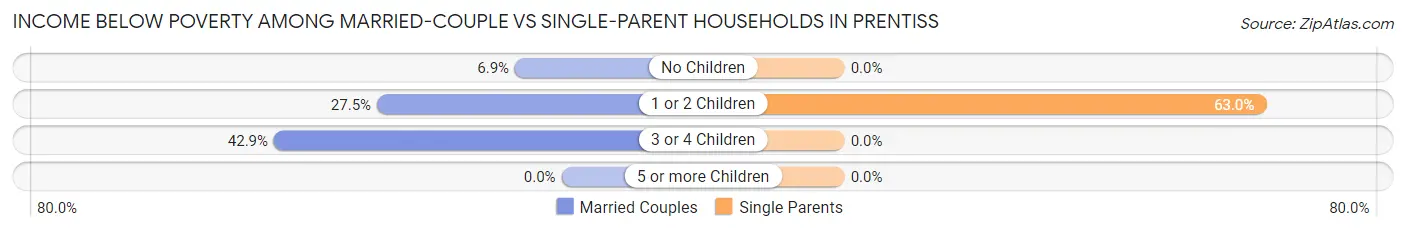
| Children | Married-Couple Families | Single-Parent Households |
| No Children | 5 (6.9%) | 0 (0.0%) |
| 1 or 2 Children | 11 (27.5%) | 34 (63.0%) |
| 3 or 4 Children | 3 (42.9%) | 0 (0.0%) |
| 5 or more Children | 0 (0.0%) | 0 (0.0%) |
| Total | 19 (16.0%) | 34 (43.0%) |
Race in Prentiss
The most populous races in Prentiss are White / Caucasian (557 | 56.6%), Black / African American (384 | 39.0%), and Two or more Races (44 | 4.5%).
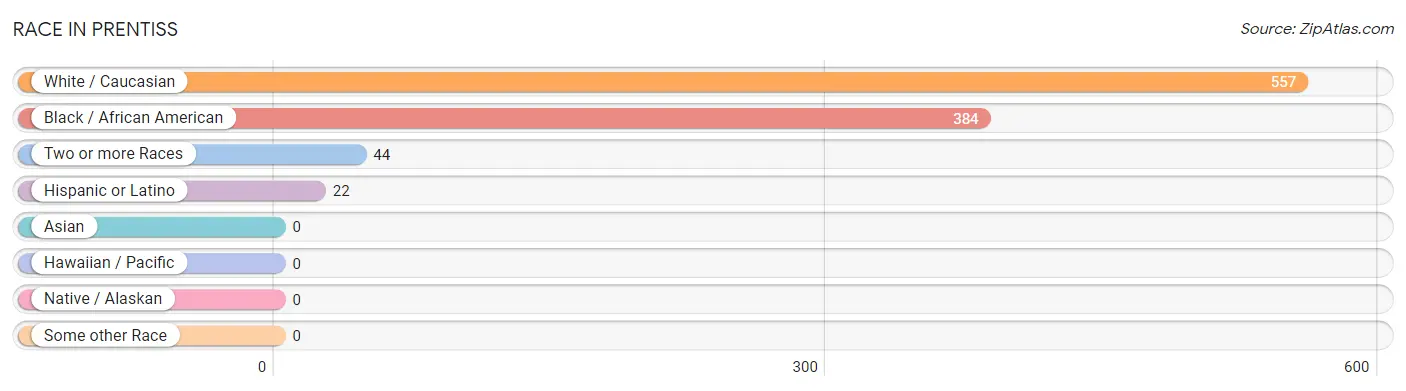
| Race | # Population | % Population |
| Asian | 0 | 0.0% |
| Black / African American | 384 | 39.0% |
| Hawaiian / Pacific | 0 | 0.0% |
| Hispanic or Latino | 22 | 2.2% |
| Native / Alaskan | 0 | 0.0% |
| White / Caucasian | 557 | 56.6% |
| Two or more Races | 44 | 4.5% |
| Some other Race | 0 | 0.0% |
| Total | 985 | 100.0% |
Ancestry in Prentiss
The most populous ancestries reported in Prentiss are Irish (104 | 10.6%), Italian (43 | 4.4%), Arab (32 | 3.3%), English (26 | 2.6%), and German (23 | 2.3%), together accounting for 23.2% of all Prentiss residents.
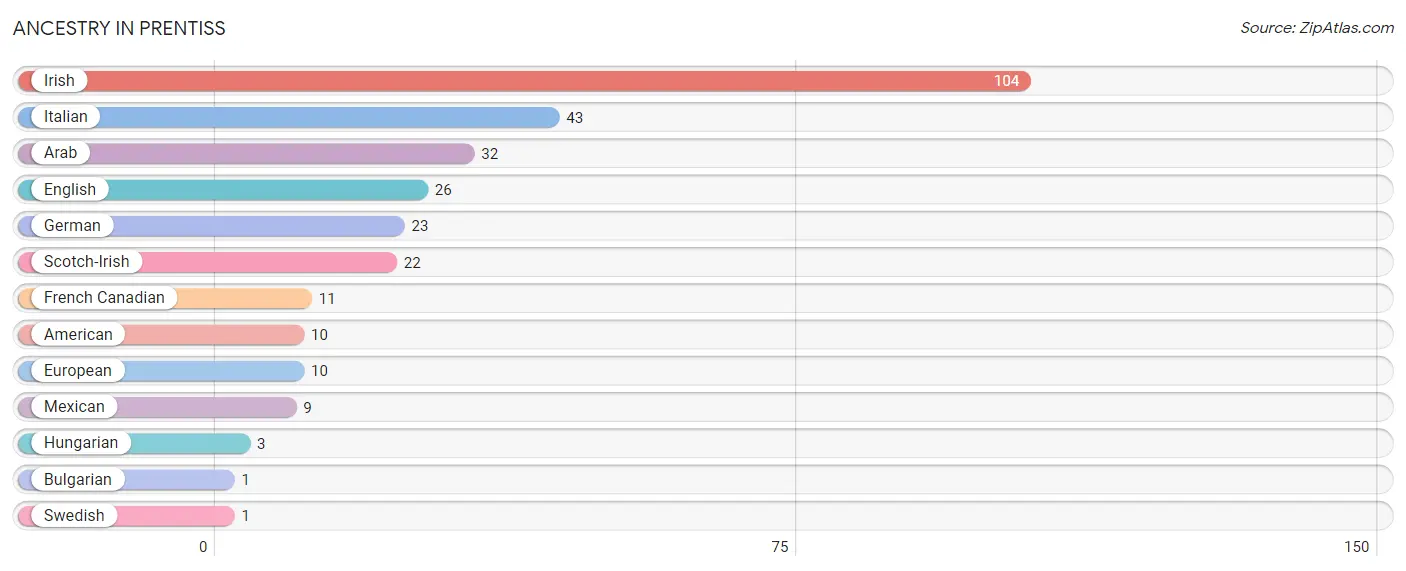
| Ancestry | # Population | % Population |
| American | 10 | 1.0% |
| Arab | 32 | 3.3% |
| Bulgarian | 1 | 0.1% |
| English | 26 | 2.6% |
| European | 10 | 1.0% |
| French Canadian | 11 | 1.1% |
| German | 23 | 2.3% |
| Hungarian | 3 | 0.3% |
| Irish | 104 | 10.6% |
| Italian | 43 | 4.4% |
| Mexican | 9 | 0.9% |
| Scotch-Irish | 22 | 2.2% |
| Swedish | 1 | 0.1% | View All 13 Rows |
Immigrants in Prentiss
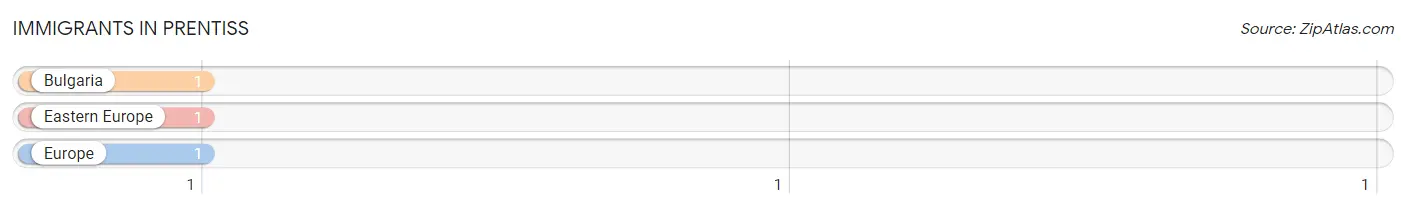
The most numerous immigrant groups reported in Prentiss came from Bulgaria (1 | 0.1%), Eastern Europe (1 | 0.1%), and Europe (1 | 0.1%), together accounting for 0.3% of all Prentiss residents.
| Immigration Origin | # Population | % Population |
| Bulgaria | 1 | 0.1% |
| Eastern Europe | 1 | 0.1% |
| Europe | 1 | 0.1% | View All 3 Rows |
Sex and Age in Prentiss
Sex and Age in Prentiss
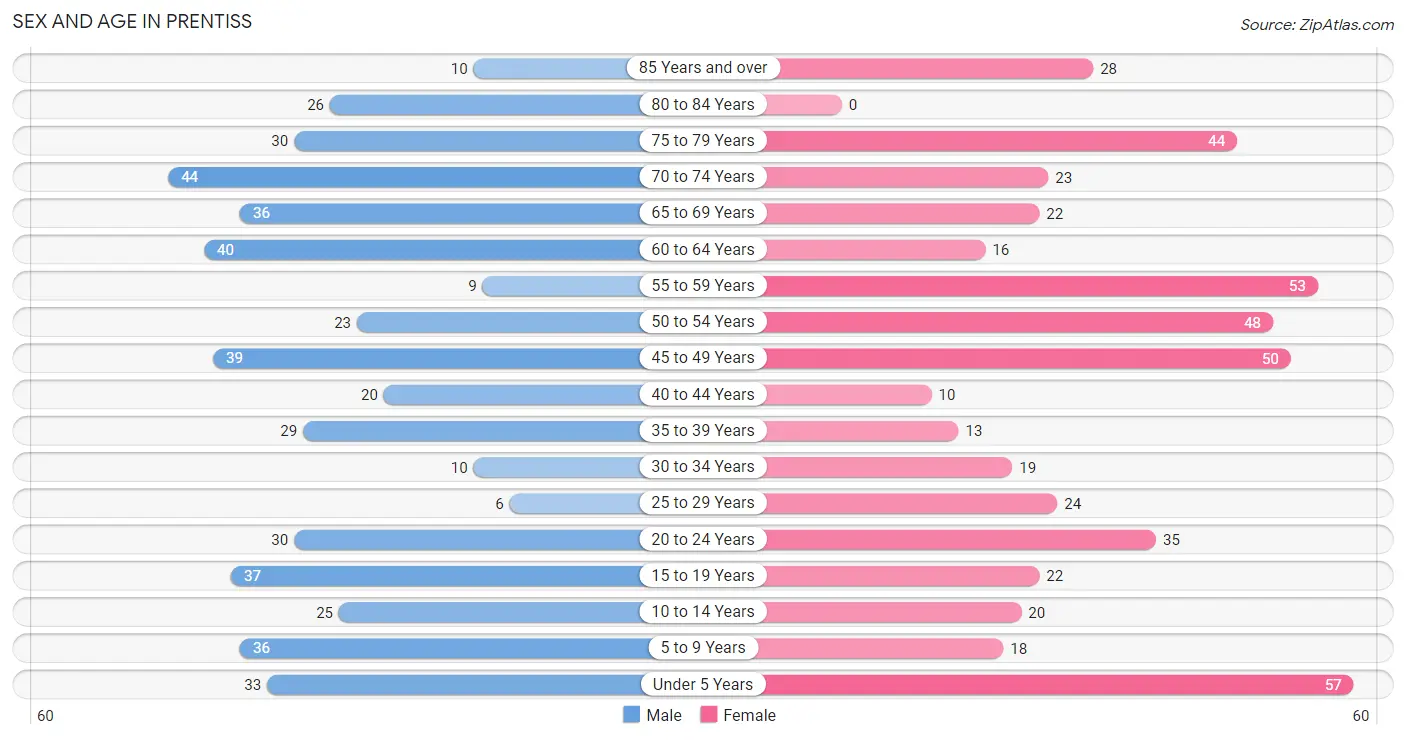
The most populous age groups in Prentiss are 70 to 74 Years (44 | 9.1%) for men and Under 5 Years (57 | 11.4%) for women.
| Age Bracket | Male | Female |
| Under 5 Years | 33 (6.8%) | 57 (11.4%) |
| 5 to 9 Years | 36 (7.4%) | 18 (3.6%) |
| 10 to 14 Years | 25 (5.2%) | 20 (4.0%) |
| 15 to 19 Years | 37 (7.7%) | 22 (4.4%) |
| 20 to 24 Years | 30 (6.2%) | 35 (7.0%) |
| 25 to 29 Years | 6 (1.2%) | 24 (4.8%) |
| 30 to 34 Years | 10 (2.1%) | 19 (3.8%) |
| 35 to 39 Years | 29 (6.0%) | 13 (2.6%) |
| 40 to 44 Years | 20 (4.1%) | 10 (2.0%) |
| 45 to 49 Years | 39 (8.1%) | 50 (10.0%) |
| 50 to 54 Years | 23 (4.8%) | 48 (9.6%) |
| 55 to 59 Years | 9 (1.9%) | 53 (10.6%) |
| 60 to 64 Years | 40 (8.3%) | 16 (3.2%) |
| 65 to 69 Years | 36 (7.4%) | 22 (4.4%) |
| 70 to 74 Years | 44 (9.1%) | 23 (4.6%) |
| 75 to 79 Years | 30 (6.2%) | 44 (8.8%) |
| 80 to 84 Years | 26 (5.4%) | 0 (0.0%) |
| 85 Years and over | 10 (2.1%) | 28 (5.6%) |
| Total | 483 (100.0%) | 502 (100.0%) |
Families and Households in Prentiss
Median Family Size in Prentiss
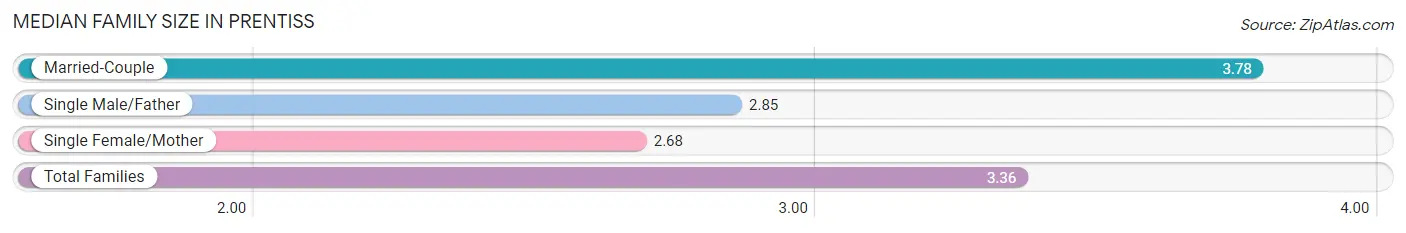
The median family size in Prentiss is 3.36 persons per family, with married-couple families (119 | 60.1%) accounting for the largest median family size of 3.78 persons per family. On the other hand, single female/mother families (53 | 26.8%) represent the smallest median family size with 2.68 persons per family.
| Family Type | # Families | Family Size |
| Married-Couple | 119 (60.1%) | 3.78 |
| Single Male/Father | 26 (13.1%) | 2.85 |
| Single Female/Mother | 53 (26.8%) | 2.68 |
| Total Families | 198 (100.0%) | 3.36 |
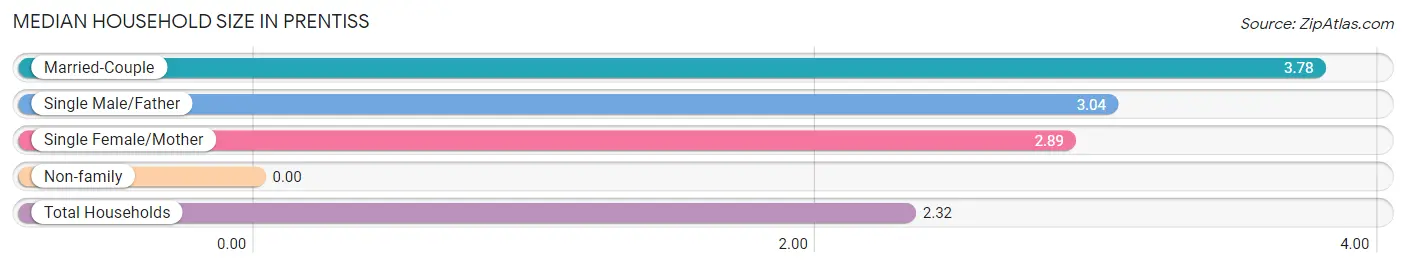
Median Household Size in Prentiss
| Household Type | # Households | Household Size |
| Married-Couple | 119 (32.4%) | 3.78 |
| Single Male/Father | 26 (7.1%) | 3.04 |
| Single Female/Mother | 53 (14.4%) | 2.89 |
| Non-family | 169 (46.1%) | - |
| Total Households | 367 (100.0%) | 2.32 |
Household Size by Marriage Status in Prentiss
Out of a total of 367 households in Prentiss, 198 (53.9%) are family households, while 169 (46.1%) are nonfamily households. The most numerous type of family households are 2-person households, comprising 90, and the most common type of nonfamily households are 1-person households, comprising 169.
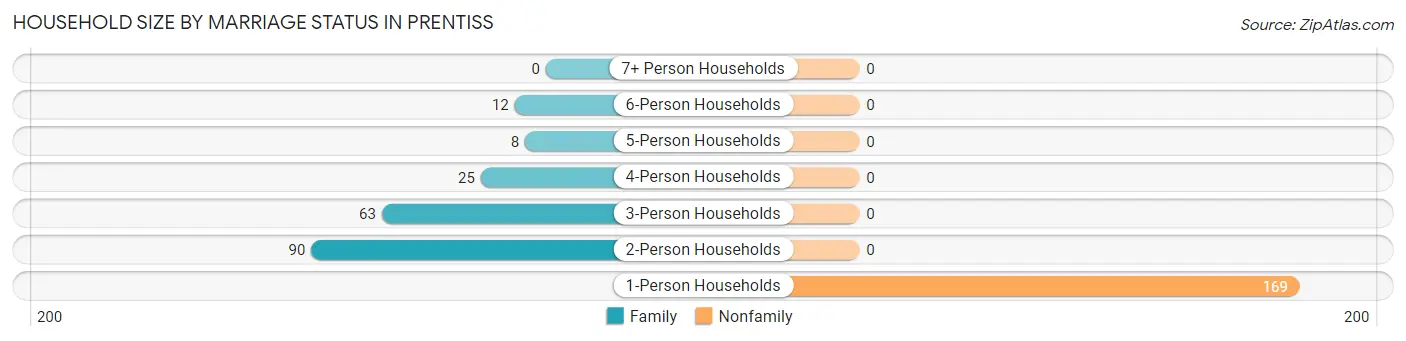
| Household Size | Family Households | Nonfamily Households |
| 1-Person Households | - | 169 (46.1%) |
| 2-Person Households | 90 (24.5%) | 0 (0.0%) |
| 3-Person Households | 63 (17.2%) | 0 (0.0%) |
| 4-Person Households | 25 (6.8%) | 0 (0.0%) |
| 5-Person Households | 8 (2.2%) | 0 (0.0%) |
| 6-Person Households | 12 (3.3%) | 0 (0.0%) |
| 7+ Person Households | 0 (0.0%) | 0 (0.0%) |
| Total | 198 (53.9%) | 169 (46.1%) |
Female Fertility in Prentiss
Fertility by Age in Prentiss
| Age Bracket | Women with Births | Births / 1,000 Women |
| 15 to 19 years | 0 (0.0%) | 0.0 |
| 20 to 34 years | 0 (0.0%) | 0.0 |
| 35 to 50 years | 0 (0.0%) | 0.0 |
| Total | 0 (0.0%) | 0.0 |
Fertility by Age by Marriage Status in Prentiss
| Age Bracket | Married | Unmarried |
| 15 to 19 years | 0 (0.0%) | 0 (0.0%) |
| 20 to 34 years | 0 (0.0%) | 0 (0.0%) |
| 35 to 50 years | 0 (0.0%) | 0 (0.0%) |
| Total | 0 (0.0%) | 0 (0.0%) |
Fertility by Education in Prentiss
| Educational Attainment | Women with Births | Births / 1,000 Women |
| Less than High School | 0 (0.0%) | 0.0 |
| High School Diploma | 0 (0.0%) | 0.0 |
| College or Associate's Degree | 0 (0.0%) | 0.0 |
| Bachelor's Degree | 0 (0.0%) | 0.0 |
| Graduate Degree | 0 (0.0%) | 0.0 |
| Total | 0 (0.0%) | 0.0 |
Fertility by Education by Marriage Status in Prentiss
| Educational Attainment | Married | Unmarried |
| Less than High School | 0 (0.0%) | 0 (0.0%) |
| High School Diploma | 0 (0.0%) | 0 (0.0%) |
| College or Associate's Degree | 0 (0.0%) | 0 (0.0%) |
| Bachelor's Degree | 0 (0.0%) | 0 (0.0%) |
| Graduate Degree | 0 (0.0%) | 0 (0.0%) |
| Total | 0 (0.0%) | 0 (0.0%) |
Employment Characteristics in Prentiss
Employment by Class of Employer in Prentiss
Among the 225 employed individuals in Prentiss, private company employees (145 | 64.4%), state government employees (51 | 22.7%), and self-employed (not incorporated) (14 | 6.2%) make up the most common classes of employment.
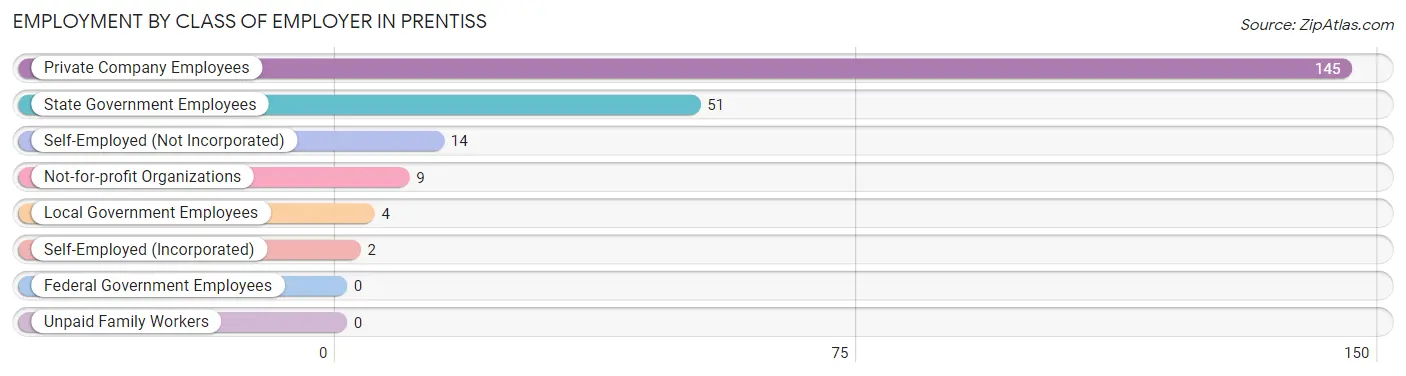
| Employer Class | # Employees | % Employees |
| Private Company Employees | 145 | 64.4% |
| Self-Employed (Incorporated) | 2 | 0.9% |
| Self-Employed (Not Incorporated) | 14 | 6.2% |
| Not-for-profit Organizations | 9 | 4.0% |
| Local Government Employees | 4 | 1.8% |
| State Government Employees | 51 | 22.7% |
| Federal Government Employees | 0 | 0.0% |
| Unpaid Family Workers | 0 | 0.0% |
| Total | 225 | 100.0% |
Employment Status by Age in Prentiss
According to the labor force statistics for Prentiss, out of the total population over 16 years of age (790), 31.3% or 247 individuals are in the labor force, with 6.1% or 15 of them unemployed. The age group with the highest labor force participation rate is 25 to 29 years, with 76.7% or 23 individuals in the labor force. Within the labor force, the 75 years and over age range has the highest percentage of unemployed individuals, with 100.0% or 8 of them being unemployed.
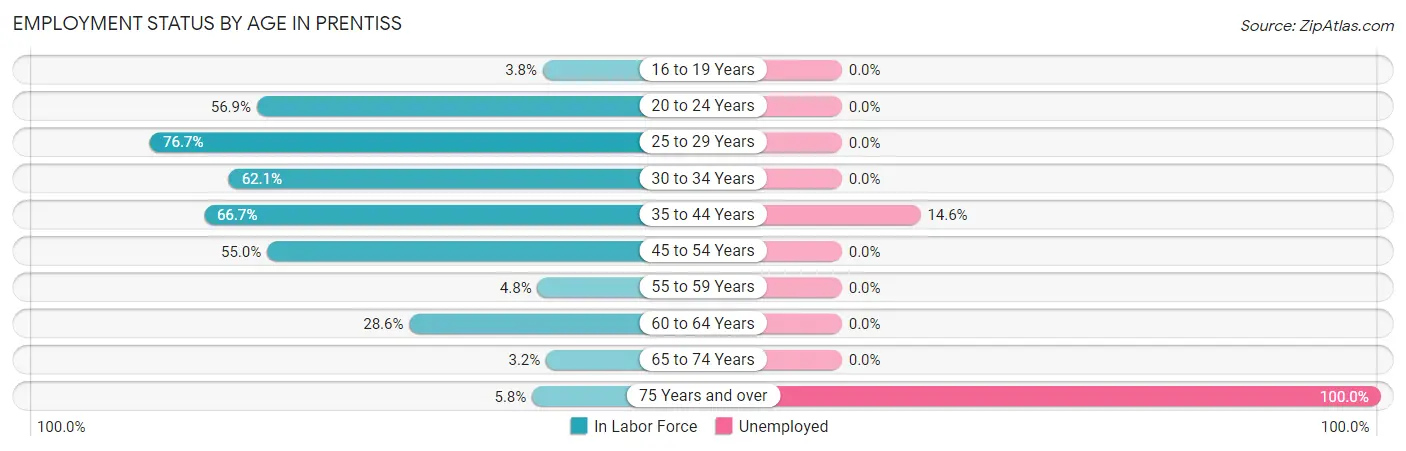
| Age Bracket | In Labor Force | Unemployed |
| 16 to 19 Years | 2 (3.8%) | 0 (0.0%) |
| 20 to 24 Years | 37 (56.9%) | 0 (0.0%) |
| 25 to 29 Years | 23 (76.7%) | 0 (0.0%) |
| 30 to 34 Years | 18 (62.1%) | 0 (0.0%) |
| 35 to 44 Years | 48 (66.7%) | 7 (14.6%) |
| 45 to 54 Years | 88 (55.0%) | 0 (0.0%) |
| 55 to 59 Years | 3 (4.8%) | 0 (0.0%) |
| 60 to 64 Years | 16 (28.6%) | 0 (0.0%) |
| 65 to 74 Years | 4 (3.2%) | 0 (0.0%) |
| 75 Years and over | 8 (5.8%) | 8 (100.0%) |
| Total | 247 (31.3%) | 15 (6.1%) |
Employment Status by Educational Attainment in Prentiss
According to labor force statistics for Prentiss, 47.9% of individuals (196) out of the total population between 25 and 64 years of age (409) are in the labor force, with 3.6% or 7 of them being unemployed. The group with the highest labor force participation rate are those with the educational attainment of college / associate degree, with 68.9% or 91 individuals in the labor force. Within the labor force, individuals with high school diploma education have the highest percentage of unemployment, with 9.1% or 3 of them being unemployed.
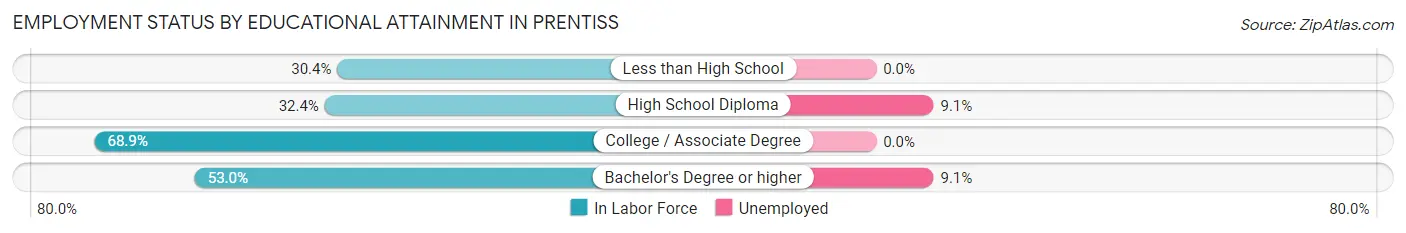
| Educational Attainment | In Labor Force | Unemployed |
| Less than High School | 28 (30.4%) | 0 (0.0%) |
| High School Diploma | 33 (32.4%) | 9 (9.1%) |
| College / Associate Degree | 91 (68.9%) | 0 (0.0%) |
| Bachelor's Degree or higher | 44 (53.0%) | 8 (9.1%) |
| Total | 196 (47.9%) | 15 (3.6%) |
Employment Occupations by Sex in Prentiss
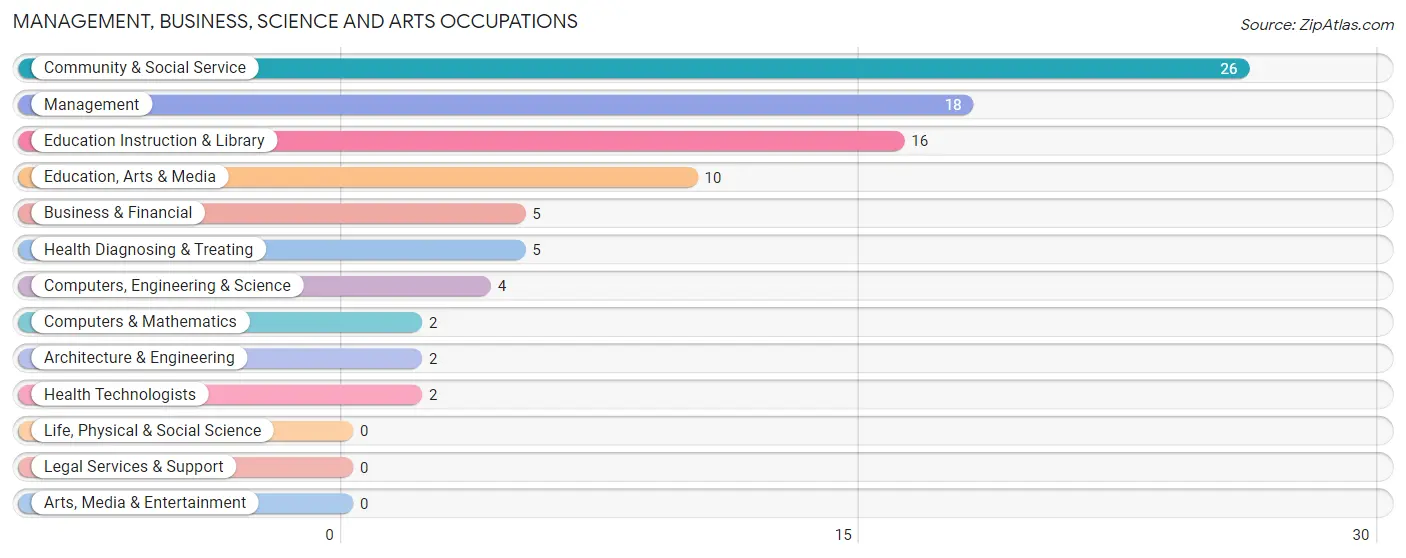
Management, Business, Science and Arts Occupations
The most common Management, Business, Science and Arts occupations in Prentiss are Community & Social Service (26 | 11.2%), Management (18 | 7.8%), Education Instruction & Library (16 | 6.9%), Education, Arts & Media (10 | 4.3%), and Business & Financial (5 | 2.2%).
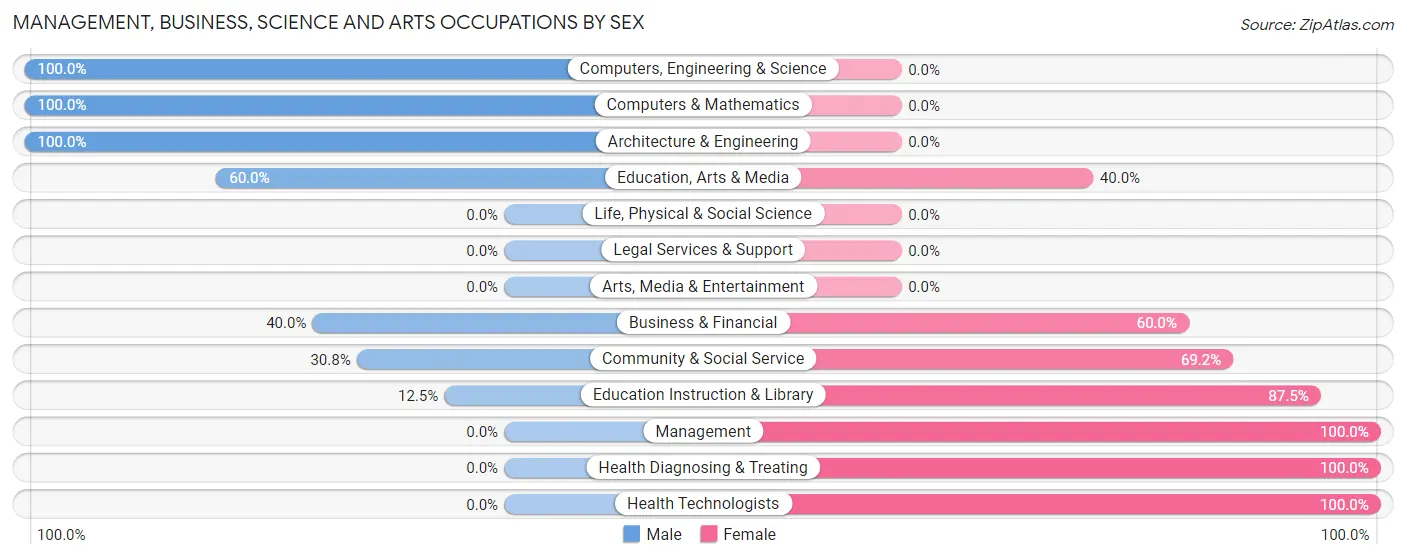
Management, Business, Science and Arts Occupations by Sex
Within the Management, Business, Science and Arts occupations in Prentiss, the most male-oriented occupations are Computers, Engineering & Science (100.0%), Computers & Mathematics (100.0%), and Architecture & Engineering (100.0%), while the most female-oriented occupations are Management (100.0%), Health Diagnosing & Treating (100.0%), and Health Technologists (100.0%).
| Occupation | Male | Female |
| Management | 0 (0.0%) | 18 (100.0%) |
| Business & Financial | 2 (40.0%) | 3 (60.0%) |
| Computers, Engineering & Science | 4 (100.0%) | 0 (0.0%) |
| Computers & Mathematics | 2 (100.0%) | 0 (0.0%) |
| Architecture & Engineering | 2 (100.0%) | 0 (0.0%) |
| Life, Physical & Social Science | 0 (0.0%) | 0 (0.0%) |
| Community & Social Service | 8 (30.8%) | 18 (69.2%) |
| Education, Arts & Media | 6 (60.0%) | 4 (40.0%) |
| Legal Services & Support | 0 (0.0%) | 0 (0.0%) |
| Education Instruction & Library | 2 (12.5%) | 14 (87.5%) |
| Arts, Media & Entertainment | 0 (0.0%) | 0 (0.0%) |
| Health Diagnosing & Treating | 0 (0.0%) | 5 (100.0%) |
| Health Technologists | 0 (0.0%) | 2 (100.0%) |
| Total (Category) | 14 (24.1%) | 44 (75.9%) |
| Total (Overall) | 104 (44.8%) | 128 (55.2%) |
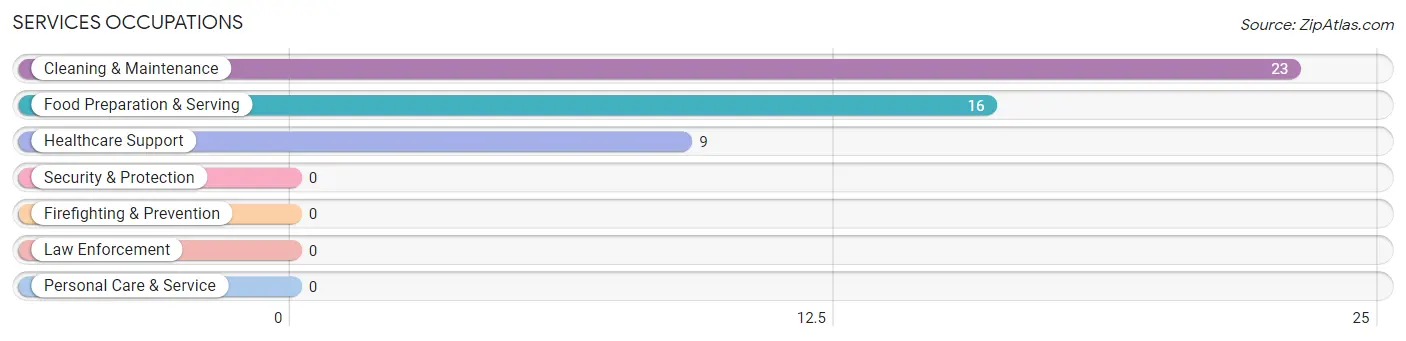
Services Occupations
The most common Services occupations in Prentiss are Cleaning & Maintenance (23 | 9.9%), Food Preparation & Serving (16 | 6.9%), and Healthcare Support (9 | 3.9%).
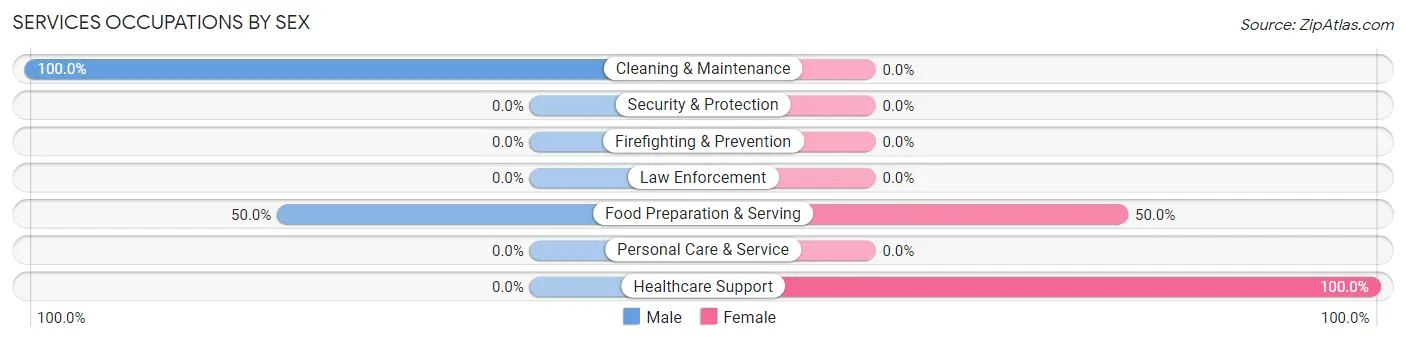
Services Occupations by Sex
Within the Services occupations in Prentiss, the most male-oriented occupations are Cleaning & Maintenance (100.0%), and Food Preparation & Serving (50.0%), while the most female-oriented occupations are Healthcare Support (100.0%), and Food Preparation & Serving (50.0%).
| Occupation | Male | Female |
| Healthcare Support | 0 (0.0%) | 9 (100.0%) |
| Security & Protection | 0 (0.0%) | 0 (0.0%) |
| Firefighting & Prevention | 0 (0.0%) | 0 (0.0%) |
| Law Enforcement | 0 (0.0%) | 0 (0.0%) |
| Food Preparation & Serving | 8 (50.0%) | 8 (50.0%) |
| Cleaning & Maintenance | 23 (100.0%) | 0 (0.0%) |
| Personal Care & Service | 0 (0.0%) | 0 (0.0%) |
| Total (Category) | 31 (64.6%) | 17 (35.4%) |
| Total (Overall) | 104 (44.8%) | 128 (55.2%) |
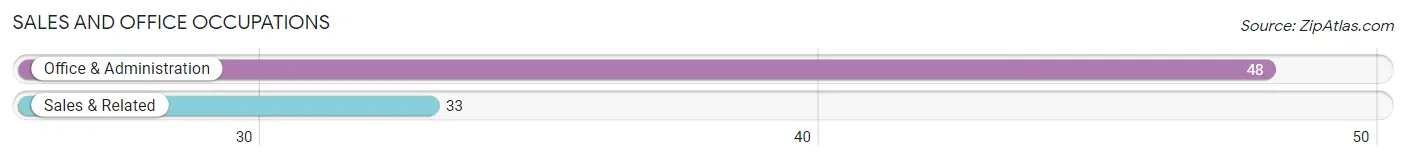
Sales and Office Occupations
The most common Sales and Office occupations in Prentiss are Office & Administration (48 | 20.7%), and Sales & Related (33 | 14.2%).
Sales and Office Occupations by Sex
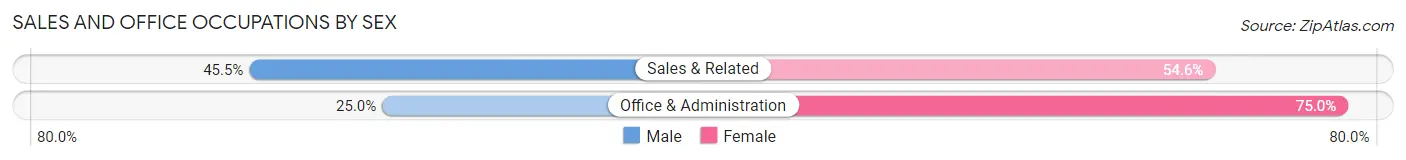
| Occupation | Male | Female |
| Sales & Related | 15 (45.5%) | 18 (54.5%) |
| Office & Administration | 12 (25.0%) | 36 (75.0%) |
| Total (Category) | 27 (33.3%) | 54 (66.7%) |
| Total (Overall) | 104 (44.8%) | 128 (55.2%) |
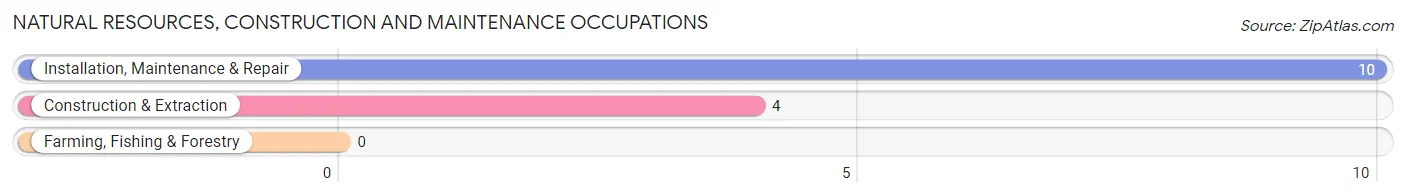
Natural Resources, Construction and Maintenance Occupations
The most common Natural Resources, Construction and Maintenance occupations in Prentiss are Installation, Maintenance & Repair (10 | 4.3%), and Construction & Extraction (4 | 1.7%).
Natural Resources, Construction and Maintenance Occupations by Sex
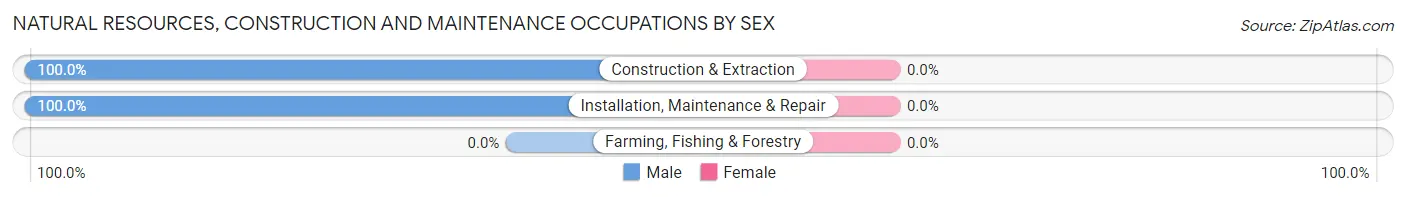
| Occupation | Male | Female |
| Farming, Fishing & Forestry | 0 (0.0%) | 0 (0.0%) |
| Construction & Extraction | 4 (100.0%) | 0 (0.0%) |
| Installation, Maintenance & Repair | 10 (100.0%) | 0 (0.0%) |
| Total (Category) | 14 (100.0%) | 0 (0.0%) |
| Total (Overall) | 104 (44.8%) | 128 (55.2%) |
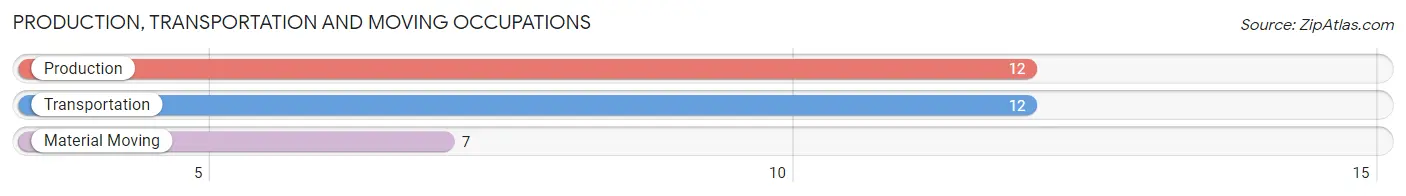
Production, Transportation and Moving Occupations
The most common Production, Transportation and Moving occupations in Prentiss are Production (12 | 5.2%), Transportation (12 | 5.2%), and Material Moving (7 | 3.0%).
Production, Transportation and Moving Occupations by Sex
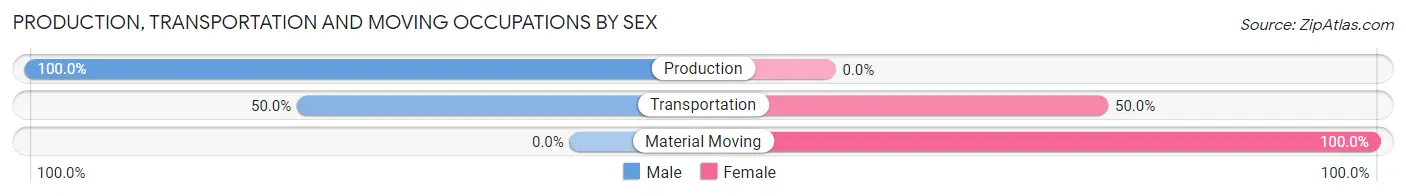
| Occupation | Male | Female |
| Production | 12 (100.0%) | 0 (0.0%) |
| Transportation | 6 (50.0%) | 6 (50.0%) |
| Material Moving | 0 (0.0%) | 7 (100.0%) |
| Total (Category) | 18 (58.1%) | 13 (41.9%) |
| Total (Overall) | 104 (44.8%) | 128 (55.2%) |
Employment Industries by Sex in Prentiss
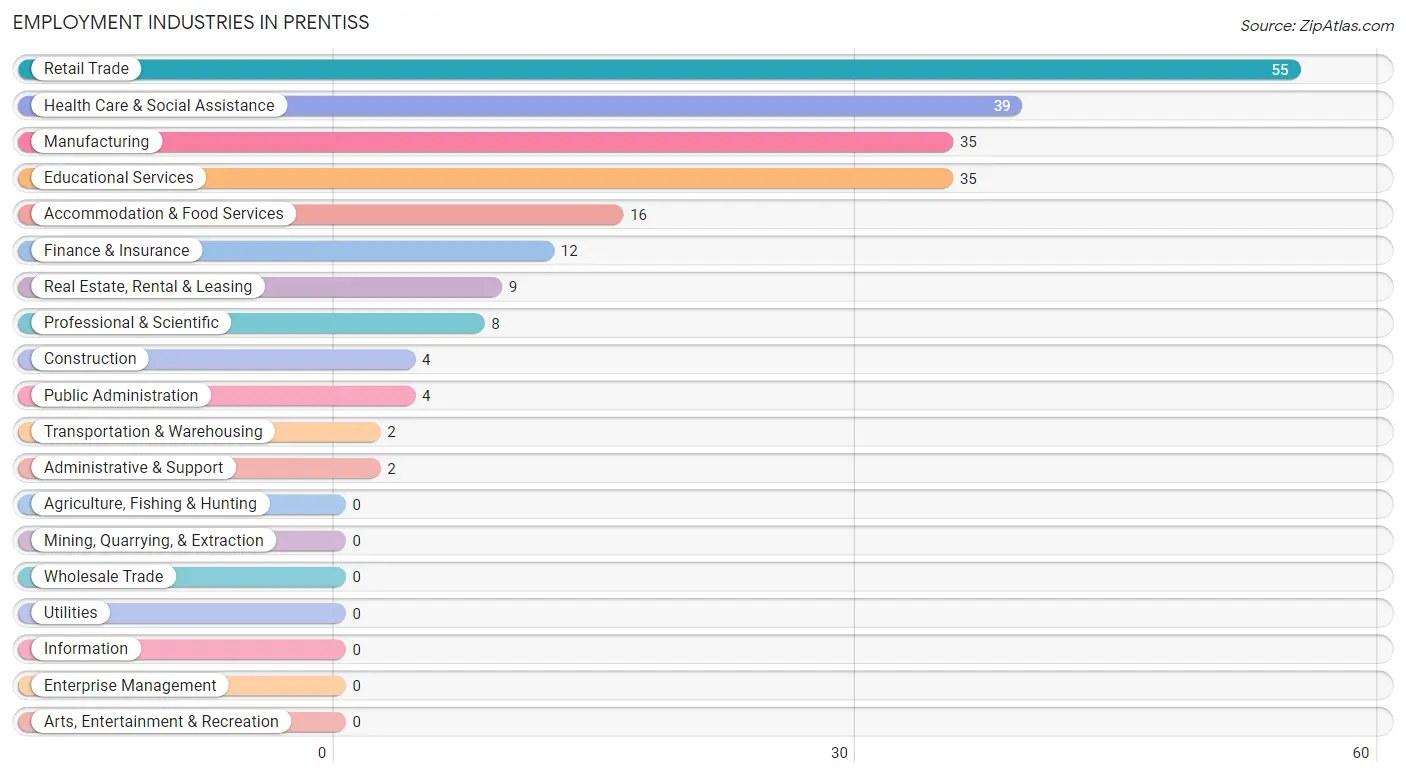
Employment Industries in Prentiss
The major employment industries in Prentiss include Retail Trade (55 | 23.7%), Health Care & Social Assistance (39 | 16.8%), Manufacturing (35 | 15.1%), Educational Services (35 | 15.1%), and Accommodation & Food Services (16 | 6.9%).
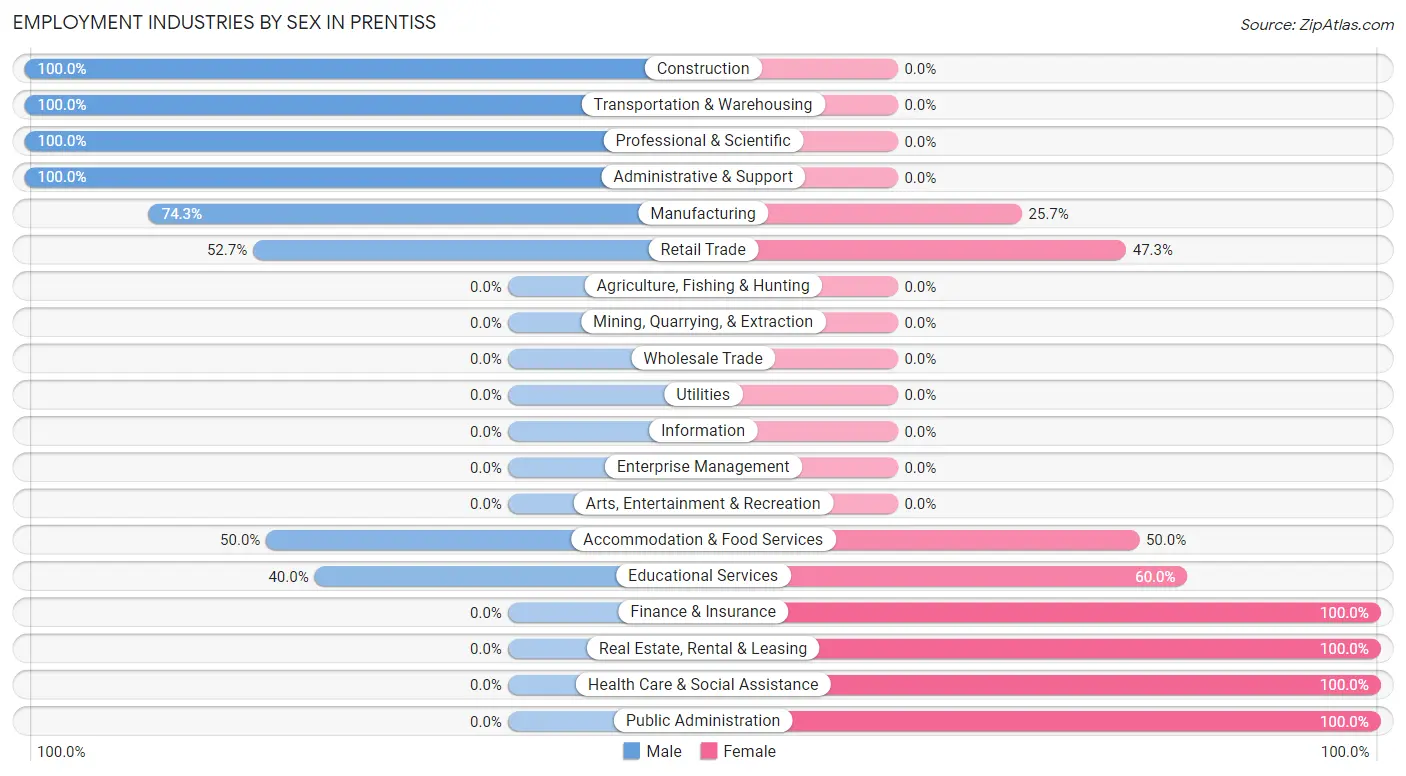
Employment Industries by Sex in Prentiss
The Prentiss industries that see more men than women are Construction (100.0%), Transportation & Warehousing (100.0%), and Professional & Scientific (100.0%), whereas the industries that tend to have a higher number of women are Finance & Insurance (100.0%), Real Estate, Rental & Leasing (100.0%), and Health Care & Social Assistance (100.0%).
| Industry | Male | Female |
| Agriculture, Fishing & Hunting | 0 (0.0%) | 0 (0.0%) |
| Mining, Quarrying, & Extraction | 0 (0.0%) | 0 (0.0%) |
| Construction | 4 (100.0%) | 0 (0.0%) |
| Manufacturing | 26 (74.3%) | 9 (25.7%) |
| Wholesale Trade | 0 (0.0%) | 0 (0.0%) |
| Retail Trade | 29 (52.7%) | 26 (47.3%) |
| Transportation & Warehousing | 2 (100.0%) | 0 (0.0%) |
| Utilities | 0 (0.0%) | 0 (0.0%) |
| Information | 0 (0.0%) | 0 (0.0%) |
| Finance & Insurance | 0 (0.0%) | 12 (100.0%) |
| Real Estate, Rental & Leasing | 0 (0.0%) | 9 (100.0%) |
| Professional & Scientific | 8 (100.0%) | 0 (0.0%) |
| Enterprise Management | 0 (0.0%) | 0 (0.0%) |
| Administrative & Support | 2 (100.0%) | 0 (0.0%) |
| Educational Services | 14 (40.0%) | 21 (60.0%) |
| Health Care & Social Assistance | 0 (0.0%) | 39 (100.0%) |
| Arts, Entertainment & Recreation | 0 (0.0%) | 0 (0.0%) |
| Accommodation & Food Services | 8 (50.0%) | 8 (50.0%) |
| Public Administration | 0 (0.0%) | 4 (100.0%) |
| Total | 104 (44.8%) | 128 (55.2%) |
Education in Prentiss
School Enrollment in Prentiss
The most common levels of schooling among the 153 students in Prentiss are high school (62 | 40.5%), elementary school (47 | 30.7%), and middle school (21 | 13.7%).
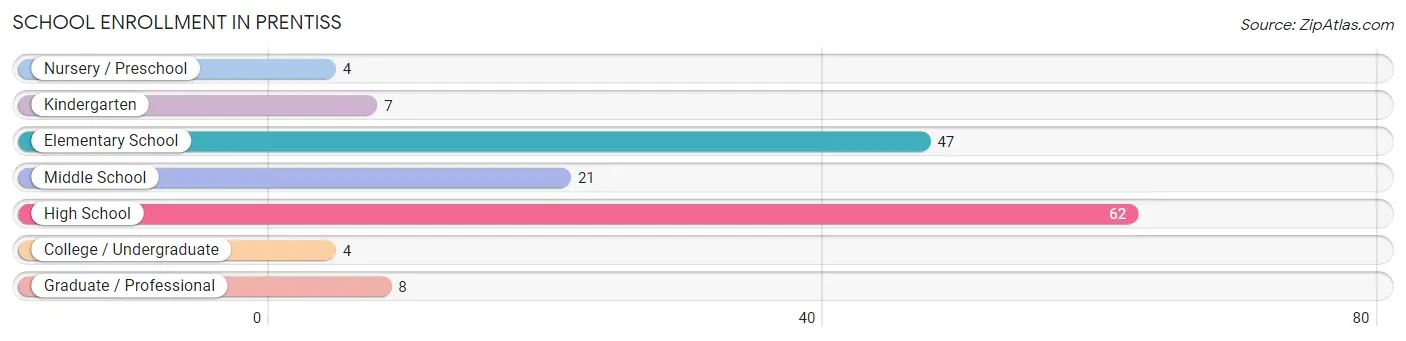
| School Level | # Students | % Students |
| Nursery / Preschool | 4 | 2.6% |
| Kindergarten | 7 | 4.6% |
| Elementary School | 47 | 30.7% |
| Middle School | 21 | 13.7% |
| High School | 62 | 40.5% |
| College / Undergraduate | 4 | 2.6% |
| Graduate / Professional | 8 | 5.2% |
| Total | 153 | 100.0% |
School Enrollment by Age by Funding Source in Prentiss
Out of a total of 153 students who are enrolled in schools in Prentiss, 53 (34.6%) attend a private institution, while the remaining 100 (65.4%) are enrolled in public schools. The age group of 18 to 19 year olds has the highest likelihood of being enrolled in private schools, with 17 (100.0% in the age bracket) enrolled. Conversely, the age group of 5 to 9 year old has the lowest likelihood of being enrolled in a private school, with 42 (82.4% in the age bracket) attending a public institution.
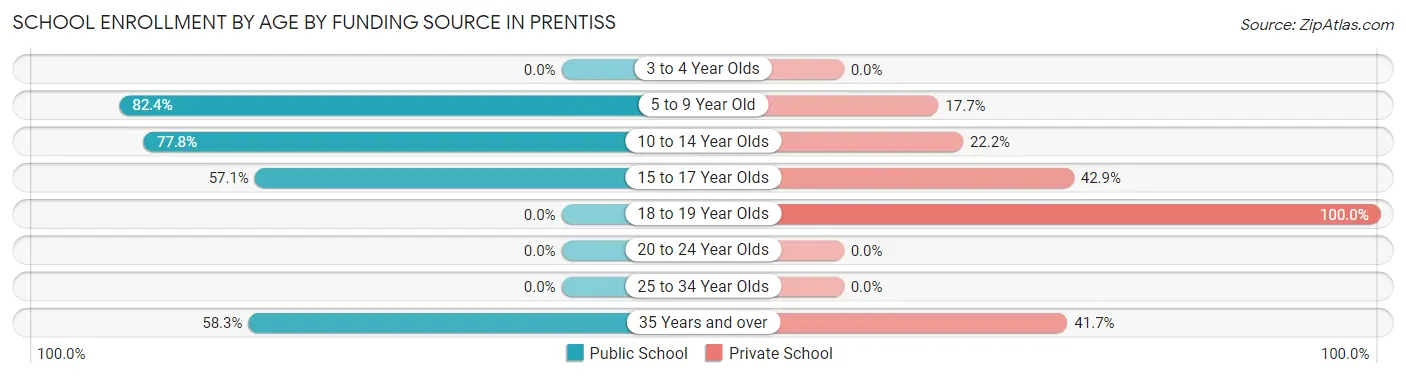
| Age Bracket | Public School | Private School |
| 3 to 4 Year Olds | 0 (0.0%) | 0 (0.0%) |
| 5 to 9 Year Old | 42 (82.4%) | 9 (17.6%) |
| 10 to 14 Year Olds | 35 (77.8%) | 10 (22.2%) |
| 15 to 17 Year Olds | 16 (57.1%) | 12 (42.9%) |
| 18 to 19 Year Olds | 0 (0.0%) | 17 (100.0%) |
| 20 to 24 Year Olds | 0 (0.0%) | 0 (0.0%) |
| 25 to 34 Year Olds | 0 (0.0%) | 0 (0.0%) |
| 35 Years and over | 7 (58.3%) | 5 (41.7%) |
| Total | 100 (65.4%) | 53 (34.6%) |
Educational Attainment by Field of Study in Prentiss
Science & technology (45 | 42.9%), education (31 | 29.5%), psychology (12 | 11.4%), business (5 | 4.8%), and arts & humanities (5 | 4.8%) are the most common fields of study among 105 individuals in Prentiss who have obtained a bachelor's degree or higher.
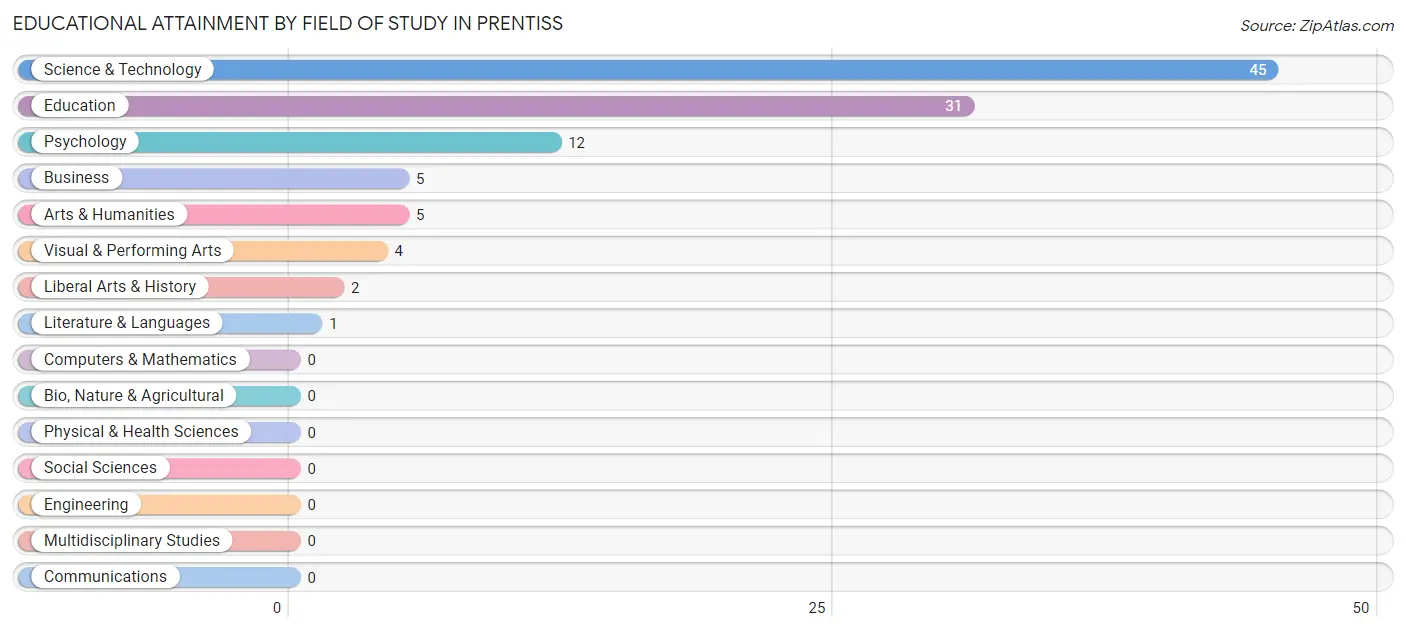
| Field of Study | # Graduates | % Graduates |
| Computers & Mathematics | 0 | 0.0% |
| Bio, Nature & Agricultural | 0 | 0.0% |
| Physical & Health Sciences | 0 | 0.0% |
| Psychology | 12 | 11.4% |
| Social Sciences | 0 | 0.0% |
| Engineering | 0 | 0.0% |
| Multidisciplinary Studies | 0 | 0.0% |
| Science & Technology | 45 | 42.9% |
| Business | 5 | 4.8% |
| Education | 31 | 29.5% |
| Literature & Languages | 1 | 0.9% |
| Liberal Arts & History | 2 | 1.9% |
| Visual & Performing Arts | 4 | 3.8% |
| Communications | 0 | 0.0% |
| Arts & Humanities | 5 | 4.8% |
| Total | 105 | 100.0% |
Transportation & Commute in Prentiss
Vehicle Availability by Sex in Prentiss
The most prevalent vehicle ownership categories in Prentiss are males with 2 vehicles (47, accounting for 46.1%) and females with 2 vehicles (29, making up 38.5%).
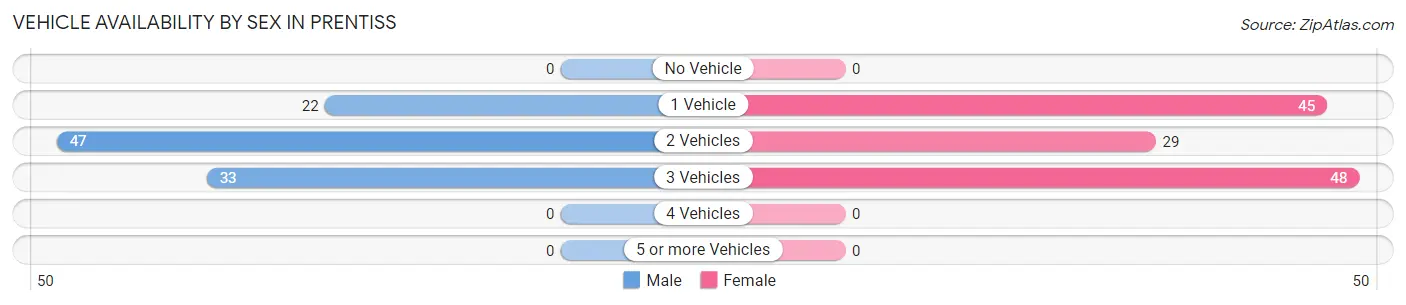
| Vehicles Available | Male | Female |
| No Vehicle | 0 (0.0%) | 0 (0.0%) |
| 1 Vehicle | 22 (21.6%) | 45 (36.9%) |
| 2 Vehicles | 47 (46.1%) | 29 (23.8%) |
| 3 Vehicles | 33 (32.4%) | 48 (39.3%) |
| 4 Vehicles | 0 (0.0%) | 0 (0.0%) |
| 5 or more Vehicles | 0 (0.0%) | 0 (0.0%) |
| Total | 102 (100.0%) | 122 (100.0%) |
Commute Time in Prentiss
The most frequently occuring commute durations in Prentiss are 45 to 59 minutes (50 commuters, 22.2%), 5 to 9 minutes (46 commuters, 20.4%), and 60 to 89 minutes (46 commuters, 20.4%).
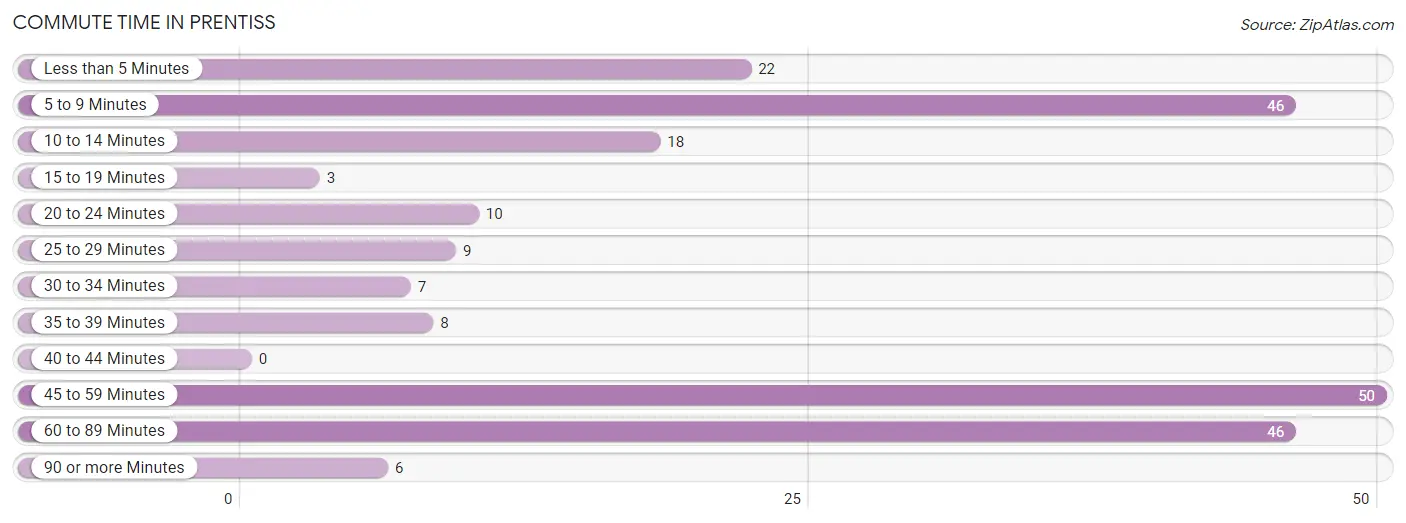
| Commute Time | # Commuters | % Commuters |
| Less than 5 Minutes | 22 | 9.8% |
| 5 to 9 Minutes | 46 | 20.4% |
| 10 to 14 Minutes | 18 | 8.0% |
| 15 to 19 Minutes | 3 | 1.3% |
| 20 to 24 Minutes | 10 | 4.4% |
| 25 to 29 Minutes | 9 | 4.0% |
| 30 to 34 Minutes | 7 | 3.1% |
| 35 to 39 Minutes | 8 | 3.6% |
| 40 to 44 Minutes | 0 | 0.0% |
| 45 to 59 Minutes | 50 | 22.2% |
| 60 to 89 Minutes | 46 | 20.4% |
| 90 or more Minutes | 6 | 2.7% |
Commute Time by Sex in Prentiss
The most common commute times in Prentiss are 60 to 89 minutes (29 commuters, 28.4%) for males and 5 to 9 minutes (40 commuters, 32.5%) for females.
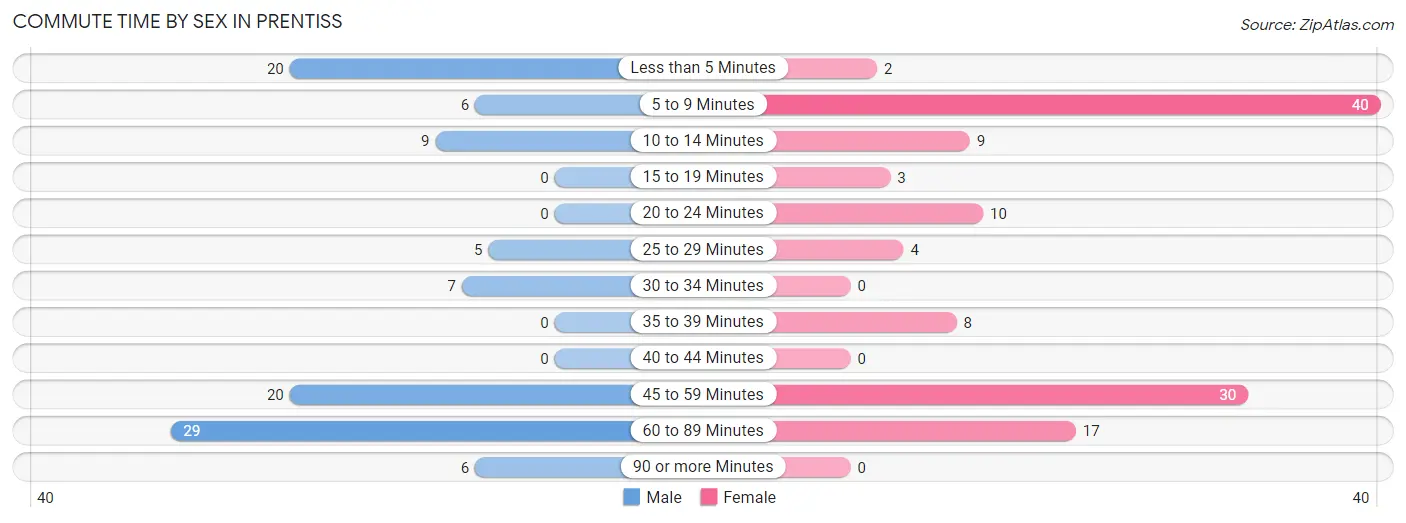
| Commute Time | Male | Female |
| Less than 5 Minutes | 20 (19.6%) | 2 (1.6%) |
| 5 to 9 Minutes | 6 (5.9%) | 40 (32.5%) |
| 10 to 14 Minutes | 9 (8.8%) | 9 (7.3%) |
| 15 to 19 Minutes | 0 (0.0%) | 3 (2.4%) |
| 20 to 24 Minutes | 0 (0.0%) | 10 (8.1%) |
| 25 to 29 Minutes | 5 (4.9%) | 4 (3.3%) |
| 30 to 34 Minutes | 7 (6.9%) | 0 (0.0%) |
| 35 to 39 Minutes | 0 (0.0%) | 8 (6.5%) |
| 40 to 44 Minutes | 0 (0.0%) | 0 (0.0%) |
| 45 to 59 Minutes | 20 (19.6%) | 30 (24.4%) |
| 60 to 89 Minutes | 29 (28.4%) | 17 (13.8%) |
| 90 or more Minutes | 6 (5.9%) | 0 (0.0%) |
Time of Departure to Work by Sex in Prentiss
The most frequent times of departure to work in Prentiss are 5:00 AM to 5:29 AM (21, 20.6%) for males and 7:30 AM to 7:59 AM (39, 31.7%) for females.
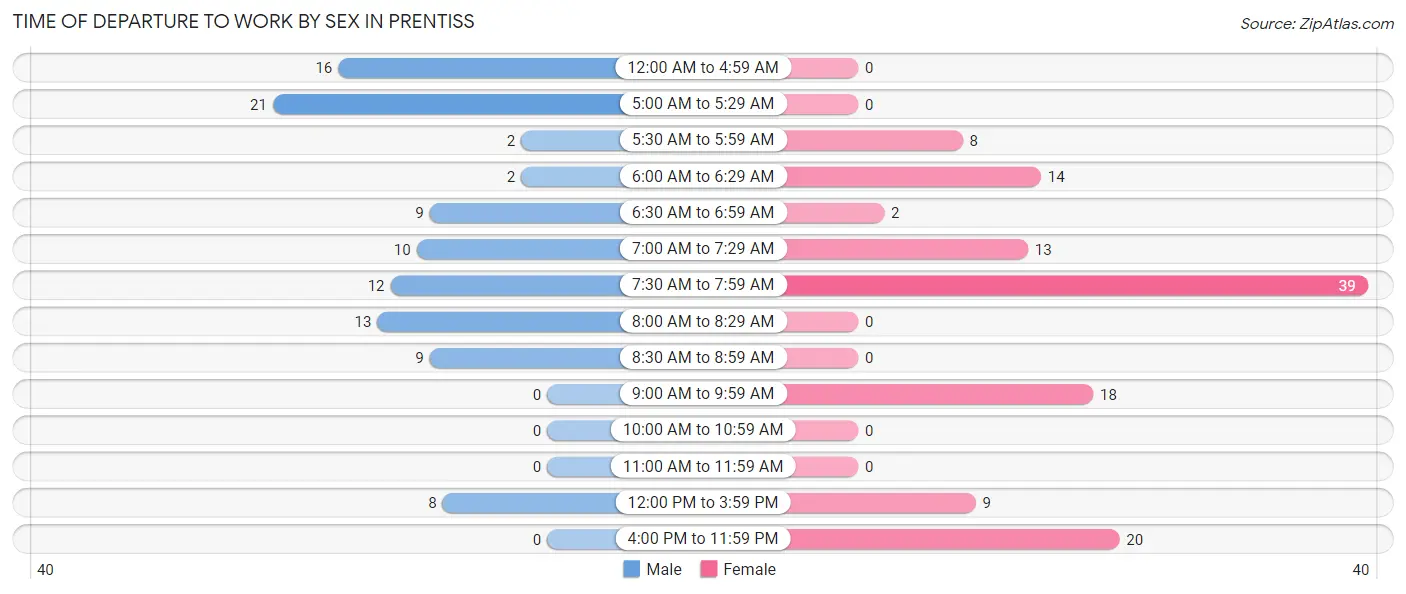
| Time of Departure | Male | Female |
| 12:00 AM to 4:59 AM | 16 (15.7%) | 0 (0.0%) |
| 5:00 AM to 5:29 AM | 21 (20.6%) | 0 (0.0%) |
| 5:30 AM to 5:59 AM | 2 (2.0%) | 8 (6.5%) |
| 6:00 AM to 6:29 AM | 2 (2.0%) | 14 (11.4%) |
| 6:30 AM to 6:59 AM | 9 (8.8%) | 2 (1.6%) |
| 7:00 AM to 7:29 AM | 10 (9.8%) | 13 (10.6%) |
| 7:30 AM to 7:59 AM | 12 (11.8%) | 39 (31.7%) |
| 8:00 AM to 8:29 AM | 13 (12.8%) | 0 (0.0%) |
| 8:30 AM to 8:59 AM | 9 (8.8%) | 0 (0.0%) |
| 9:00 AM to 9:59 AM | 0 (0.0%) | 18 (14.6%) |
| 10:00 AM to 10:59 AM | 0 (0.0%) | 0 (0.0%) |
| 11:00 AM to 11:59 AM | 0 (0.0%) | 0 (0.0%) |
| 12:00 PM to 3:59 PM | 8 (7.8%) | 9 (7.3%) |
| 4:00 PM to 11:59 PM | 0 (0.0%) | 20 (16.3%) |
| Total | 102 (100.0%) | 123 (100.0%) |
Housing Occupancy in Prentiss
Occupancy by Ownership in Prentiss
Of the total 367 dwellings in Prentiss, owner-occupied units account for 229 (62.4%), while renter-occupied units make up 138 (37.6%).
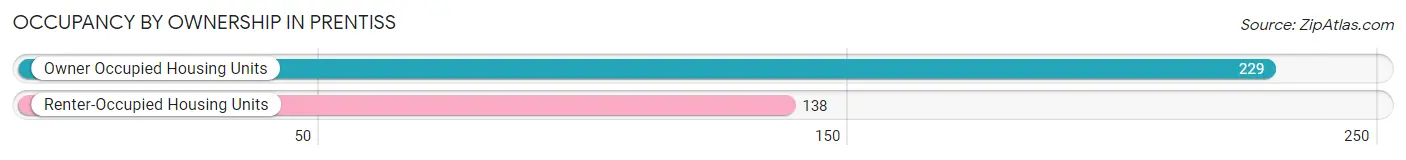
| Occupancy | # Housing Units | % Housing Units |
| Owner Occupied Housing Units | 229 | 62.4% |
| Renter-Occupied Housing Units | 138 | 37.6% |
| Total Occupied Housing Units | 367 | 100.0% |
Occupancy by Household Size in Prentiss
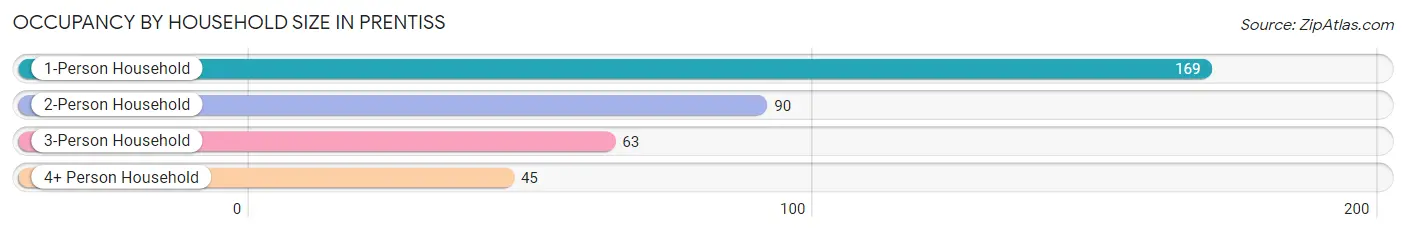
| Household Size | # Housing Units | % Housing Units |
| 1-Person Household | 169 | 46.1% |
| 2-Person Household | 90 | 24.5% |
| 3-Person Household | 63 | 17.2% |
| 4+ Person Household | 45 | 12.3% |
| Total Housing Units | 367 | 100.0% |
Occupancy by Ownership by Household Size in Prentiss
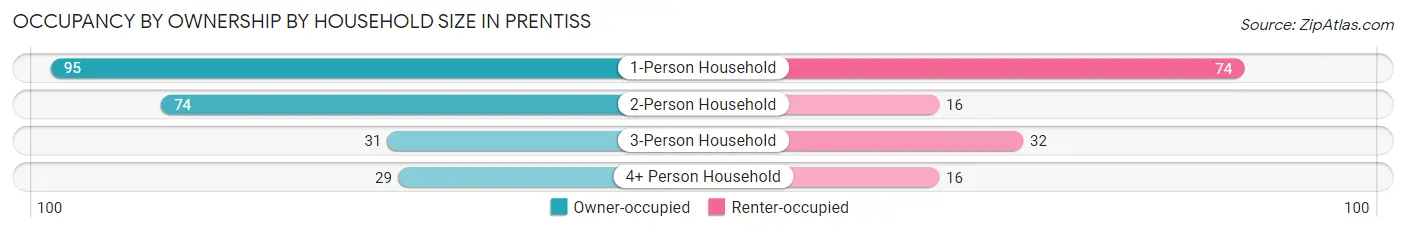
| Household Size | Owner-occupied | Renter-occupied |
| 1-Person Household | 95 (56.2%) | 74 (43.8%) |
| 2-Person Household | 74 (82.2%) | 16 (17.8%) |
| 3-Person Household | 31 (49.2%) | 32 (50.8%) |
| 4+ Person Household | 29 (64.4%) | 16 (35.6%) |
| Total Housing Units | 229 (62.4%) | 138 (37.6%) |
Occupancy by Educational Attainment in Prentiss
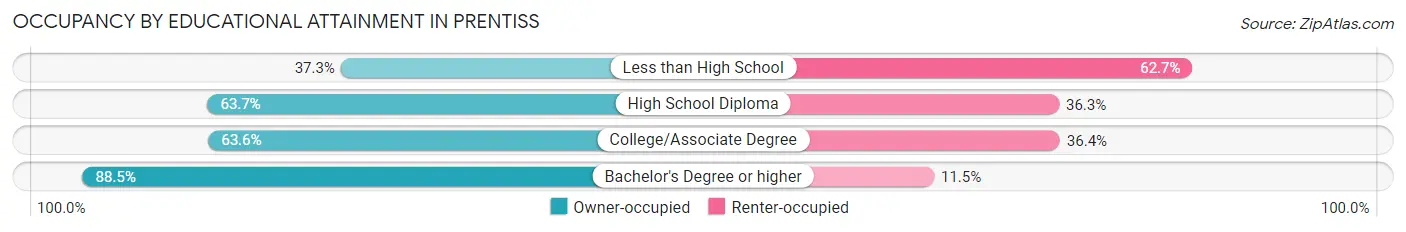
| Household Size | Owner-occupied | Renter-occupied |
| Less than High School | 28 (37.3%) | 47 (62.7%) |
| High School Diploma | 58 (63.7%) | 33 (36.3%) |
| College/Associate Degree | 89 (63.6%) | 51 (36.4%) |
| Bachelor's Degree or higher | 54 (88.5%) | 7 (11.5%) |
Occupancy by Age of Householder in Prentiss
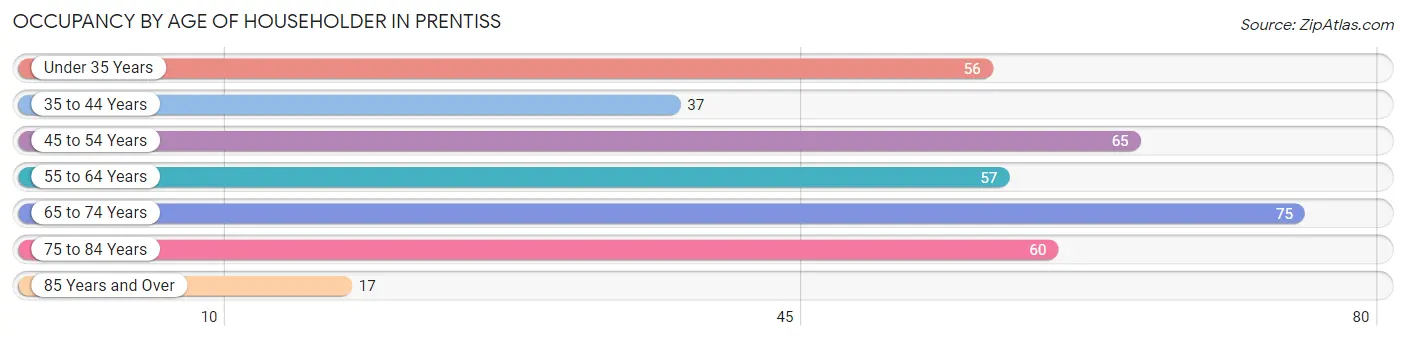
| Age Bracket | # Households | % Households |
| Under 35 Years | 56 | 15.3% |
| 35 to 44 Years | 37 | 10.1% |
| 45 to 54 Years | 65 | 17.7% |
| 55 to 64 Years | 57 | 15.5% |
| 65 to 74 Years | 75 | 20.4% |
| 75 to 84 Years | 60 | 16.4% |
| 85 Years and Over | 17 | 4.6% |
| Total | 367 | 100.0% |
Housing Finances in Prentiss
Median Income by Occupancy in Prentiss
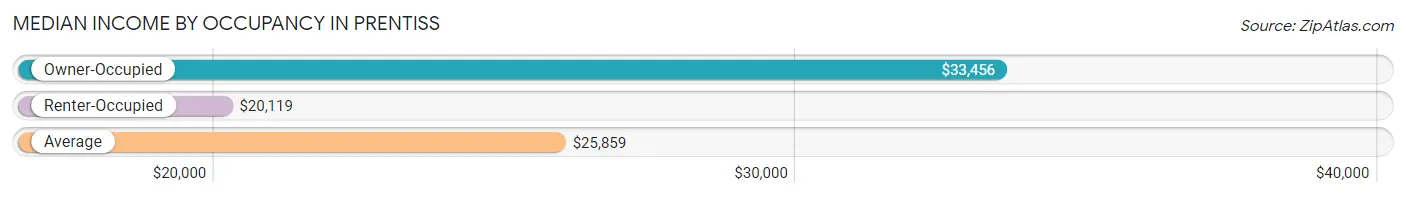
| Occupancy Type | # Households | Median Income |
| Owner-Occupied | 229 (62.4%) | $33,456 |
| Renter-Occupied | 138 (37.6%) | $20,119 |
| Average | 367 (100.0%) | $25,859 |
Occupancy by Householder Income Bracket in Prentiss
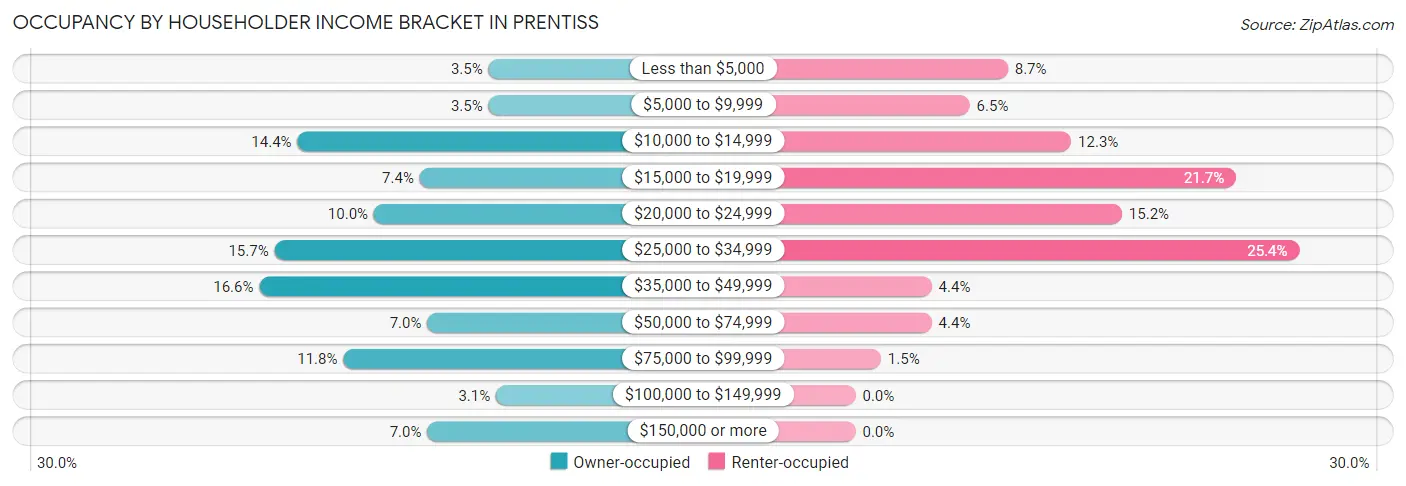
| Income Bracket | Owner-occupied | Renter-occupied |
| Less than $5,000 | 8 (3.5%) | 12 (8.7%) |
| $5,000 to $9,999 | 8 (3.5%) | 9 (6.5%) |
| $10,000 to $14,999 | 33 (14.4%) | 17 (12.3%) |
| $15,000 to $19,999 | 17 (7.4%) | 30 (21.7%) |
| $20,000 to $24,999 | 23 (10.0%) | 21 (15.2%) |
| $25,000 to $34,999 | 36 (15.7%) | 35 (25.4%) |
| $35,000 to $49,999 | 38 (16.6%) | 6 (4.3%) |
| $50,000 to $74,999 | 16 (7.0%) | 6 (4.3%) |
| $75,000 to $99,999 | 27 (11.8%) | 2 (1.5%) |
| $100,000 to $149,999 | 7 (3.1%) | 0 (0.0%) |
| $150,000 or more | 16 (7.0%) | 0 (0.0%) |
| Total | 229 (100.0%) | 138 (100.0%) |
Monthly Housing Cost Tiers in Prentiss
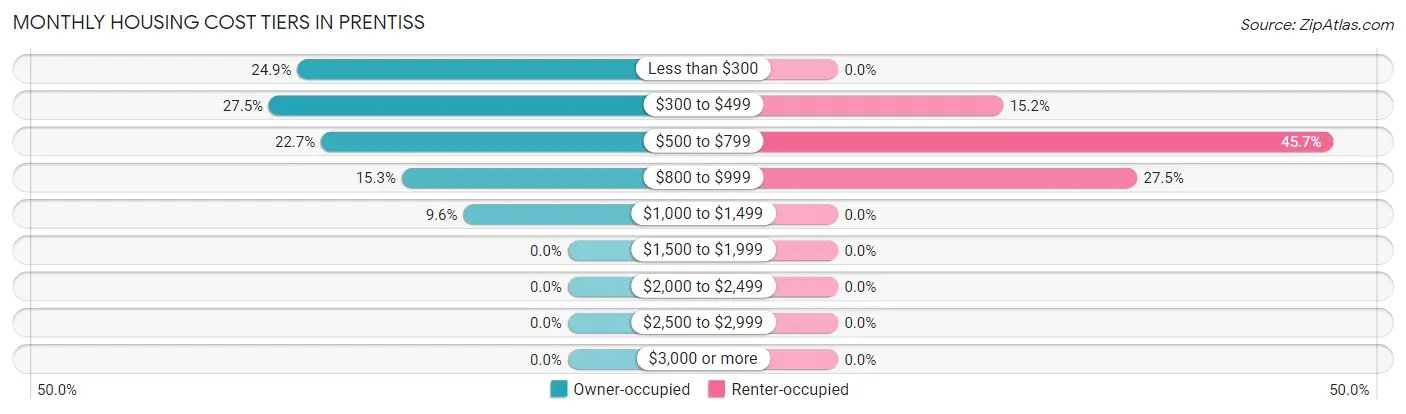
| Monthly Cost | Owner-occupied | Renter-occupied |
| Less than $300 | 57 (24.9%) | 0 (0.0%) |
| $300 to $499 | 63 (27.5%) | 21 (15.2%) |
| $500 to $799 | 52 (22.7%) | 63 (45.7%) |
| $800 to $999 | 35 (15.3%) | 38 (27.5%) |
| $1,000 to $1,499 | 22 (9.6%) | 0 (0.0%) |
| $1,500 to $1,999 | 0 (0.0%) | 0 (0.0%) |
| $2,000 to $2,499 | 0 (0.0%) | 0 (0.0%) |
| $2,500 to $2,999 | 0 (0.0%) | 0 (0.0%) |
| $3,000 or more | 0 (0.0%) | 0 (0.0%) |
| Total | 229 (100.0%) | 138 (100.0%) |
Physical Housing Characteristics in Prentiss
Housing Structures in Prentiss
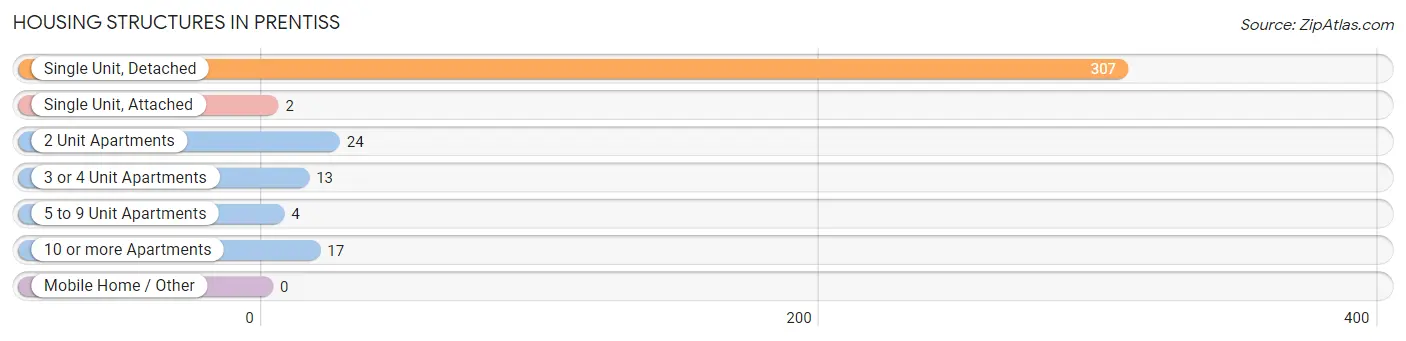
| Structure Type | # Housing Units | % Housing Units |
| Single Unit, Detached | 307 | 83.7% |
| Single Unit, Attached | 2 | 0.5% |
| 2 Unit Apartments | 24 | 6.5% |
| 3 or 4 Unit Apartments | 13 | 3.5% |
| 5 to 9 Unit Apartments | 4 | 1.1% |
| 10 or more Apartments | 17 | 4.6% |
| Mobile Home / Other | 0 | 0.0% |
| Total | 367 | 100.0% |
Housing Structures by Occupancy in Prentiss
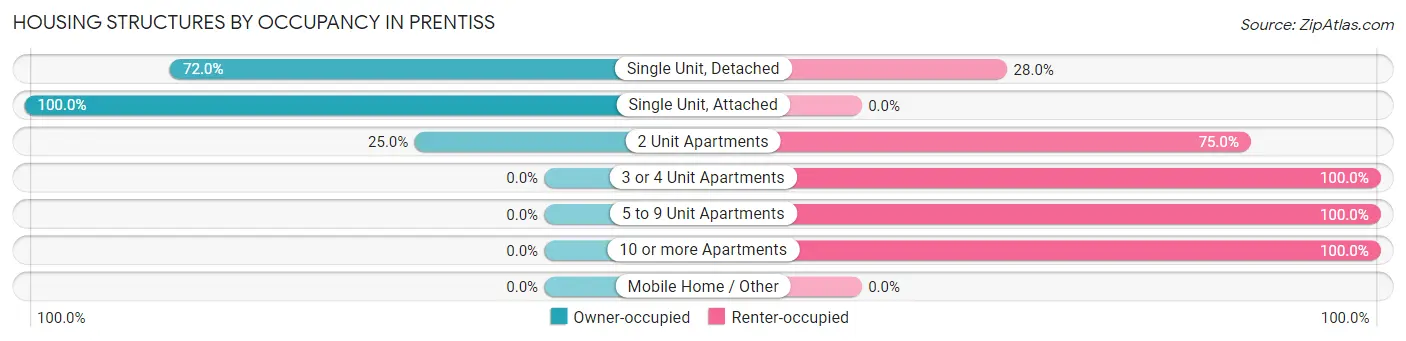
| Structure Type | Owner-occupied | Renter-occupied |
| Single Unit, Detached | 221 (72.0%) | 86 (28.0%) |
| Single Unit, Attached | 2 (100.0%) | 0 (0.0%) |
| 2 Unit Apartments | 6 (25.0%) | 18 (75.0%) |
| 3 or 4 Unit Apartments | 0 (0.0%) | 13 (100.0%) |
| 5 to 9 Unit Apartments | 0 (0.0%) | 4 (100.0%) |
| 10 or more Apartments | 0 (0.0%) | 17 (100.0%) |
| Mobile Home / Other | 0 (0.0%) | 0 (0.0%) |
| Total | 229 (62.4%) | 138 (37.6%) |
Housing Structures by Number of Rooms in Prentiss
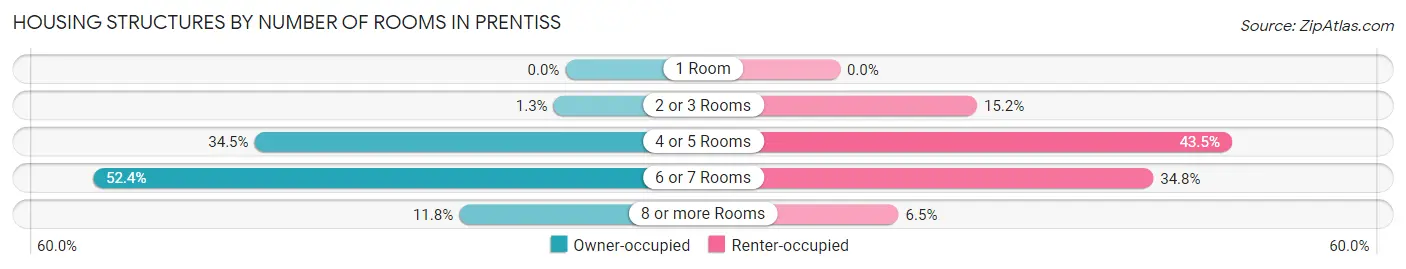
| Number of Rooms | Owner-occupied | Renter-occupied |
| 1 Room | 0 (0.0%) | 0 (0.0%) |
| 2 or 3 Rooms | 3 (1.3%) | 21 (15.2%) |
| 4 or 5 Rooms | 79 (34.5%) | 60 (43.5%) |
| 6 or 7 Rooms | 120 (52.4%) | 48 (34.8%) |
| 8 or more Rooms | 27 (11.8%) | 9 (6.5%) |
| Total | 229 (100.0%) | 138 (100.0%) |
Housing Structure by Heating Type in Prentiss
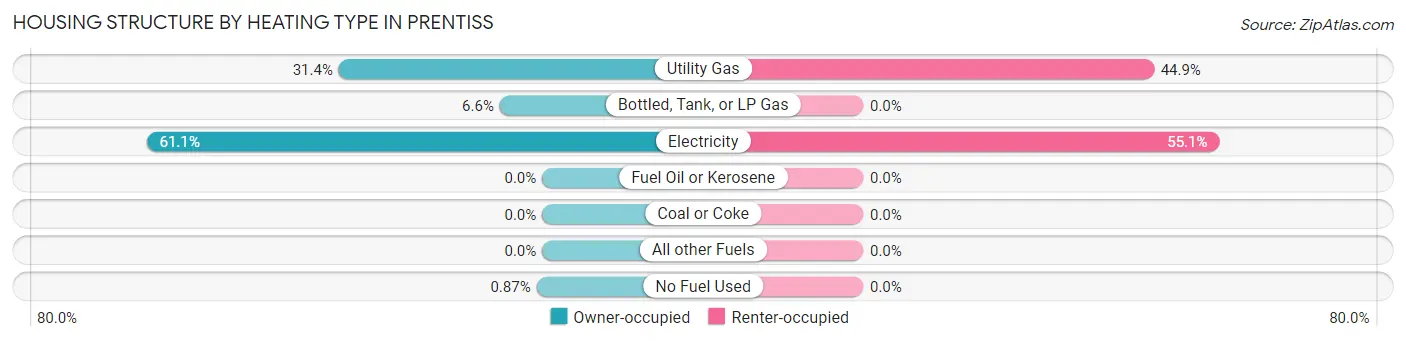
| Heating Type | Owner-occupied | Renter-occupied |
| Utility Gas | 72 (31.4%) | 62 (44.9%) |
| Bottled, Tank, or LP Gas | 15 (6.6%) | 0 (0.0%) |
| Electricity | 140 (61.1%) | 76 (55.1%) |
| Fuel Oil or Kerosene | 0 (0.0%) | 0 (0.0%) |
| Coal or Coke | 0 (0.0%) | 0 (0.0%) |
| All other Fuels | 0 (0.0%) | 0 (0.0%) |
| No Fuel Used | 2 (0.9%) | 0 (0.0%) |
| Total | 229 (100.0%) | 138 (100.0%) |
Household Vehicle Usage in Prentiss
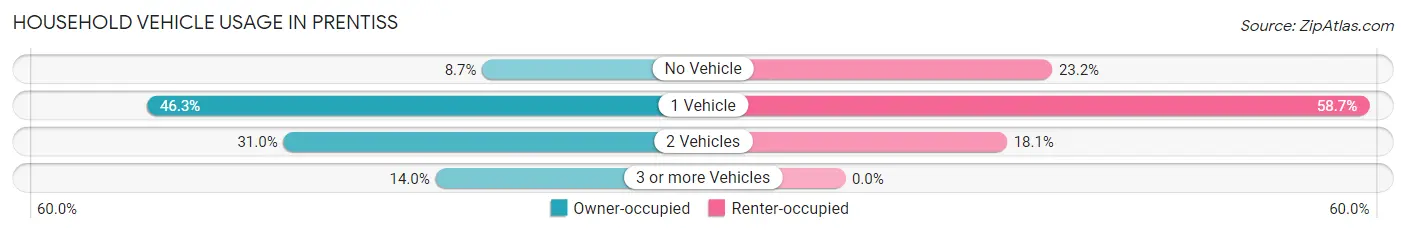
| Vehicles per Household | Owner-occupied | Renter-occupied |
| No Vehicle | 20 (8.7%) | 32 (23.2%) |
| 1 Vehicle | 106 (46.3%) | 81 (58.7%) |
| 2 Vehicles | 71 (31.0%) | 25 (18.1%) |
| 3 or more Vehicles | 32 (14.0%) | 0 (0.0%) |
| Total | 229 (100.0%) | 138 (100.0%) |
Real Estate & Mortgages in Prentiss
Real Estate and Mortgage Overview in Prentiss
| Characteristic | Without Mortgage | With Mortgage |
| Housing Units | 122 | 107 |
| Median Property Value | $86,700 | $75,200 |
| Median Household Income | $19,375 | $0 |
| Monthly Housing Costs | $333 | $0 |
| Real Estate Taxes | $827 | $38 |
Property Value by Mortgage Status in Prentiss
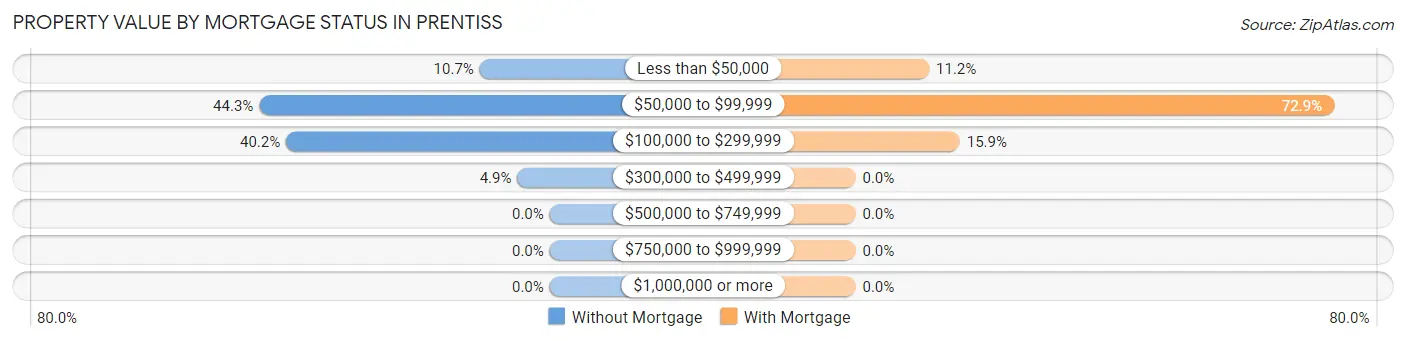
| Property Value | Without Mortgage | With Mortgage |
| Less than $50,000 | 13 (10.7%) | 12 (11.2%) |
| $50,000 to $99,999 | 54 (44.3%) | 78 (72.9%) |
| $100,000 to $299,999 | 49 (40.2%) | 17 (15.9%) |
| $300,000 to $499,999 | 6 (4.9%) | 0 (0.0%) |
| $500,000 to $749,999 | 0 (0.0%) | 0 (0.0%) |
| $750,000 to $999,999 | 0 (0.0%) | 0 (0.0%) |
| $1,000,000 or more | 0 (0.0%) | 0 (0.0%) |
| Total | 122 (100.0%) | 107 (100.0%) |
Household Income by Mortgage Status in Prentiss
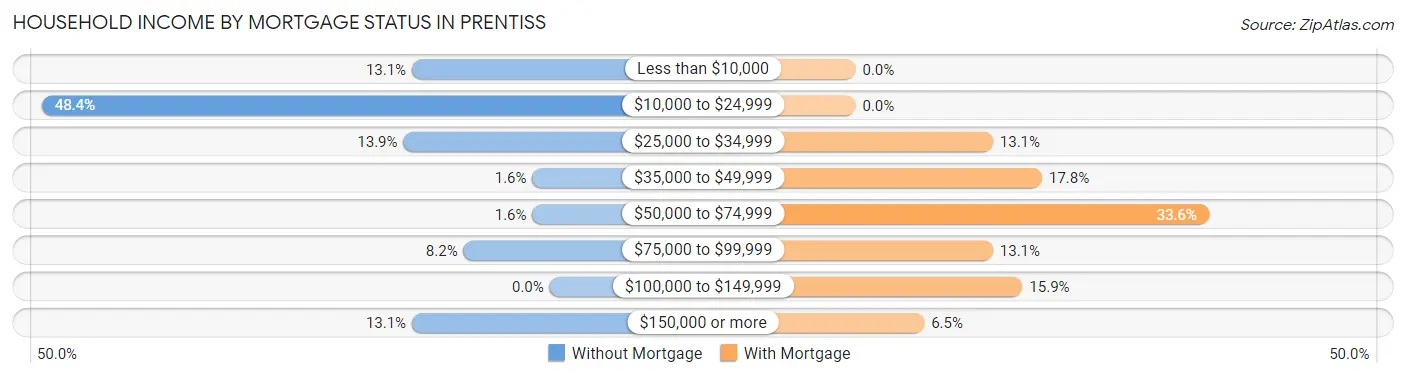
| Household Income | Without Mortgage | With Mortgage |
| Less than $10,000 | 16 (13.1%) | 0 (0.0%) |
| $10,000 to $24,999 | 59 (48.4%) | 0 (0.0%) |
| $25,000 to $34,999 | 17 (13.9%) | 14 (13.1%) |
| $35,000 to $49,999 | 2 (1.6%) | 19 (17.8%) |
| $50,000 to $74,999 | 2 (1.6%) | 36 (33.6%) |
| $75,000 to $99,999 | 10 (8.2%) | 14 (13.1%) |
| $100,000 to $149,999 | 0 (0.0%) | 17 (15.9%) |
| $150,000 or more | 16 (13.1%) | 7 (6.5%) |
| Total | 122 (100.0%) | 107 (100.0%) |
Property Value to Household Income Ratio in Prentiss
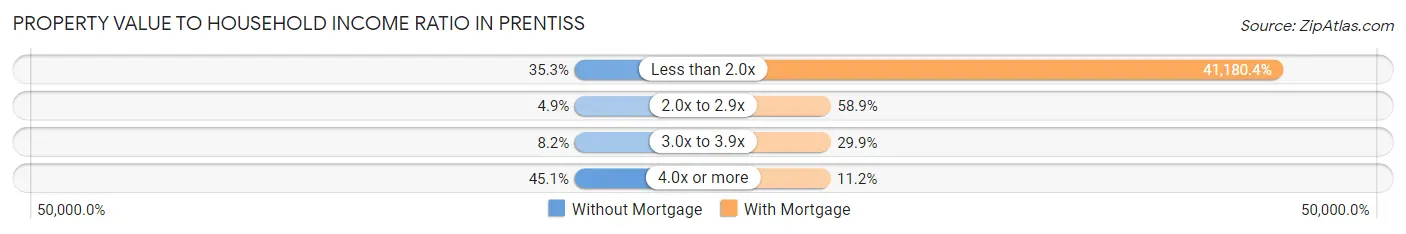
| Value-to-Income Ratio | Without Mortgage | With Mortgage |
| Less than 2.0x | 43 (35.2%) | 44,063 (41,180.4%) |
| 2.0x to 2.9x | 6 (4.9%) | 63 (58.9%) |
| 3.0x to 3.9x | 10 (8.2%) | 32 (29.9%) |
| 4.0x or more | 55 (45.1%) | 12 (11.2%) |
| Total | 122 (100.0%) | 107 (100.0%) |
Real Estate Taxes by Mortgage Status in Prentiss
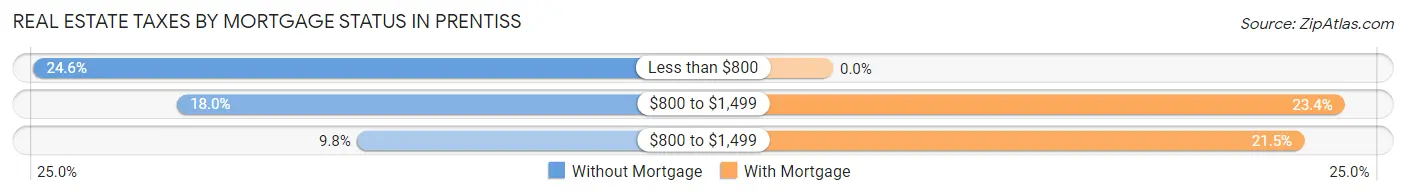
| Property Taxes | Without Mortgage | With Mortgage |
| Less than $800 | 30 (24.6%) | 0 (0.0%) |
| $800 to $1,499 | 22 (18.0%) | 25 (23.4%) |
| $800 to $1,499 | 12 (9.8%) | 23 (21.5%) |
| Total | 122 (100.0%) | 107 (100.0%) |
Health & Disability in Prentiss
Health Insurance Coverage by Age in Prentiss
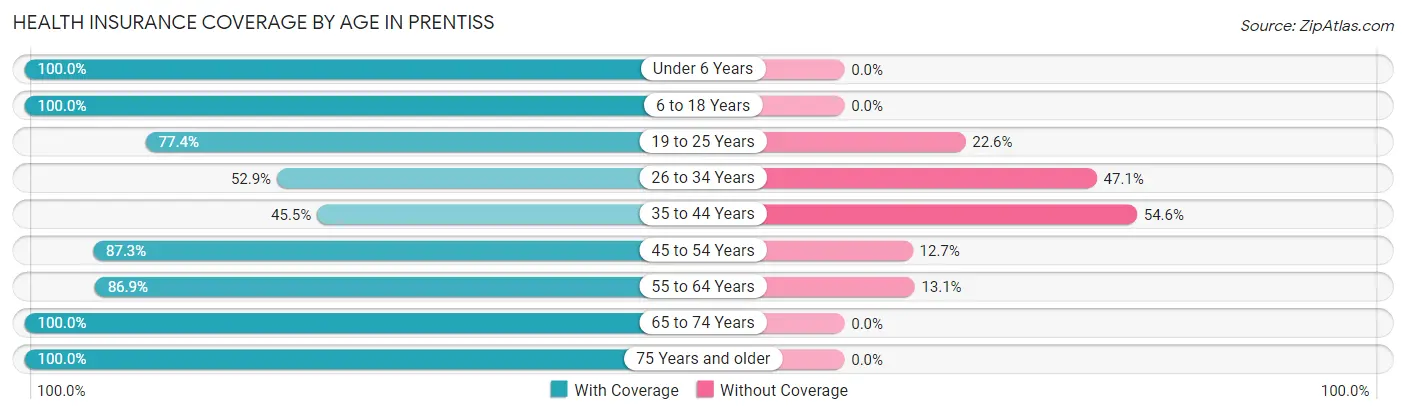
| Age Bracket | With Coverage | Without Coverage |
| Under 6 Years | 97 (100.0%) | 0 (0.0%) |
| 6 to 18 Years | 145 (100.0%) | 0 (0.0%) |
| 19 to 25 Years | 48 (77.4%) | 14 (22.6%) |
| 26 to 34 Years | 27 (52.9%) | 24 (47.1%) |
| 35 to 44 Years | 30 (45.5%) | 36 (54.5%) |
| 45 to 54 Years | 137 (87.3%) | 20 (12.7%) |
| 55 to 64 Years | 93 (86.9%) | 14 (13.1%) |
| 65 to 74 Years | 101 (100.0%) | 0 (0.0%) |
| 75 Years and older | 90 (100.0%) | 0 (0.0%) |
| Total | 768 (87.7%) | 108 (12.3%) |
Health Insurance Coverage by Citizenship Status in Prentiss
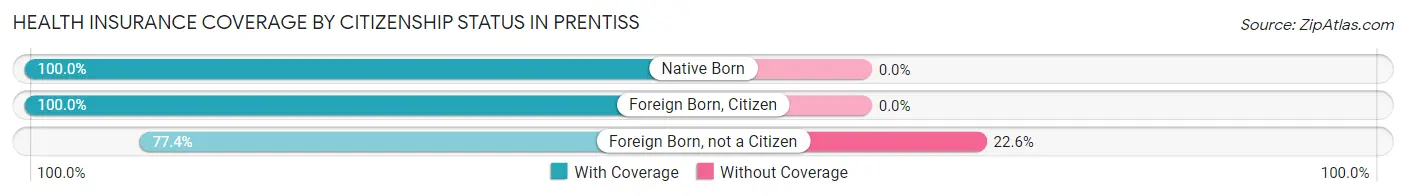
| Citizenship Status | With Coverage | Without Coverage |
| Native Born | 97 (100.0%) | 0 (0.0%) |
| Foreign Born, Citizen | 145 (100.0%) | 0 (0.0%) |
| Foreign Born, not a Citizen | 48 (77.4%) | 14 (22.6%) |
Health Insurance Coverage by Household Income in Prentiss
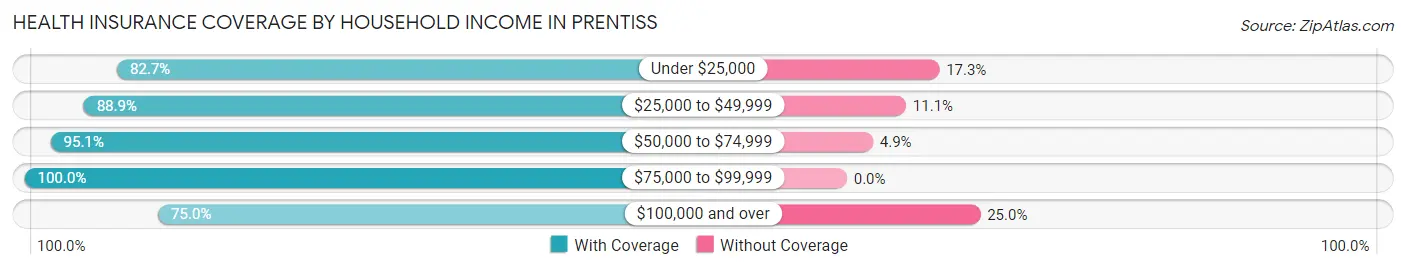
| Household Income | With Coverage | Without Coverage |
| Under $25,000 | 234 (82.7%) | 49 (17.3%) |
| $25,000 to $49,999 | 289 (88.9%) | 36 (11.1%) |
| $50,000 to $74,999 | 78 (95.1%) | 4 (4.9%) |
| $75,000 to $99,999 | 85 (100.0%) | 0 (0.0%) |
| $100,000 and over | 57 (75.0%) | 19 (25.0%) |
Public vs Private Health Insurance Coverage by Age in Prentiss
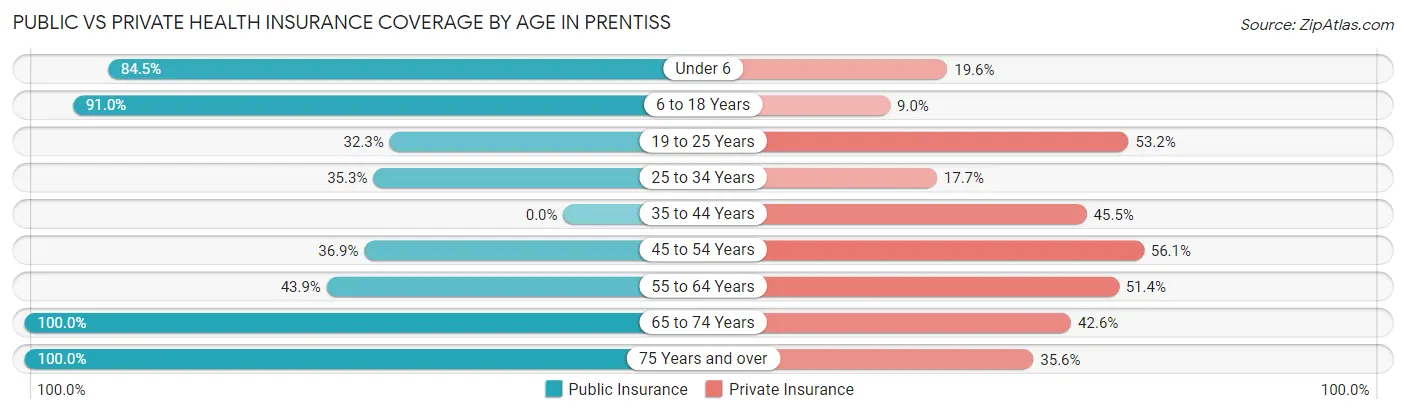
| Age Bracket | Public Insurance | Private Insurance |
| Under 6 | 82 (84.5%) | 19 (19.6%) |
| 6 to 18 Years | 132 (91.0%) | 13 (9.0%) |
| 19 to 25 Years | 20 (32.3%) | 33 (53.2%) |
| 25 to 34 Years | 18 (35.3%) | 9 (17.6%) |
| 35 to 44 Years | 0 (0.0%) | 30 (45.5%) |
| 45 to 54 Years | 58 (36.9%) | 88 (56.0%) |
| 55 to 64 Years | 47 (43.9%) | 55 (51.4%) |
| 65 to 74 Years | 101 (100.0%) | 43 (42.6%) |
| 75 Years and over | 90 (100.0%) | 32 (35.6%) |
| Total | 548 (62.6%) | 322 (36.8%) |
Disability Status by Sex by Age in Prentiss
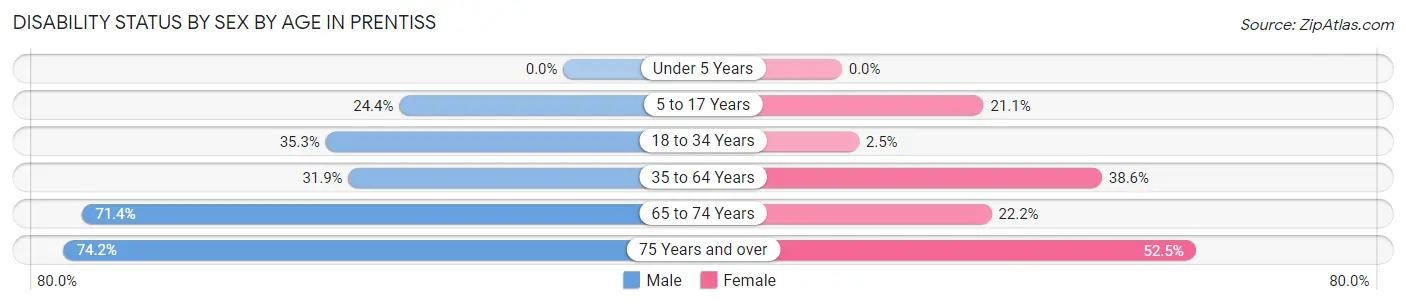
| Age Bracket | Male | Female |
| Under 5 Years | 0 (0.0%) | 0 (0.0%) |
| 5 to 17 Years | 19 (24.4%) | 12 (21.0%) |
| 18 to 34 Years | 18 (35.3%) | 2 (2.5%) |
| 35 to 64 Years | 45 (31.9%) | 73 (38.6%) |
| 65 to 74 Years | 40 (71.4%) | 10 (22.2%) |
| 75 Years and over | 23 (74.2%) | 31 (52.5%) |
Disability Class by Sex by Age in Prentiss
Disability Class: Hearing Difficulty
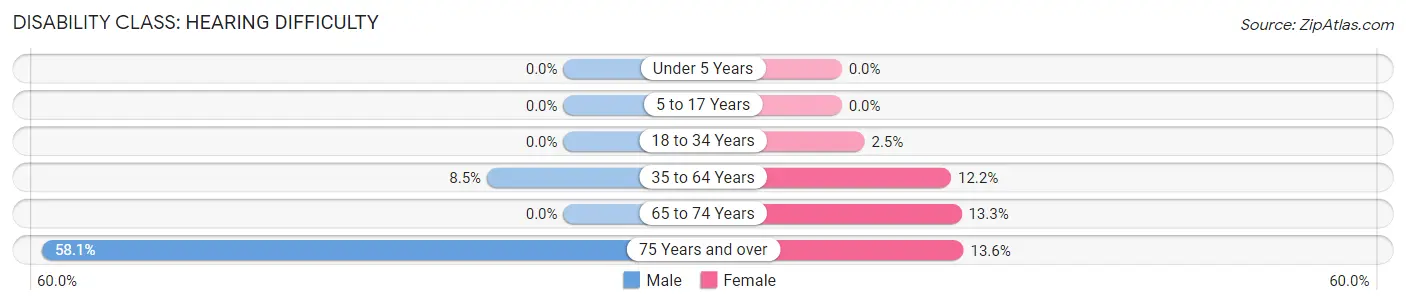
| Age Bracket | Male | Female |
| Under 5 Years | 0 (0.0%) | 0 (0.0%) |
| 5 to 17 Years | 0 (0.0%) | 0 (0.0%) |
| 18 to 34 Years | 0 (0.0%) | 2 (2.5%) |
| 35 to 64 Years | 12 (8.5%) | 23 (12.2%) |
| 65 to 74 Years | 0 (0.0%) | 6 (13.3%) |
| 75 Years and over | 18 (58.1%) | 8 (13.6%) |
Disability Class: Vision Difficulty
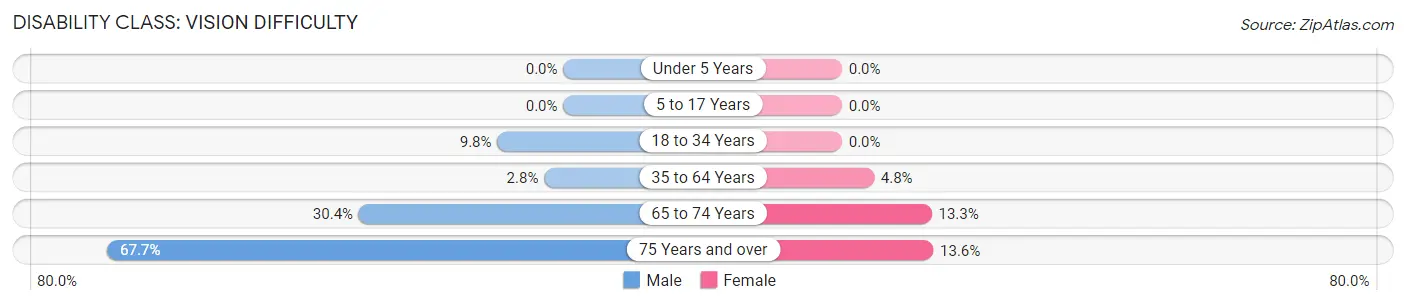
| Age Bracket | Male | Female |
| Under 5 Years | 0 (0.0%) | 0 (0.0%) |
| 5 to 17 Years | 0 (0.0%) | 0 (0.0%) |
| 18 to 34 Years | 5 (9.8%) | 0 (0.0%) |
| 35 to 64 Years | 4 (2.8%) | 9 (4.8%) |
| 65 to 74 Years | 17 (30.4%) | 6 (13.3%) |
| 75 Years and over | 21 (67.7%) | 8 (13.6%) |
Disability Class: Cognitive Difficulty
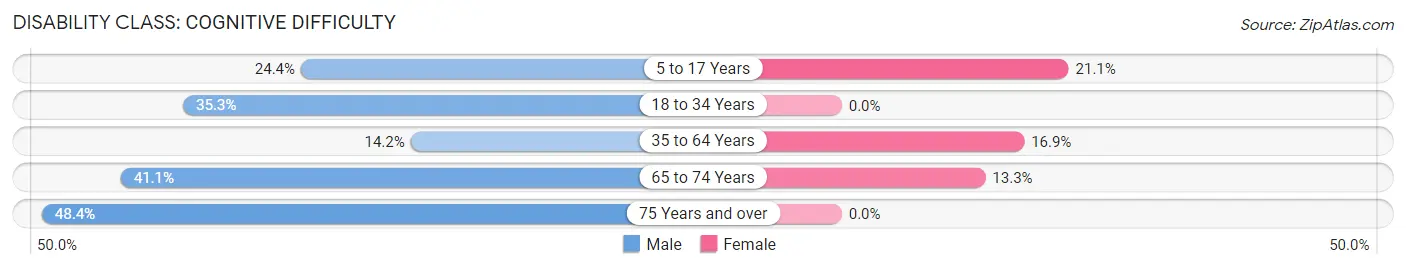
| Age Bracket | Male | Female |
| 5 to 17 Years | 19 (24.4%) | 12 (21.0%) |
| 18 to 34 Years | 18 (35.3%) | 0 (0.0%) |
| 35 to 64 Years | 20 (14.2%) | 32 (16.9%) |
| 65 to 74 Years | 23 (41.1%) | 6 (13.3%) |
| 75 Years and over | 15 (48.4%) | 0 (0.0%) |
Disability Class: Ambulatory Difficulty
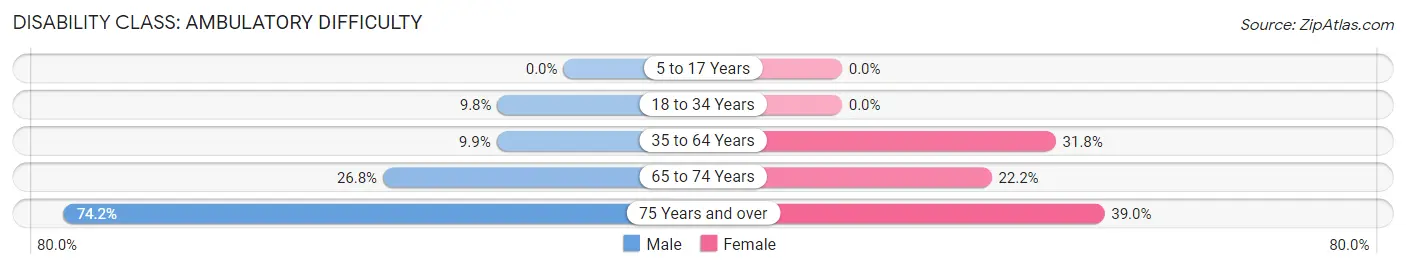
| Age Bracket | Male | Female |
| 5 to 17 Years | 0 (0.0%) | 0 (0.0%) |
| 18 to 34 Years | 5 (9.8%) | 0 (0.0%) |
| 35 to 64 Years | 14 (9.9%) | 60 (31.8%) |
| 65 to 74 Years | 15 (26.8%) | 10 (22.2%) |
| 75 Years and over | 23 (74.2%) | 23 (39.0%) |
Disability Class: Self-Care Difficulty
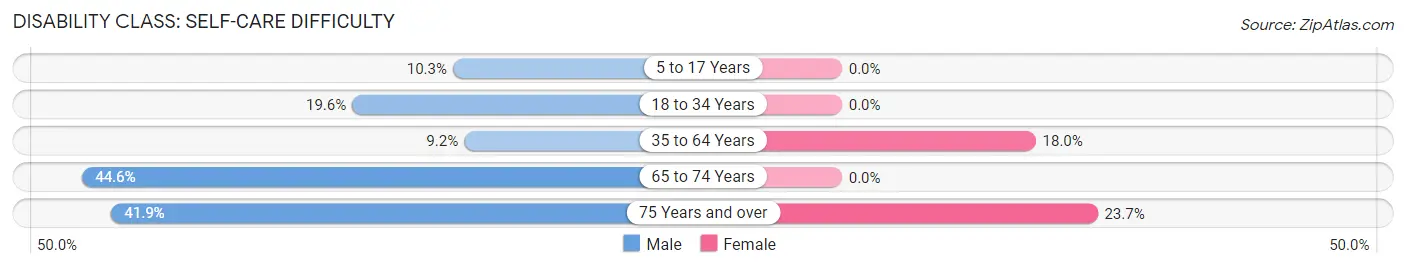
| Age Bracket | Male | Female |
| 5 to 17 Years | 8 (10.3%) | 0 (0.0%) |
| 18 to 34 Years | 10 (19.6%) | 0 (0.0%) |
| 35 to 64 Years | 13 (9.2%) | 34 (18.0%) |
| 65 to 74 Years | 25 (44.6%) | 0 (0.0%) |
| 75 Years and over | 13 (41.9%) | 14 (23.7%) |
Technology Access in Prentiss
Computing Device Access in Prentiss
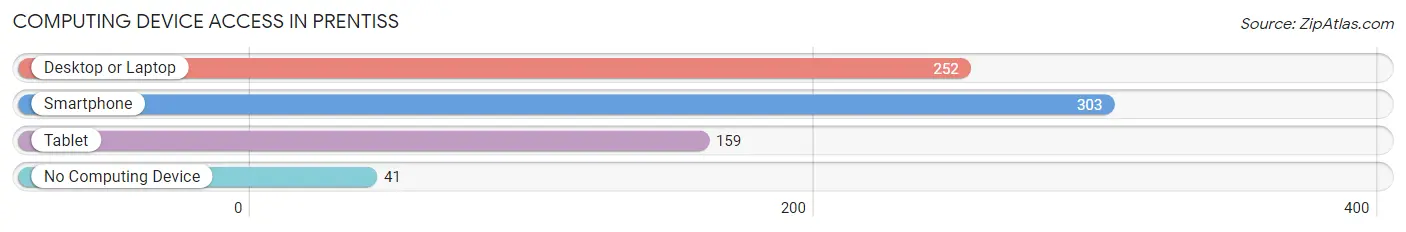
| Device Type | # Households | % Households |
| Desktop or Laptop | 252 | 68.7% |
| Smartphone | 303 | 82.6% |
| Tablet | 159 | 43.3% |
| No Computing Device | 41 | 11.2% |
| Total | 367 | 100.0% |
Internet Access in Prentiss
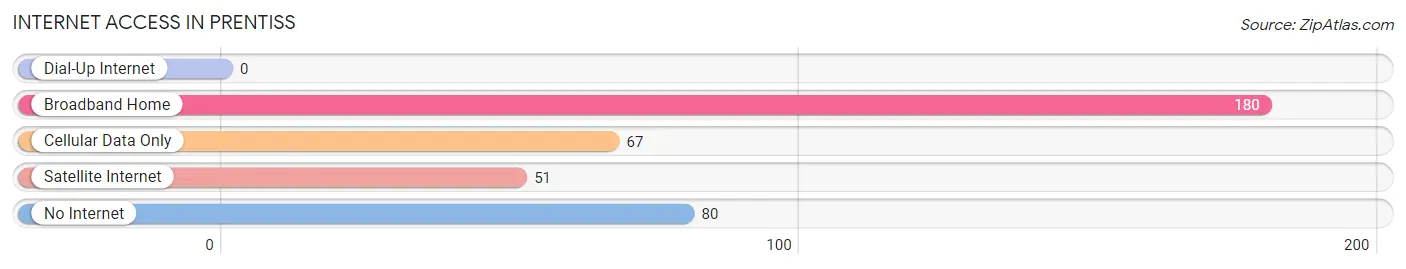
| Internet Type | # Households | % Households |
| Dial-Up Internet | 0 | 0.0% |
| Broadband Home | 180 | 49.0% |
| Cellular Data Only | 67 | 18.3% |
| Satellite Internet | 51 | 13.9% |
| No Internet | 80 | 21.8% |
| Total | 367 | 100.0% |
Prentiss Summary
Prentiss, Mississippi is a small town located in Jefferson Davis County, in the southeastern part of the state. It is situated on the banks of the Leaf River, and is home to a population of approximately 1,500 people. The town was founded in 1848, and is named after the first governor of Mississippi, Walter Leake Prentiss.
Geography
Prentiss is located in the southeastern part of Mississippi, in Jefferson Davis County. It is situated on the banks of the Leaf River, and is surrounded by rolling hills and forests. The town is located approximately 30 miles south of Hattiesburg, and is about an hour and a half drive from the state capital of Jackson.
The climate in Prentiss is humid subtropical, with hot, humid summers and mild winters. The average annual temperature is around 70 degrees Fahrenheit, with temperatures reaching as high as 95 degrees in the summer months. The average annual precipitation is around 50 inches, with most of the rain falling in the spring and summer months.
Economy
The economy of Prentiss is largely based on agriculture and forestry. The town is home to several large farms, which produce a variety of crops, including cotton, corn, soybeans, and wheat. The town is also home to several lumber mills, which produce lumber for the local and regional markets.
In addition to agriculture and forestry, Prentiss is home to several small businesses, including restaurants, retail stores, and service providers. The town is also home to a small manufacturing sector, which produces a variety of products, including furniture, clothing, and electronics.
Demographics
As of the 2010 census, the population of Prentiss was 1,500. The racial makeup of the town was 79.2% White, 18.2% African American, 0.7% Native American, 0.3% Asian, and 1.6% from other races. The median household income was $30,000, and the median family income was $35,000.
The town is served by the Jefferson Davis County School District, which includes two elementary schools, one middle school, and one high school. The town is also home to a branch of the University of Southern Mississippi, which offers a variety of degree programs.
Conclusion
Prentiss, Mississippi is a small town located in Jefferson Davis County, in the southeastern part of the state. It is situated on the banks of the Leaf River, and is home to a population of approximately 1,500 people. The town was founded in 1848, and is named after the first governor of Mississippi, Walter Leake Prentiss. The economy of Prentiss is largely based on agriculture and forestry, and the town is also home to several small businesses, including restaurants, retail stores, and service providers. The racial makeup of the town is 79.2% White, 18.2% African American, 0.7% Native American, 0.3% Asian, and 1.6% from other races. The town is served by the Jefferson Davis County School District, and is also home to a branch of the University of Southern Mississippi.
Common Questions
What is Per Capita Income in Prentiss?
Per Capita income in Prentiss is $17,134.
What is the Median Family Income in Prentiss?
Median Family Income in Prentiss is $36,500.
What is the Median Household income in Prentiss?
Median Household Income in Prentiss is $25,859.
What is Income or Wage Gap in Prentiss?
Income or Wage Gap in Prentiss is 52.6%.
Women in Prentiss earn 47.4 cents for every dollar earned by a man.
What is Inequality or Gini Index in Prentiss?
Inequality or Gini Index in Prentiss is 0.46.
What is the Total Population of Prentiss?
Total Population of Prentiss is 985.
What is the Total Male Population of Prentiss?
Total Male Population of Prentiss is 483.
What is the Total Female Population of Prentiss?
Total Female Population of Prentiss is 502.
What is the Ratio of Males per 100 Females in Prentiss?
There are 96.22 Males per 100 Females in Prentiss.
What is the Ratio of Females per 100 Males in Prentiss?
There are 103.93 Females per 100 Males in Prentiss.
What is the Median Population Age in Prentiss?
Median Population Age in Prentiss is 48.4 Years.
What is the Average Family Size in Prentiss
Average Family Size in Prentiss is 3.4 People.
What is the Average Household Size in Prentiss
Average Household Size in Prentiss is 2.3 People.
How Large is the Labor Force in Prentiss?
There are 247 People in the Labor Forcein in Prentiss.
What is the Percentage of People in the Labor Force in Prentiss?
31.3% of People are in the Labor Force in Prentiss.
What is the Unemployment Rate in Prentiss?
Unemployment Rate in Prentiss is 6.1%.