Zip Codes with the Highest Percentage of Population with a Degree in Visual and Performing Arts in Greenville, MS
RELATED REPORTS & OPTIONS
Visual and Performing Arts
Greenville
Compare Zip Codes
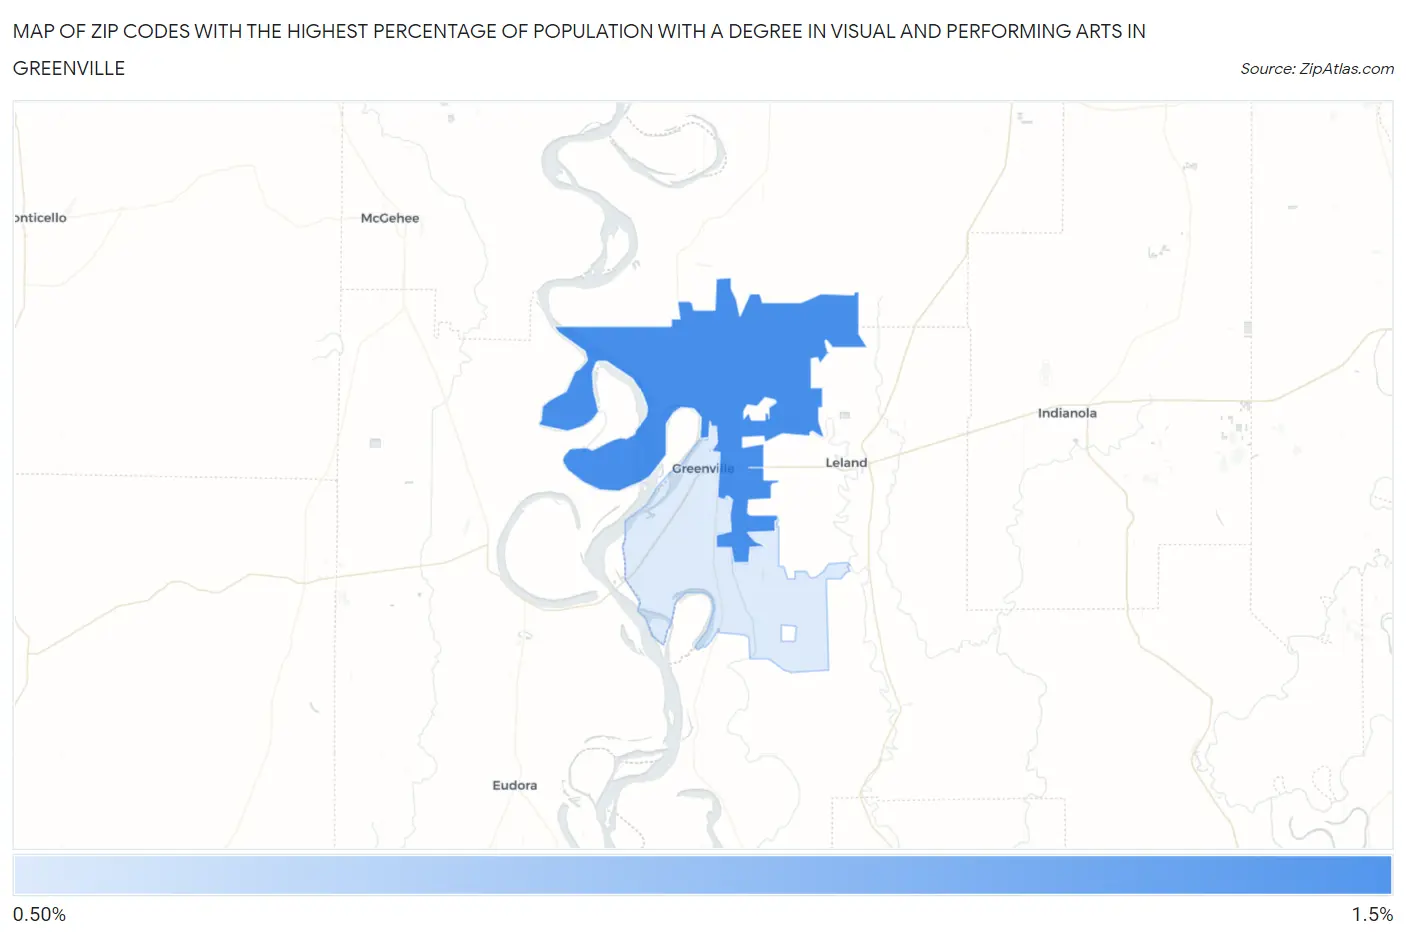
Map of Zip Codes with the Highest Percentage of Population with a Degree in Visual and Performing Arts in Greenville
0.97%
1.4%
Zip Codes with the Highest Percentage of Population with a Degree in Visual and Performing Arts in Greenville, MS
| Zip Code | % Graduates | vs State | vs National | |
| 1. | 38703 | 1.4% | 2.4%(-0.941)#136 | 4.3%(-2.81)#18,353 |
| 2. | 38701 | 0.97% | 2.4%(-1.40)#158 | 4.3%(-3.28)#19,739 |
1
Common Questions
What are the Top Zip Codes with the Highest Percentage of Population with a Degree in Visual and Performing Arts in Greenville, MS?
Top Zip Codes with the Highest Percentage of Population with a Degree in Visual and Performing Arts in Greenville, MS are:
What zip code has the Highest Percentage of Population with a Degree in Visual and Performing Arts in Greenville, MS?
38703 has the Highest Percentage of Population with a Degree in Visual and Performing Arts in Greenville, MS with 1.4%.
What is the Percentage of Population with a Degree in Visual and Performing Arts in Greenville, MS?
Percentage of Population with a Degree in Visual and Performing Arts in Greenville is 1.2%.
What is the Percentage of Population with a Degree in Visual and Performing Arts in Mississippi?
Percentage of Population with a Degree in Visual and Performing Arts in Mississippi is 2.4%.
What is the Percentage of Population with a Degree in Visual and Performing Arts in the United States?
Percentage of Population with a Degree in Visual and Performing Arts in the United States is 4.3%.