Zip Codes with the Highest Percentage of Population with a Degree in Visual and Performing Arts in Laurel, MS
RELATED REPORTS & OPTIONS
Visual and Performing Arts
Laurel
Compare Zip Codes
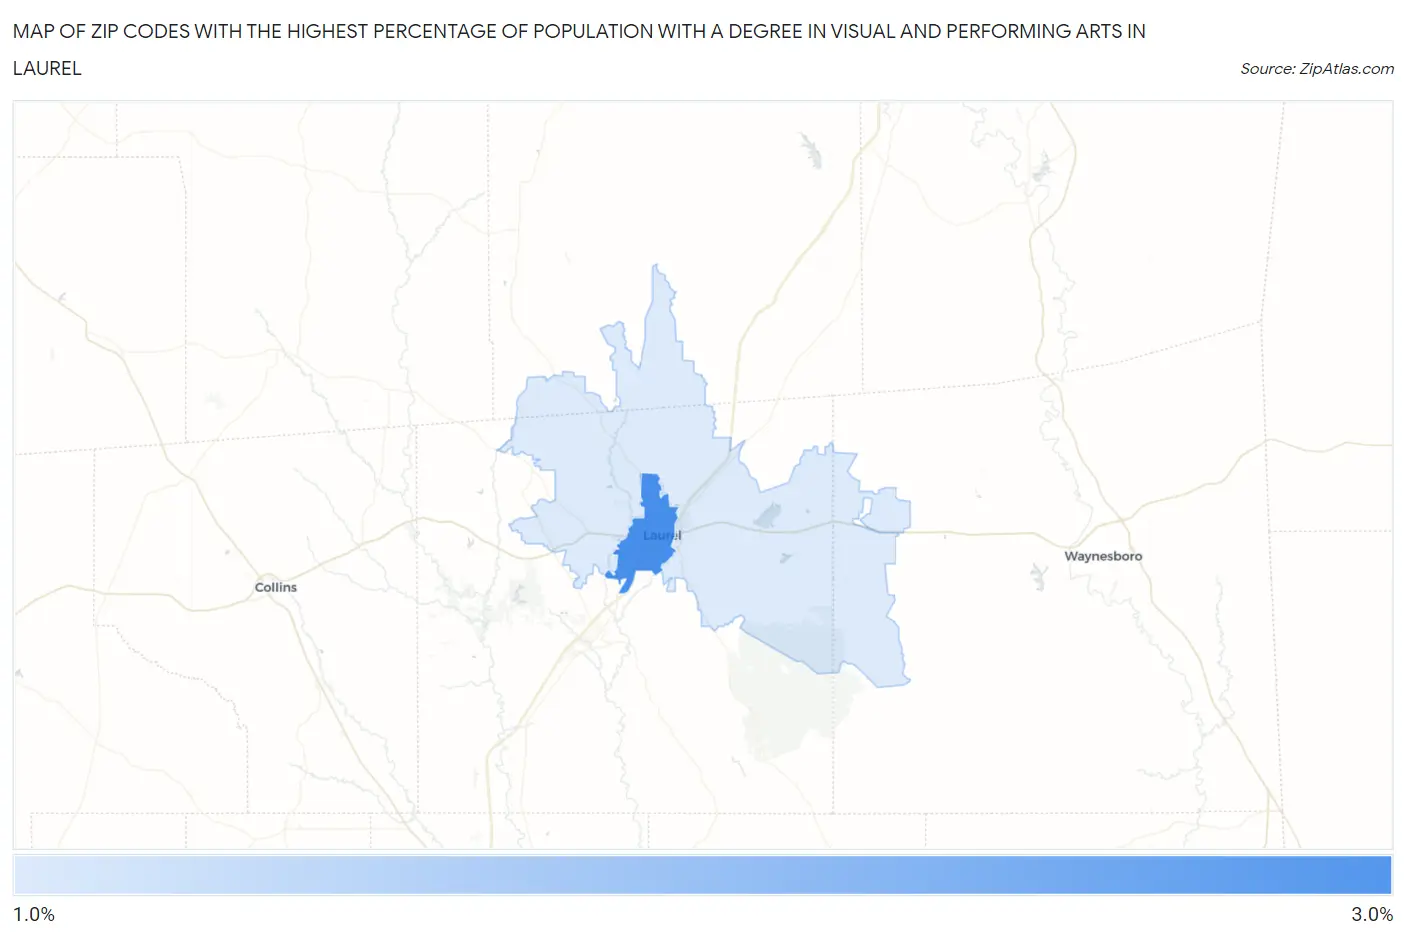
Map of Zip Codes with the Highest Percentage of Population with a Degree in Visual and Performing Arts in Laurel
2.0%
2.5%
Zip Codes with the Highest Percentage of Population with a Degree in Visual and Performing Arts in Laurel, MS
| Zip Code | % Graduates | vs State | vs National | |
| 1. | 39440 | 2.5% | 2.4%(+0.152)#89 | 4.3%(-1.72)#14,520 |
| 2. | 39443 | 2.0% | 2.4%(-0.391)#116 | 4.3%(-2.27)#16,499 |
1
Common Questions
What are the Top Zip Codes with the Highest Percentage of Population with a Degree in Visual and Performing Arts in Laurel, MS?
Top Zip Codes with the Highest Percentage of Population with a Degree in Visual and Performing Arts in Laurel, MS are:
What zip code has the Highest Percentage of Population with a Degree in Visual and Performing Arts in Laurel, MS?
39440 has the Highest Percentage of Population with a Degree in Visual and Performing Arts in Laurel, MS with 2.5%.
What is the Percentage of Population with a Degree in Visual and Performing Arts in Laurel, MS?
Percentage of Population with a Degree in Visual and Performing Arts in Laurel is 3.0%.
What is the Percentage of Population with a Degree in Visual and Performing Arts in Mississippi?
Percentage of Population with a Degree in Visual and Performing Arts in Mississippi is 2.4%.
What is the Percentage of Population with a Degree in Visual and Performing Arts in the United States?
Percentage of Population with a Degree in Visual and Performing Arts in the United States is 4.3%.