Zip Codes with the Highest Percentage of Population with a Degree in Visual and Performing Arts in Hattiesburg, MS
RELATED REPORTS & OPTIONS
Visual and Performing Arts
Hattiesburg
Compare Zip Codes
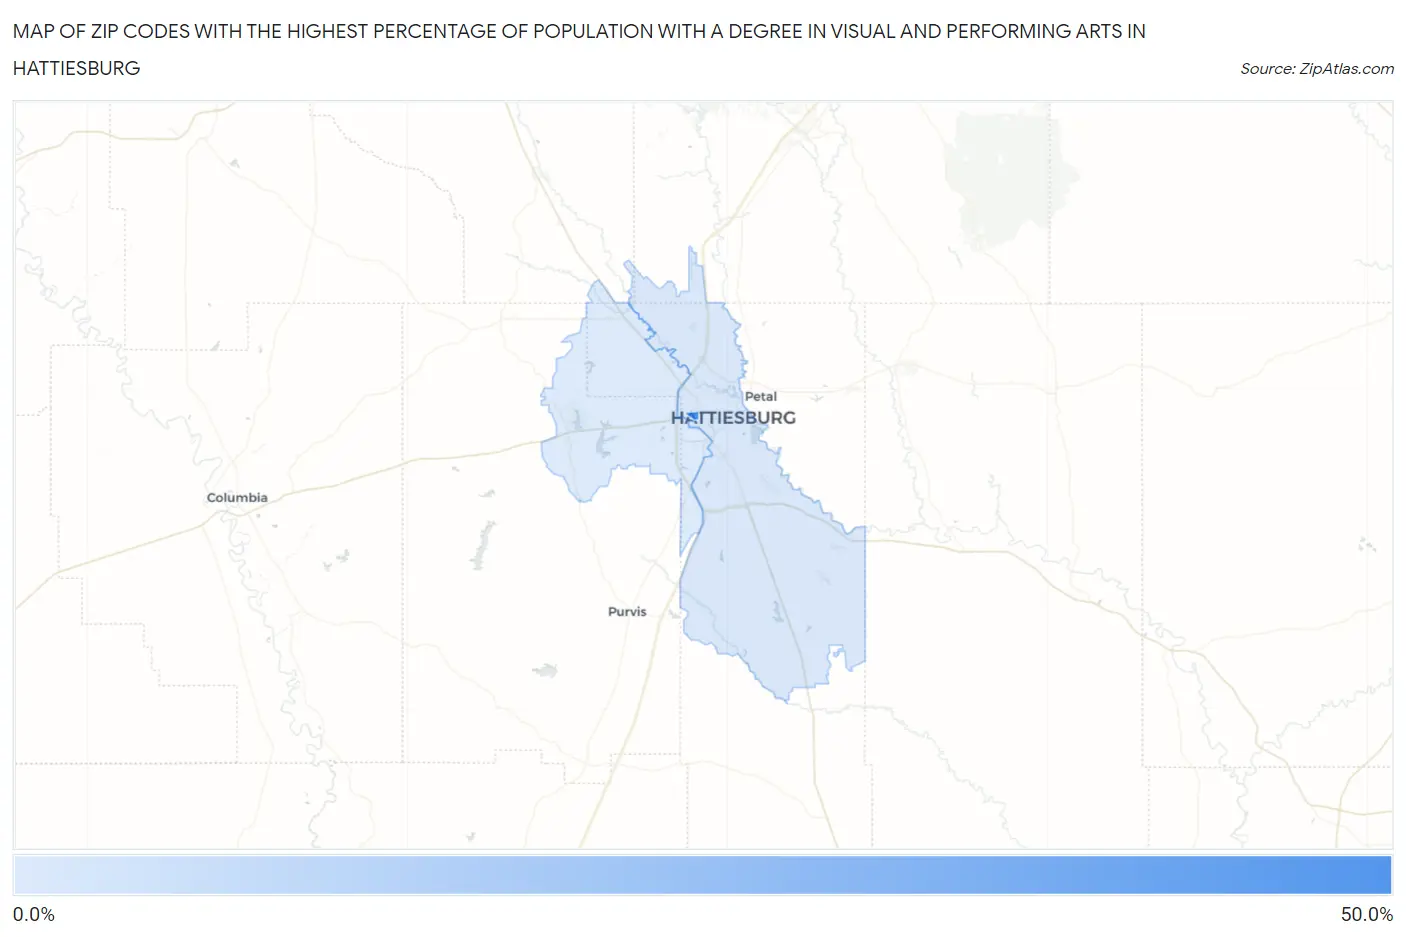
Map of Zip Codes with the Highest Percentage of Population with a Degree in Visual and Performing Arts in Hattiesburg
2.9%
42.3%
Zip Codes with the Highest Percentage of Population with a Degree in Visual and Performing Arts in Hattiesburg, MS
| Zip Code | % Graduates | vs State | vs National | |
| 1. | 39406 | 42.3% | 2.4%(+39.9)#1 | 4.3%(+38.1)#117 |
| 2. | 39401 | 3.9% | 2.4%(+1.56)#51 | 4.3%(-0.318)#9,465 |
| 3. | 39402 | 2.9% | 2.4%(+0.547)#71 | 4.3%(-1.33)#13,002 |
1
Common Questions
What are the Top Zip Codes with the Highest Percentage of Population with a Degree in Visual and Performing Arts in Hattiesburg, MS?
Top Zip Codes with the Highest Percentage of Population with a Degree in Visual and Performing Arts in Hattiesburg, MS are:
What zip code has the Highest Percentage of Population with a Degree in Visual and Performing Arts in Hattiesburg, MS?
39406 has the Highest Percentage of Population with a Degree in Visual and Performing Arts in Hattiesburg, MS with 42.3%.
What is the Percentage of Population with a Degree in Visual and Performing Arts in Hattiesburg, MS?
Percentage of Population with a Degree in Visual and Performing Arts in Hattiesburg is 4.4%.
What is the Percentage of Population with a Degree in Visual and Performing Arts in Mississippi?
Percentage of Population with a Degree in Visual and Performing Arts in Mississippi is 2.4%.
What is the Percentage of Population with a Degree in Visual and Performing Arts in the United States?
Percentage of Population with a Degree in Visual and Performing Arts in the United States is 4.3%.