Falcon, MS Map & Demographics
Falcon Map
Falcon Overview
$11,875
PER CAPITA INCOME
$47,500
AVG FAMILY INCOME
32.4%
WAGE / INCOME GAP [ % ]
67.6¢/ $1
WAGE / INCOME GAP [ $ ]
0.49
INEQUALITY / GINI INDEX
173
TOTAL POPULATION
69
MALE POPULATION
104
FEMALE POPULATION
66.35
MALES / 100 FEMALES
150.72
FEMALES / 100 MALES
30.6
MEDIAN AGE
4.3
AVG FAMILY SIZE
2.5
AVG HOUSEHOLD SIZE
51
LABOR FORCE [ PEOPLE ]
41.5%
PERCENT IN LABOR FORCE
3.9%
UNEMPLOYMENT RATE
Income in Falcon
Income Overview in Falcon
| Characteristic | Number | Measure |
| Per Capita Income | 173 | $11,875 |
| Median Family Income | 32 | $47,500 |
| Mean Family Income | 32 | $47,278 |
| Median Household Income | 68 | $0 |
| Mean Household Income | 68 | $31,828 |
| Income Deficit | 32 | $0 |
| Wage / Income Gap (%) | 173 | 32.39% |
| Wage / Income Gap ($) | 173 | 67.61¢ per $1 |
| Gini / Inequality Index | 173 | 0.49 |
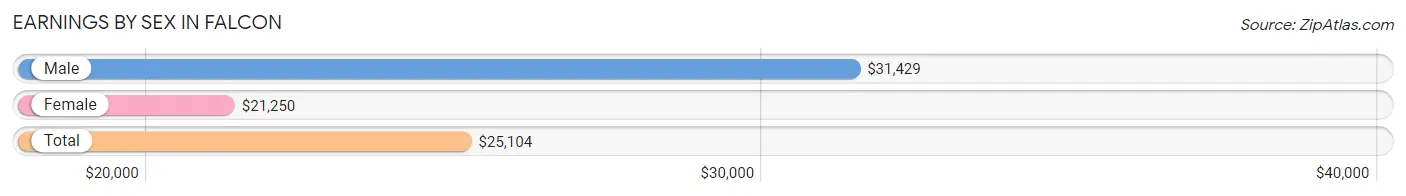
Earnings by Sex in Falcon
Average Earnings in Falcon are $25,104, $31,429 for men and $21,250 for women, a difference of 32.4%.
| Sex | Number | Average Earnings |
| Male | 22 (40.0%) | $31,429 |
| Female | 33 (60.0%) | $21,250 |
| Total | 55 (100.0%) | $25,104 |
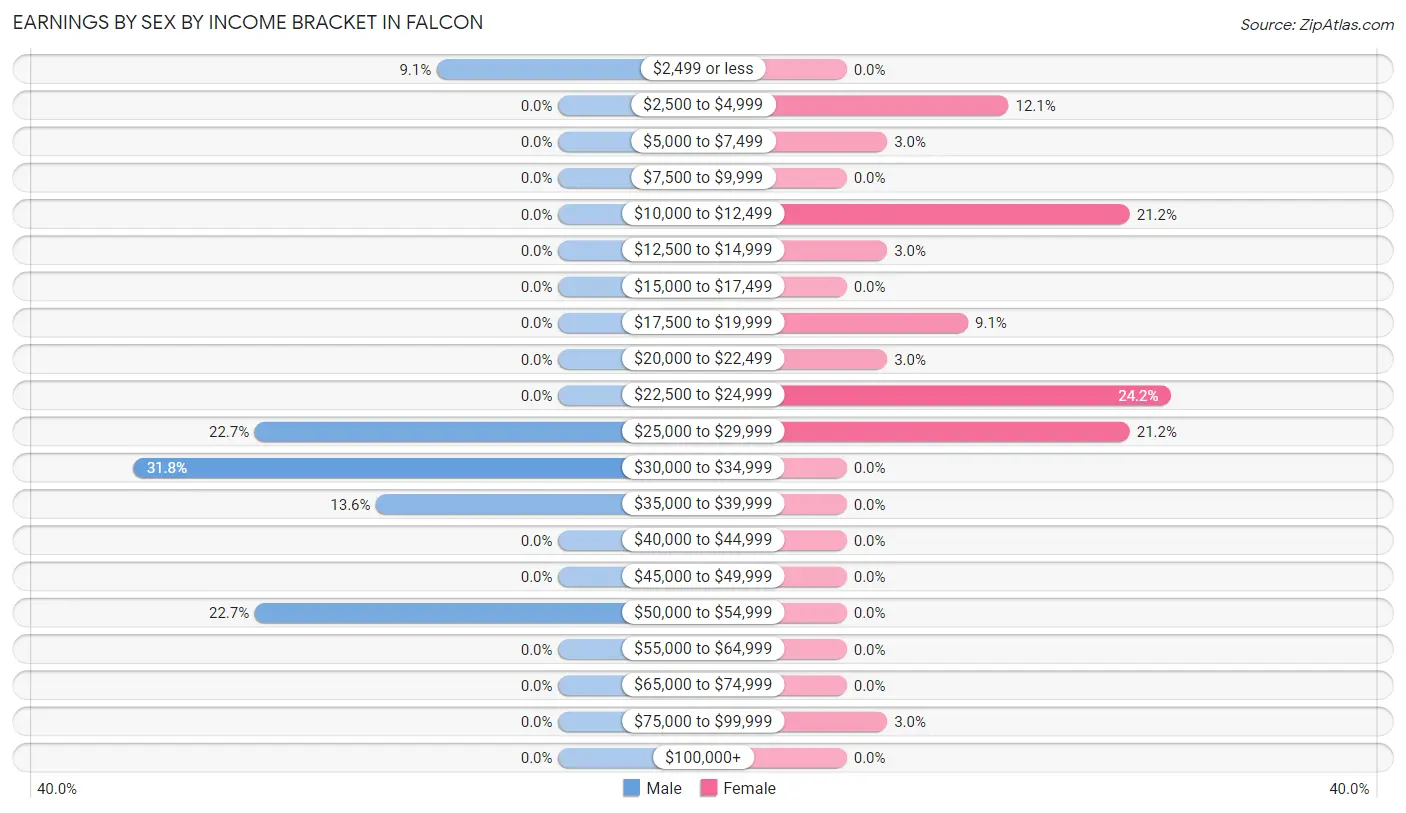
Earnings by Sex by Income Bracket in Falcon
The most common earnings brackets in Falcon are $30,000 to $34,999 for men (7 | 31.8%) and $22,500 to $24,999 for women (8 | 24.2%).
| Income | Male | Female |
| $2,499 or less | 2 (9.1%) | 0 (0.0%) |
| $2,500 to $4,999 | 0 (0.0%) | 4 (12.1%) |
| $5,000 to $7,499 | 0 (0.0%) | 1 (3.0%) |
| $7,500 to $9,999 | 0 (0.0%) | 0 (0.0%) |
| $10,000 to $12,499 | 0 (0.0%) | 7 (21.2%) |
| $12,500 to $14,999 | 0 (0.0%) | 1 (3.0%) |
| $15,000 to $17,499 | 0 (0.0%) | 0 (0.0%) |
| $17,500 to $19,999 | 0 (0.0%) | 3 (9.1%) |
| $20,000 to $22,499 | 0 (0.0%) | 1 (3.0%) |
| $22,500 to $24,999 | 0 (0.0%) | 8 (24.2%) |
| $25,000 to $29,999 | 5 (22.7%) | 7 (21.2%) |
| $30,000 to $34,999 | 7 (31.8%) | 0 (0.0%) |
| $35,000 to $39,999 | 3 (13.6%) | 0 (0.0%) |
| $40,000 to $44,999 | 0 (0.0%) | 0 (0.0%) |
| $45,000 to $49,999 | 0 (0.0%) | 0 (0.0%) |
| $50,000 to $54,999 | 5 (22.7%) | 0 (0.0%) |
| $55,000 to $64,999 | 0 (0.0%) | 0 (0.0%) |
| $65,000 to $74,999 | 0 (0.0%) | 0 (0.0%) |
| $75,000 to $99,999 | 0 (0.0%) | 1 (3.0%) |
| $100,000+ | 0 (0.0%) | 0 (0.0%) |
| Total | 22 (100.0%) | 33 (100.0%) |
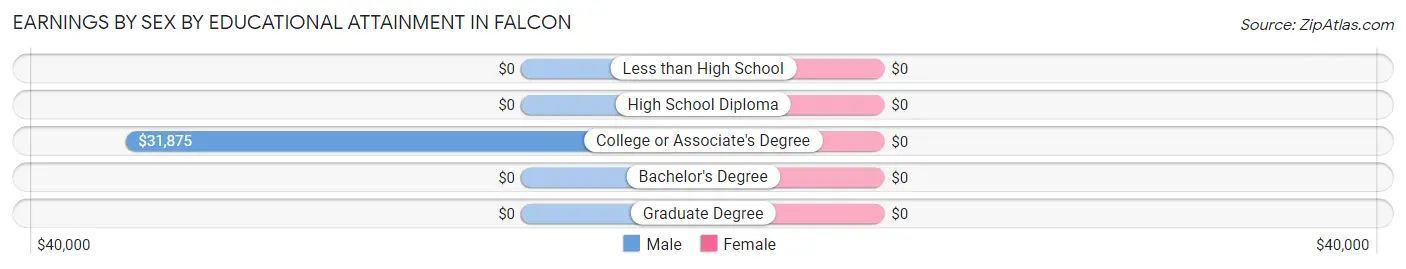
Earnings by Sex by Educational Attainment in Falcon
| Educational Attainment | Male Income | Female Income |
| Less than High School | - | - |
| High School Diploma | - | - |
| College or Associate's Degree | $31,875 | $0 |
| Bachelor's Degree | - | - |
| Graduate Degree | - | - |
| Total | $31,429 | $21,250 |
Family Income in Falcon
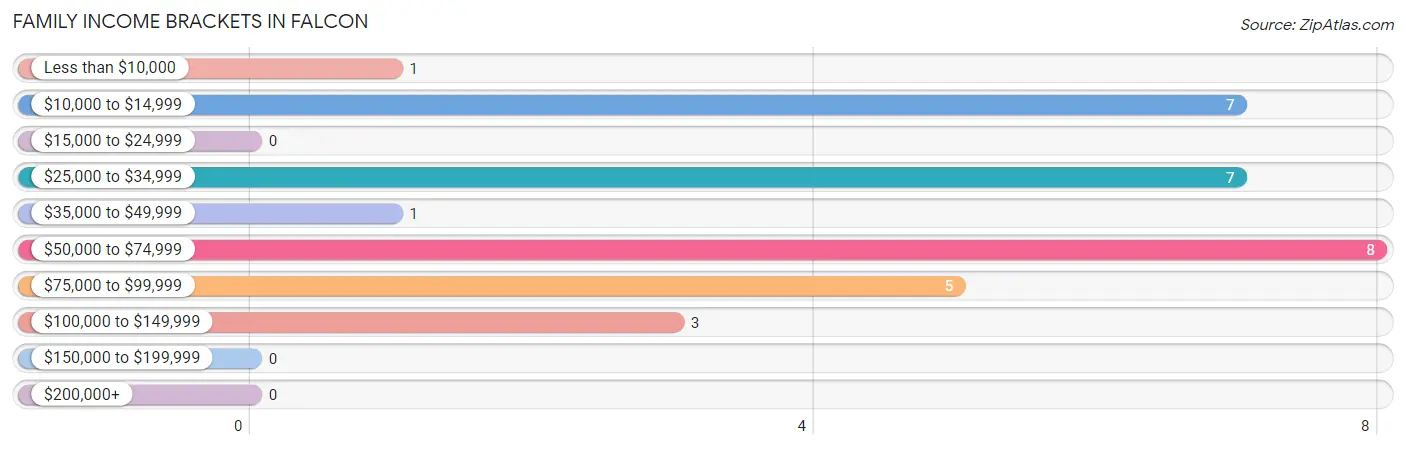
Family Income Brackets in Falcon
According to the Falcon family income data, there are 8 families falling into the $50,000 to $74,999 income range, which is the most common income bracket and makes up 25.0% of all families.
| Income Bracket | # Families | % Families |
| Less than $10,000 | 1 | 3.1% |
| $10,000 to $14,999 | 7 | 21.9% |
| $15,000 to $24,999 | 0 | 0.0% |
| $25,000 to $34,999 | 7 | 21.9% |
| $35,000 to $49,999 | 1 | 3.1% |
| $50,000 to $74,999 | 8 | 25.0% |
| $75,000 to $99,999 | 5 | 15.6% |
| $100,000 to $149,999 | 3 | 9.4% |
| $150,000 to $199,999 | 0 | 0.0% |
| $200,000+ | 0 | 0.0% |
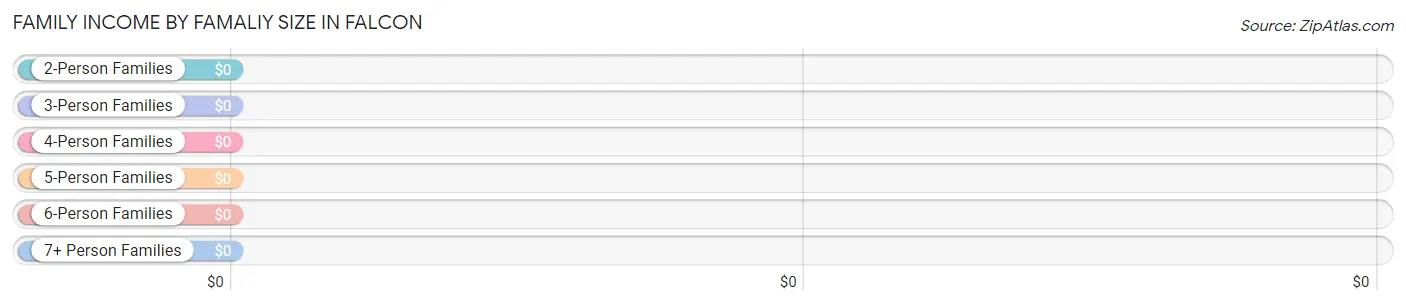
Family Income by Famaliy Size in Falcon
| Income Bracket | # Families | Median Income |
| 2-Person Families | 8 (25.0%) | $0 |
| 3-Person Families | 0 (0.0%) | $0 |
| 4-Person Families | 18 (56.2%) | $0 |
| 5-Person Families | 0 (0.0%) | $0 |
| 6-Person Families | 6 (18.8%) | $0 |
| 7+ Person Families | 0 (0.0%) | $0 |
| Total | 32 (100.0%) | $47,500 |
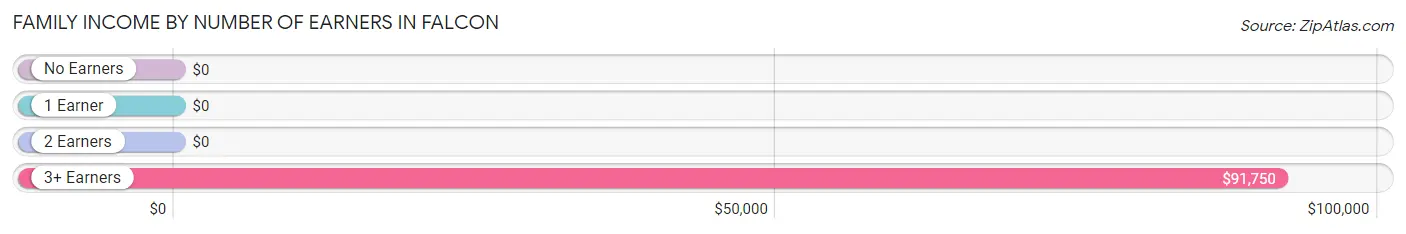
Family Income by Number of Earners in Falcon
| Number of Earners | # Families | Median Income |
| No Earners | 0 (0.0%) | $0 |
| 1 Earner | 15 (46.9%) | $0 |
| 2 Earners | 8 (25.0%) | $0 |
| 3+ Earners | 9 (28.1%) | $91,750 |
| Total | 32 (100.0%) | $47,500 |
Household Income in Falcon
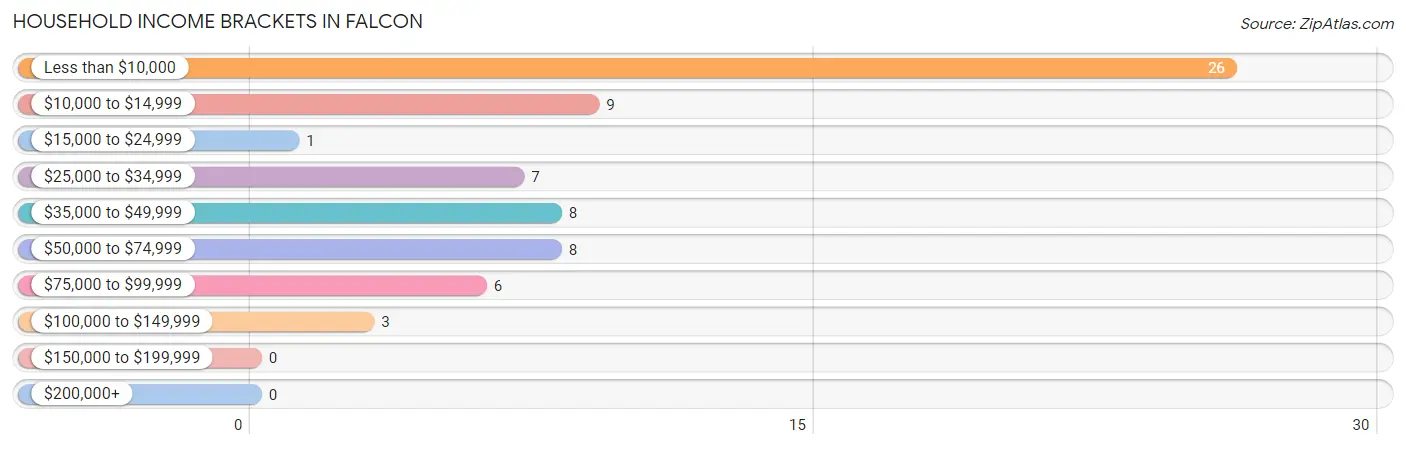
Household Income Brackets in Falcon
With 26 households falling in the category, the less than $10,000 income range is the most frequent in Falcon, accounting for 38.2% of all households.
| Income Bracket | # Households | % Households |
| Less than $10,000 | 26 | 38.2% |
| $10,000 to $14,999 | 9 | 13.2% |
| $15,000 to $24,999 | 1 | 1.5% |
| $25,000 to $34,999 | 7 | 10.3% |
| $35,000 to $49,999 | 8 | 11.8% |
| $50,000 to $74,999 | 8 | 11.8% |
| $75,000 to $99,999 | 6 | 8.8% |
| $100,000 to $149,999 | 3 | 4.4% |
| $150,000 to $199,999 | 0 | 0.0% |
| $200,000+ | 0 | 0.0% |
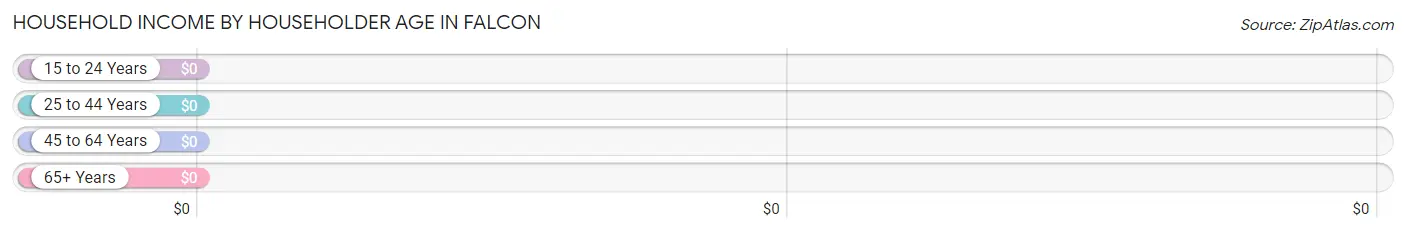
Household Income by Householder Age in Falcon
| Income Bracket | # Households | Median Income |
| 15 to 24 Years | 0 (0.0%) | $0 |
| 25 to 44 Years | 13 (19.1%) | $0 |
| 45 to 64 Years | 22 (32.4%) | $0 |
| 65+ Years | 33 (48.5%) | $0 |
| Total | 68 (100.0%) | $0 |
Poverty in Falcon
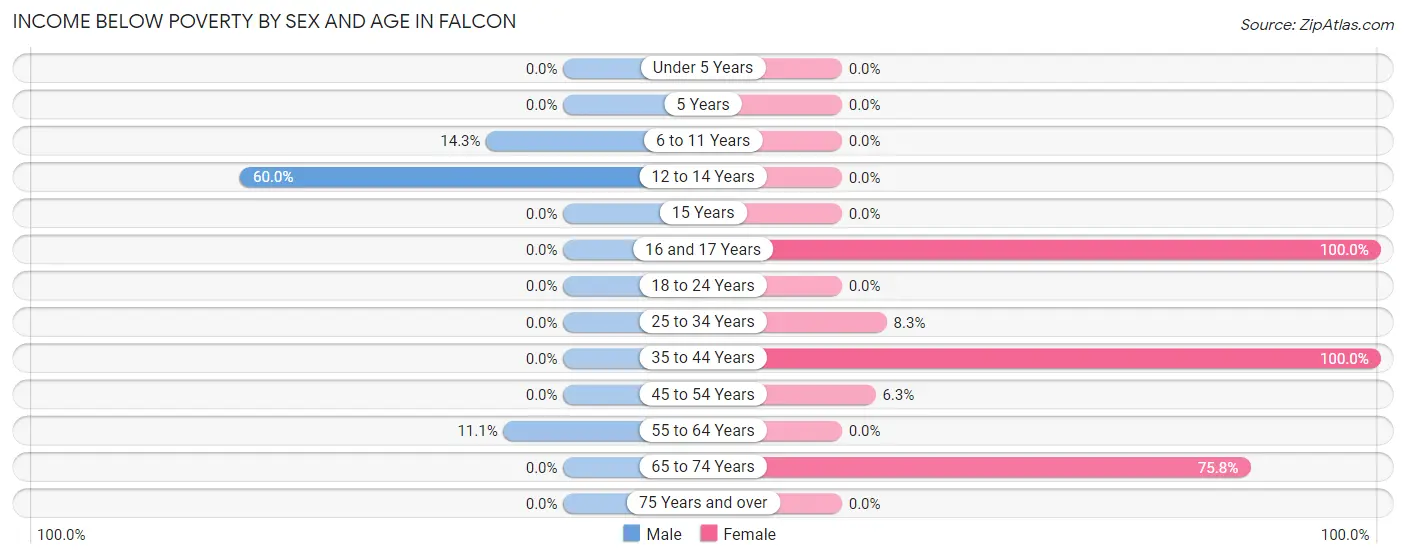
Income Below Poverty by Sex and Age in Falcon
With 15.9% poverty level for males and 41.3% for females among the residents of Falcon, 12 to 14 year old males and 16 and 17 year old females are the most vulnerable to poverty, with 9 males (60.0%) and 9 females (100.0%) in their respective age groups living below the poverty level.
| Age Bracket | Male | Female |
| Under 5 Years | 0 (0.0%) | 0 (0.0%) |
| 5 Years | 0 (0.0%) | 0 (0.0%) |
| 6 to 11 Years | 1 (14.3%) | 0 (0.0%) |
| 12 to 14 Years | 9 (60.0%) | 0 (0.0%) |
| 15 Years | 0 (0.0%) | 0 (0.0%) |
| 16 and 17 Years | 0 (0.0%) | 9 (100.0%) |
| 18 to 24 Years | 0 (0.0%) | 0 (0.0%) |
| 25 to 34 Years | 0 (0.0%) | 1 (8.3%) |
| 35 to 44 Years | 0 (0.0%) | 7 (100.0%) |
| 45 to 54 Years | 0 (0.0%) | 1 (6.2%) |
| 55 to 64 Years | 1 (11.1%) | 0 (0.0%) |
| 65 to 74 Years | 0 (0.0%) | 25 (75.8%) |
| 75 Years and over | 0 (0.0%) | 0 (0.0%) |
| Total | 11 (15.9%) | 43 (41.3%) |
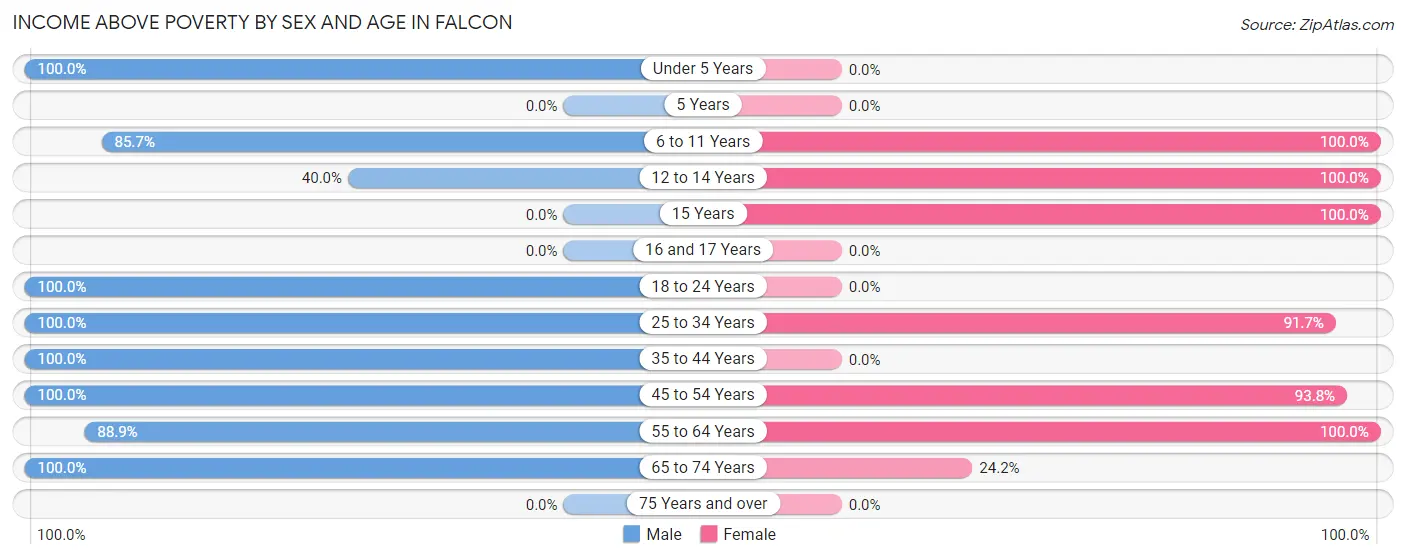
Income Above Poverty by Sex and Age in Falcon
According to the poverty statistics in Falcon, males aged under 5 years and females aged 6 to 11 years are the age groups that are most secure financially, with 100.0% of males and 100.0% of females in these age groups living above the poverty line.
| Age Bracket | Male | Female |
| Under 5 Years | 5 (100.0%) | 0 (0.0%) |
| 5 Years | 0 (0.0%) | 0 (0.0%) |
| 6 to 11 Years | 6 (85.7%) | 5 (100.0%) |
| 12 to 14 Years | 6 (40.0%) | 6 (100.0%) |
| 15 Years | 0 (0.0%) | 12 (100.0%) |
| 16 and 17 Years | 0 (0.0%) | 0 (0.0%) |
| 18 to 24 Years | 15 (100.0%) | 0 (0.0%) |
| 25 to 34 Years | 10 (100.0%) | 11 (91.7%) |
| 35 to 44 Years | 2 (100.0%) | 0 (0.0%) |
| 45 to 54 Years | 5 (100.0%) | 15 (93.8%) |
| 55 to 64 Years | 8 (88.9%) | 4 (100.0%) |
| 65 to 74 Years | 1 (100.0%) | 8 (24.2%) |
| 75 Years and over | 0 (0.0%) | 0 (0.0%) |
| Total | 58 (84.1%) | 61 (58.7%) |
Income Below Poverty Among Married-Couple Families in Falcon
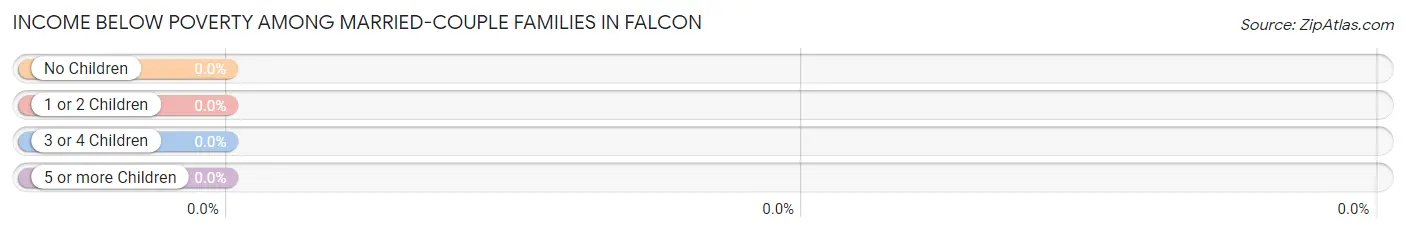
| Children | Above Poverty | Below Poverty |
| No Children | 5 (100.0%) | 0 (0.0%) |
| 1 or 2 Children | 8 (100.0%) | 0 (0.0%) |
| 3 or 4 Children | 0 (0.0%) | 0 (0.0%) |
| 5 or more Children | 0 (0.0%) | 0 (0.0%) |
| Total | 13 (100.0%) | 0 (0.0%) |
Income Below Poverty Among Single-Parent Households in Falcon
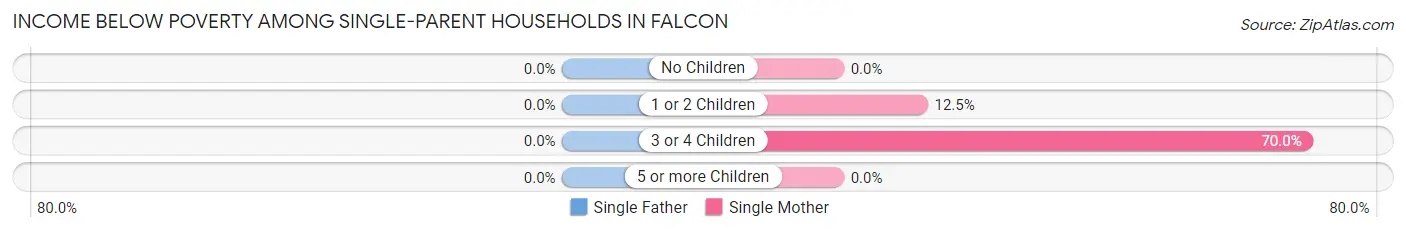
| Children | Single Father | Single Mother |
| No Children | 0 (0.0%) | 0 (0.0%) |
| 1 or 2 Children | 0 (0.0%) | 1 (12.5%) |
| 3 or 4 Children | 0 (0.0%) | 7 (70.0%) |
| 5 or more Children | 0 (0.0%) | 0 (0.0%) |
| Total | 0 (0.0%) | 8 (42.1%) |
Income Below Poverty Among Married-Couple vs Single-Parent Households in Falcon
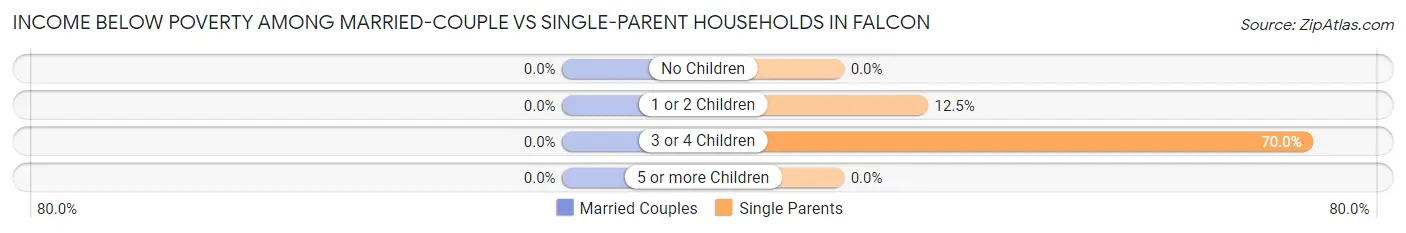
| Children | Married-Couple Families | Single-Parent Households |
| No Children | 0 (0.0%) | 0 (0.0%) |
| 1 or 2 Children | 0 (0.0%) | 1 (12.5%) |
| 3 or 4 Children | 0 (0.0%) | 7 (70.0%) |
| 5 or more Children | 0 (0.0%) | 0 (0.0%) |
| Total | 0 (0.0%) | 8 (42.1%) |
Race in Falcon
The most populous races in Falcon are , and Black / African American (173 | 100.0%).
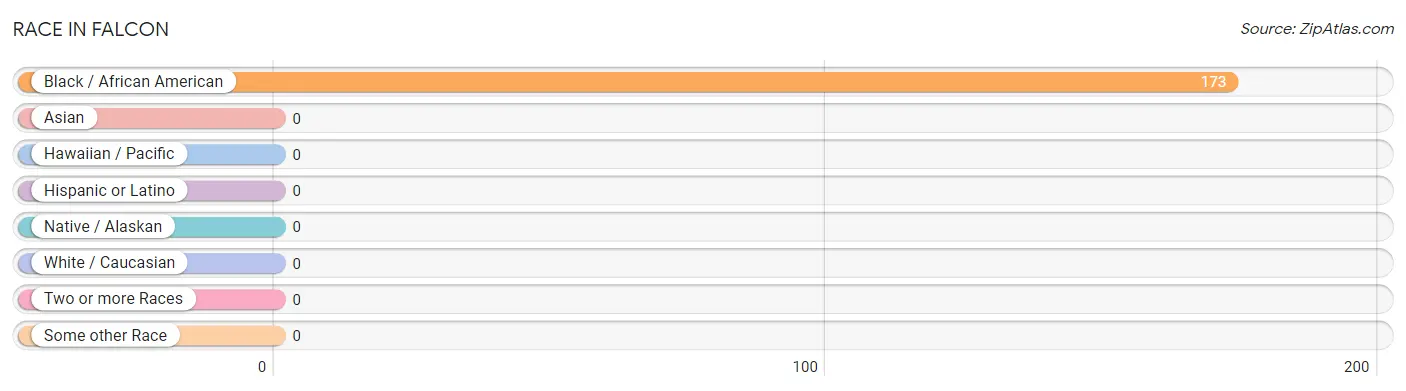
| Race | # Population | % Population |
| Asian | 0 | 0.0% |
| Black / African American | 173 | 100.0% |
| Hawaiian / Pacific | 0 | 0.0% |
| Hispanic or Latino | 0 | 0.0% |
| Native / Alaskan | 0 | 0.0% |
| White / Caucasian | 0 | 0.0% |
| Two or more Races | 0 | 0.0% |
| Some other Race | 0 | 0.0% |
| Total | 173 | 100.0% |
Ancestry in Falcon
The most populous ancestries reported in Falcon are African (3 | 1.7%), Subsaharan African (3 | 1.7%), and American (1 | 0.6%), together accounting for 4.0% of all Falcon residents.
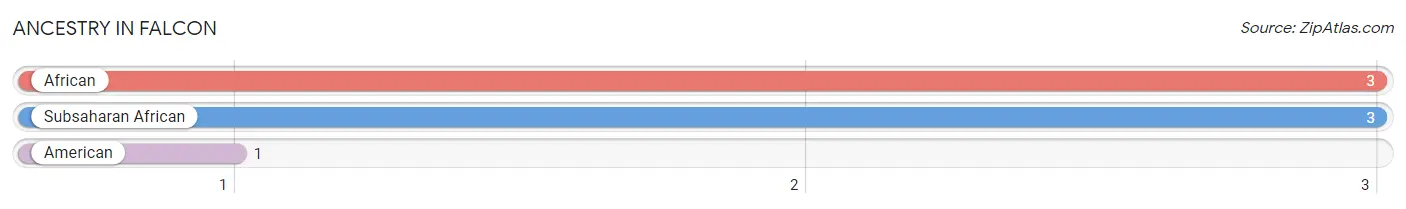
| Ancestry | # Population | % Population |
| African | 3 | 1.7% |
| American | 1 | 0.6% |
| Subsaharan African | 3 | 1.7% | View All 3 Rows |
Immigrants in Falcon

| Immigration Origin | # Population | % Population | View All 0 Rows |
Sex and Age in Falcon
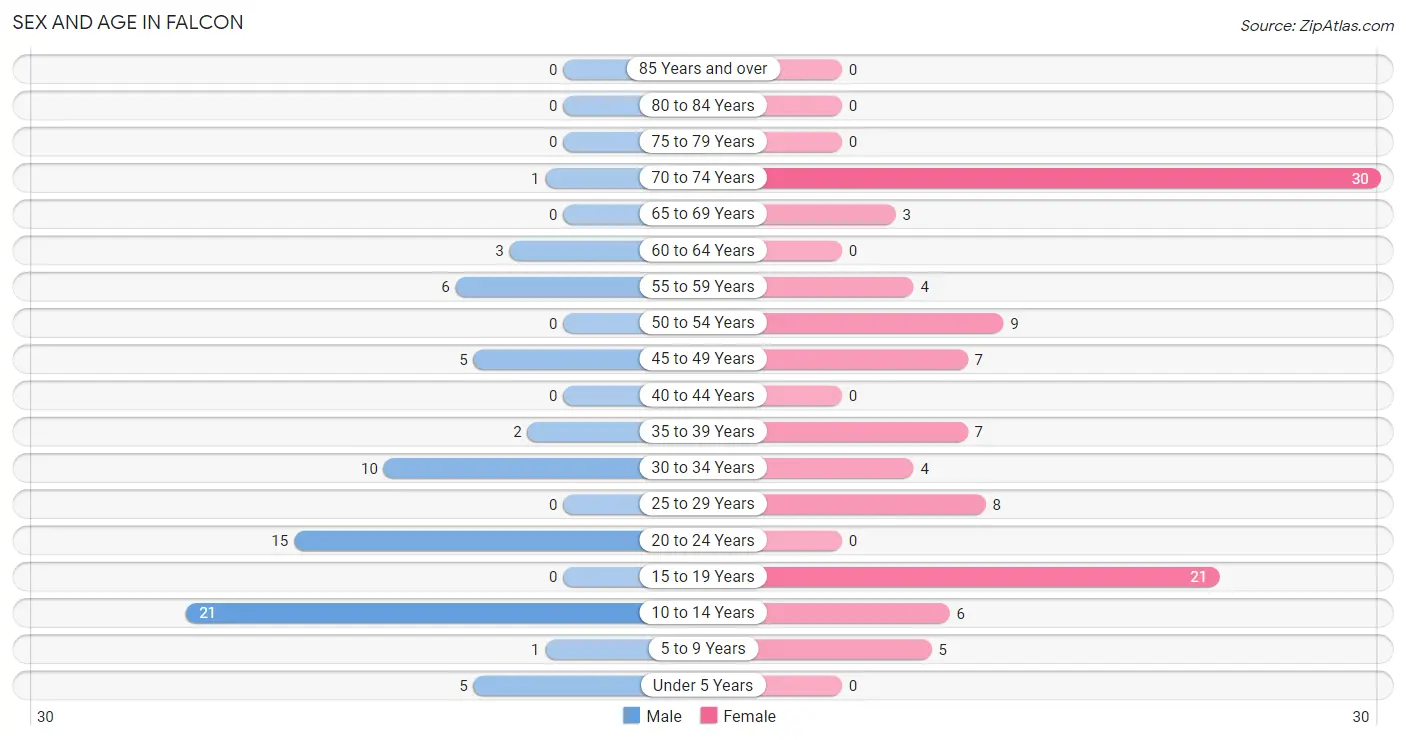
Sex and Age in Falcon
The most populous age groups in Falcon are 10 to 14 Years (21 | 30.4%) for men and 70 to 74 Years (30 | 28.8%) for women.
| Age Bracket | Male | Female |
| Under 5 Years | 5 (7.2%) | 0 (0.0%) |
| 5 to 9 Years | 1 (1.5%) | 5 (4.8%) |
| 10 to 14 Years | 21 (30.4%) | 6 (5.8%) |
| 15 to 19 Years | 0 (0.0%) | 21 (20.2%) |
| 20 to 24 Years | 15 (21.7%) | 0 (0.0%) |
| 25 to 29 Years | 0 (0.0%) | 8 (7.7%) |
| 30 to 34 Years | 10 (14.5%) | 4 (3.8%) |
| 35 to 39 Years | 2 (2.9%) | 7 (6.7%) |
| 40 to 44 Years | 0 (0.0%) | 0 (0.0%) |
| 45 to 49 Years | 5 (7.2%) | 7 (6.7%) |
| 50 to 54 Years | 0 (0.0%) | 9 (8.6%) |
| 55 to 59 Years | 6 (8.7%) | 4 (3.8%) |
| 60 to 64 Years | 3 (4.3%) | 0 (0.0%) |
| 65 to 69 Years | 0 (0.0%) | 3 (2.9%) |
| 70 to 74 Years | 1 (1.5%) | 30 (28.8%) |
| 75 to 79 Years | 0 (0.0%) | 0 (0.0%) |
| 80 to 84 Years | 0 (0.0%) | 0 (0.0%) |
| 85 Years and over | 0 (0.0%) | 0 (0.0%) |
| Total | 69 (100.0%) | 104 (100.0%) |
Families and Households in Falcon
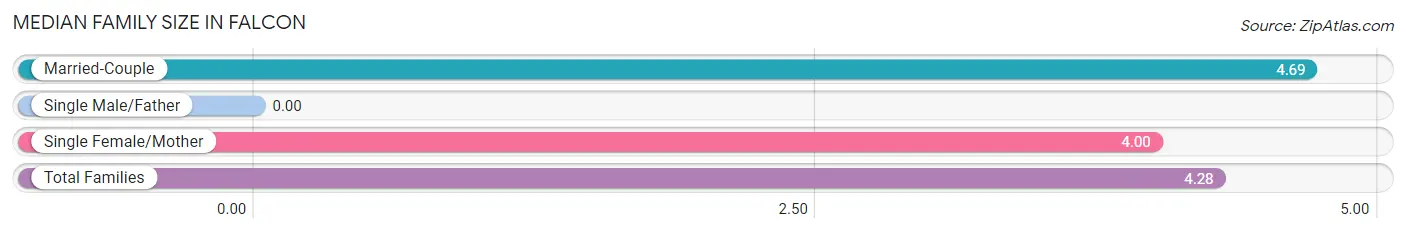
Median Family Size in Falcon
| Family Type | # Families | Family Size |
| Married-Couple | 13 (40.6%) | 4.69 |
| Single Male/Father | 0 (0.0%) | - |
| Single Female/Mother | 19 (59.4%) | 4.00 |
| Total Families | 32 (100.0%) | 4.28 |
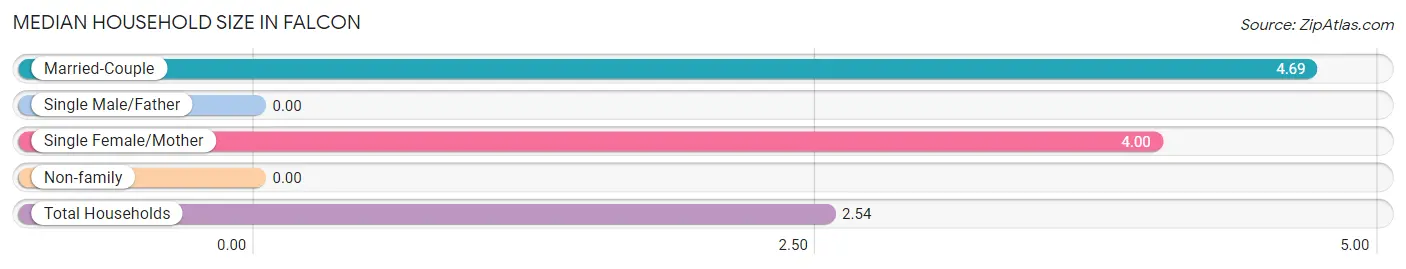
Median Household Size in Falcon
| Household Type | # Households | Household Size |
| Married-Couple | 13 (19.1%) | 4.69 |
| Single Male/Father | 0 (0.0%) | - |
| Single Female/Mother | 19 (27.9%) | 4.00 |
| Non-family | 36 (52.9%) | - |
| Total Households | 68 (100.0%) | 2.54 |
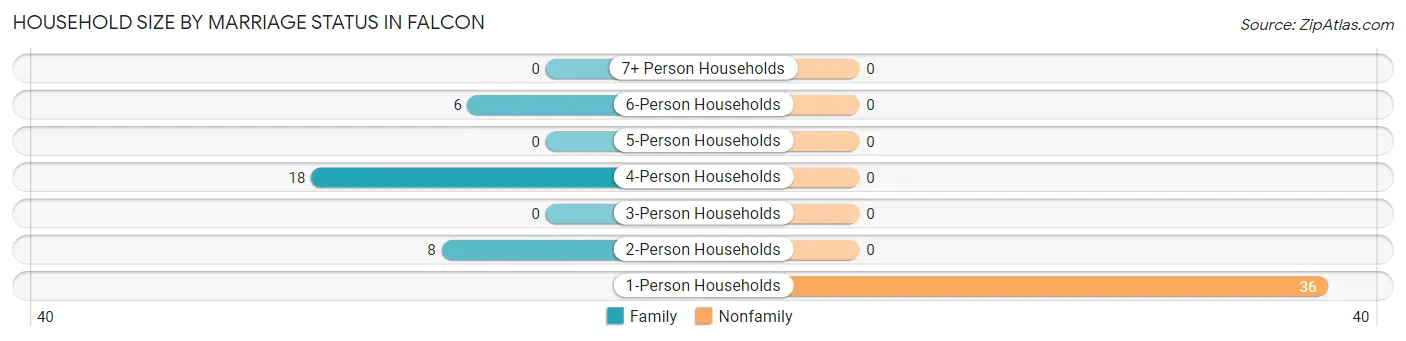
Household Size by Marriage Status in Falcon
Out of a total of 68 households in Falcon, 32 (47.1%) are family households, while 36 (52.9%) are nonfamily households. The most numerous type of family households are 4-person households, comprising 18, and the most common type of nonfamily households are 1-person households, comprising 36.
| Household Size | Family Households | Nonfamily Households |
| 1-Person Households | - | 36 (52.9%) |
| 2-Person Households | 8 (11.8%) | 0 (0.0%) |
| 3-Person Households | 0 (0.0%) | 0 (0.0%) |
| 4-Person Households | 18 (26.5%) | 0 (0.0%) |
| 5-Person Households | 0 (0.0%) | 0 (0.0%) |
| 6-Person Households | 6 (8.8%) | 0 (0.0%) |
| 7+ Person Households | 0 (0.0%) | 0 (0.0%) |
| Total | 32 (47.1%) | 36 (52.9%) |
Female Fertility in Falcon
Fertility by Age in Falcon
Average fertility rate in Falcon is 21.0 births per 1,000 women. Women in the age bracket of 35 to 50 years have the highest fertility rate with 67.0 births per 1,000 women. Women in the age bracket of 35 to 50 years acount for 100.0% of all women with births.
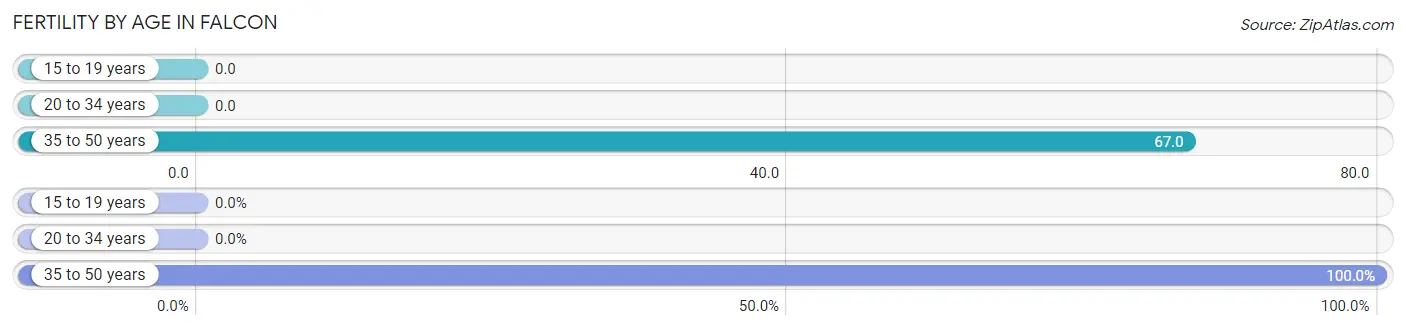
| Age Bracket | Women with Births | Births / 1,000 Women |
| 15 to 19 years | 0 (0.0%) | 0.0 |
| 20 to 34 years | 0 (0.0%) | 0.0 |
| 35 to 50 years | 1 (100.0%) | 67.0 |
| Total | 1 (100.0%) | 21.0 |
Fertility by Age by Marriage Status in Falcon
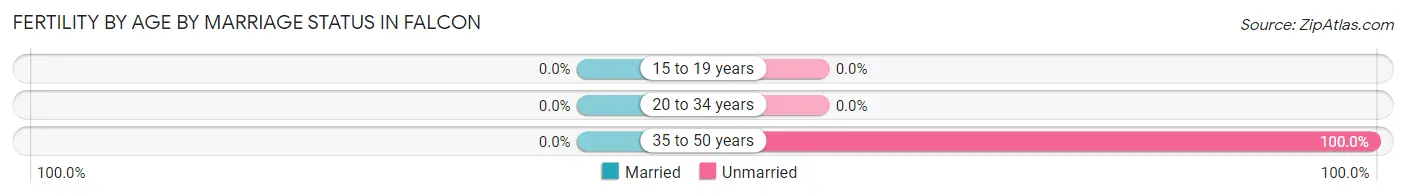
| Age Bracket | Married | Unmarried |
| 15 to 19 years | 0 (0.0%) | 0 (0.0%) |
| 20 to 34 years | 0 (0.0%) | 0 (0.0%) |
| 35 to 50 years | 0 (0.0%) | 1 (100.0%) |
| Total | 0 (0.0%) | 1 (100.0%) |
Fertility by Education in Falcon
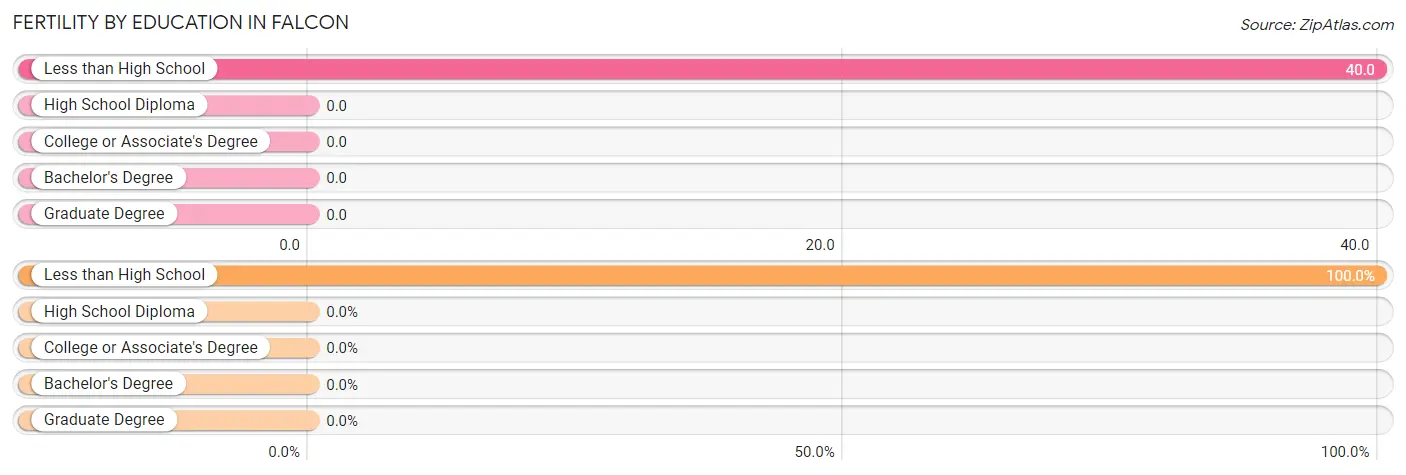
| Educational Attainment | Women with Births | Births / 1,000 Women |
| Less than High School | 1 (100.0%) | 40.0 |
| High School Diploma | 0 (0.0%) | 0.0 |
| College or Associate's Degree | 0 (0.0%) | 0.0 |
| Bachelor's Degree | 0 (0.0%) | 0.0 |
| Graduate Degree | 0 (0.0%) | 0.0 |
| Total | 1 (100.0%) | 21.0 |
Fertility by Education by Marriage Status in Falcon
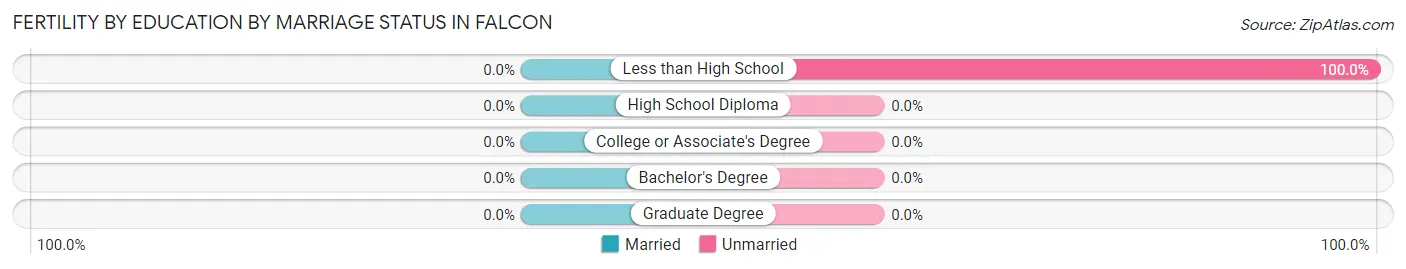
| Educational Attainment | Married | Unmarried |
| Less than High School | 0 (0.0%) | 1 (100.0%) |
| High School Diploma | 0 (0.0%) | 0 (0.0%) |
| College or Associate's Degree | 0 (0.0%) | 0 (0.0%) |
| Bachelor's Degree | 0 (0.0%) | 0 (0.0%) |
| Graduate Degree | 0 (0.0%) | 0 (0.0%) |
| Total | 0 (0.0%) | 1 (100.0%) |
Employment Characteristics in Falcon
Employment by Class of Employer in Falcon
Among the 49 employed individuals in Falcon, private company employees (34 | 69.4%), not-for-profit organizations (7 | 14.3%), and local government employees (5 | 10.2%) make up the most common classes of employment.
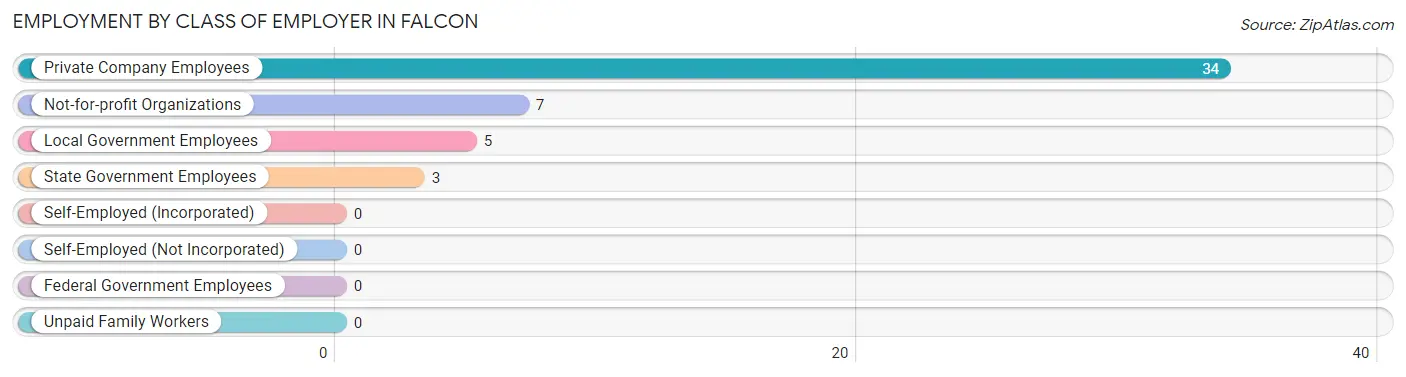
| Employer Class | # Employees | % Employees |
| Private Company Employees | 34 | 69.4% |
| Self-Employed (Incorporated) | 0 | 0.0% |
| Self-Employed (Not Incorporated) | 0 | 0.0% |
| Not-for-profit Organizations | 7 | 14.3% |
| Local Government Employees | 5 | 10.2% |
| State Government Employees | 3 | 6.1% |
| Federal Government Employees | 0 | 0.0% |
| Unpaid Family Workers | 0 | 0.0% |
| Total | 49 | 100.0% |
Employment Status by Age in Falcon
According to the labor force statistics for Falcon, out of the total population over 16 years of age (123), 41.5% or 51 individuals are in the labor force, with 3.9% or 2 of them unemployed. The age group with the highest labor force participation rate is 35 to 44 years, with 100.0% or 9 individuals in the labor force. Within the labor force, the 30 to 34 years age range has the highest percentage of unemployed individuals, with 18.2% or 2 of them being unemployed.
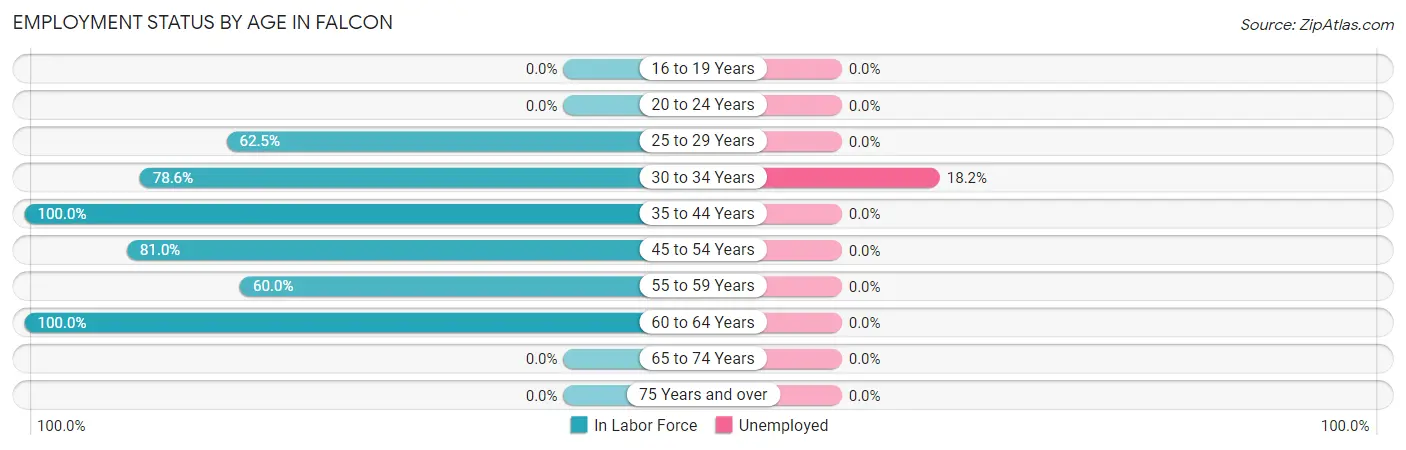
| Age Bracket | In Labor Force | Unemployed |
| 16 to 19 Years | 0 (0.0%) | 0 (0.0%) |
| 20 to 24 Years | 0 (0.0%) | 0 (0.0%) |
| 25 to 29 Years | 5 (62.5%) | 0 (0.0%) |
| 30 to 34 Years | 11 (78.6%) | 2 (18.2%) |
| 35 to 44 Years | 9 (100.0%) | 0 (0.0%) |
| 45 to 54 Years | 17 (81.0%) | 0 (0.0%) |
| 55 to 59 Years | 6 (60.0%) | 0 (0.0%) |
| 60 to 64 Years | 3 (100.0%) | 0 (0.0%) |
| 65 to 74 Years | 0 (0.0%) | 0 (0.0%) |
| 75 Years and over | 0 (0.0%) | 0 (0.0%) |
| Total | 51 (41.5%) | 2 (3.9%) |
Employment Status by Educational Attainment in Falcon
According to labor force statistics for Falcon, 78.5% of individuals (51) out of the total population between 25 and 64 years of age (65) are in the labor force, with 3.9% or 2 of them being unemployed. The group with the highest labor force participation rate are those with the educational attainment of bachelor's degree or higher, with 100.0% or 3 individuals in the labor force. Within the labor force, individuals with college / associate degree education have the highest percentage of unemployment, with 7.4% or 2 of them being unemployed.
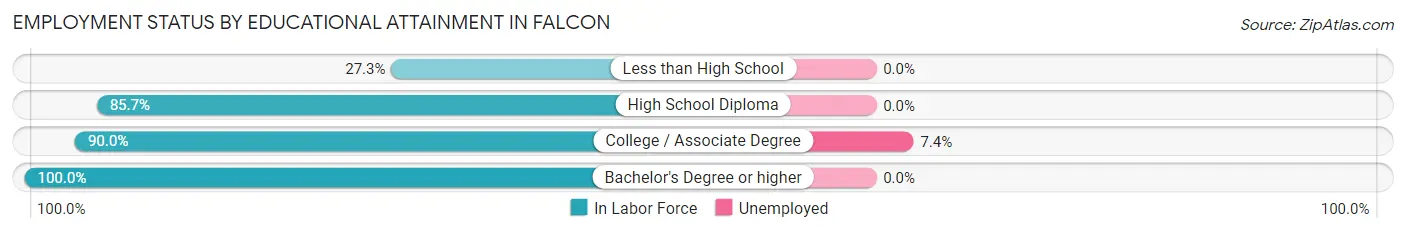
| Educational Attainment | In Labor Force | Unemployed |
| Less than High School | 3 (27.3%) | 0 (0.0%) |
| High School Diploma | 18 (85.7%) | 0 (0.0%) |
| College / Associate Degree | 27 (90.0%) | 2 (7.4%) |
| Bachelor's Degree or higher | 3 (100.0%) | 0 (0.0%) |
| Total | 51 (78.5%) | 3 (3.9%) |
Employment Occupations by Sex in Falcon
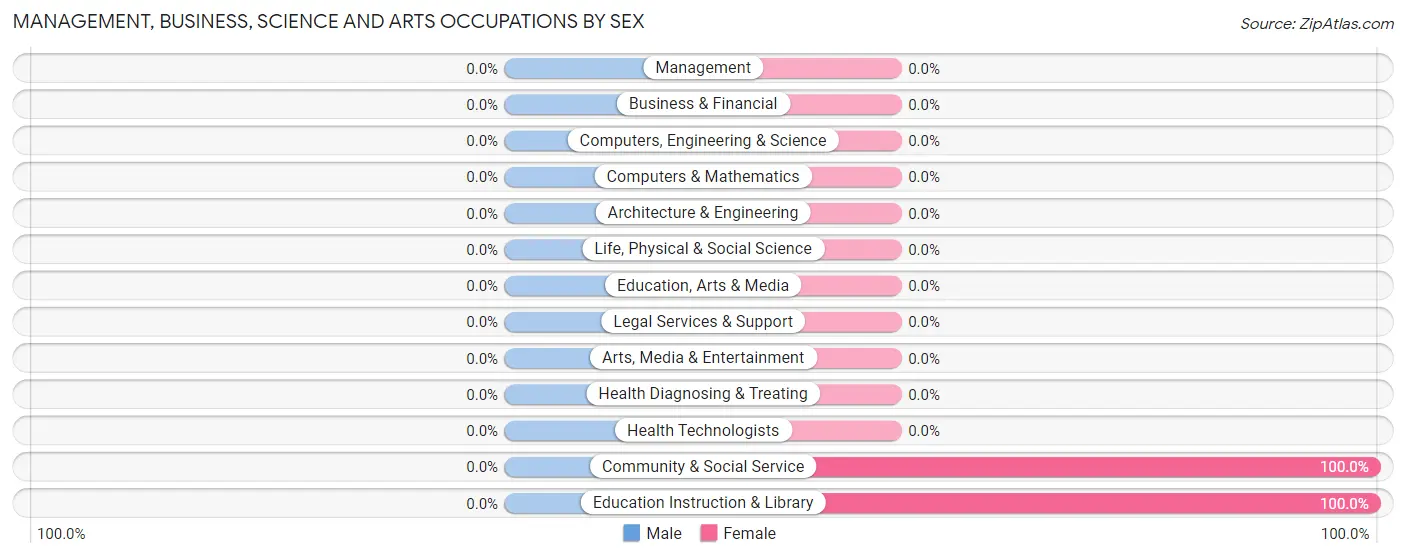
Management, Business, Science and Arts Occupations
The most common Management, Business, Science and Arts occupations in Falcon are Community & Social Service (7 | 14.3%), and Education Instruction & Library (7 | 14.3%).
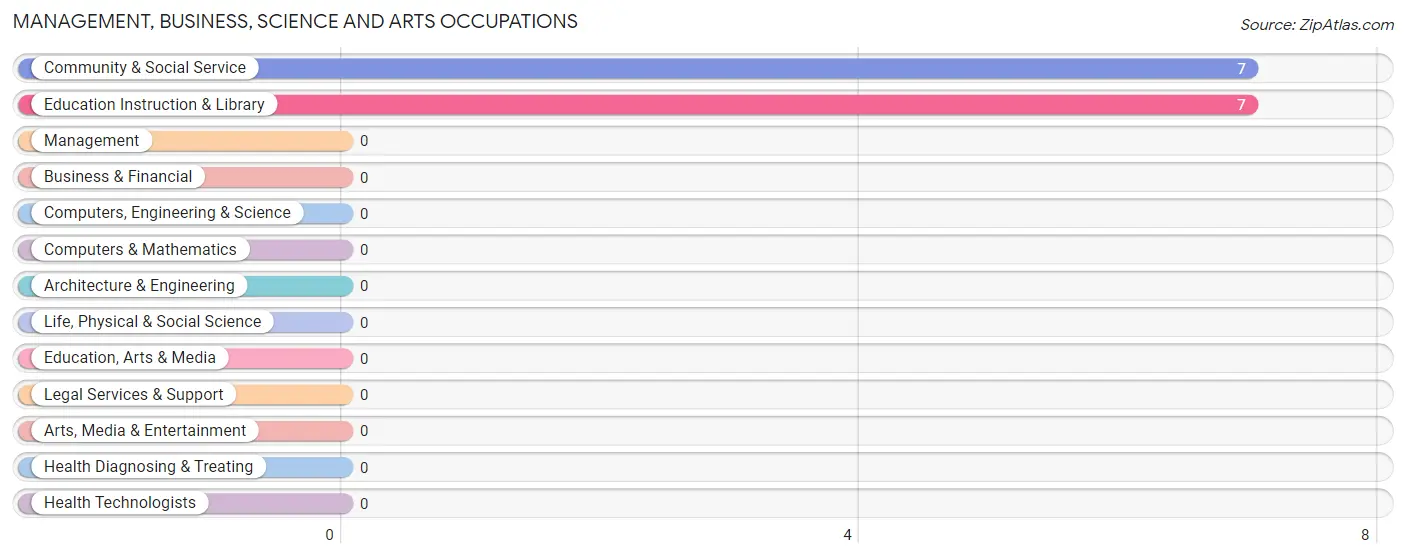
Management, Business, Science and Arts Occupations by Sex
| Occupation | Male | Female |
| Management | 0 (0.0%) | 0 (0.0%) |
| Business & Financial | 0 (0.0%) | 0 (0.0%) |
| Computers, Engineering & Science | 0 (0.0%) | 0 (0.0%) |
| Computers & Mathematics | 0 (0.0%) | 0 (0.0%) |
| Architecture & Engineering | 0 (0.0%) | 0 (0.0%) |
| Life, Physical & Social Science | 0 (0.0%) | 0 (0.0%) |
| Community & Social Service | 0 (0.0%) | 7 (100.0%) |
| Education, Arts & Media | 0 (0.0%) | 0 (0.0%) |
| Legal Services & Support | 0 (0.0%) | 0 (0.0%) |
| Education Instruction & Library | 0 (0.0%) | 7 (100.0%) |
| Arts, Media & Entertainment | 0 (0.0%) | 0 (0.0%) |
| Health Diagnosing & Treating | 0 (0.0%) | 0 (0.0%) |
| Health Technologists | 0 (0.0%) | 0 (0.0%) |
| Total (Category) | 0 (0.0%) | 7 (100.0%) |
| Total (Overall) | 20 (40.8%) | 29 (59.2%) |
Services Occupations
The most common Services occupations in Falcon are , and Healthcare Support (4 | 8.2%).
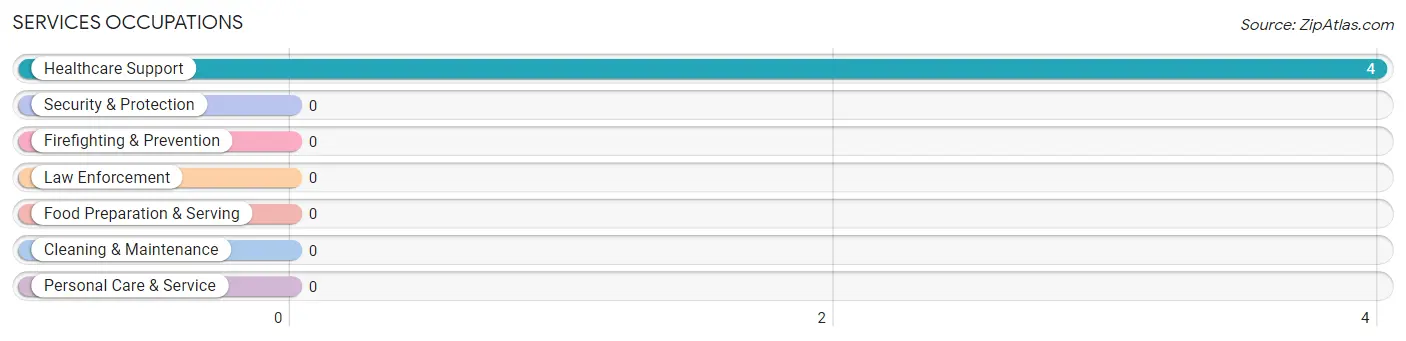
Services Occupations by Sex
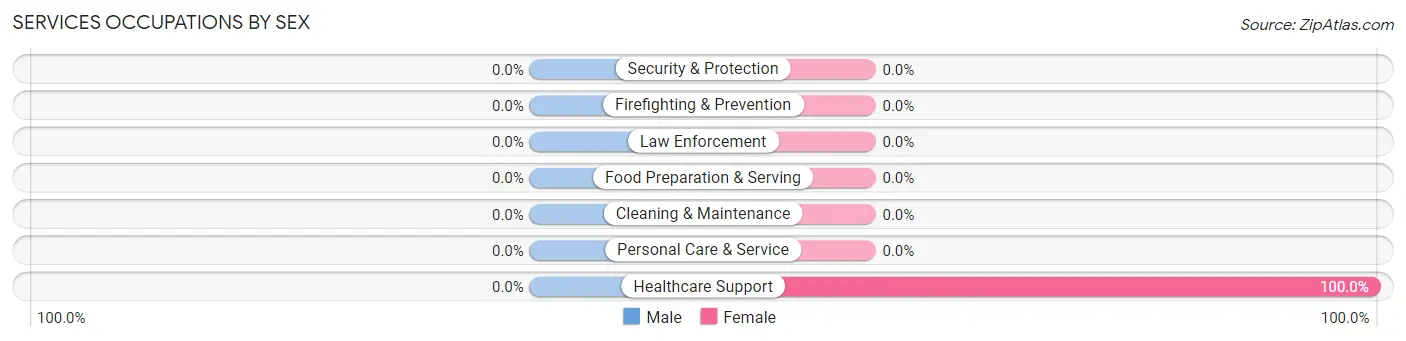
| Occupation | Male | Female |
| Healthcare Support | 0 (0.0%) | 4 (100.0%) |
| Security & Protection | 0 (0.0%) | 0 (0.0%) |
| Firefighting & Prevention | 0 (0.0%) | 0 (0.0%) |
| Law Enforcement | 0 (0.0%) | 0 (0.0%) |
| Food Preparation & Serving | 0 (0.0%) | 0 (0.0%) |
| Cleaning & Maintenance | 0 (0.0%) | 0 (0.0%) |
| Personal Care & Service | 0 (0.0%) | 0 (0.0%) |
| Total (Category) | 0 (0.0%) | 4 (100.0%) |
| Total (Overall) | 20 (40.8%) | 29 (59.2%) |
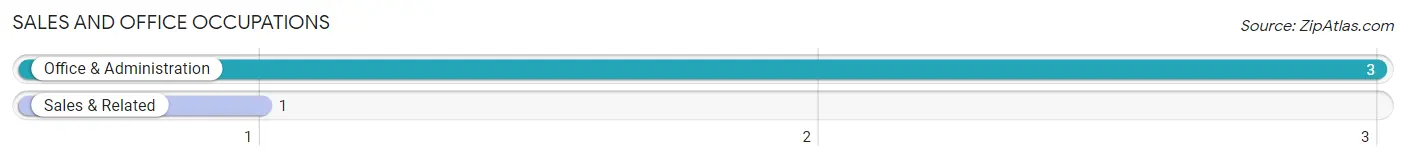
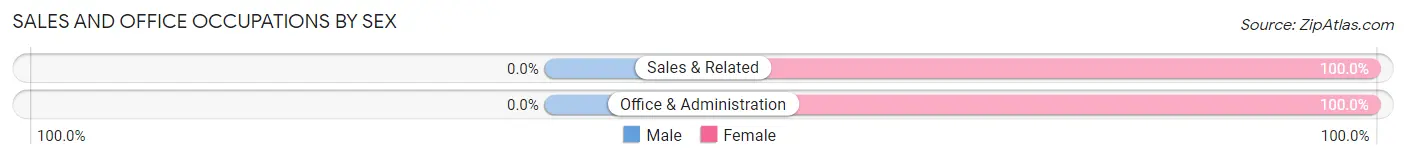
Sales and Office Occupations
The most common Sales and Office occupations in Falcon are Office & Administration (3 | 6.1%), and Sales & Related (1 | 2.0%).
Sales and Office Occupations by Sex
| Occupation | Male | Female |
| Sales & Related | 0 (0.0%) | 1 (100.0%) |
| Office & Administration | 0 (0.0%) | 3 (100.0%) |
| Total (Category) | 0 (0.0%) | 4 (100.0%) |
| Total (Overall) | 20 (40.8%) | 29 (59.2%) |
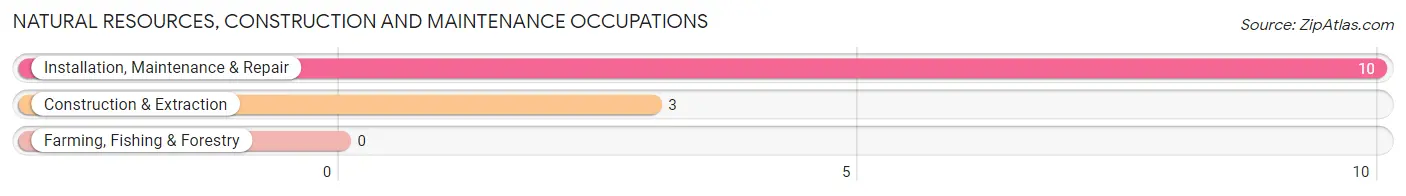
Natural Resources, Construction and Maintenance Occupations
The most common Natural Resources, Construction and Maintenance occupations in Falcon are Installation, Maintenance & Repair (10 | 20.4%), and Construction & Extraction (3 | 6.1%).
Natural Resources, Construction and Maintenance Occupations by Sex
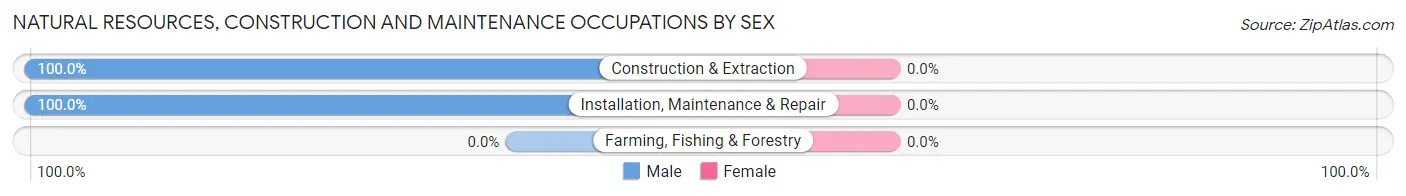
| Occupation | Male | Female |
| Farming, Fishing & Forestry | 0 (0.0%) | 0 (0.0%) |
| Construction & Extraction | 3 (100.0%) | 0 (0.0%) |
| Installation, Maintenance & Repair | 10 (100.0%) | 0 (0.0%) |
| Total (Category) | 13 (100.0%) | 0 (0.0%) |
| Total (Overall) | 20 (40.8%) | 29 (59.2%) |
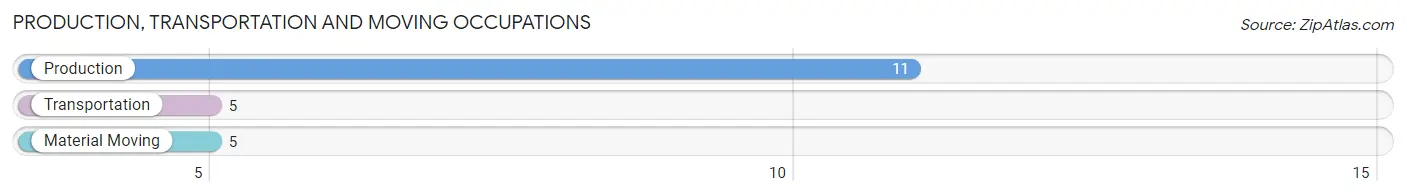
Production, Transportation and Moving Occupations
The most common Production, Transportation and Moving occupations in Falcon are Production (11 | 22.5%), Transportation (5 | 10.2%), and Material Moving (5 | 10.2%).
Production, Transportation and Moving Occupations by Sex
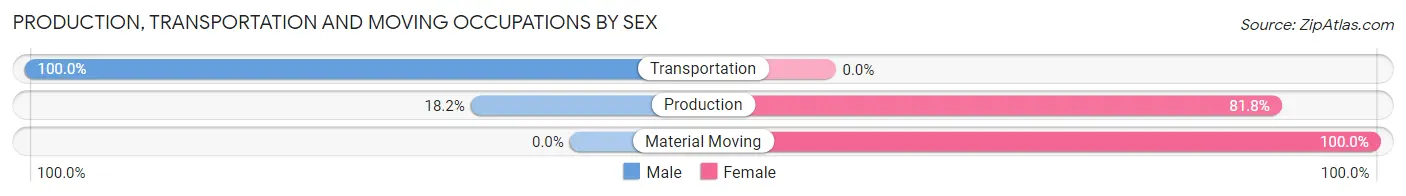
| Occupation | Male | Female |
| Production | 2 (18.2%) | 9 (81.8%) |
| Transportation | 5 (100.0%) | 0 (0.0%) |
| Material Moving | 0 (0.0%) | 5 (100.0%) |
| Total (Category) | 7 (33.3%) | 14 (66.7%) |
| Total (Overall) | 20 (40.8%) | 29 (59.2%) |
Employment Industries by Sex in Falcon
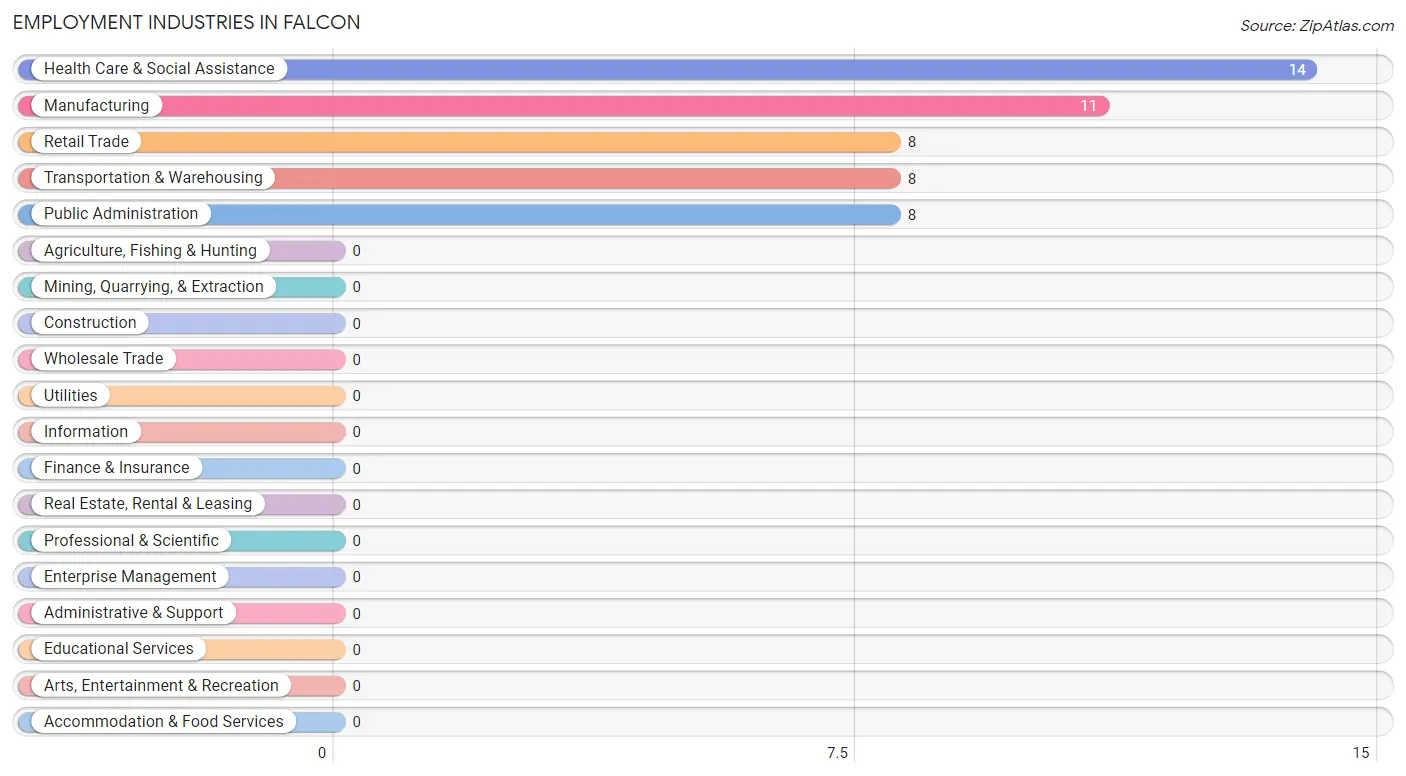
Employment Industries in Falcon
The major employment industries in Falcon include Health Care & Social Assistance (14 | 28.6%), Manufacturing (11 | 22.5%), Retail Trade (8 | 16.3%), Transportation & Warehousing (8 | 16.3%), and Public Administration (8 | 16.3%).
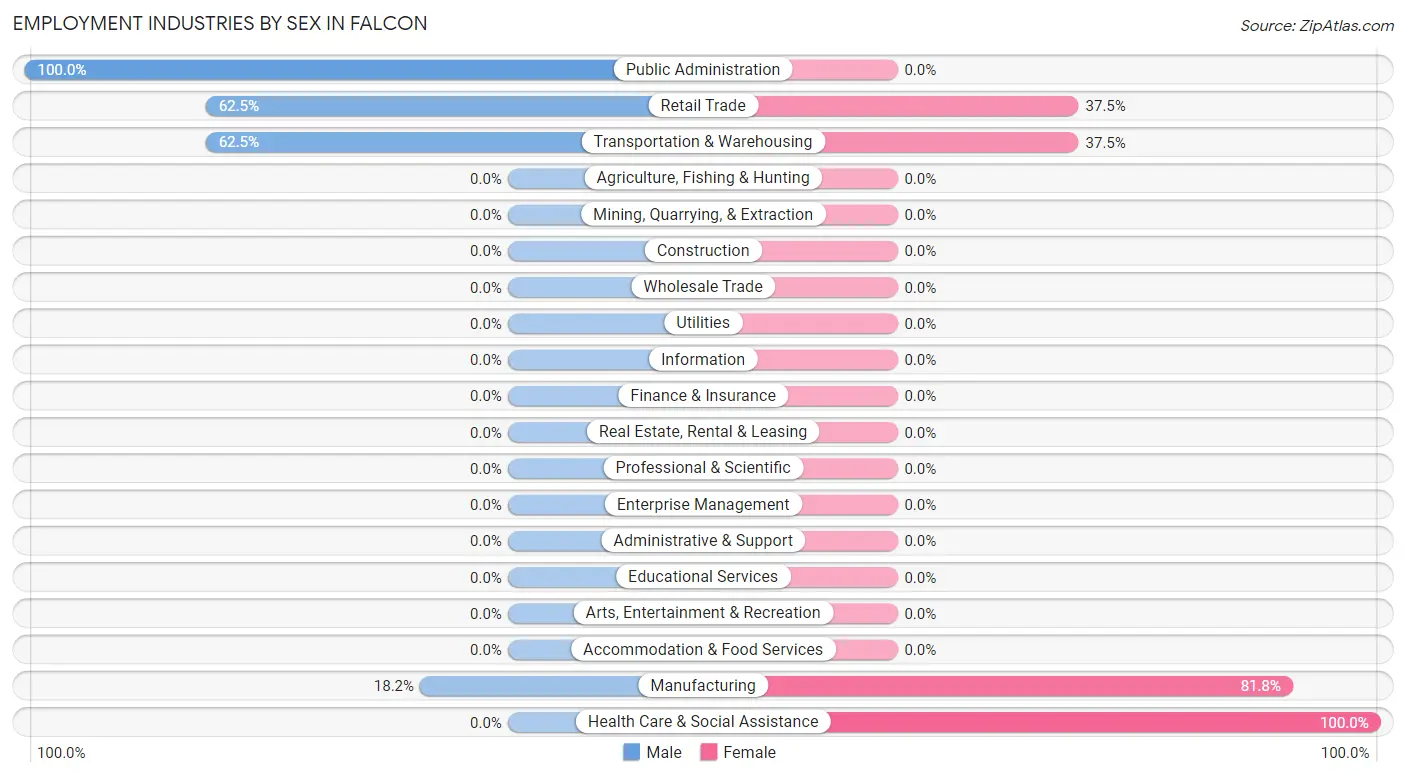
Employment Industries by Sex in Falcon
The Falcon industries that see more men than women are Public Administration (100.0%), Retail Trade (62.5%), and Transportation & Warehousing (62.5%), whereas the industries that tend to have a higher number of women are Health Care & Social Assistance (100.0%), Manufacturing (81.8%), and Retail Trade (37.5%).
| Industry | Male | Female |
| Agriculture, Fishing & Hunting | 0 (0.0%) | 0 (0.0%) |
| Mining, Quarrying, & Extraction | 0 (0.0%) | 0 (0.0%) |
| Construction | 0 (0.0%) | 0 (0.0%) |
| Manufacturing | 2 (18.2%) | 9 (81.8%) |
| Wholesale Trade | 0 (0.0%) | 0 (0.0%) |
| Retail Trade | 5 (62.5%) | 3 (37.5%) |
| Transportation & Warehousing | 5 (62.5%) | 3 (37.5%) |
| Utilities | 0 (0.0%) | 0 (0.0%) |
| Information | 0 (0.0%) | 0 (0.0%) |
| Finance & Insurance | 0 (0.0%) | 0 (0.0%) |
| Real Estate, Rental & Leasing | 0 (0.0%) | 0 (0.0%) |
| Professional & Scientific | 0 (0.0%) | 0 (0.0%) |
| Enterprise Management | 0 (0.0%) | 0 (0.0%) |
| Administrative & Support | 0 (0.0%) | 0 (0.0%) |
| Educational Services | 0 (0.0%) | 0 (0.0%) |
| Health Care & Social Assistance | 0 (0.0%) | 14 (100.0%) |
| Arts, Entertainment & Recreation | 0 (0.0%) | 0 (0.0%) |
| Accommodation & Food Services | 0 (0.0%) | 0 (0.0%) |
| Public Administration | 8 (100.0%) | 0 (0.0%) |
| Total | 20 (40.8%) | 29 (59.2%) |
Education in Falcon
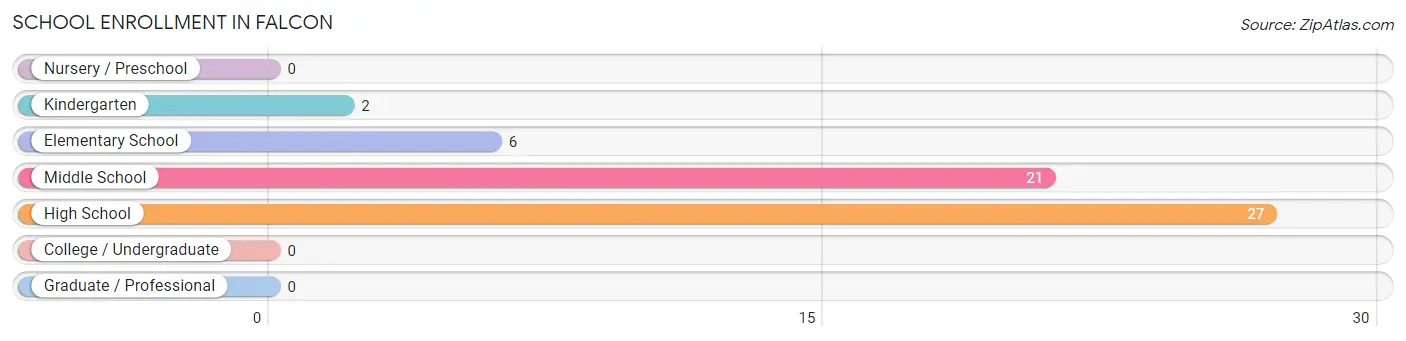
School Enrollment in Falcon
The most common levels of schooling among the 56 students in Falcon are high school (27 | 48.2%), middle school (21 | 37.5%), and elementary school (6 | 10.7%).
| School Level | # Students | % Students |
| Nursery / Preschool | 0 | 0.0% |
| Kindergarten | 2 | 3.6% |
| Elementary School | 6 | 10.7% |
| Middle School | 21 | 37.5% |
| High School | 27 | 48.2% |
| College / Undergraduate | 0 | 0.0% |
| Graduate / Professional | 0 | 0.0% |
| Total | 56 | 100.0% |
School Enrollment by Age by Funding Source in Falcon
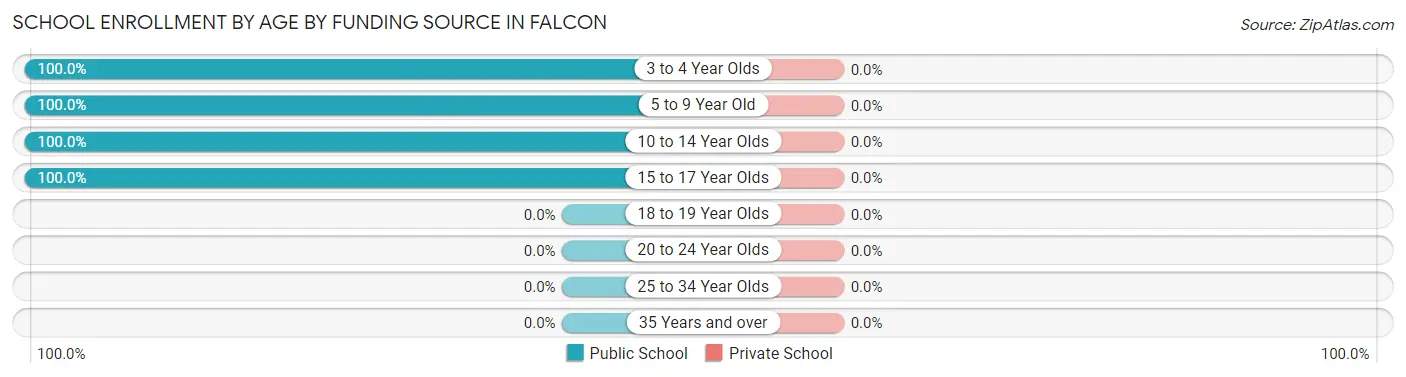
| Age Bracket | Public School | Private School |
| 3 to 4 Year Olds | 2 (100.0%) | 0 (0.0%) |
| 5 to 9 Year Old | 6 (100.0%) | 0 (0.0%) |
| 10 to 14 Year Olds | 27 (100.0%) | 0 (0.0%) |
| 15 to 17 Year Olds | 21 (100.0%) | 0 (0.0%) |
| 18 to 19 Year Olds | 0 (0.0%) | 0 (0.0%) |
| 20 to 24 Year Olds | 0 (0.0%) | 0 (0.0%) |
| 25 to 34 Year Olds | 0 (0.0%) | 0 (0.0%) |
| 35 Years and over | 0 (0.0%) | 0 (0.0%) |
| Total | 56 (100.0%) | 0 (0.0%) |
Educational Attainment by Field of Study in Falcon
Education (3 | 50.0%), computers & mathematics (2 | 33.3%), and business (1 | 16.7%) are the most common fields of study among 6 individuals in Falcon who have obtained a bachelor's degree or higher.
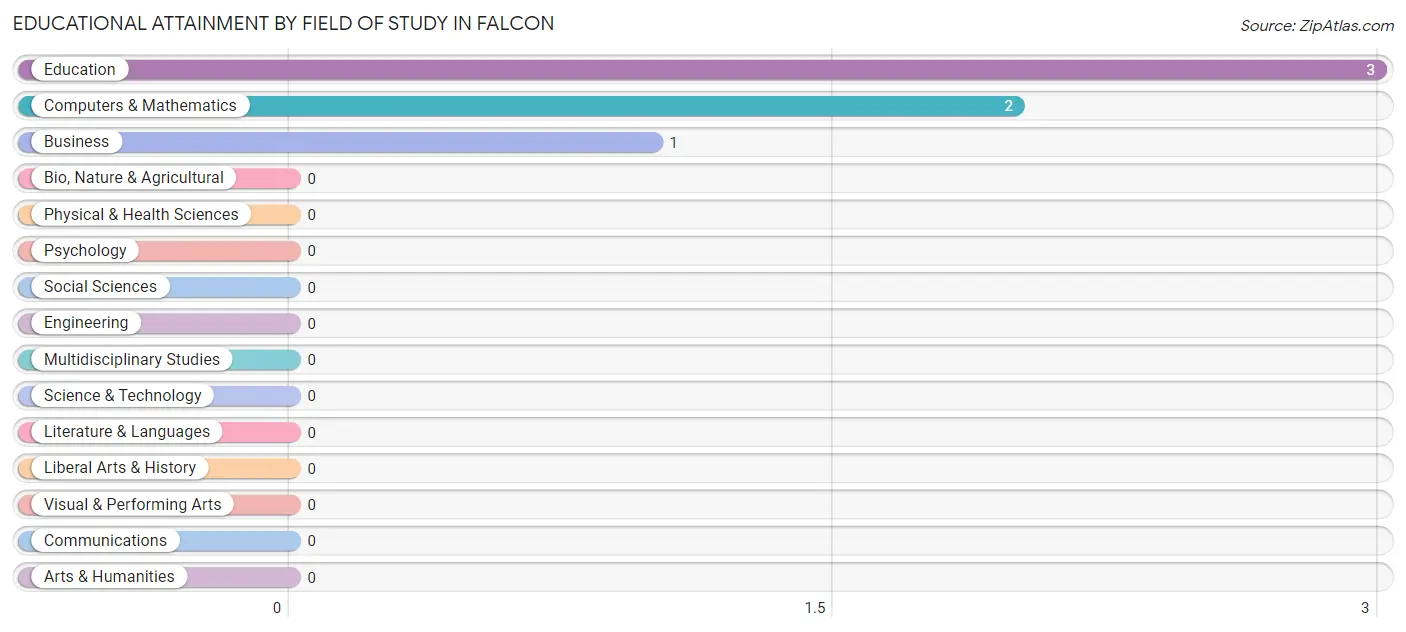
| Field of Study | # Graduates | % Graduates |
| Computers & Mathematics | 2 | 33.3% |
| Bio, Nature & Agricultural | 0 | 0.0% |
| Physical & Health Sciences | 0 | 0.0% |
| Psychology | 0 | 0.0% |
| Social Sciences | 0 | 0.0% |
| Engineering | 0 | 0.0% |
| Multidisciplinary Studies | 0 | 0.0% |
| Science & Technology | 0 | 0.0% |
| Business | 1 | 16.7% |
| Education | 3 | 50.0% |
| Literature & Languages | 0 | 0.0% |
| Liberal Arts & History | 0 | 0.0% |
| Visual & Performing Arts | 0 | 0.0% |
| Communications | 0 | 0.0% |
| Arts & Humanities | 0 | 0.0% |
| Total | 6 | 100.0% |
Transportation & Commute in Falcon
Vehicle Availability by Sex in Falcon
The most prevalent vehicle ownership categories in Falcon are males with 3 vehicles (10, accounting for 50.0%) and females with 3 vehicles (4, making up 34.5%).
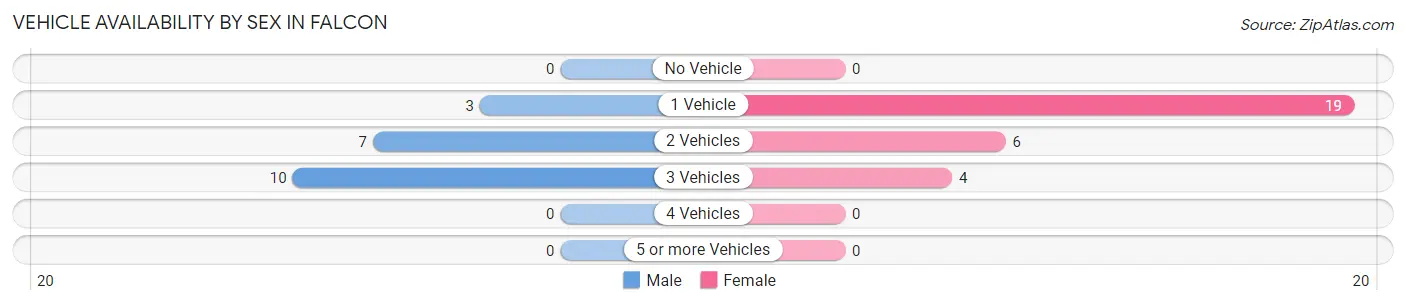
| Vehicles Available | Male | Female |
| No Vehicle | 0 (0.0%) | 0 (0.0%) |
| 1 Vehicle | 3 (15.0%) | 19 (65.5%) |
| 2 Vehicles | 7 (35.0%) | 6 (20.7%) |
| 3 Vehicles | 10 (50.0%) | 4 (13.8%) |
| 4 Vehicles | 0 (0.0%) | 0 (0.0%) |
| 5 or more Vehicles | 0 (0.0%) | 0 (0.0%) |
| Total | 20 (100.0%) | 29 (100.0%) |
Commute Time in Falcon
The most frequently occuring commute durations in Falcon are 30 to 34 minutes (16 commuters, 32.7%), 60 to 89 minutes (9 commuters, 18.4%), and 35 to 39 minutes (8 commuters, 16.3%).
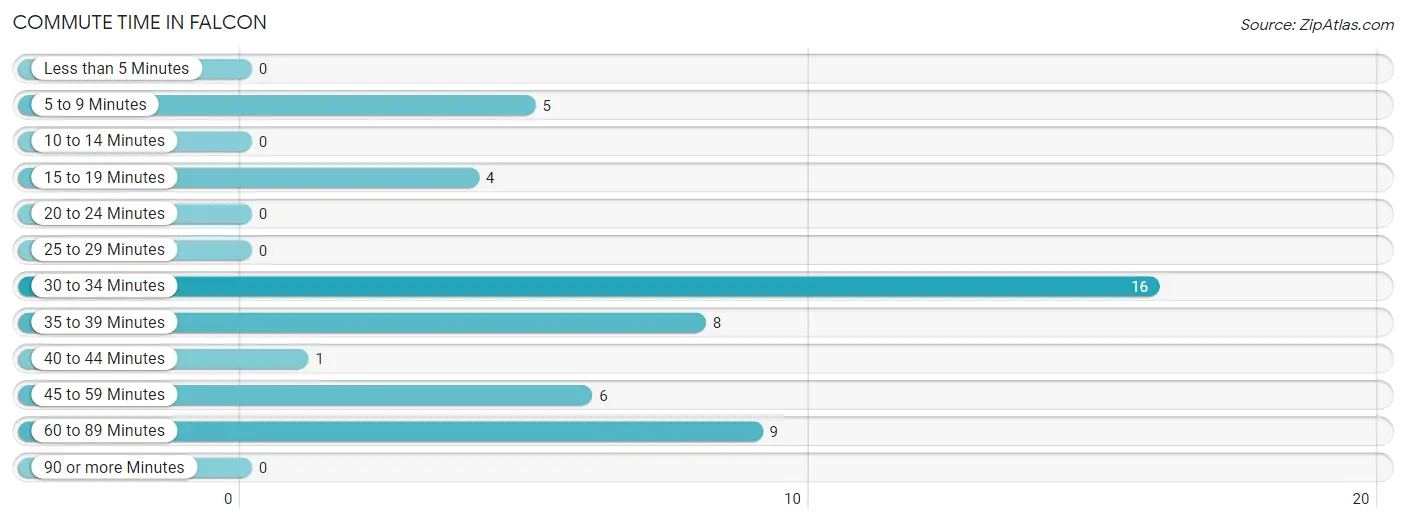
| Commute Time | # Commuters | % Commuters |
| Less than 5 Minutes | 0 | 0.0% |
| 5 to 9 Minutes | 5 | 10.2% |
| 10 to 14 Minutes | 0 | 0.0% |
| 15 to 19 Minutes | 4 | 8.2% |
| 20 to 24 Minutes | 0 | 0.0% |
| 25 to 29 Minutes | 0 | 0.0% |
| 30 to 34 Minutes | 16 | 32.7% |
| 35 to 39 Minutes | 8 | 16.3% |
| 40 to 44 Minutes | 1 | 2.0% |
| 45 to 59 Minutes | 6 | 12.2% |
| 60 to 89 Minutes | 9 | 18.4% |
| 90 or more Minutes | 0 | 0.0% |
Commute Time by Sex in Falcon
The most common commute times in Falcon are 5 to 9 minutes (5 commuters, 25.0%) for males and 30 to 34 minutes (14 commuters, 48.3%) for females.
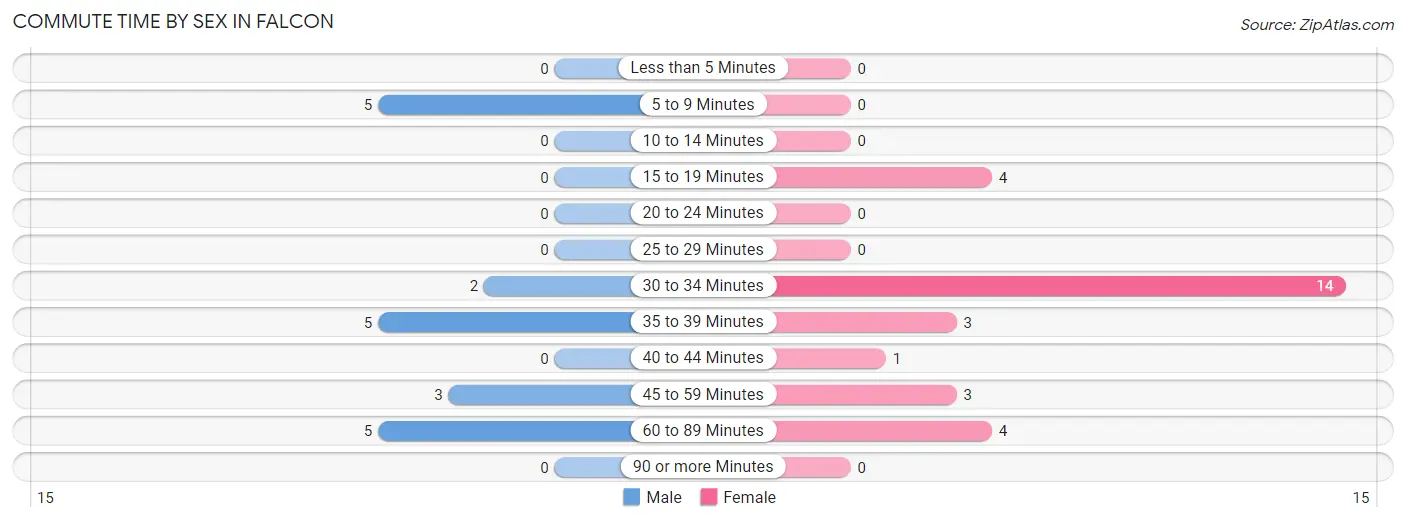
| Commute Time | Male | Female |
| Less than 5 Minutes | 0 (0.0%) | 0 (0.0%) |
| 5 to 9 Minutes | 5 (25.0%) | 0 (0.0%) |
| 10 to 14 Minutes | 0 (0.0%) | 0 (0.0%) |
| 15 to 19 Minutes | 0 (0.0%) | 4 (13.8%) |
| 20 to 24 Minutes | 0 (0.0%) | 0 (0.0%) |
| 25 to 29 Minutes | 0 (0.0%) | 0 (0.0%) |
| 30 to 34 Minutes | 2 (10.0%) | 14 (48.3%) |
| 35 to 39 Minutes | 5 (25.0%) | 3 (10.3%) |
| 40 to 44 Minutes | 0 (0.0%) | 1 (3.5%) |
| 45 to 59 Minutes | 3 (15.0%) | 3 (10.3%) |
| 60 to 89 Minutes | 5 (25.0%) | 4 (13.8%) |
| 90 or more Minutes | 0 (0.0%) | 0 (0.0%) |
Time of Departure to Work by Sex in Falcon
The most frequent times of departure to work in Falcon are 6:30 AM to 6:59 AM (7, 35.0%) for males and 7:00 AM to 7:29 AM (14, 48.3%) for females.
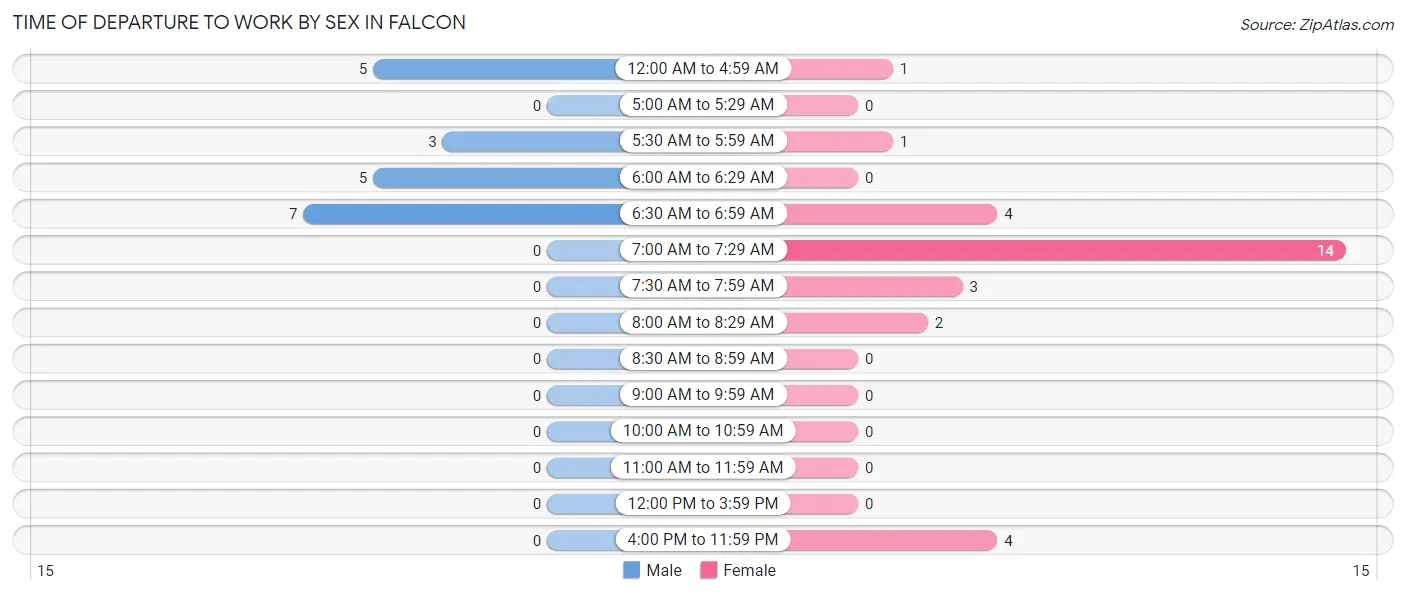
| Time of Departure | Male | Female |
| 12:00 AM to 4:59 AM | 5 (25.0%) | 1 (3.5%) |
| 5:00 AM to 5:29 AM | 0 (0.0%) | 0 (0.0%) |
| 5:30 AM to 5:59 AM | 3 (15.0%) | 1 (3.5%) |
| 6:00 AM to 6:29 AM | 5 (25.0%) | 0 (0.0%) |
| 6:30 AM to 6:59 AM | 7 (35.0%) | 4 (13.8%) |
| 7:00 AM to 7:29 AM | 0 (0.0%) | 14 (48.3%) |
| 7:30 AM to 7:59 AM | 0 (0.0%) | 3 (10.3%) |
| 8:00 AM to 8:29 AM | 0 (0.0%) | 2 (6.9%) |
| 8:30 AM to 8:59 AM | 0 (0.0%) | 0 (0.0%) |
| 9:00 AM to 9:59 AM | 0 (0.0%) | 0 (0.0%) |
| 10:00 AM to 10:59 AM | 0 (0.0%) | 0 (0.0%) |
| 11:00 AM to 11:59 AM | 0 (0.0%) | 0 (0.0%) |
| 12:00 PM to 3:59 PM | 0 (0.0%) | 0 (0.0%) |
| 4:00 PM to 11:59 PM | 0 (0.0%) | 4 (13.8%) |
| Total | 20 (100.0%) | 29 (100.0%) |
Housing Occupancy in Falcon
Occupancy by Ownership in Falcon
Of the total 68 dwellings in Falcon, owner-occupied units account for 44 (64.7%), while renter-occupied units make up 24 (35.3%).
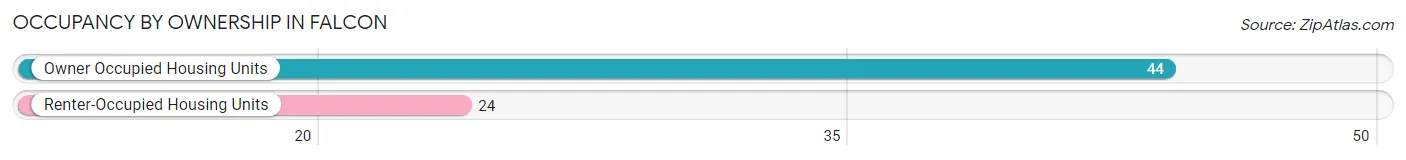
| Occupancy | # Housing Units | % Housing Units |
| Owner Occupied Housing Units | 44 | 64.7% |
| Renter-Occupied Housing Units | 24 | 35.3% |
| Total Occupied Housing Units | 68 | 100.0% |
Occupancy by Household Size in Falcon
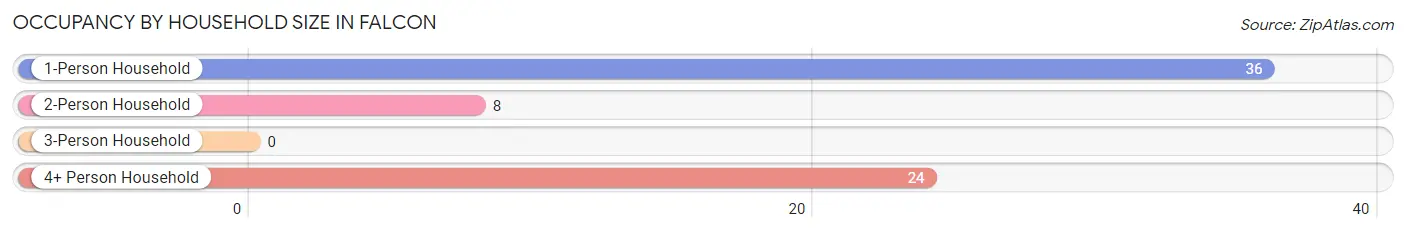
| Household Size | # Housing Units | % Housing Units |
| 1-Person Household | 36 | 52.9% |
| 2-Person Household | 8 | 11.8% |
| 3-Person Household | 0 | 0.0% |
| 4+ Person Household | 24 | 35.3% |
| Total Housing Units | 68 | 100.0% |
Occupancy by Ownership by Household Size in Falcon
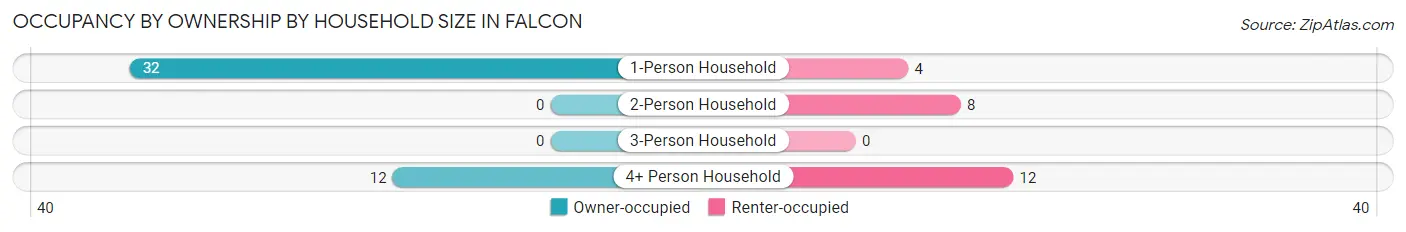
| Household Size | Owner-occupied | Renter-occupied |
| 1-Person Household | 32 (88.9%) | 4 (11.1%) |
| 2-Person Household | 0 (0.0%) | 8 (100.0%) |
| 3-Person Household | 0 (0.0%) | 0 (0.0%) |
| 4+ Person Household | 12 (50.0%) | 12 (50.0%) |
| Total Housing Units | 44 (64.7%) | 24 (35.3%) |
Occupancy by Educational Attainment in Falcon
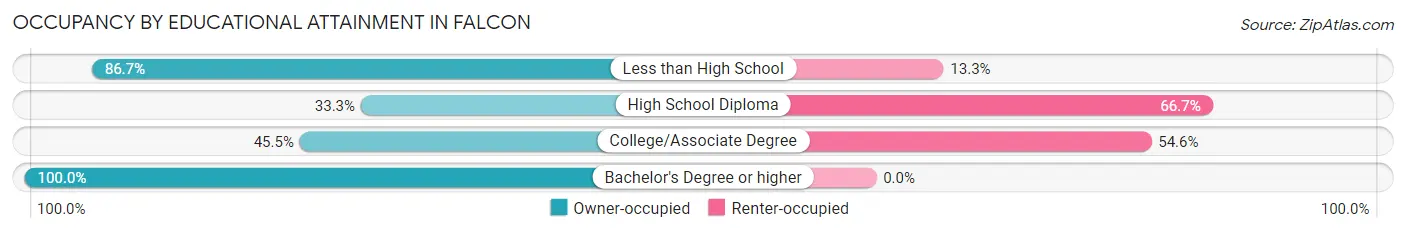
| Household Size | Owner-occupied | Renter-occupied |
| Less than High School | 26 (86.7%) | 4 (13.3%) |
| High School Diploma | 4 (33.3%) | 8 (66.7%) |
| College/Associate Degree | 10 (45.5%) | 12 (54.5%) |
| Bachelor's Degree or higher | 4 (100.0%) | 0 (0.0%) |
Occupancy by Age of Householder in Falcon
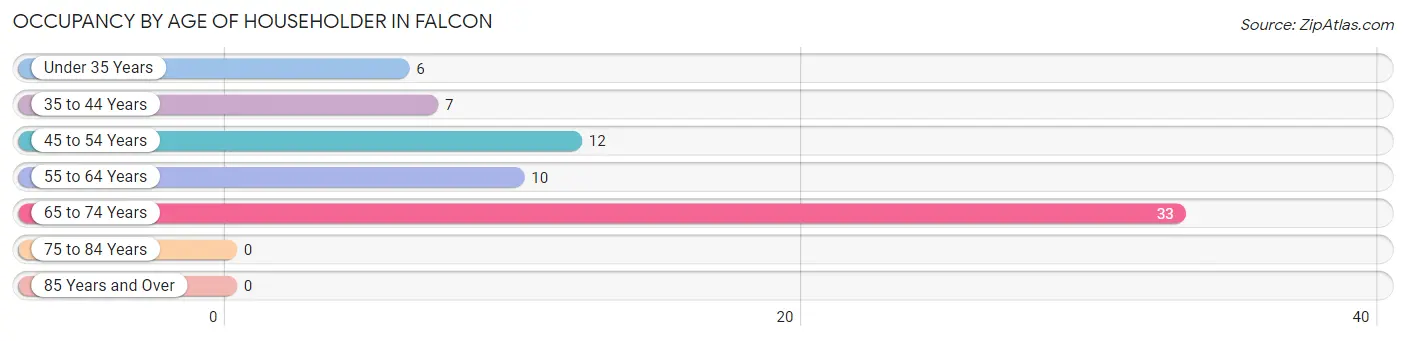
| Age Bracket | # Households | % Households |
| Under 35 Years | 6 | 8.8% |
| 35 to 44 Years | 7 | 10.3% |
| 45 to 54 Years | 12 | 17.6% |
| 55 to 64 Years | 10 | 14.7% |
| 65 to 74 Years | 33 | 48.5% |
| 75 to 84 Years | 0 | 0.0% |
| 85 Years and Over | 0 | 0.0% |
| Total | 68 | 100.0% |
Housing Finances in Falcon
Median Income by Occupancy in Falcon
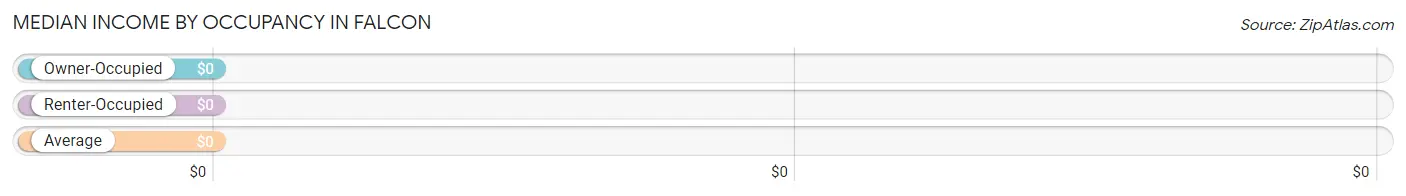
| Occupancy Type | # Households | Median Income |
| Owner-Occupied | 44 (64.7%) | $0 |
| Renter-Occupied | 24 (35.3%) | $0 |
| Average | 68 (100.0%) | $0 |
Occupancy by Householder Income Bracket in Falcon
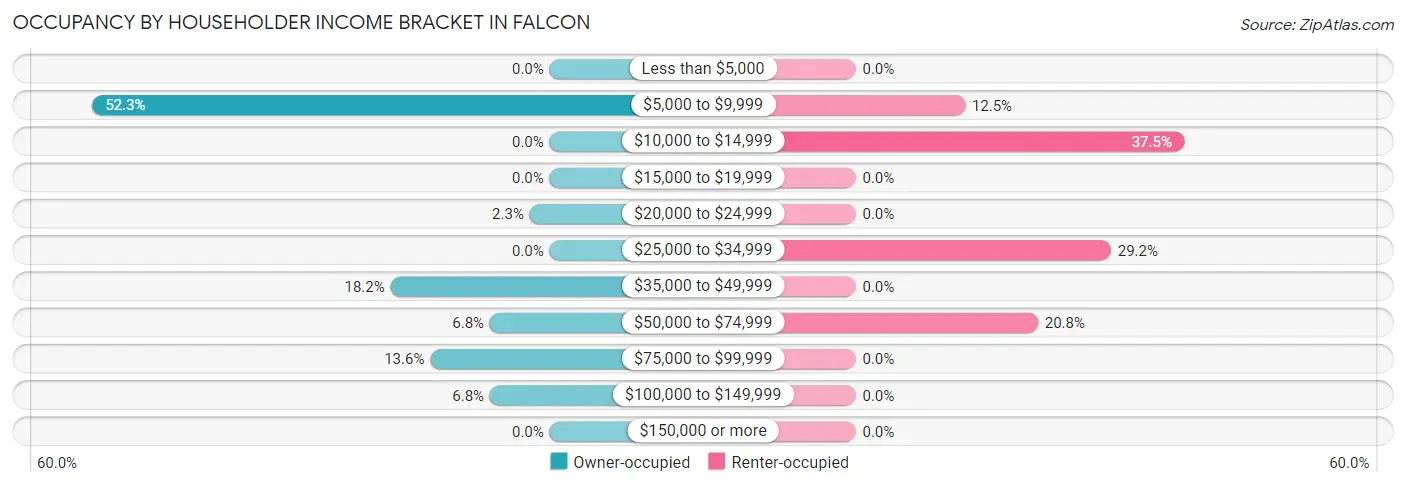
| Income Bracket | Owner-occupied | Renter-occupied |
| Less than $5,000 | 0 (0.0%) | 0 (0.0%) |
| $5,000 to $9,999 | 23 (52.3%) | 3 (12.5%) |
| $10,000 to $14,999 | 0 (0.0%) | 9 (37.5%) |
| $15,000 to $19,999 | 0 (0.0%) | 0 (0.0%) |
| $20,000 to $24,999 | 1 (2.3%) | 0 (0.0%) |
| $25,000 to $34,999 | 0 (0.0%) | 7 (29.2%) |
| $35,000 to $49,999 | 8 (18.2%) | 0 (0.0%) |
| $50,000 to $74,999 | 3 (6.8%) | 5 (20.8%) |
| $75,000 to $99,999 | 6 (13.6%) | 0 (0.0%) |
| $100,000 to $149,999 | 3 (6.8%) | 0 (0.0%) |
| $150,000 or more | 0 (0.0%) | 0 (0.0%) |
| Total | 44 (100.0%) | 24 (100.0%) |
Monthly Housing Cost Tiers in Falcon
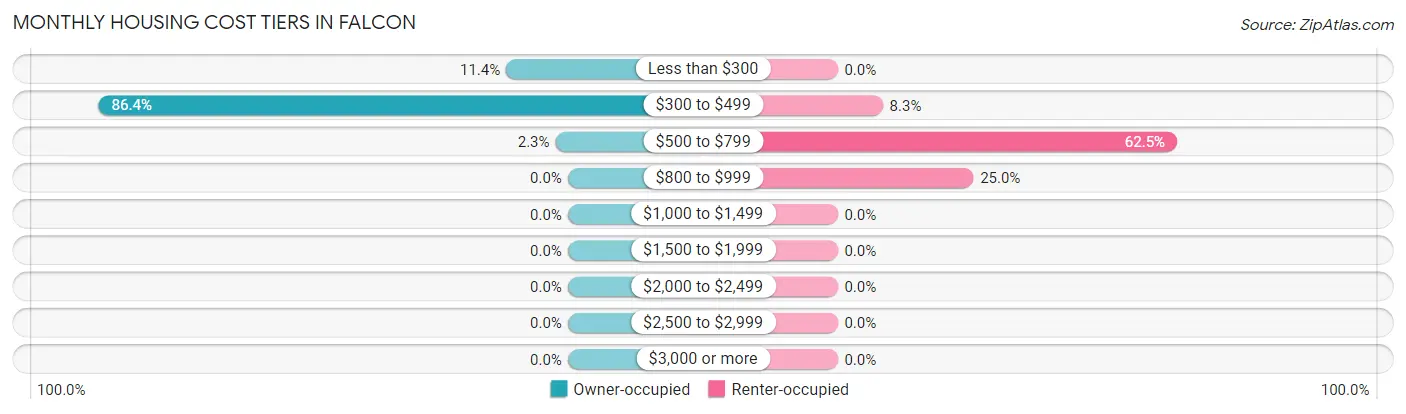
| Monthly Cost | Owner-occupied | Renter-occupied |
| Less than $300 | 5 (11.4%) | 0 (0.0%) |
| $300 to $499 | 38 (86.4%) | 2 (8.3%) |
| $500 to $799 | 1 (2.3%) | 15 (62.5%) |
| $800 to $999 | 0 (0.0%) | 6 (25.0%) |
| $1,000 to $1,499 | 0 (0.0%) | 0 (0.0%) |
| $1,500 to $1,999 | 0 (0.0%) | 0 (0.0%) |
| $2,000 to $2,499 | 0 (0.0%) | 0 (0.0%) |
| $2,500 to $2,999 | 0 (0.0%) | 0 (0.0%) |
| $3,000 or more | 0 (0.0%) | 0 (0.0%) |
| Total | 44 (100.0%) | 24 (100.0%) |
Physical Housing Characteristics in Falcon
Housing Structures in Falcon
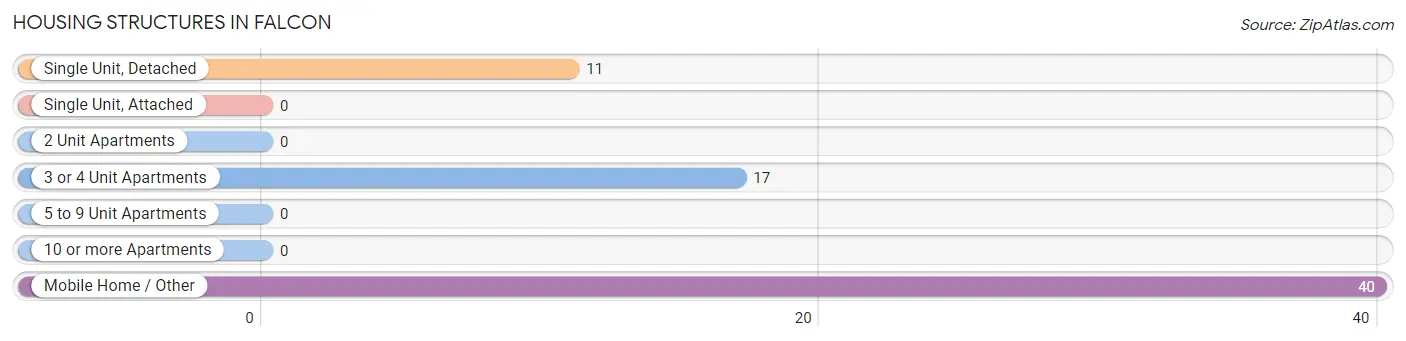
| Structure Type | # Housing Units | % Housing Units |
| Single Unit, Detached | 11 | 16.2% |
| Single Unit, Attached | 0 | 0.0% |
| 2 Unit Apartments | 0 | 0.0% |
| 3 or 4 Unit Apartments | 17 | 25.0% |
| 5 to 9 Unit Apartments | 0 | 0.0% |
| 10 or more Apartments | 0 | 0.0% |
| Mobile Home / Other | 40 | 58.8% |
| Total | 68 | 100.0% |
Housing Structures by Occupancy in Falcon
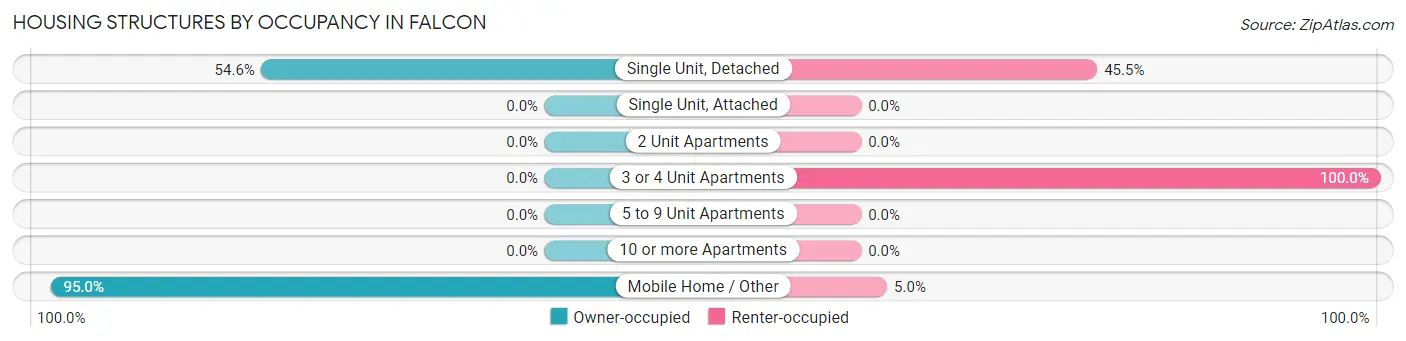
| Structure Type | Owner-occupied | Renter-occupied |
| Single Unit, Detached | 6 (54.5%) | 5 (45.5%) |
| Single Unit, Attached | 0 (0.0%) | 0 (0.0%) |
| 2 Unit Apartments | 0 (0.0%) | 0 (0.0%) |
| 3 or 4 Unit Apartments | 0 (0.0%) | 17 (100.0%) |
| 5 to 9 Unit Apartments | 0 (0.0%) | 0 (0.0%) |
| 10 or more Apartments | 0 (0.0%) | 0 (0.0%) |
| Mobile Home / Other | 38 (95.0%) | 2 (5.0%) |
| Total | 44 (64.7%) | 24 (35.3%) |
Housing Structures by Number of Rooms in Falcon
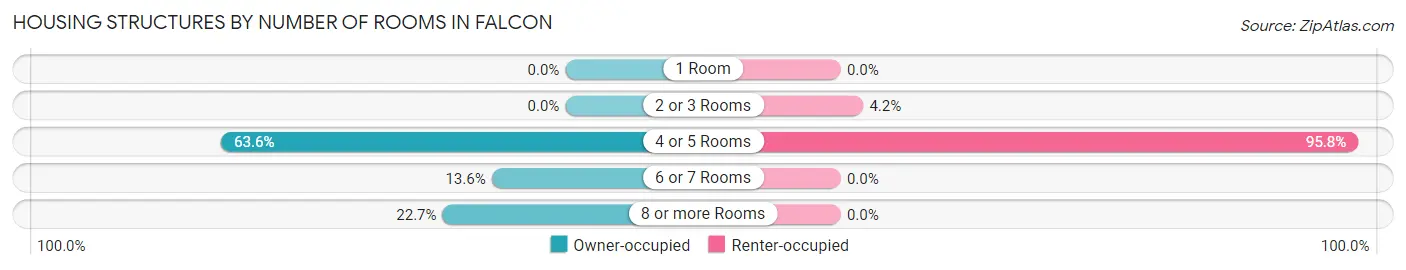
| Number of Rooms | Owner-occupied | Renter-occupied |
| 1 Room | 0 (0.0%) | 0 (0.0%) |
| 2 or 3 Rooms | 0 (0.0%) | 1 (4.2%) |
| 4 or 5 Rooms | 28 (63.6%) | 23 (95.8%) |
| 6 or 7 Rooms | 6 (13.6%) | 0 (0.0%) |
| 8 or more Rooms | 10 (22.7%) | 0 (0.0%) |
| Total | 44 (100.0%) | 24 (100.0%) |
Housing Structure by Heating Type in Falcon
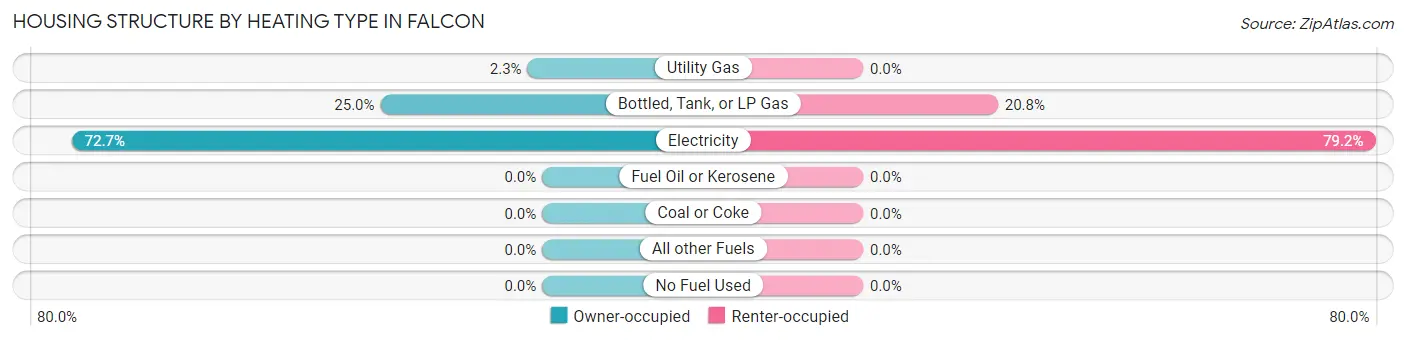
| Heating Type | Owner-occupied | Renter-occupied |
| Utility Gas | 1 (2.3%) | 0 (0.0%) |
| Bottled, Tank, or LP Gas | 11 (25.0%) | 5 (20.8%) |
| Electricity | 32 (72.7%) | 19 (79.2%) |
| Fuel Oil or Kerosene | 0 (0.0%) | 0 (0.0%) |
| Coal or Coke | 0 (0.0%) | 0 (0.0%) |
| All other Fuels | 0 (0.0%) | 0 (0.0%) |
| No Fuel Used | 0 (0.0%) | 0 (0.0%) |
| Total | 44 (100.0%) | 24 (100.0%) |
Household Vehicle Usage in Falcon
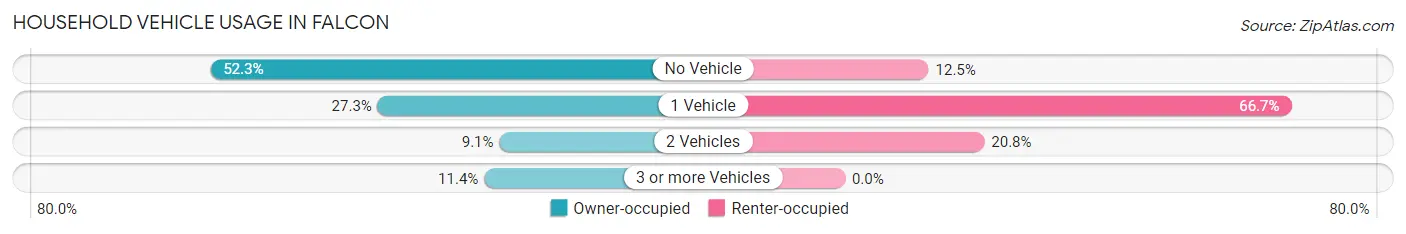
| Vehicles per Household | Owner-occupied | Renter-occupied |
| No Vehicle | 23 (52.3%) | 3 (12.5%) |
| 1 Vehicle | 12 (27.3%) | 16 (66.7%) |
| 2 Vehicles | 4 (9.1%) | 5 (20.8%) |
| 3 or more Vehicles | 5 (11.4%) | 0 (0.0%) |
| Total | 44 (100.0%) | 24 (100.0%) |
Real Estate & Mortgages in Falcon
Real Estate and Mortgage Overview in Falcon
| Characteristic | Without Mortgage | With Mortgage |
| Housing Units | 44 | 0 |
| Median Property Value | $56,100 | $0 |
| Median Household Income | - | - |
| Monthly Housing Costs | $434 | $0 |
| Real Estate Taxes | - | - |
Property Value by Mortgage Status in Falcon
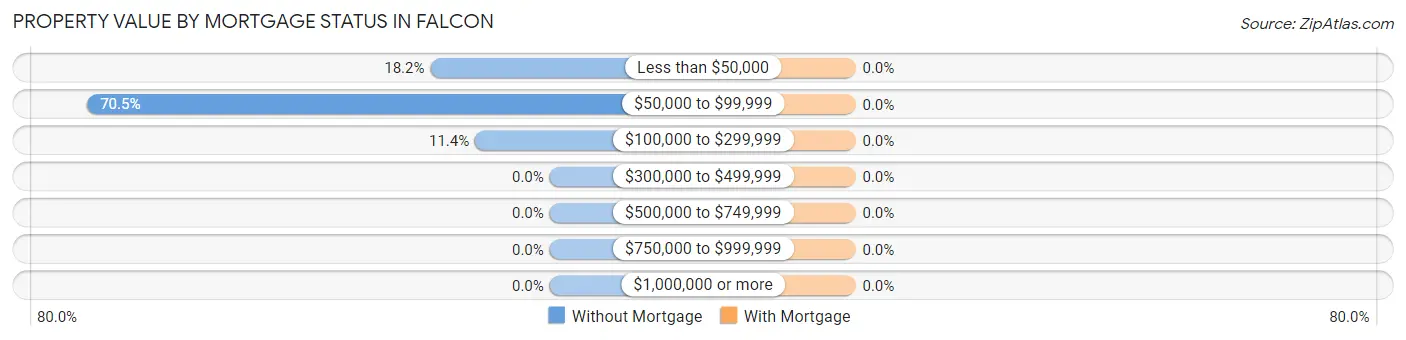
| Property Value | Without Mortgage | With Mortgage |
| Less than $50,000 | 8 (18.2%) | 0 (0.0%) |
| $50,000 to $99,999 | 31 (70.5%) | 0 (0.0%) |
| $100,000 to $299,999 | 5 (11.4%) | 0 (0.0%) |
| $300,000 to $499,999 | 0 (0.0%) | 0 (0.0%) |
| $500,000 to $749,999 | 0 (0.0%) | 0 (0.0%) |
| $750,000 to $999,999 | 0 (0.0%) | 0 (0.0%) |
| $1,000,000 or more | 0 (0.0%) | 0 (0.0%) |
| Total | 44 (100.0%) | 0 (0.0%) |
Household Income by Mortgage Status in Falcon
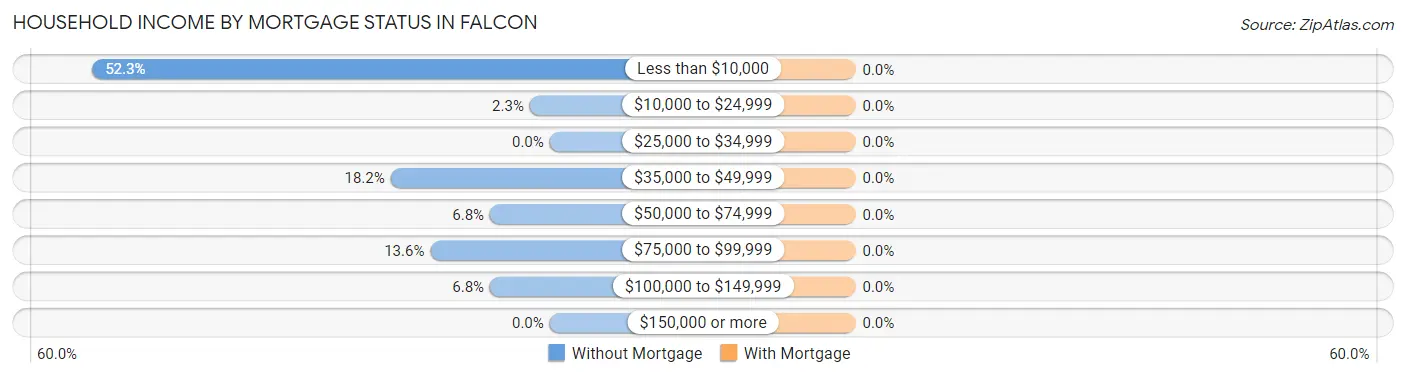
| Household Income | Without Mortgage | With Mortgage |
| Less than $10,000 | 23 (52.3%) | 0 (0.0%) |
| $10,000 to $24,999 | 1 (2.3%) | 0 (0.0%) |
| $25,000 to $34,999 | 0 (0.0%) | 0 (0.0%) |
| $35,000 to $49,999 | 8 (18.2%) | 0 (0.0%) |
| $50,000 to $74,999 | 3 (6.8%) | 0 (0.0%) |
| $75,000 to $99,999 | 6 (13.6%) | 0 (0.0%) |
| $100,000 to $149,999 | 3 (6.8%) | 0 (0.0%) |
| $150,000 or more | 0 (0.0%) | 0 (0.0%) |
| Total | 44 (100.0%) | 0 (0.0%) |
Property Value to Household Income Ratio in Falcon
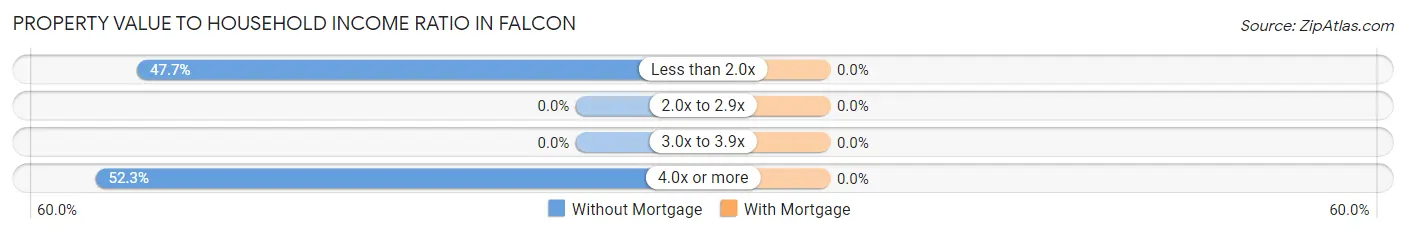
| Value-to-Income Ratio | Without Mortgage | With Mortgage |
| Less than 2.0x | 21 (47.7%) | 0 (0.0%) |
| 2.0x to 2.9x | 0 (0.0%) | 0 (0.0%) |
| 3.0x to 3.9x | 0 (0.0%) | 0 (0.0%) |
| 4.0x or more | 23 (52.3%) | 0 (0.0%) |
| Total | 44 (100.0%) | 0 (0.0%) |
Real Estate Taxes by Mortgage Status in Falcon
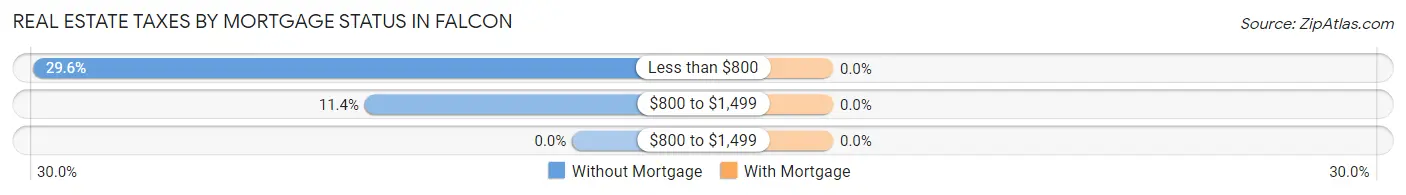
| Property Taxes | Without Mortgage | With Mortgage |
| Less than $800 | 13 (29.5%) | 0 (0.0%) |
| $800 to $1,499 | 5 (11.4%) | 0 (0.0%) |
| $800 to $1,499 | 0 (0.0%) | 0 (0.0%) |
| Total | 44 (100.0%) | 0 (0.0%) |
Health & Disability in Falcon
Health Insurance Coverage by Age in Falcon
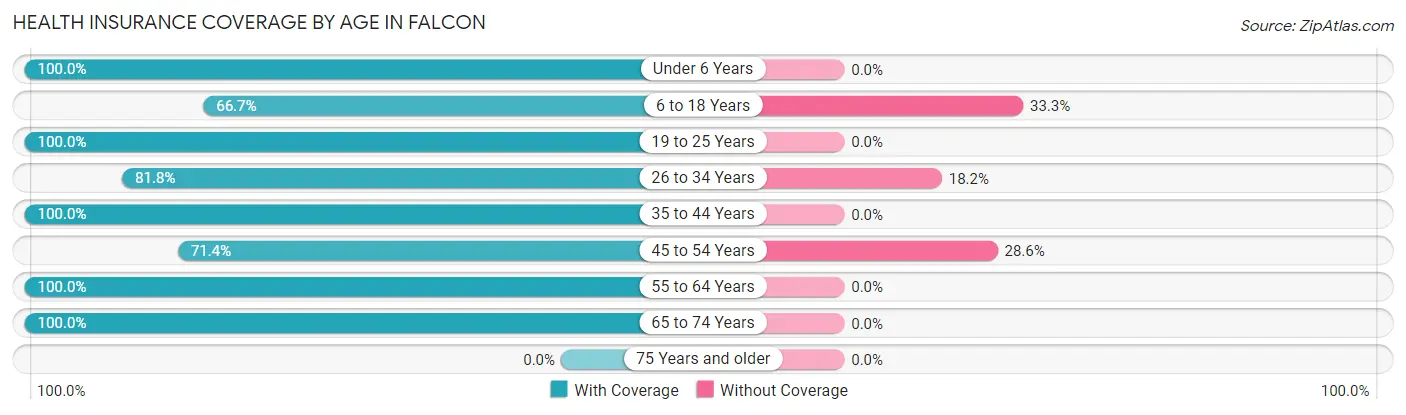
| Age Bracket | With Coverage | Without Coverage |
| Under 6 Years | 5 (100.0%) | 0 (0.0%) |
| 6 to 18 Years | 36 (66.7%) | 18 (33.3%) |
| 19 to 25 Years | 15 (100.0%) | 0 (0.0%) |
| 26 to 34 Years | 18 (81.8%) | 4 (18.2%) |
| 35 to 44 Years | 9 (100.0%) | 0 (0.0%) |
| 45 to 54 Years | 15 (71.4%) | 6 (28.6%) |
| 55 to 64 Years | 13 (100.0%) | 0 (0.0%) |
| 65 to 74 Years | 34 (100.0%) | 0 (0.0%) |
| 75 Years and older | 0 (0.0%) | 0 (0.0%) |
| Total | 145 (83.8%) | 28 (16.2%) |
Health Insurance Coverage by Citizenship Status in Falcon
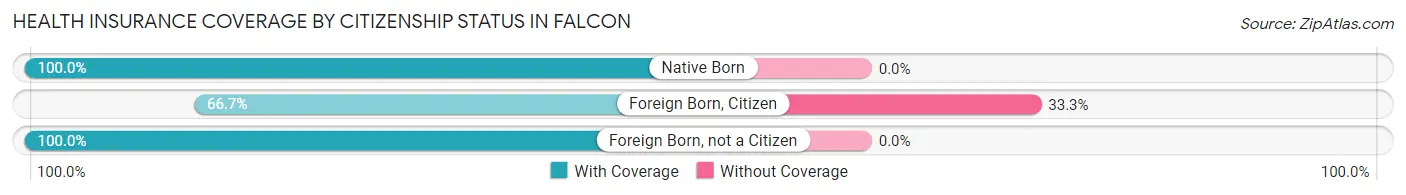
| Citizenship Status | With Coverage | Without Coverage |
| Native Born | 5 (100.0%) | 0 (0.0%) |
| Foreign Born, Citizen | 36 (66.7%) | 18 (33.3%) |
| Foreign Born, not a Citizen | 15 (100.0%) | 0 (0.0%) |
Health Insurance Coverage by Household Income in Falcon
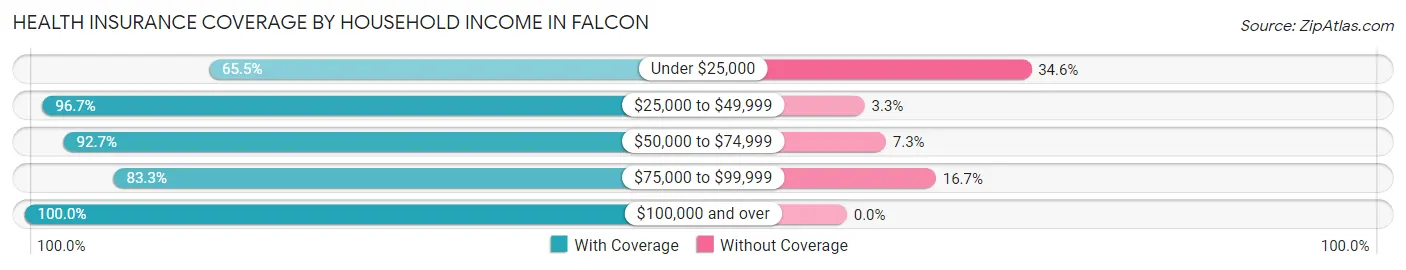
| Household Income | With Coverage | Without Coverage |
| Under $25,000 | 36 (65.4%) | 19 (34.5%) |
| $25,000 to $49,999 | 29 (96.7%) | 1 (3.3%) |
| $50,000 to $74,999 | 38 (92.7%) | 3 (7.3%) |
| $75,000 to $99,999 | 25 (83.3%) | 5 (16.7%) |
| $100,000 and over | 17 (100.0%) | 0 (0.0%) |
Public vs Private Health Insurance Coverage by Age in Falcon
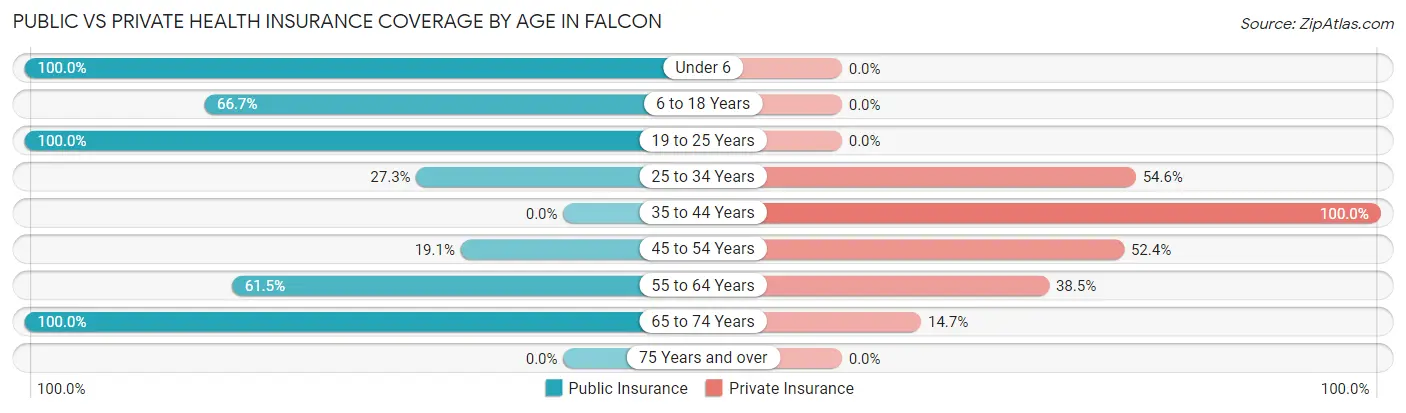
| Age Bracket | Public Insurance | Private Insurance |
| Under 6 | 5 (100.0%) | 0 (0.0%) |
| 6 to 18 Years | 36 (66.7%) | 0 (0.0%) |
| 19 to 25 Years | 15 (100.0%) | 0 (0.0%) |
| 25 to 34 Years | 6 (27.3%) | 12 (54.5%) |
| 35 to 44 Years | 0 (0.0%) | 9 (100.0%) |
| 45 to 54 Years | 4 (19.1%) | 11 (52.4%) |
| 55 to 64 Years | 8 (61.5%) | 5 (38.5%) |
| 65 to 74 Years | 34 (100.0%) | 5 (14.7%) |
| 75 Years and over | 0 (0.0%) | 0 (0.0%) |
| Total | 108 (62.4%) | 42 (24.3%) |
Disability Status by Sex by Age in Falcon
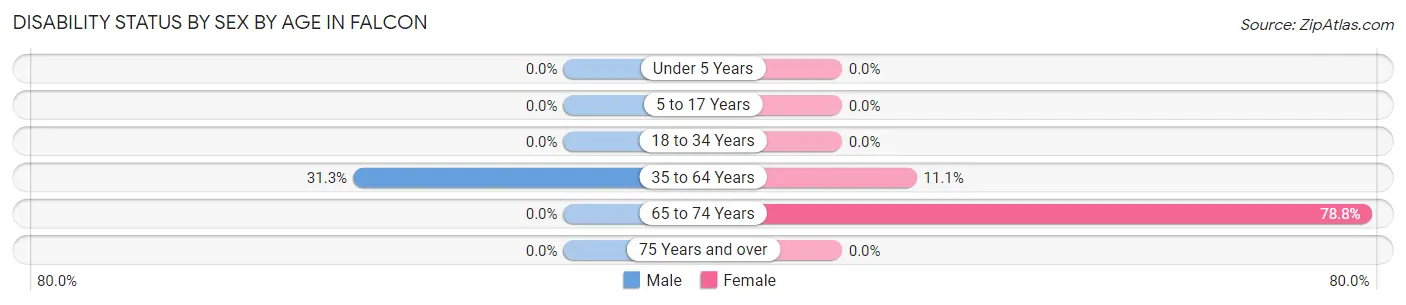
| Age Bracket | Male | Female |
| Under 5 Years | 0 (0.0%) | 0 (0.0%) |
| 5 to 17 Years | 0 (0.0%) | 0 (0.0%) |
| 18 to 34 Years | 0 (0.0%) | 0 (0.0%) |
| 35 to 64 Years | 5 (31.2%) | 3 (11.1%) |
| 65 to 74 Years | 0 (0.0%) | 26 (78.8%) |
| 75 Years and over | 0 (0.0%) | 0 (0.0%) |
Disability Class by Sex by Age in Falcon
Disability Class: Hearing Difficulty
| Age Bracket | Male | Female |
| Under 5 Years | 0 (0.0%) | 0 (0.0%) |
| 5 to 17 Years | 0 (0.0%) | 0 (0.0%) |
| 18 to 34 Years | 0 (0.0%) | 0 (0.0%) |
| 35 to 64 Years | 0 (0.0%) | 0 (0.0%) |
| 65 to 74 Years | 0 (0.0%) | 0 (0.0%) |
| 75 Years and over | 0 (0.0%) | 0 (0.0%) |
Disability Class: Vision Difficulty
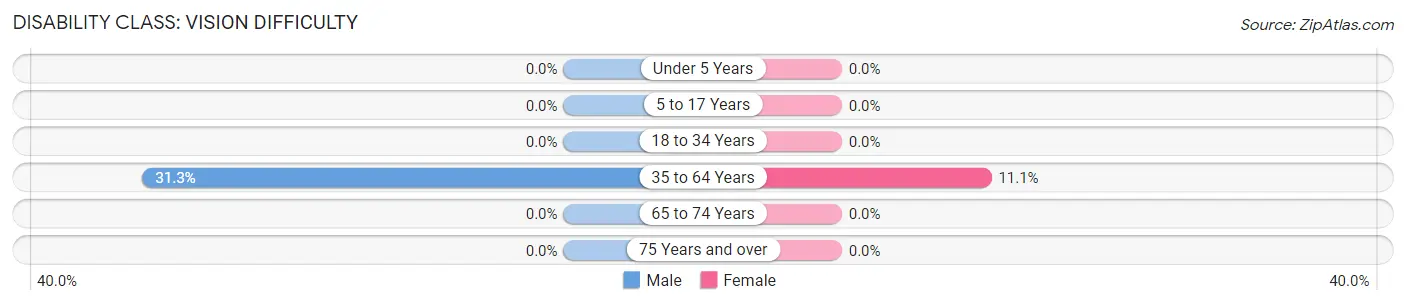
| Age Bracket | Male | Female |
| Under 5 Years | 0 (0.0%) | 0 (0.0%) |
| 5 to 17 Years | 0 (0.0%) | 0 (0.0%) |
| 18 to 34 Years | 0 (0.0%) | 0 (0.0%) |
| 35 to 64 Years | 5 (31.2%) | 3 (11.1%) |
| 65 to 74 Years | 0 (0.0%) | 0 (0.0%) |
| 75 Years and over | 0 (0.0%) | 0 (0.0%) |
Disability Class: Cognitive Difficulty
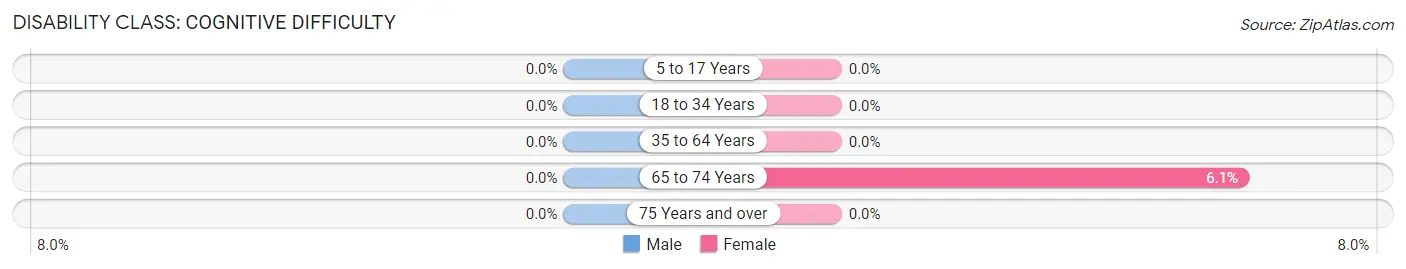
| Age Bracket | Male | Female |
| 5 to 17 Years | 0 (0.0%) | 0 (0.0%) |
| 18 to 34 Years | 0 (0.0%) | 0 (0.0%) |
| 35 to 64 Years | 0 (0.0%) | 0 (0.0%) |
| 65 to 74 Years | 0 (0.0%) | 2 (6.1%) |
| 75 Years and over | 0 (0.0%) | 0 (0.0%) |
Disability Class: Ambulatory Difficulty
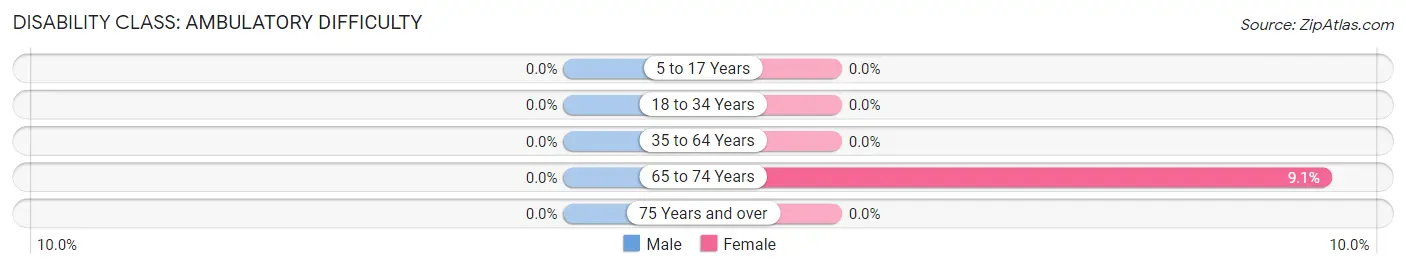
| Age Bracket | Male | Female |
| 5 to 17 Years | 0 (0.0%) | 0 (0.0%) |
| 18 to 34 Years | 0 (0.0%) | 0 (0.0%) |
| 35 to 64 Years | 0 (0.0%) | 0 (0.0%) |
| 65 to 74 Years | 0 (0.0%) | 3 (9.1%) |
| 75 Years and over | 0 (0.0%) | 0 (0.0%) |
Disability Class: Self-Care Difficulty
| Age Bracket | Male | Female |
| 5 to 17 Years | 0 (0.0%) | 0 (0.0%) |
| 18 to 34 Years | 0 (0.0%) | 0 (0.0%) |
| 35 to 64 Years | 0 (0.0%) | 0 (0.0%) |
| 65 to 74 Years | 0 (0.0%) | 0 (0.0%) |
| 75 Years and over | 0 (0.0%) | 0 (0.0%) |
Technology Access in Falcon
Computing Device Access in Falcon
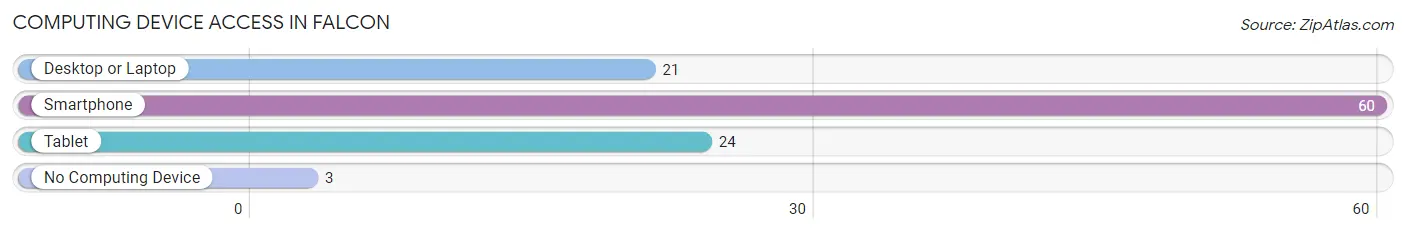
| Device Type | # Households | % Households |
| Desktop or Laptop | 21 | 30.9% |
| Smartphone | 60 | 88.2% |
| Tablet | 24 | 35.3% |
| No Computing Device | 3 | 4.4% |
| Total | 68 | 100.0% |
Internet Access in Falcon
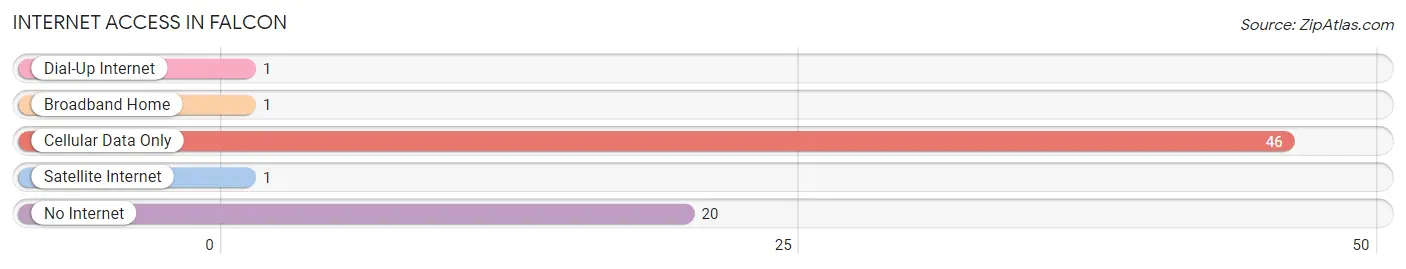
| Internet Type | # Households | % Households |
| Dial-Up Internet | 1 | 1.5% |
| Broadband Home | 1 | 1.5% |
| Cellular Data Only | 46 | 67.6% |
| Satellite Internet | 1 | 1.5% |
| No Internet | 20 | 29.4% |
| Total | 68 | 100.0% |
Falcon Summary
Falcon is a small town located in the state of Mississippi, in the United States. It is situated in Madison County, and is part of the Jackson Metropolitan Statistical Area. The town has a population of approximately 1,000 people, and is located about 20 miles north of the state capital, Jackson.
History
Falcon was founded in 1837 by a group of settlers from North Carolina. The town was named after a nearby creek, which was named after a falcon that was seen in the area. The town was originally a farming community, and the main crops grown were cotton and corn.
In the late 19th century, the town began to grow and develop. The first post office was established in 1887, and the first school was built in 1895. The town also had a railroad station, which was built in 1901.
In the early 20th century, the town began to experience a period of growth and prosperity. The population increased from around 500 in 1900 to over 1,000 by the mid-1920s. During this time, the town also saw the construction of several churches, a bank, and a hotel.
Geography
Falcon is located in the northern part of Madison County, in the state of Mississippi. The town is situated on the banks of the Pearl River, and is surrounded by rolling hills and forests. The town is located about 20 miles north of the state capital, Jackson.
The climate in Falcon is humid subtropical, with hot, humid summers and mild winters. The average annual temperature is around 70 degrees Fahrenheit, and the average annual precipitation is around 50 inches.
Economy
The economy of Falcon is largely based on agriculture. The main crops grown in the area are cotton, corn, soybeans, and wheat. The town also has a few small businesses, including a grocery store, a hardware store, and a few restaurants.
Demographics
As of the 2010 census, the population of Falcon was 1,000 people. The racial makeup of the town was 95.2% White, 2.2% African American, 0.2% Native American, 0.2% Asian, 0.2% from other races, and 1.9% from two or more races. The median household income was $37,500, and the median family income was $45,000. The per capita income was $17,000.
Common Questions
What is Per Capita Income in Falcon?
Per Capita income in Falcon is $11,875.
What is the Median Family Income in Falcon?
Median Family Income in Falcon is $47,500.
What is Income or Wage Gap in Falcon?
Income or Wage Gap in Falcon is 32.4%.
Women in Falcon earn 67.6 cents for every dollar earned by a man.
What is Inequality or Gini Index in Falcon?
Inequality or Gini Index in Falcon is 0.49.
What is the Total Population of Falcon?
Total Population of Falcon is 173.
What is the Total Male Population of Falcon?
Total Male Population of Falcon is 69.
What is the Total Female Population of Falcon?
Total Female Population of Falcon is 104.
What is the Ratio of Males per 100 Females in Falcon?
There are 66.35 Males per 100 Females in Falcon.
What is the Ratio of Females per 100 Males in Falcon?
There are 150.72 Females per 100 Males in Falcon.
What is the Median Population Age in Falcon?
Median Population Age in Falcon is 30.6 Years.
What is the Average Family Size in Falcon
Average Family Size in Falcon is 4.3 People.
What is the Average Household Size in Falcon
Average Household Size in Falcon is 2.5 People.
How Large is the Labor Force in Falcon?
There are 51 People in the Labor Forcein in Falcon.
What is the Percentage of People in the Labor Force in Falcon?
41.5% of People are in the Labor Force in Falcon.
What is the Unemployment Rate in Falcon?
Unemployment Rate in Falcon is 3.9%.