Zip Codes with the Highest Percentage of Population Employed in Real Estate, Rental & Leasing in Columbus, MS
RELATED REPORTS & OPTIONS
Real Estate, Rental & Leasing
Columbus
Compare Zip Codes
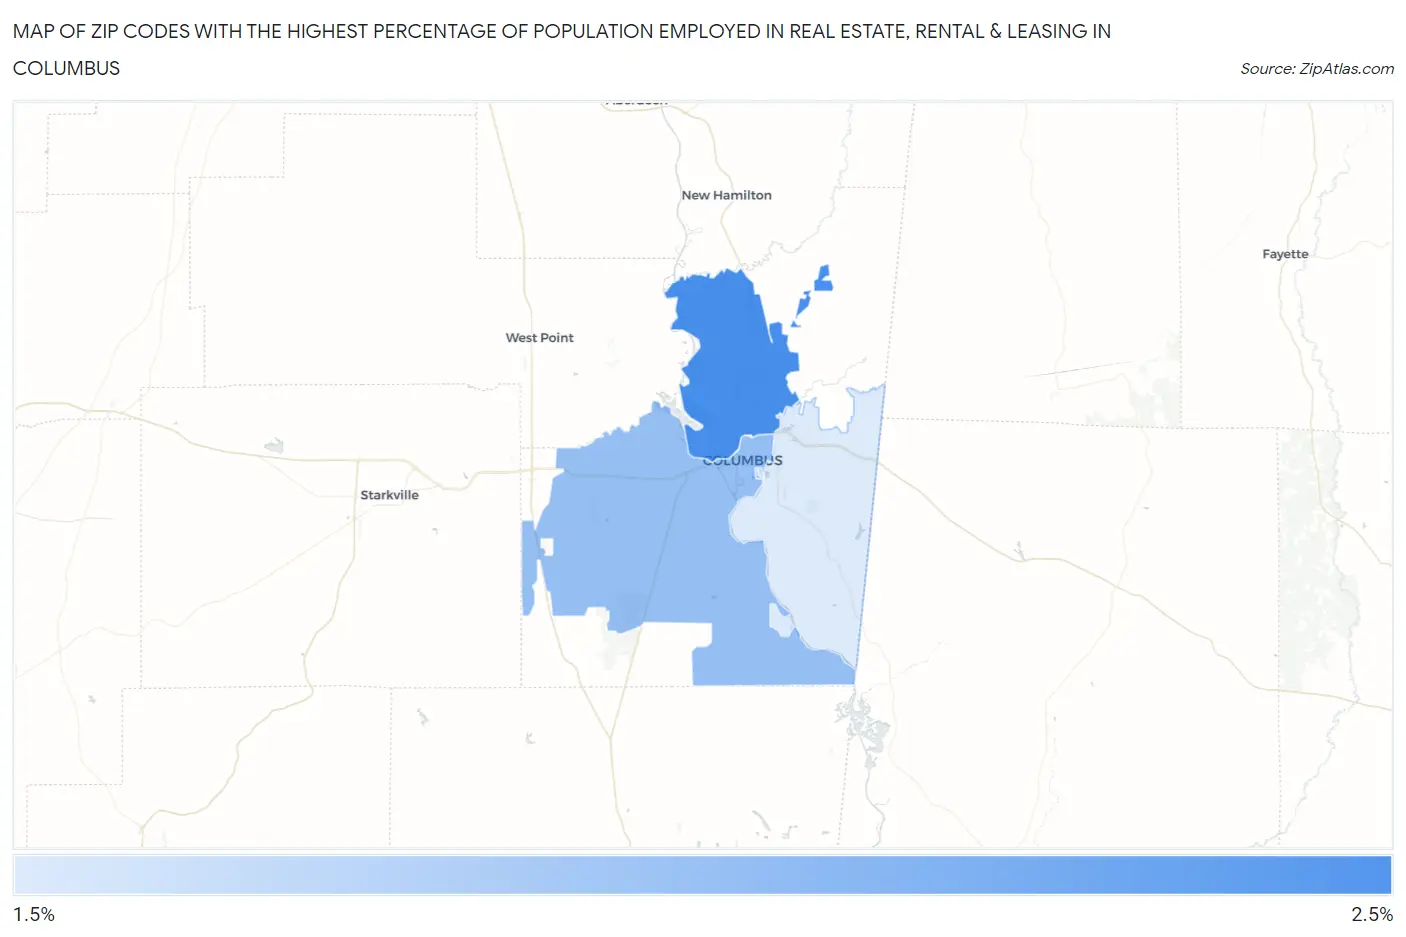
Map of Zip Codes with the Highest Percentage of Population Employed in Real Estate, Rental & Leasing in Columbus
1.9%
2.4%
Zip Codes with the Highest Percentage of Population Employed in Real Estate, Rental & Leasing in Columbus, MS
| Zip Code | % Employed | vs State | vs National | |
| 1. | 39705 | 2.4% | 1.3%(+1.15)#29 | 1.9%(+0.511)#5,887 |
| 2. | 39701 | 2.2% | 1.3%(+0.901)#38 | 1.9%(+0.260)#7,059 |
| 3. | 39702 | 1.9% | 1.3%(+0.665)#49 | 1.9%(+0.024)#8,365 |
1
Common Questions
What are the Top Zip Codes with the Highest Percentage of Population Employed in Real Estate, Rental & Leasing in Columbus, MS?
Top Zip Codes with the Highest Percentage of Population Employed in Real Estate, Rental & Leasing in Columbus, MS are:
What zip code has the Highest Percentage of Population Employed in Real Estate, Rental & Leasing in Columbus, MS?
39705 has the Highest Percentage of Population Employed in Real Estate, Rental & Leasing in Columbus, MS with 2.4%.
What is the Percentage of Population Employed in Real Estate, Rental & Leasing in Columbus, MS?
Percentage of Population Employed in Real Estate, Rental & Leasing in Columbus is 2.3%.
What is the Percentage of Population Employed in Real Estate, Rental & Leasing in Mississippi?
Percentage of Population Employed in Real Estate, Rental & Leasing in Mississippi is 1.3%.
What is the Percentage of Population Employed in Real Estate, Rental & Leasing in the United States?
Percentage of Population Employed in Real Estate, Rental & Leasing in the United States is 1.9%.