Enterprise, MS Map & Demographics
Enterprise Map
Enterprise Overview
$31,359
PER CAPITA INCOME
$81,161
AVG FAMILY INCOME
$70,156
AVG HOUSEHOLD INCOME
$15,071
FAMILY INCOME DEFICIT
0.43
INEQUALITY / GINI INDEX
514
TOTAL POPULATION
236
MALE POPULATION
278
FEMALE POPULATION
84.89
MALES / 100 FEMALES
117.80
FEMALES / 100 MALES
37.5
MEDIAN AGE
3.2
AVG FAMILY SIZE
2.8
AVG HOUSEHOLD SIZE
258
LABOR FORCE [ PEOPLE ]
66.8%
PERCENT IN LABOR FORCE
1.3%
UNEMPLOYMENT RATE
Enterprise Zip Codes
Enterprise Area Codes
Income in Enterprise
Income Overview in Enterprise
Per Capita Income in Enterprise is $31,359, while median incomes of families and households are $81,161 and $70,156 respectively.
| Characteristic | Number | Measure |
| Per Capita Income | 514 | $31,359 |
| Median Family Income | 129 | $81,161 |
| Mean Family Income | 129 | $99,105 |
| Median Household Income | 185 | $70,156 |
| Mean Household Income | 185 | $84,323 |
| Income Deficit | 129 | $15,071 |
| Wage / Income Gap (%) | 514 | 0.00% |
| Wage / Income Gap ($) | 514 | 100.00¢ per $1 |
| Gini / Inequality Index | 514 | 0.43 |
Earnings by Sex in Enterprise
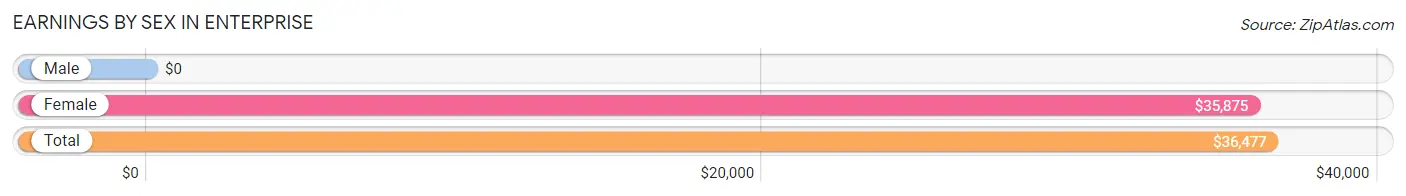
| Sex | Number | Average Earnings |
| Male | 158 (56.6%) | $0 |
| Female | 121 (43.4%) | $35,875 |
| Total | 279 (100.0%) | $36,477 |
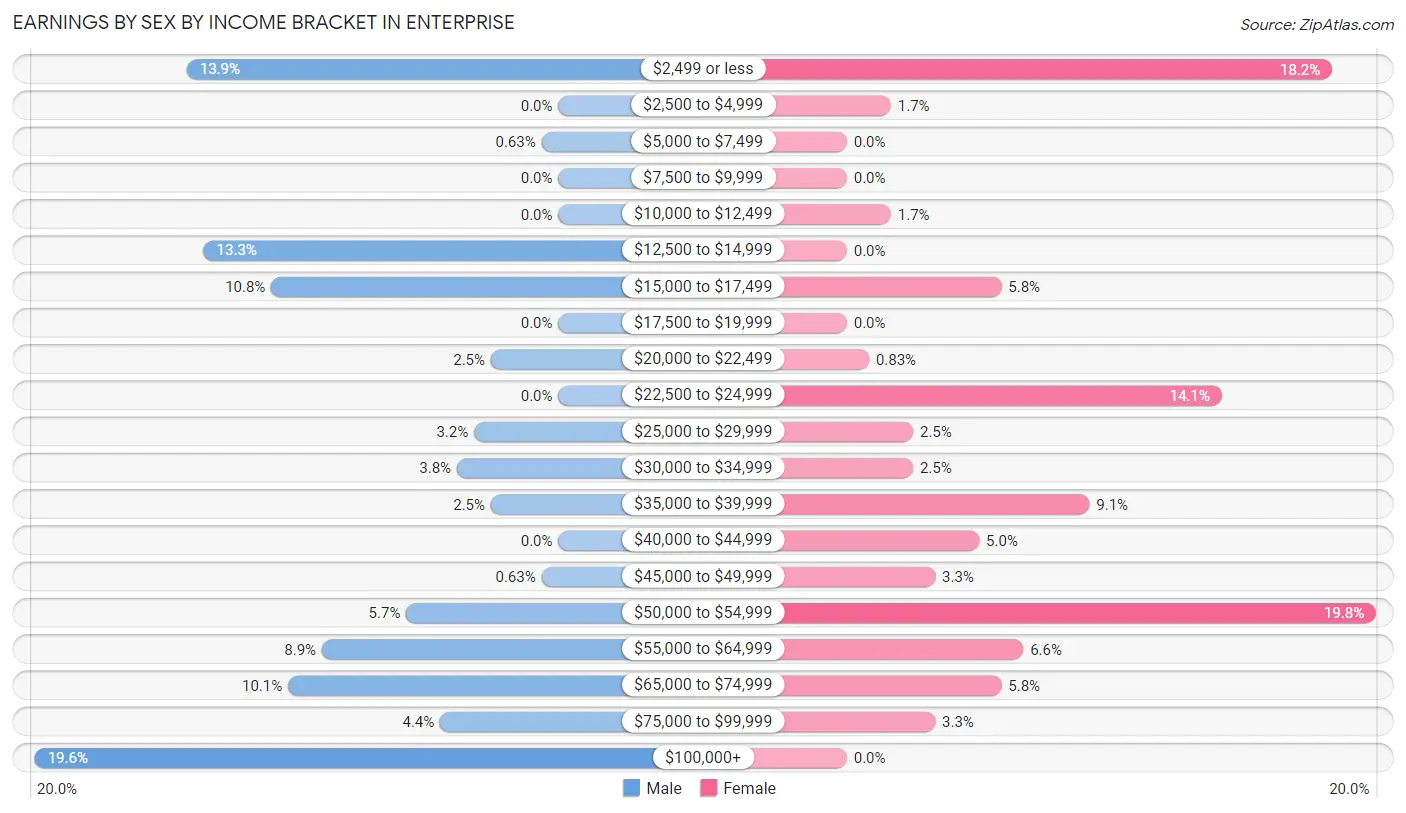
Earnings by Sex by Income Bracket in Enterprise
The most common earnings brackets in Enterprise are $100,000+ for men (31 | 19.6%) and $50,000 to $54,999 for women (24 | 19.8%).
| Income | Male | Female |
| $2,499 or less | 22 (13.9%) | 22 (18.2%) |
| $2,500 to $4,999 | 0 (0.0%) | 2 (1.7%) |
| $5,000 to $7,499 | 1 (0.6%) | 0 (0.0%) |
| $7,500 to $9,999 | 0 (0.0%) | 0 (0.0%) |
| $10,000 to $12,499 | 0 (0.0%) | 2 (1.7%) |
| $12,500 to $14,999 | 21 (13.3%) | 0 (0.0%) |
| $15,000 to $17,499 | 17 (10.8%) | 7 (5.8%) |
| $17,500 to $19,999 | 0 (0.0%) | 0 (0.0%) |
| $20,000 to $22,499 | 4 (2.5%) | 1 (0.8%) |
| $22,500 to $24,999 | 0 (0.0%) | 17 (14.1%) |
| $25,000 to $29,999 | 5 (3.2%) | 3 (2.5%) |
| $30,000 to $34,999 | 6 (3.8%) | 3 (2.5%) |
| $35,000 to $39,999 | 4 (2.5%) | 11 (9.1%) |
| $40,000 to $44,999 | 0 (0.0%) | 6 (5.0%) |
| $45,000 to $49,999 | 1 (0.6%) | 4 (3.3%) |
| $50,000 to $54,999 | 9 (5.7%) | 24 (19.8%) |
| $55,000 to $64,999 | 14 (8.9%) | 8 (6.6%) |
| $65,000 to $74,999 | 16 (10.1%) | 7 (5.8%) |
| $75,000 to $99,999 | 7 (4.4%) | 4 (3.3%) |
| $100,000+ | 31 (19.6%) | 0 (0.0%) |
| Total | 158 (100.0%) | 121 (100.0%) |
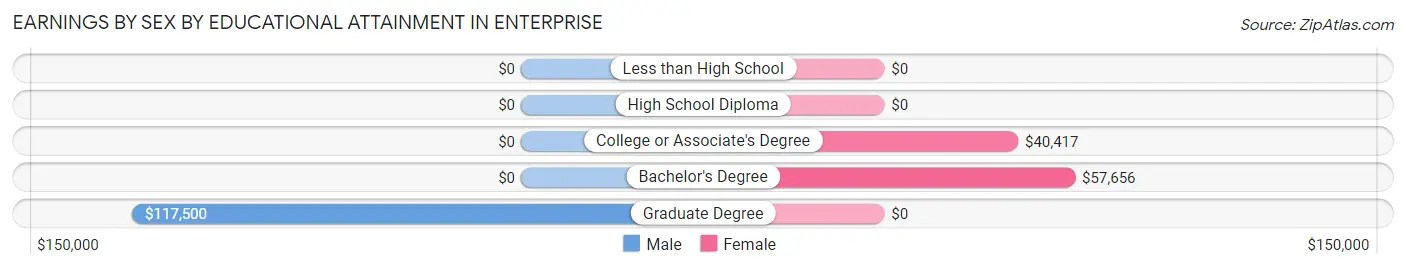
Earnings by Sex by Educational Attainment in Enterprise
Average earnings in Enterprise are $58,750 for men and $40,833 for women, a difference of 30.5%. Men with an educational attainment of graduate degree enjoy the highest average annual earnings of $117,500, while those with graduate degree education earn the least with $117,500. Women with an educational attainment of bachelor's degree earn the most with the average annual earnings of $57,656, while those with college or associate's degree education have the smallest earnings of $40,417.
| Educational Attainment | Male Income | Female Income |
| Less than High School | - | - |
| High School Diploma | - | - |
| College or Associate's Degree | - | - |
| Bachelor's Degree | - | - |
| Graduate Degree | $117,500 | $0 |
| Total | $58,750 | $40,833 |
Family Income in Enterprise
Family Income Brackets in Enterprise
According to the Enterprise family income data, there are 32 families falling into the $50,000 to $74,999 income range, which is the most common income bracket and makes up 24.8% of all families.
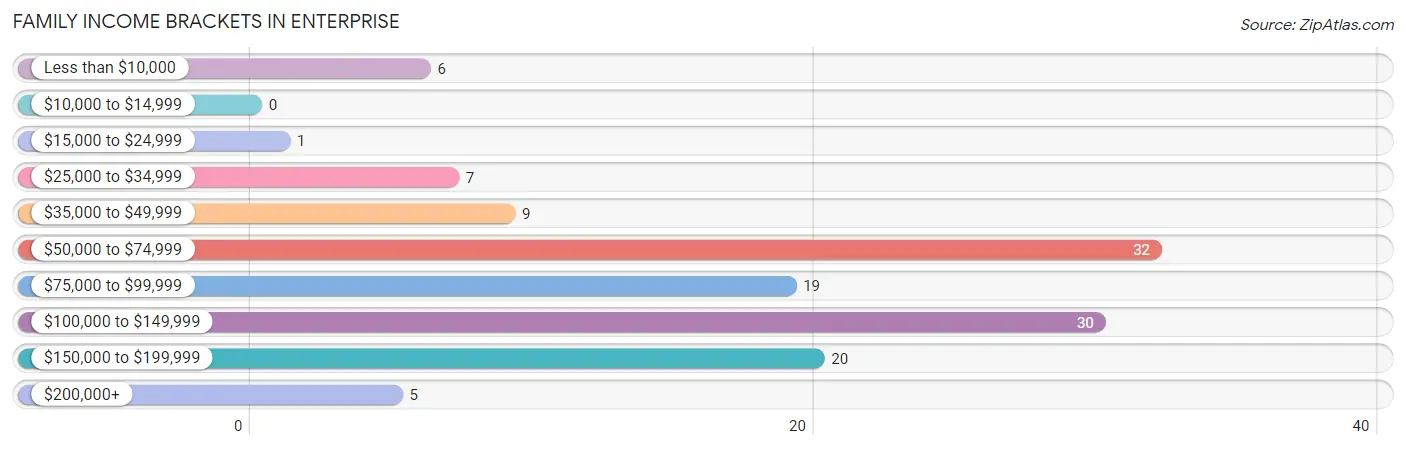
| Income Bracket | # Families | % Families |
| Less than $10,000 | 6 | 4.7% |
| $10,000 to $14,999 | 0 | 0.0% |
| $15,000 to $24,999 | 1 | 0.8% |
| $25,000 to $34,999 | 7 | 5.4% |
| $35,000 to $49,999 | 9 | 7.0% |
| $50,000 to $74,999 | 32 | 24.8% |
| $75,000 to $99,999 | 19 | 14.7% |
| $100,000 to $149,999 | 30 | 23.3% |
| $150,000 to $199,999 | 20 | 15.5% |
| $200,000+ | 5 | 3.9% |
Family Income by Famaliy Size in Enterprise
4-person families (13 | 10.1%) account for the highest median family income in Enterprise with $130,469 per family, while 4-person families (13 | 10.1%) have the highest median income of $32,617 per family member.
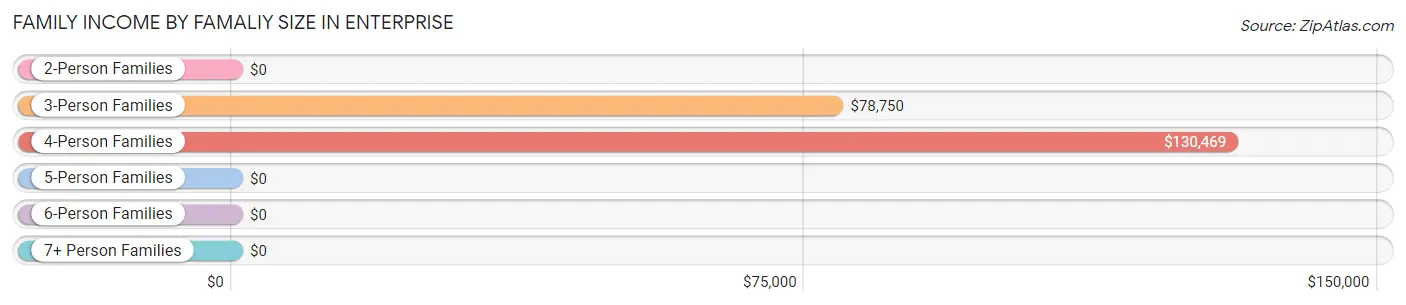
| Income Bracket | # Families | Median Income |
| 2-Person Families | 75 (58.1%) | $0 |
| 3-Person Families | 32 (24.8%) | $78,750 |
| 4-Person Families | 13 (10.1%) | $130,469 |
| 5-Person Families | 9 (7.0%) | $0 |
| 6-Person Families | 0 (0.0%) | $0 |
| 7+ Person Families | 0 (0.0%) | $0 |
| Total | 129 (100.0%) | $81,161 |
Family Income by Number of Earners in Enterprise
The median family income in Enterprise is $81,161, with families comprising 2 earners (38) having the highest median family income of $132,188, while families with no earners (27) have the lowest median family income of $52,946, accounting for 29.5% and 20.9% of families, respectively.
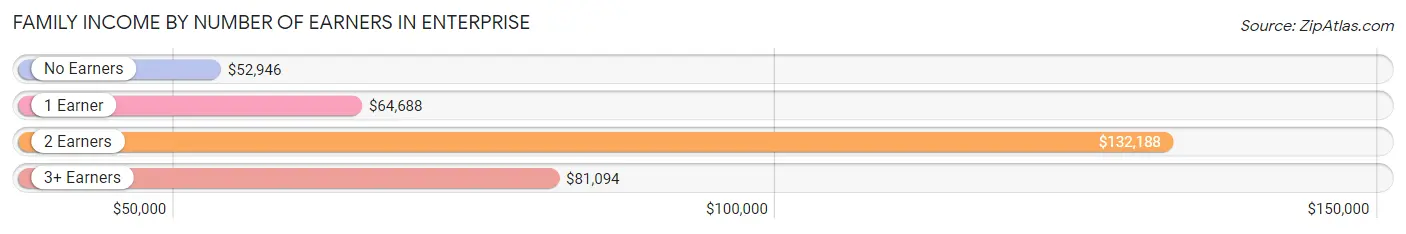
| Number of Earners | # Families | Median Income |
| No Earners | 27 (20.9%) | $52,946 |
| 1 Earner | 49 (38.0%) | $64,688 |
| 2 Earners | 38 (29.5%) | $132,188 |
| 3+ Earners | 15 (11.6%) | $81,094 |
| Total | 129 (100.0%) | $81,161 |
Household Income in Enterprise
Household Income Brackets in Enterprise
With 44 households falling in the category, the $50,000 to $74,999 income range is the most frequent in Enterprise, accounting for 23.8% of all households. In contrast, only 3 households (1.6%) fall into the $10,000 to $14,999 income bracket, making it the least populous group.
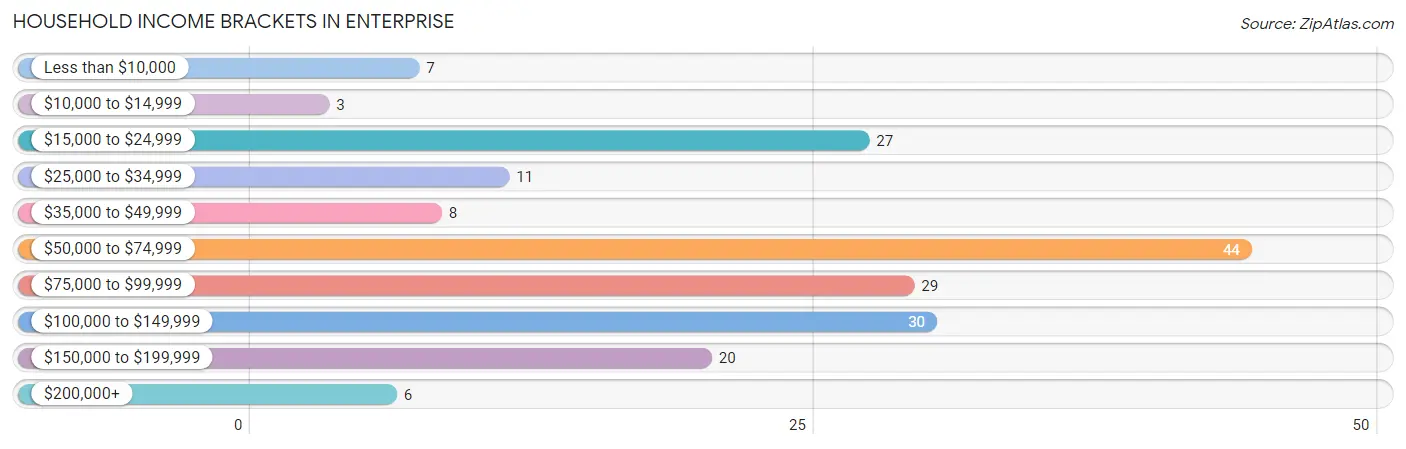
| Income Bracket | # Households | % Households |
| Less than $10,000 | 7 | 3.8% |
| $10,000 to $14,999 | 3 | 1.6% |
| $15,000 to $24,999 | 27 | 14.6% |
| $25,000 to $34,999 | 11 | 5.9% |
| $35,000 to $49,999 | 8 | 4.3% |
| $50,000 to $74,999 | 44 | 23.8% |
| $75,000 to $99,999 | 29 | 15.7% |
| $100,000 to $149,999 | 30 | 16.2% |
| $150,000 to $199,999 | 20 | 10.8% |
| $200,000+ | 6 | 3.2% |
Household Income by Householder Age in Enterprise
The median household income in Enterprise is $70,156, with the highest median household income of $81,042 found in the 45 to 64 years age bracket for the primary householder. A total of 82 households (44.3%) fall into this category. Meanwhile, the 15 to 24 years age bracket for the primary householder has the lowest median household income of $0, with 2 households (1.1%) in this group.
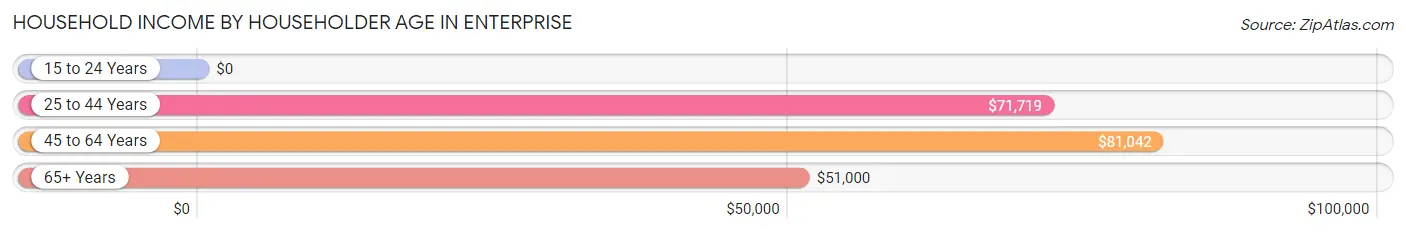
| Income Bracket | # Households | Median Income |
| 15 to 24 Years | 2 (1.1%) | $0 |
| 25 to 44 Years | 57 (30.8%) | $71,719 |
| 45 to 64 Years | 82 (44.3%) | $81,042 |
| 65+ Years | 44 (23.8%) | $51,000 |
| Total | 185 (100.0%) | $70,156 |
Poverty in Enterprise
Income Below Poverty by Sex and Age in Enterprise
With 3.4% poverty level for males and 5.7% for females among the residents of Enterprise, 16 and 17 year old males and 12 to 14 year old females are the most vulnerable to poverty, with 4 males (100.0%) and 2 females (66.7%) in their respective age groups living below the poverty level.
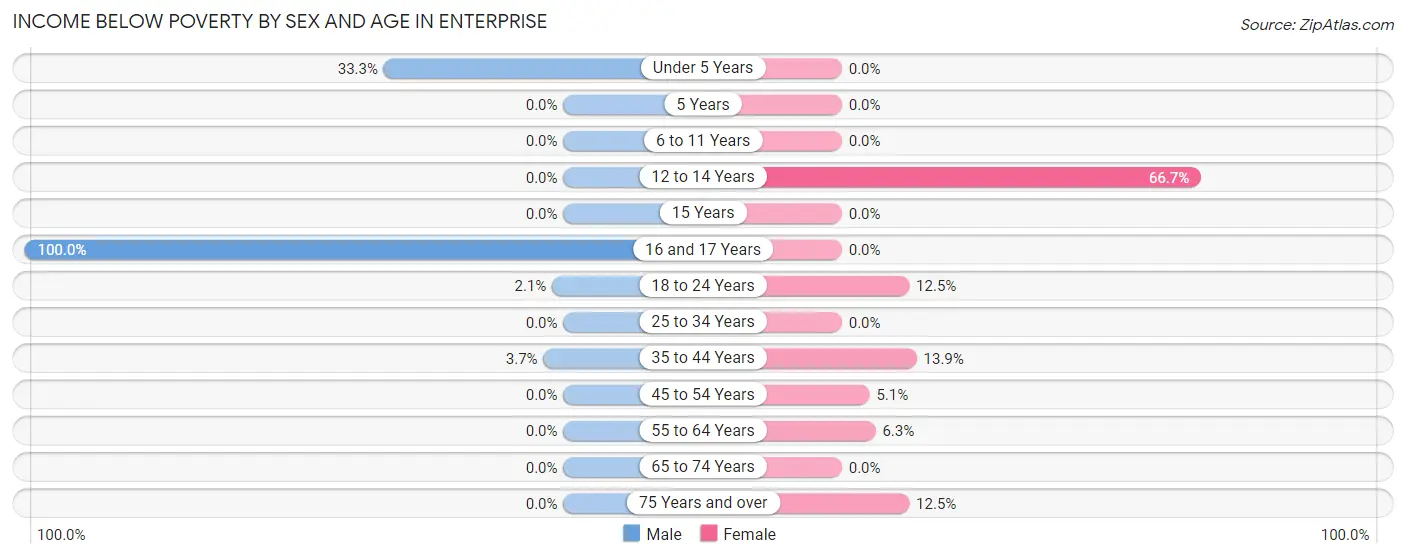
| Age Bracket | Male | Female |
| Under 5 Years | 2 (33.3%) | 0 (0.0%) |
| 5 Years | 0 (0.0%) | 0 (0.0%) |
| 6 to 11 Years | 0 (0.0%) | 0 (0.0%) |
| 12 to 14 Years | 0 (0.0%) | 2 (66.7%) |
| 15 Years | 0 (0.0%) | 0 (0.0%) |
| 16 and 17 Years | 4 (100.0%) | 0 (0.0%) |
| 18 to 24 Years | 1 (2.1%) | 2 (12.5%) |
| 25 to 34 Years | 0 (0.0%) | 0 (0.0%) |
| 35 to 44 Years | 1 (3.7%) | 5 (13.9%) |
| 45 to 54 Years | 0 (0.0%) | 2 (5.1%) |
| 55 to 64 Years | 0 (0.0%) | 2 (6.2%) |
| 65 to 74 Years | 0 (0.0%) | 0 (0.0%) |
| 75 Years and over | 0 (0.0%) | 1 (12.5%) |
| Total | 8 (3.4%) | 14 (5.7%) |
Income Above Poverty by Sex and Age in Enterprise
According to the poverty statistics in Enterprise, males aged 6 to 11 years and females aged 5 years are the age groups that are most secure financially, with 100.0% of males and 100.0% of females in these age groups living above the poverty line.
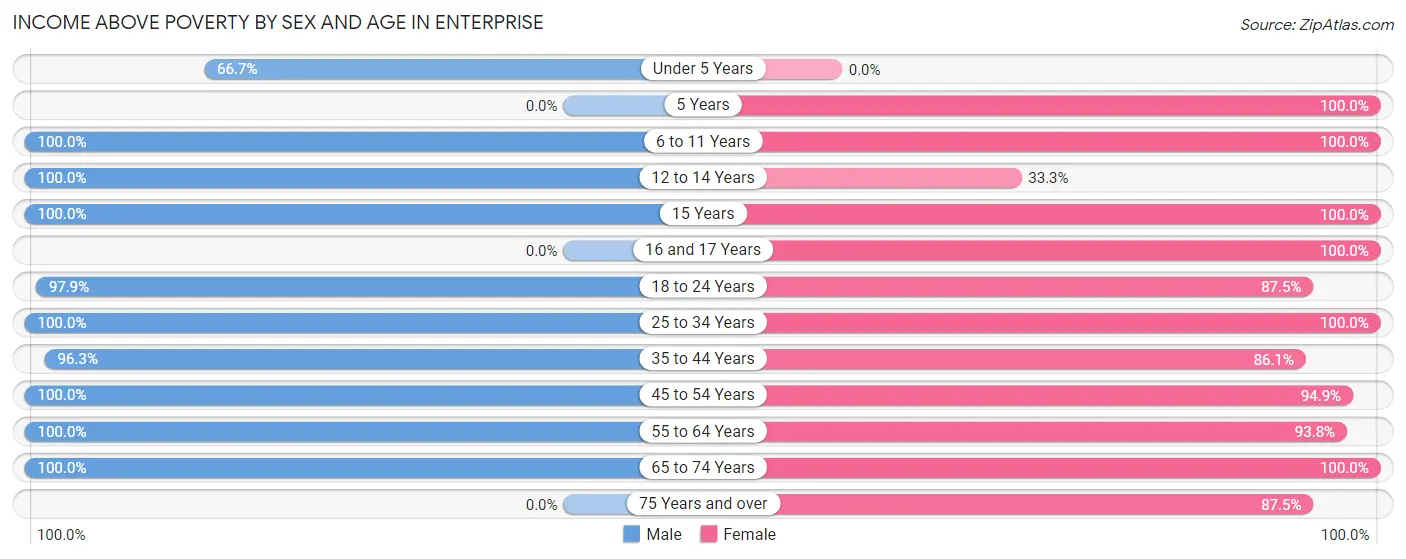
| Age Bracket | Male | Female |
| Under 5 Years | 4 (66.7%) | 0 (0.0%) |
| 5 Years | 0 (0.0%) | 5 (100.0%) |
| 6 to 11 Years | 16 (100.0%) | 31 (100.0%) |
| 12 to 14 Years | 19 (100.0%) | 1 (33.3%) |
| 15 Years | 5 (100.0%) | 9 (100.0%) |
| 16 and 17 Years | 0 (0.0%) | 18 (100.0%) |
| 18 to 24 Years | 47 (97.9%) | 14 (87.5%) |
| 25 to 34 Years | 14 (100.0%) | 13 (100.0%) |
| 35 to 44 Years | 26 (96.3%) | 31 (86.1%) |
| 45 to 54 Years | 53 (100.0%) | 37 (94.9%) |
| 55 to 64 Years | 18 (100.0%) | 30 (93.8%) |
| 65 to 74 Years | 26 (100.0%) | 34 (100.0%) |
| 75 Years and over | 0 (0.0%) | 7 (87.5%) |
| Total | 228 (96.6%) | 230 (94.3%) |
Income Below Poverty Among Married-Couple Families in Enterprise
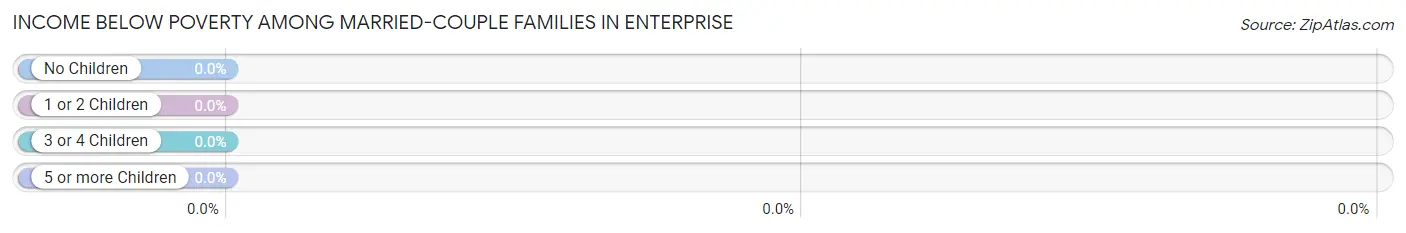
| Children | Above Poverty | Below Poverty |
| No Children | 59 (100.0%) | 0 (0.0%) |
| 1 or 2 Children | 26 (100.0%) | 0 (0.0%) |
| 3 or 4 Children | 5 (100.0%) | 0 (0.0%) |
| 5 or more Children | 0 (0.0%) | 0 (0.0%) |
| Total | 90 (100.0%) | 0 (0.0%) |
Income Below Poverty Among Single-Parent Households in Enterprise
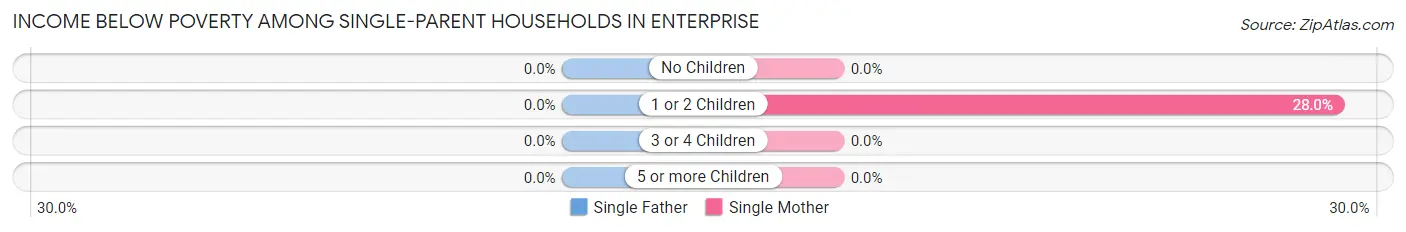
| Children | Single Father | Single Mother |
| No Children | 0 (0.0%) | 0 (0.0%) |
| 1 or 2 Children | 0 (0.0%) | 7 (28.0%) |
| 3 or 4 Children | 0 (0.0%) | 0 (0.0%) |
| 5 or more Children | 0 (0.0%) | 0 (0.0%) |
| Total | 0 (0.0%) | 7 (24.1%) |
Income Below Poverty Among Married-Couple vs Single-Parent Households in Enterprise
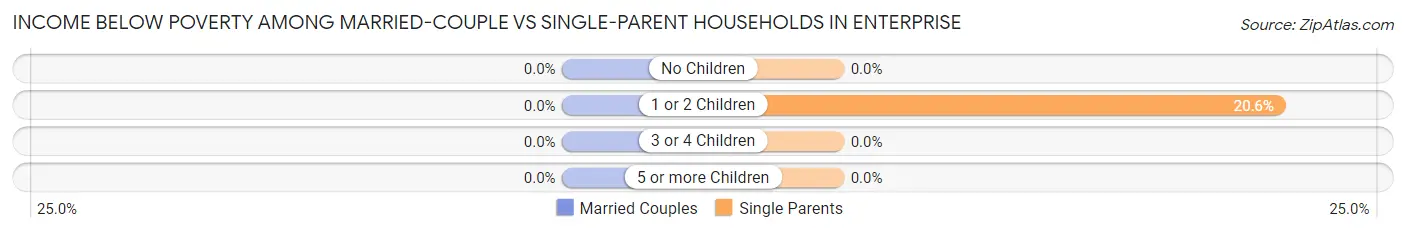
| Children | Married-Couple Families | Single-Parent Households |
| No Children | 0 (0.0%) | 0 (0.0%) |
| 1 or 2 Children | 0 (0.0%) | 7 (20.6%) |
| 3 or 4 Children | 0 (0.0%) | 0 (0.0%) |
| 5 or more Children | 0 (0.0%) | 0 (0.0%) |
| Total | 0 (0.0%) | 7 (17.9%) |
Race in Enterprise
The most populous races in Enterprise are White / Caucasian (359 | 69.8%), Black / African American (93 | 18.1%), and Two or more Races (49 | 9.5%).
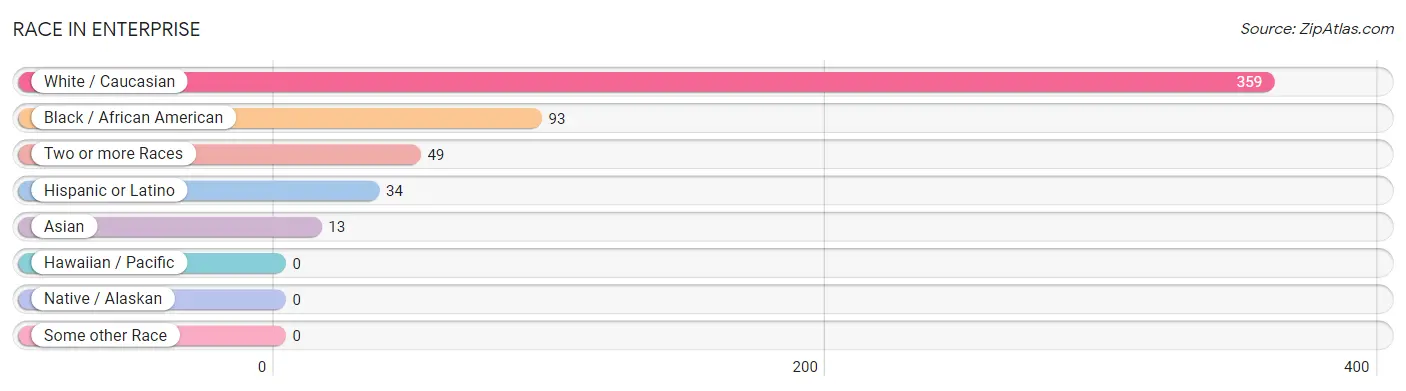
| Race | # Population | % Population |
| Asian | 13 | 2.5% |
| Black / African American | 93 | 18.1% |
| Hawaiian / Pacific | 0 | 0.0% |
| Hispanic or Latino | 34 | 6.6% |
| Native / Alaskan | 0 | 0.0% |
| White / Caucasian | 359 | 69.8% |
| Two or more Races | 49 | 9.5% |
| Some other Race | 0 | 0.0% |
| Total | 514 | 100.0% |
Ancestry in Enterprise
The most populous ancestries reported in Enterprise are German (86 | 16.7%), English (77 | 15.0%), American (63 | 12.3%), Irish (54 | 10.5%), and Thai (39 | 7.6%), together accounting for 62.1% of all Enterprise residents.
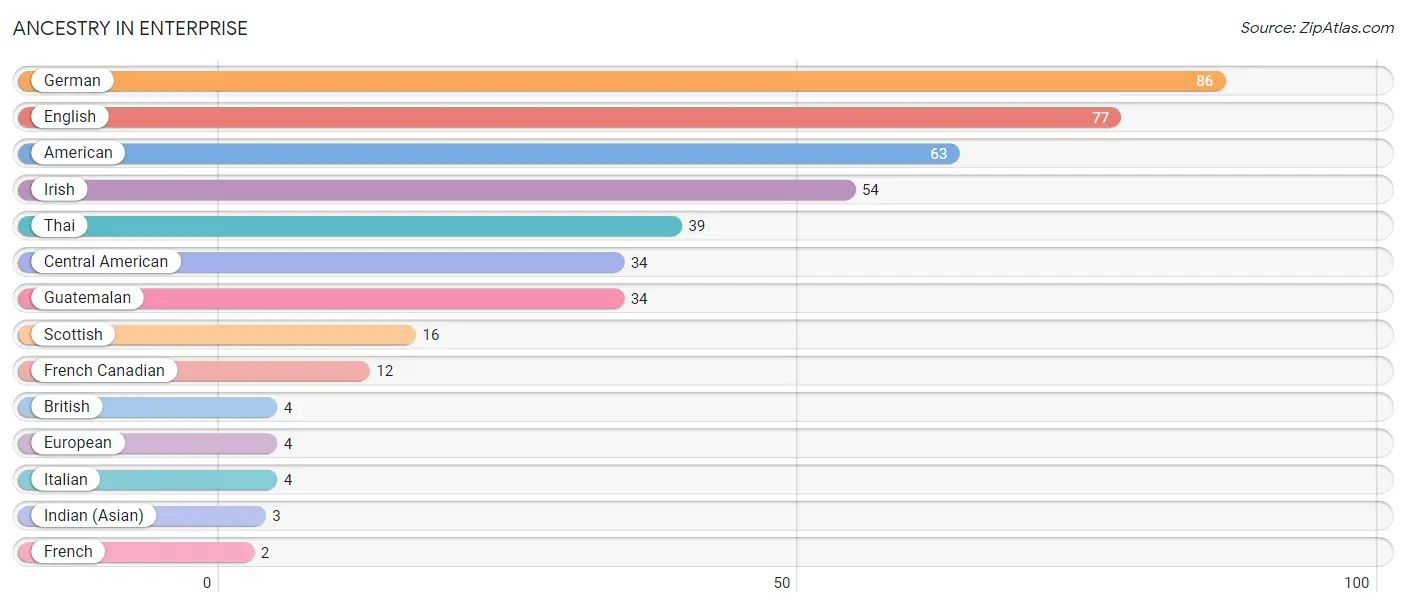
| Ancestry | # Population | % Population |
| American | 63 | 12.3% |
| British | 4 | 0.8% |
| Central American | 34 | 6.6% |
| English | 77 | 15.0% |
| European | 4 | 0.8% |
| French | 2 | 0.4% |
| French Canadian | 12 | 2.3% |
| German | 86 | 16.7% |
| Guatemalan | 34 | 6.6% |
| Indian (Asian) | 3 | 0.6% |
| Irish | 54 | 10.5% |
| Italian | 4 | 0.8% |
| Scottish | 16 | 3.1% |
| Thai | 39 | 7.6% | View All 14 Rows |
Immigrants in Enterprise
The most numerous immigrant groups reported in Enterprise came from Asia (13 | 2.5%), South Eastern Asia (13 | 2.5%), Thailand (13 | 2.5%), Central America (8 | 1.6%), and Guatemala (8 | 1.6%), together accounting for 10.7% of all Enterprise residents.
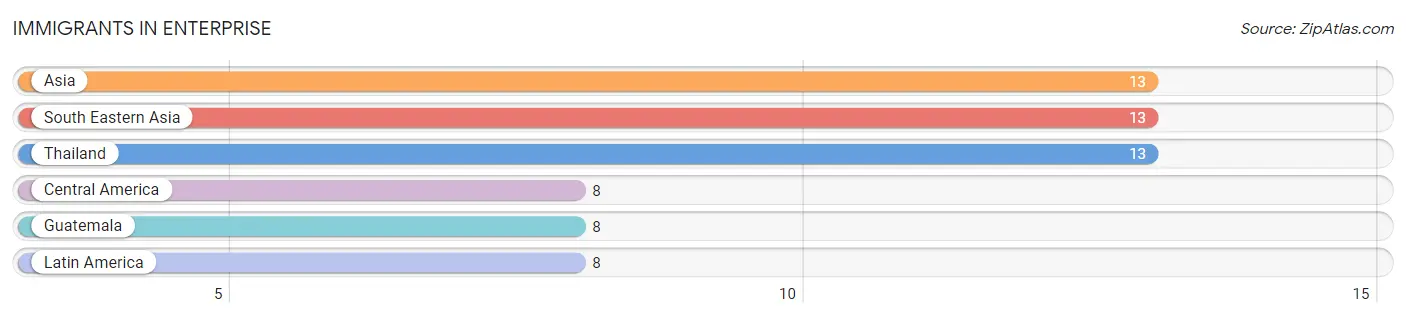
| Immigration Origin | # Population | % Population |
| Asia | 13 | 2.5% |
| Central America | 8 | 1.6% |
| Guatemala | 8 | 1.6% |
| Latin America | 8 | 1.6% |
| South Eastern Asia | 13 | 2.5% |
| Thailand | 13 | 2.5% | View All 6 Rows |
Sex and Age in Enterprise
Sex and Age in Enterprise
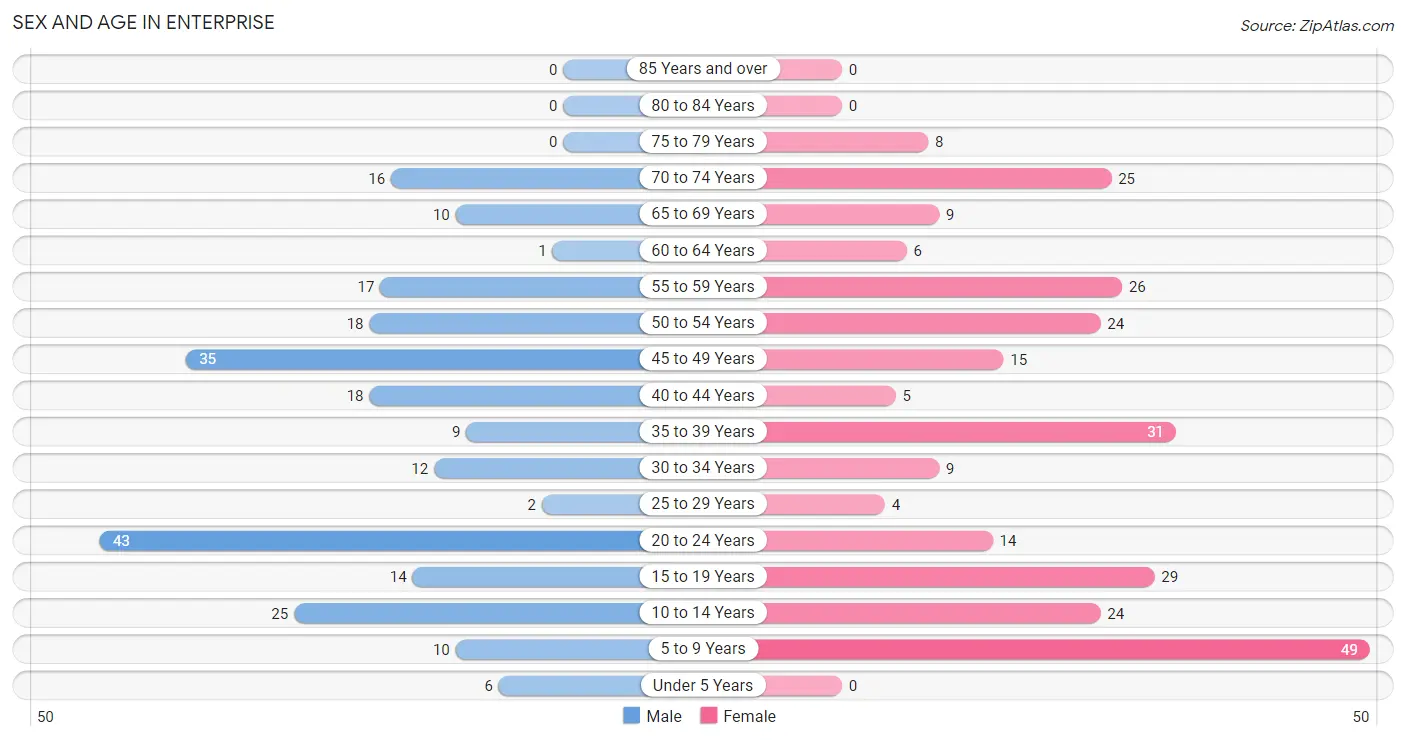
The most populous age groups in Enterprise are 20 to 24 Years (43 | 18.2%) for men and 5 to 9 Years (49 | 17.6%) for women.
| Age Bracket | Male | Female |
| Under 5 Years | 6 (2.5%) | 0 (0.0%) |
| 5 to 9 Years | 10 (4.2%) | 49 (17.6%) |
| 10 to 14 Years | 25 (10.6%) | 24 (8.6%) |
| 15 to 19 Years | 14 (5.9%) | 29 (10.4%) |
| 20 to 24 Years | 43 (18.2%) | 14 (5.0%) |
| 25 to 29 Years | 2 (0.9%) | 4 (1.4%) |
| 30 to 34 Years | 12 (5.1%) | 9 (3.2%) |
| 35 to 39 Years | 9 (3.8%) | 31 (11.2%) |
| 40 to 44 Years | 18 (7.6%) | 5 (1.8%) |
| 45 to 49 Years | 35 (14.8%) | 15 (5.4%) |
| 50 to 54 Years | 18 (7.6%) | 24 (8.6%) |
| 55 to 59 Years | 17 (7.2%) | 26 (9.3%) |
| 60 to 64 Years | 1 (0.4%) | 6 (2.2%) |
| 65 to 69 Years | 10 (4.2%) | 9 (3.2%) |
| 70 to 74 Years | 16 (6.8%) | 25 (9.0%) |
| 75 to 79 Years | 0 (0.0%) | 8 (2.9%) |
| 80 to 84 Years | 0 (0.0%) | 0 (0.0%) |
| 85 Years and over | 0 (0.0%) | 0 (0.0%) |
| Total | 236 (100.0%) | 278 (100.0%) |
Families and Households in Enterprise
Median Family Size in Enterprise
The median family size in Enterprise is 3.16 persons per family, with single male/father families (10 | 7.7%) accounting for the largest median family size of 7.7 persons per family. On the other hand, single female/mother families (29 | 22.5%) represent the smallest median family size with 2.72 persons per family.
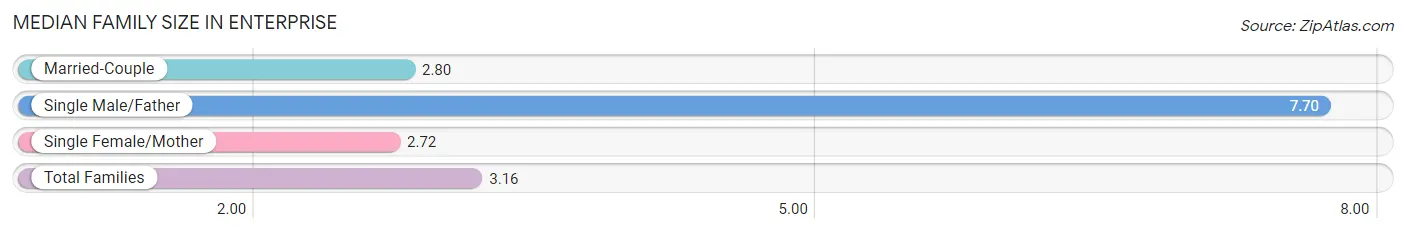
| Family Type | # Families | Family Size |
| Married-Couple | 90 (69.8%) | 2.80 |
| Single Male/Father | 10 (7.7%) | 7.70 |
| Single Female/Mother | 29 (22.5%) | 2.72 |
| Total Families | 129 (100.0%) | 3.16 |
Median Household Size in Enterprise
The median household size in Enterprise is 2.78 persons per household, with single male/father households (10 | 5.4%) accounting for the largest median household size of 7.8 persons per household. non-family households (56 | 30.3%) represent the smallest median household size with 1.14 persons per household.
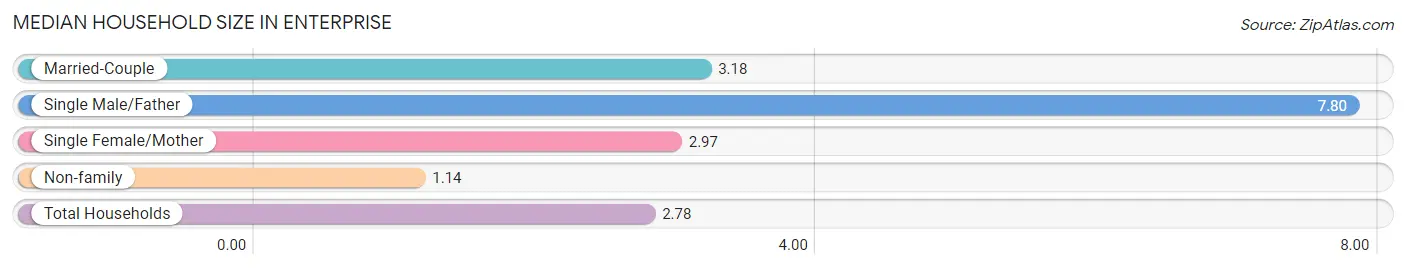
| Household Type | # Households | Household Size |
| Married-Couple | 90 (48.6%) | 3.18 |
| Single Male/Father | 10 (5.4%) | 7.80 |
| Single Female/Mother | 29 (15.7%) | 2.97 |
| Non-family | 56 (30.3%) | 1.14 |
| Total Households | 185 (100.0%) | 2.78 |
Household Size by Marriage Status in Enterprise
Out of a total of 185 households in Enterprise, 129 (69.7%) are family households, while 56 (30.3%) are nonfamily households. The most numerous type of family households are 2-person households, comprising 62, and the most common type of nonfamily households are 1-person households, comprising 46.
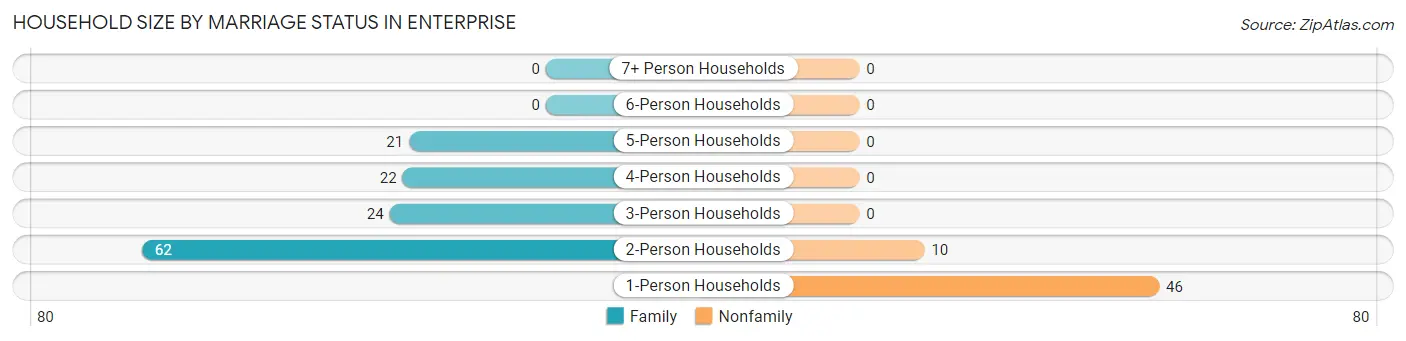
| Household Size | Family Households | Nonfamily Households |
| 1-Person Households | - | 46 (24.9%) |
| 2-Person Households | 62 (33.5%) | 10 (5.4%) |
| 3-Person Households | 24 (13.0%) | 0 (0.0%) |
| 4-Person Households | 22 (11.9%) | 0 (0.0%) |
| 5-Person Households | 21 (11.4%) | 0 (0.0%) |
| 6-Person Households | 0 (0.0%) | 0 (0.0%) |
| 7+ Person Households | 0 (0.0%) | 0 (0.0%) |
| Total | 129 (69.7%) | 56 (30.3%) |
Female Fertility in Enterprise
Fertility by Age in Enterprise
Average fertility rate in Enterprise is 18.0 births per 1,000 women. Women in the age bracket of 20 to 34 years have the highest fertility rate with 74.0 births per 1,000 women. Women in the age bracket of 20 to 34 years acount for 100.0% of all women with births.
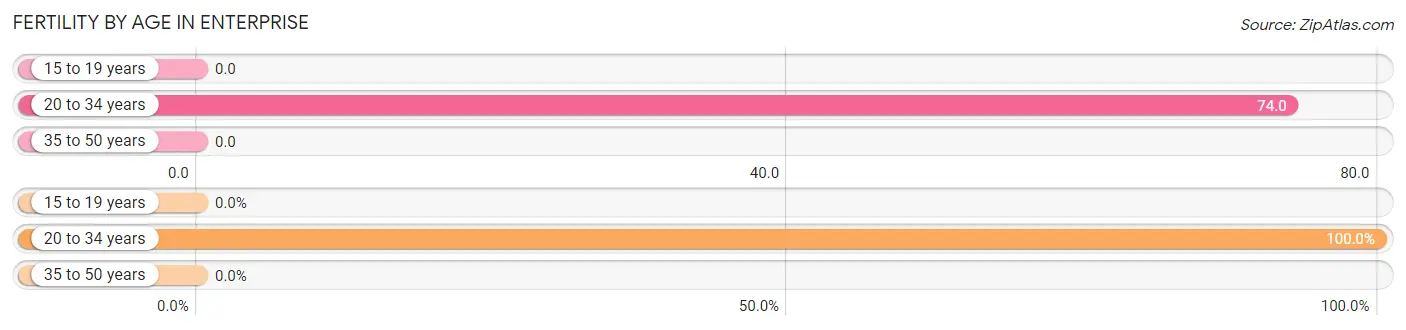
| Age Bracket | Women with Births | Births / 1,000 Women |
| 15 to 19 years | 0 (0.0%) | 0.0 |
| 20 to 34 years | 2 (100.0%) | 74.0 |
| 35 to 50 years | 0 (0.0%) | 0.0 |
| Total | 2 (100.0%) | 18.0 |
Fertility by Age by Marriage Status in Enterprise
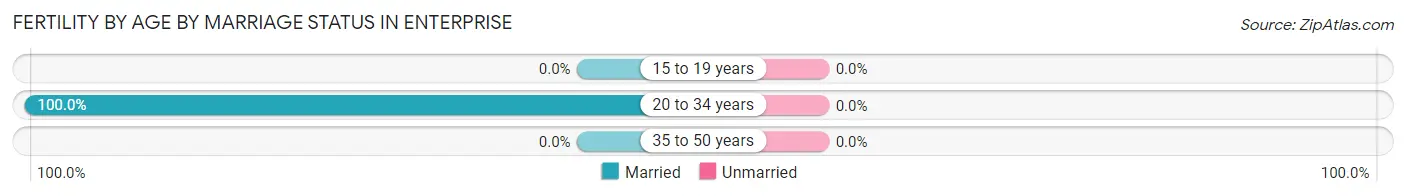
| Age Bracket | Married | Unmarried |
| 15 to 19 years | 0 (0.0%) | 0 (0.0%) |
| 20 to 34 years | 2 (100.0%) | 0 (0.0%) |
| 35 to 50 years | 0 (0.0%) | 0 (0.0%) |
| Total | 2 (100.0%) | 0 (0.0%) |
Fertility by Education in Enterprise
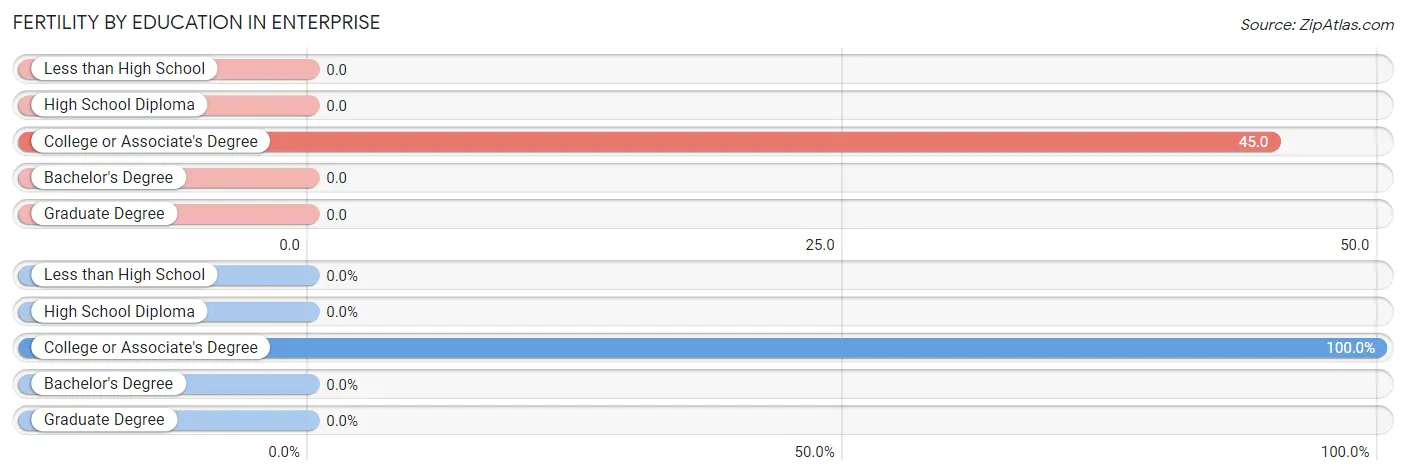
| Educational Attainment | Women with Births | Births / 1,000 Women |
| Less than High School | 0 (0.0%) | 0.0 |
| High School Diploma | 0 (0.0%) | 0.0 |
| College or Associate's Degree | 2 (100.0%) | 45.0 |
| Bachelor's Degree | 0 (0.0%) | 0.0 |
| Graduate Degree | 0 (0.0%) | 0.0 |
| Total | 2 (100.0%) | 18.0 |
Fertility by Education by Marriage Status in Enterprise
| Educational Attainment | Married | Unmarried |
| Less than High School | 0 (0.0%) | 0 (0.0%) |
| High School Diploma | 0 (0.0%) | 0 (0.0%) |
| College or Associate's Degree | 2 (100.0%) | 0 (0.0%) |
| Bachelor's Degree | 0 (0.0%) | 0 (0.0%) |
| Graduate Degree | 0 (0.0%) | 0 (0.0%) |
| Total | 2 (100.0%) | 0 (0.0%) |
Employment Characteristics in Enterprise
Employment by Class of Employer in Enterprise
Among the 247 employed individuals in Enterprise, private company employees (123 | 49.8%), federal government employees (63 | 25.5%), and self-employed (not incorporated) (24 | 9.7%) make up the most common classes of employment.
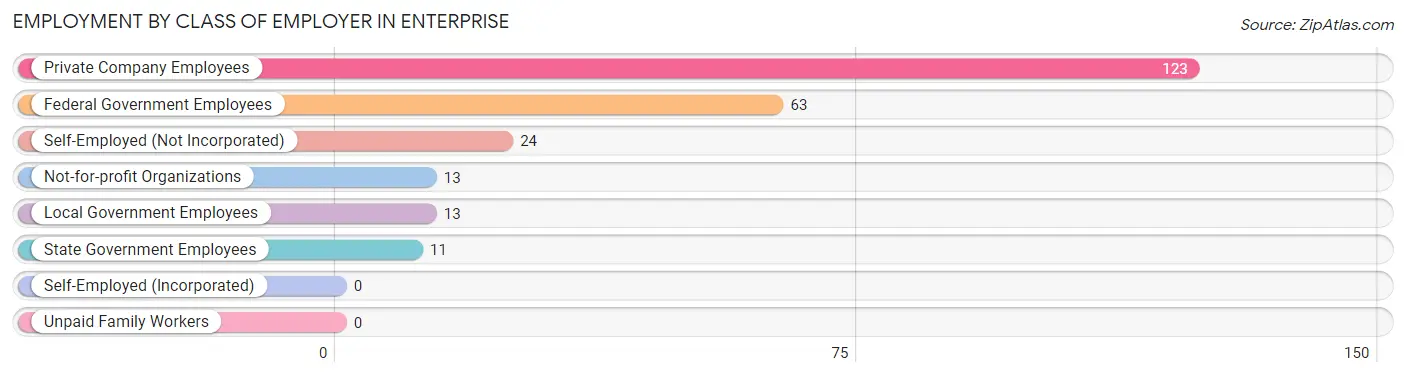
| Employer Class | # Employees | % Employees |
| Private Company Employees | 123 | 49.8% |
| Self-Employed (Incorporated) | 0 | 0.0% |
| Self-Employed (Not Incorporated) | 24 | 9.7% |
| Not-for-profit Organizations | 13 | 5.3% |
| Local Government Employees | 13 | 5.3% |
| State Government Employees | 11 | 4.4% |
| Federal Government Employees | 63 | 25.5% |
| Unpaid Family Workers | 0 | 0.0% |
| Total | 247 | 100.0% |
Employment Status by Age in Enterprise
According to the labor force statistics for Enterprise, out of the total population over 16 years of age (386), 66.8% or 258 individuals are in the labor force, with 1.3% or 3 of them unemployed. The age group with the highest labor force participation rate is 45 to 54 years, with 97.8% or 90 individuals in the labor force. Within the labor force, the 20 to 24 years age range has the highest percentage of unemployed individuals, with 2.3% or 1 of them being unemployed.
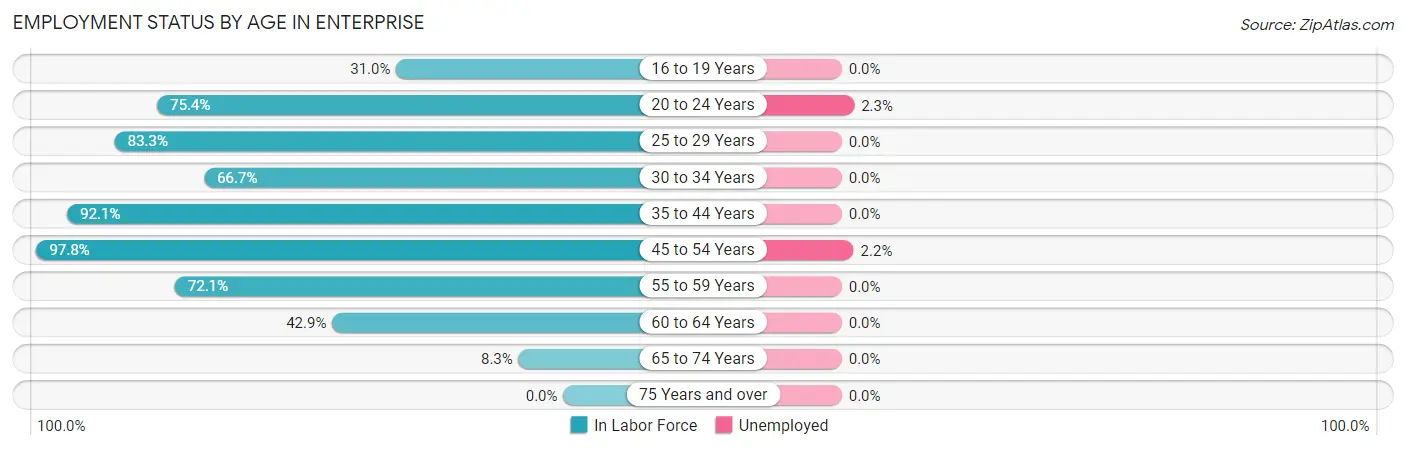
| Age Bracket | In Labor Force | Unemployed |
| 16 to 19 Years | 9 (31.0%) | 0 (0.0%) |
| 20 to 24 Years | 43 (75.4%) | 1 (2.3%) |
| 25 to 29 Years | 5 (83.3%) | 0 (0.0%) |
| 30 to 34 Years | 14 (66.7%) | 0 (0.0%) |
| 35 to 44 Years | 58 (92.1%) | 0 (0.0%) |
| 45 to 54 Years | 90 (97.8%) | 2 (2.2%) |
| 55 to 59 Years | 31 (72.1%) | 0 (0.0%) |
| 60 to 64 Years | 3 (42.9%) | 0 (0.0%) |
| 65 to 74 Years | 5 (8.3%) | 0 (0.0%) |
| 75 Years and over | 0 (0.0%) | 0 (0.0%) |
| Total | 258 (66.8%) | 3 (1.3%) |
Employment Status by Educational Attainment in Enterprise
According to labor force statistics for Enterprise, 86.6% of individuals (201) out of the total population between 25 and 64 years of age (232) are in the labor force, with 1.1% or 2 of them being unemployed. The group with the highest labor force participation rate are those with the educational attainment of less than high school, with 100.0% or 13 individuals in the labor force. Within the labor force, individuals with bachelor's degree or higher education have the highest percentage of unemployment, with 3.4% or 2 of them being unemployed.
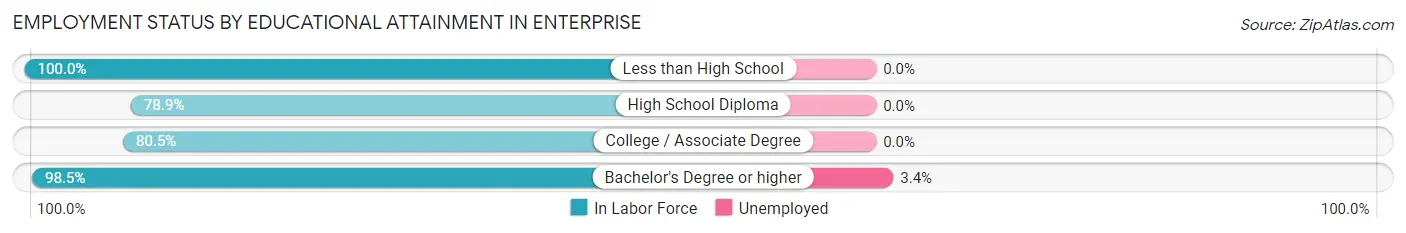
| Educational Attainment | In Labor Force | Unemployed |
| Less than High School | 13 (100.0%) | 0 (0.0%) |
| High School Diploma | 30 (78.9%) | 0 (0.0%) |
| College / Associate Degree | 91 (80.5%) | 0 (0.0%) |
| Bachelor's Degree or higher | 67 (98.5%) | 2 (3.4%) |
| Total | 201 (86.6%) | 3 (1.1%) |
Employment Occupations by Sex in Enterprise
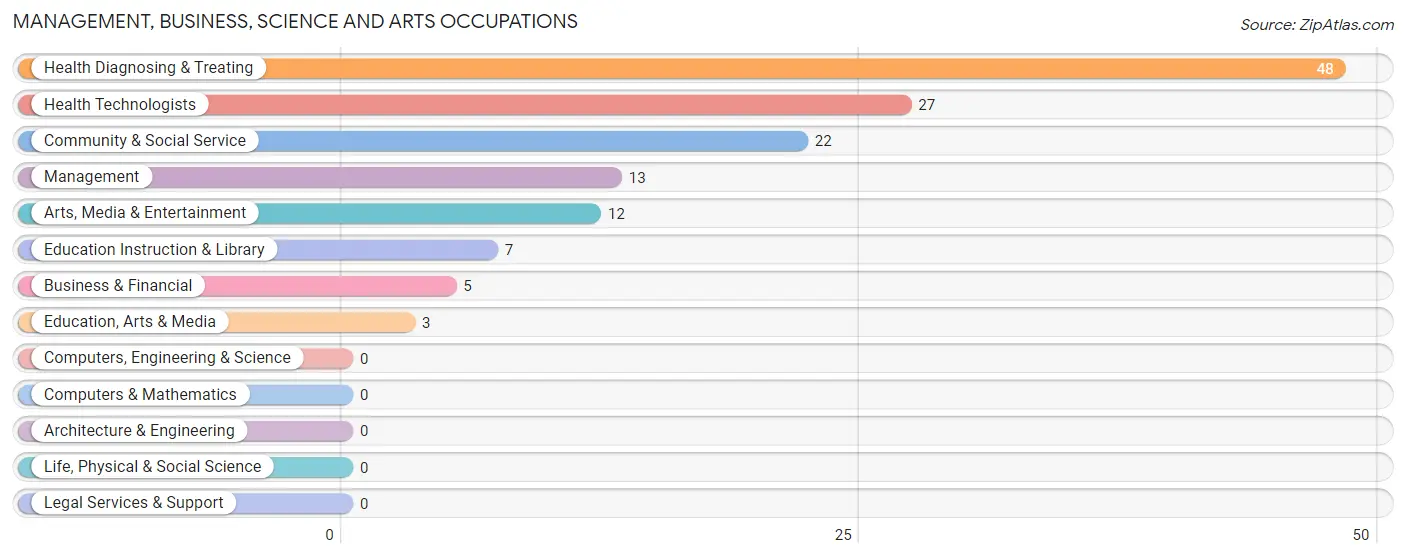
Management, Business, Science and Arts Occupations
The most common Management, Business, Science and Arts occupations in Enterprise are Health Diagnosing & Treating (48 | 20.5%), Health Technologists (27 | 11.5%), Community & Social Service (22 | 9.4%), Management (13 | 5.6%), and Arts, Media & Entertainment (12 | 5.1%).
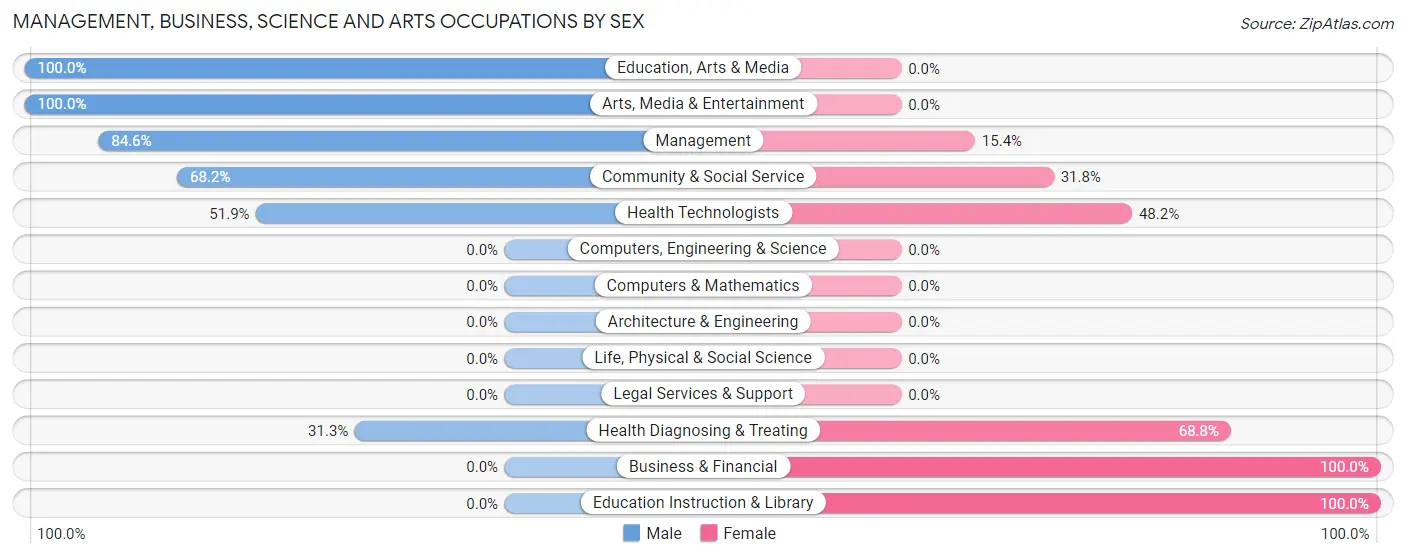
Management, Business, Science and Arts Occupations by Sex
Within the Management, Business, Science and Arts occupations in Enterprise, the most male-oriented occupations are Education, Arts & Media (100.0%), Arts, Media & Entertainment (100.0%), and Management (84.6%), while the most female-oriented occupations are Business & Financial (100.0%), Education Instruction & Library (100.0%), and Health Diagnosing & Treating (68.8%).
| Occupation | Male | Female |
| Management | 11 (84.6%) | 2 (15.4%) |
| Business & Financial | 0 (0.0%) | 5 (100.0%) |
| Computers, Engineering & Science | 0 (0.0%) | 0 (0.0%) |
| Computers & Mathematics | 0 (0.0%) | 0 (0.0%) |
| Architecture & Engineering | 0 (0.0%) | 0 (0.0%) |
| Life, Physical & Social Science | 0 (0.0%) | 0 (0.0%) |
| Community & Social Service | 15 (68.2%) | 7 (31.8%) |
| Education, Arts & Media | 3 (100.0%) | 0 (0.0%) |
| Legal Services & Support | 0 (0.0%) | 0 (0.0%) |
| Education Instruction & Library | 0 (0.0%) | 7 (100.0%) |
| Arts, Media & Entertainment | 12 (100.0%) | 0 (0.0%) |
| Health Diagnosing & Treating | 15 (31.2%) | 33 (68.8%) |
| Health Technologists | 14 (51.8%) | 13 (48.1%) |
| Total (Category) | 41 (46.6%) | 47 (53.4%) |
| Total (Overall) | 136 (58.1%) | 98 (41.9%) |
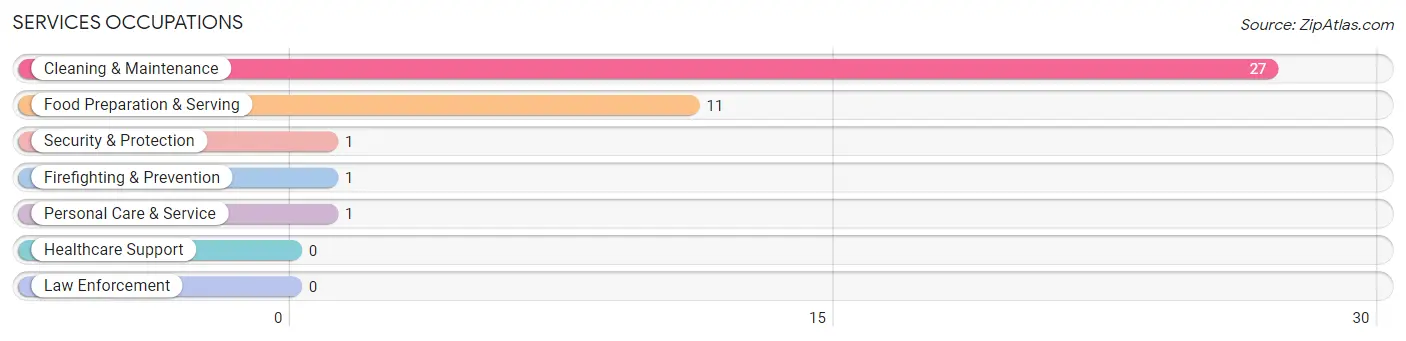
Services Occupations
The most common Services occupations in Enterprise are Cleaning & Maintenance (27 | 11.5%), Food Preparation & Serving (11 | 4.7%), Security & Protection (1 | 0.4%), Firefighting & Prevention (1 | 0.4%), and Personal Care & Service (1 | 0.4%).
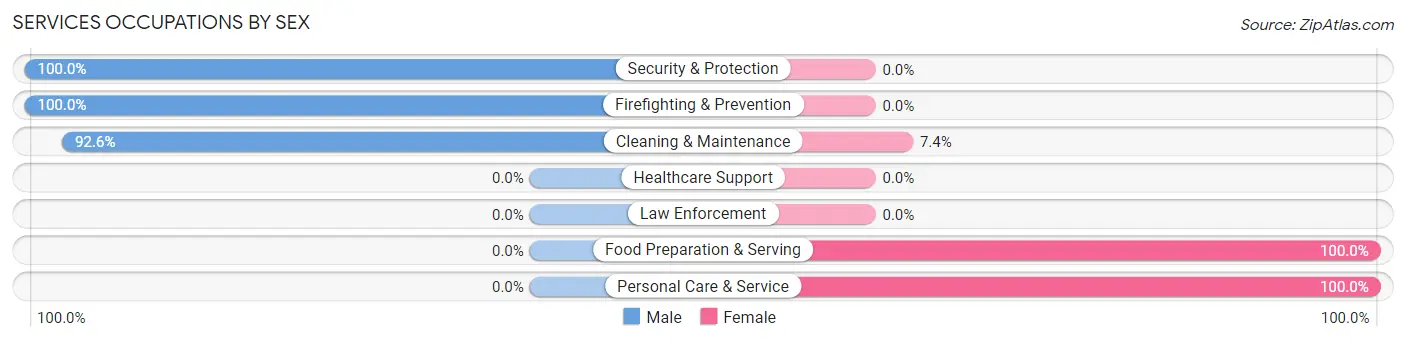
Services Occupations by Sex
Within the Services occupations in Enterprise, the most male-oriented occupations are Security & Protection (100.0%), Firefighting & Prevention (100.0%), and Cleaning & Maintenance (92.6%), while the most female-oriented occupations are Food Preparation & Serving (100.0%), Personal Care & Service (100.0%), and Cleaning & Maintenance (7.4%).
| Occupation | Male | Female |
| Healthcare Support | 0 (0.0%) | 0 (0.0%) |
| Security & Protection | 1 (100.0%) | 0 (0.0%) |
| Firefighting & Prevention | 1 (100.0%) | 0 (0.0%) |
| Law Enforcement | 0 (0.0%) | 0 (0.0%) |
| Food Preparation & Serving | 0 (0.0%) | 11 (100.0%) |
| Cleaning & Maintenance | 25 (92.6%) | 2 (7.4%) |
| Personal Care & Service | 0 (0.0%) | 1 (100.0%) |
| Total (Category) | 26 (65.0%) | 14 (35.0%) |
| Total (Overall) | 136 (58.1%) | 98 (41.9%) |
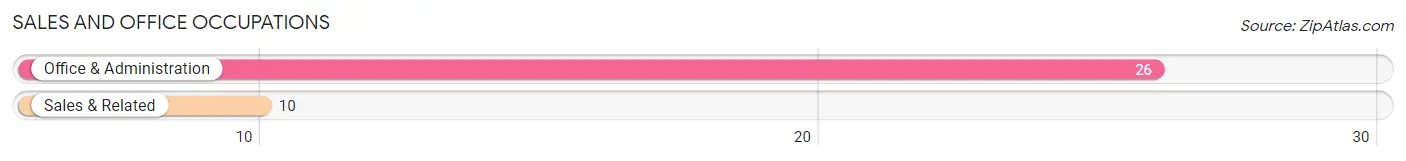
Sales and Office Occupations
The most common Sales and Office occupations in Enterprise are Office & Administration (26 | 11.1%), and Sales & Related (10 | 4.3%).
Sales and Office Occupations by Sex
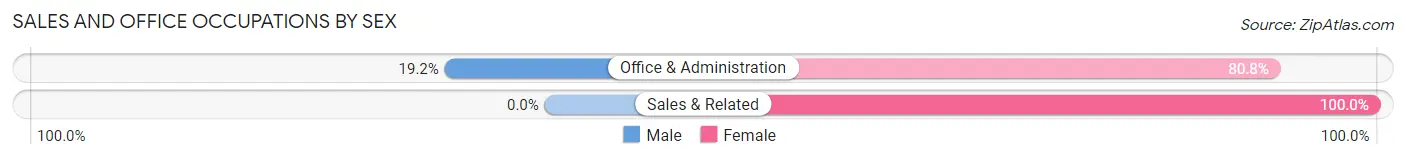
| Occupation | Male | Female |
| Sales & Related | 0 (0.0%) | 10 (100.0%) |
| Office & Administration | 5 (19.2%) | 21 (80.8%) |
| Total (Category) | 5 (13.9%) | 31 (86.1%) |
| Total (Overall) | 136 (58.1%) | 98 (41.9%) |
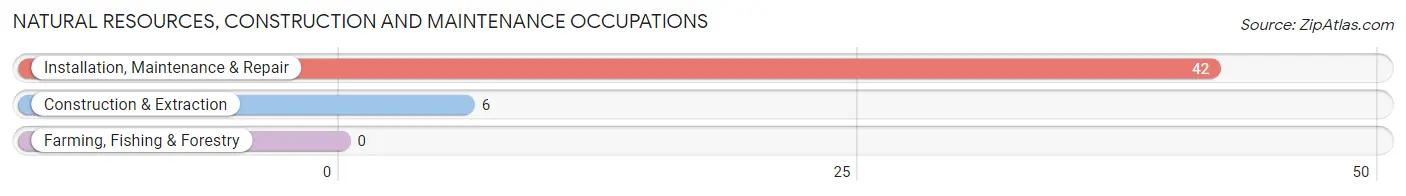
Natural Resources, Construction and Maintenance Occupations
The most common Natural Resources, Construction and Maintenance occupations in Enterprise are Installation, Maintenance & Repair (42 | 17.9%), and Construction & Extraction (6 | 2.6%).
Natural Resources, Construction and Maintenance Occupations by Sex
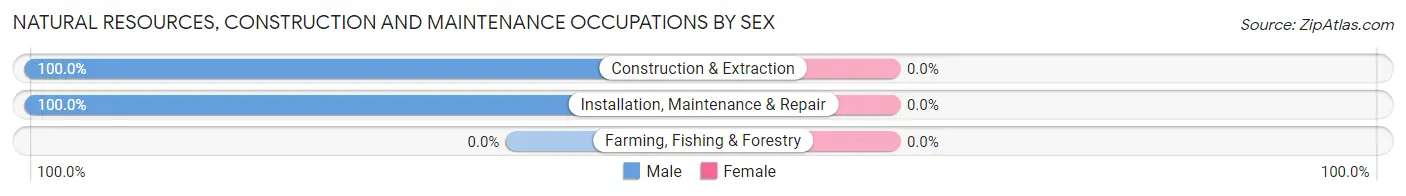
| Occupation | Male | Female |
| Farming, Fishing & Forestry | 0 (0.0%) | 0 (0.0%) |
| Construction & Extraction | 6 (100.0%) | 0 (0.0%) |
| Installation, Maintenance & Repair | 42 (100.0%) | 0 (0.0%) |
| Total (Category) | 48 (100.0%) | 0 (0.0%) |
| Total (Overall) | 136 (58.1%) | 98 (41.9%) |
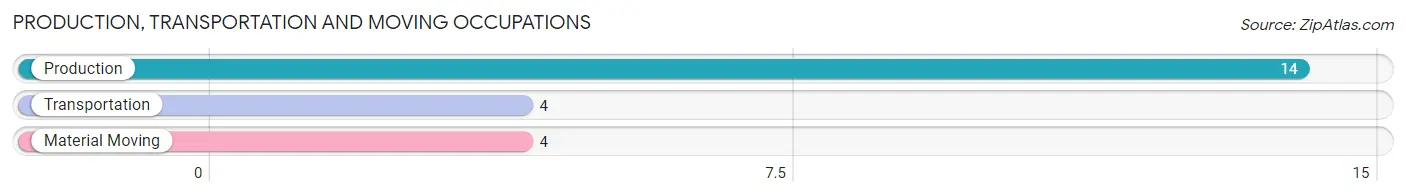
Production, Transportation and Moving Occupations
The most common Production, Transportation and Moving occupations in Enterprise are Production (14 | 6.0%), Transportation (4 | 1.7%), and Material Moving (4 | 1.7%).
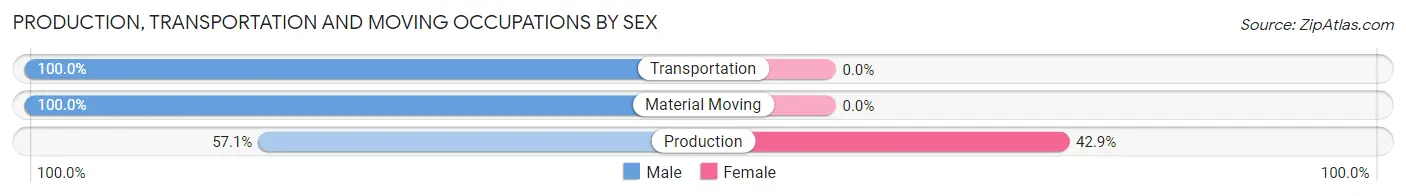
Production, Transportation and Moving Occupations by Sex
| Occupation | Male | Female |
| Production | 8 (57.1%) | 6 (42.9%) |
| Transportation | 4 (100.0%) | 0 (0.0%) |
| Material Moving | 4 (100.0%) | 0 (0.0%) |
| Total (Category) | 16 (72.7%) | 6 (27.3%) |
| Total (Overall) | 136 (58.1%) | 98 (41.9%) |
Employment Industries by Sex in Enterprise
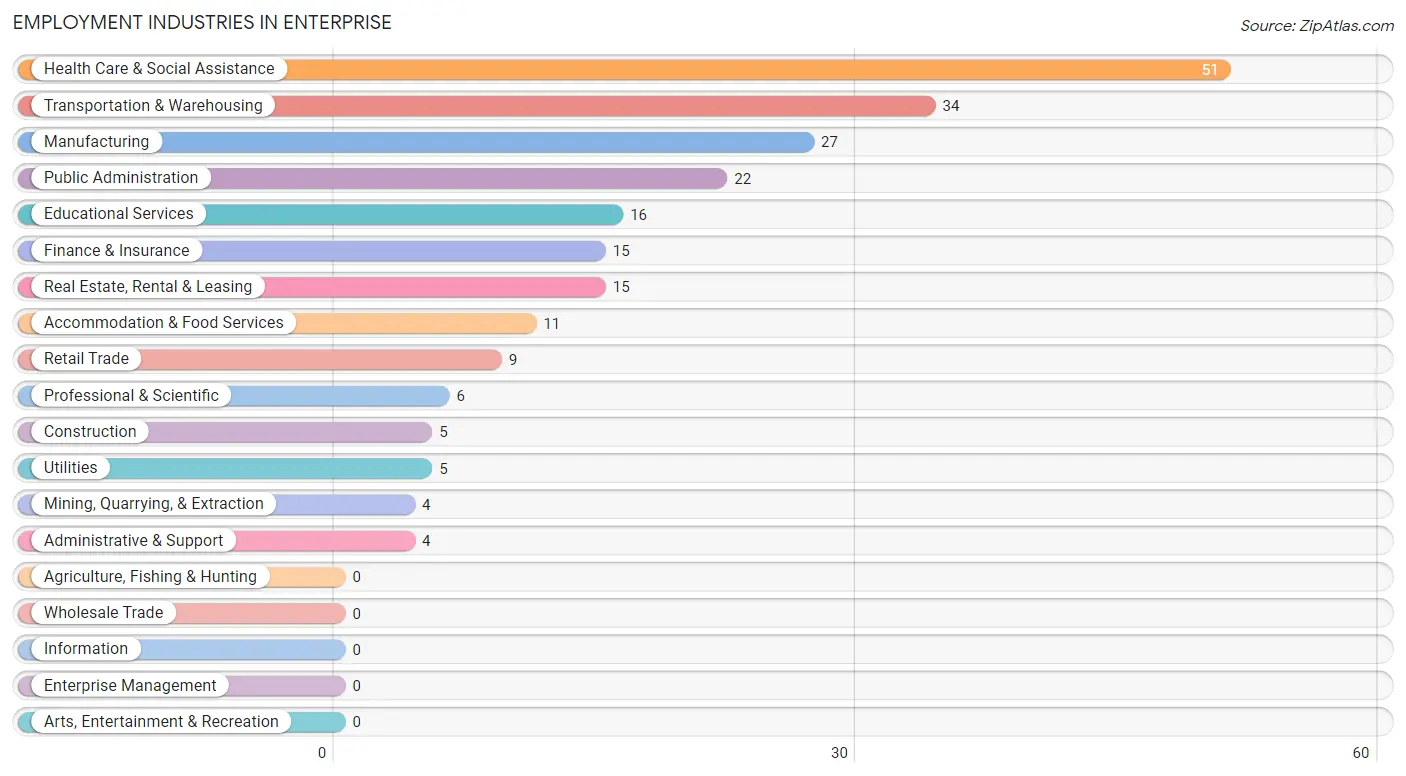
Employment Industries in Enterprise
The major employment industries in Enterprise include Health Care & Social Assistance (51 | 21.8%), Transportation & Warehousing (34 | 14.5%), Manufacturing (27 | 11.5%), Public Administration (22 | 9.4%), and Educational Services (16 | 6.8%).
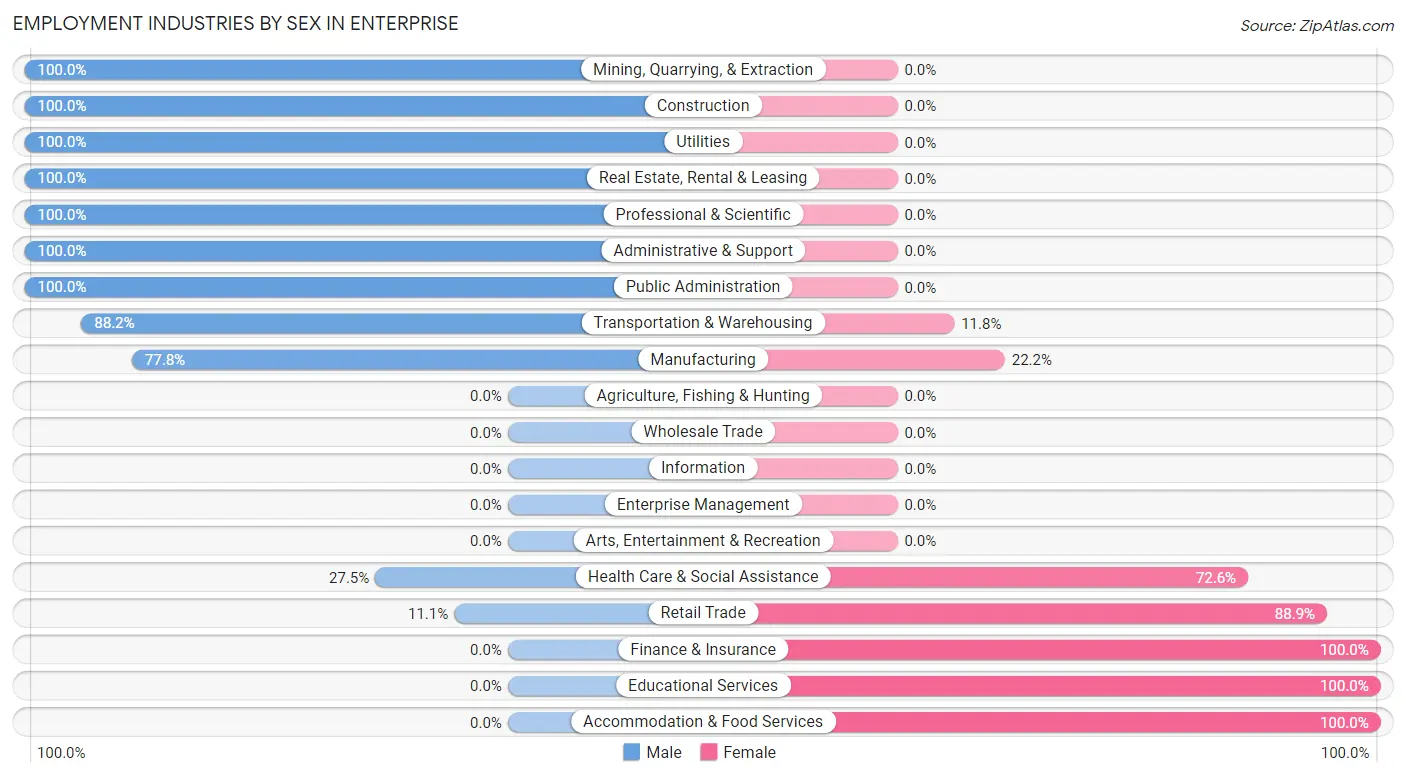
Employment Industries by Sex in Enterprise
The Enterprise industries that see more men than women are Mining, Quarrying, & Extraction (100.0%), Construction (100.0%), and Utilities (100.0%), whereas the industries that tend to have a higher number of women are Finance & Insurance (100.0%), Educational Services (100.0%), and Accommodation & Food Services (100.0%).
| Industry | Male | Female |
| Agriculture, Fishing & Hunting | 0 (0.0%) | 0 (0.0%) |
| Mining, Quarrying, & Extraction | 4 (100.0%) | 0 (0.0%) |
| Construction | 5 (100.0%) | 0 (0.0%) |
| Manufacturing | 21 (77.8%) | 6 (22.2%) |
| Wholesale Trade | 0 (0.0%) | 0 (0.0%) |
| Retail Trade | 1 (11.1%) | 8 (88.9%) |
| Transportation & Warehousing | 30 (88.2%) | 4 (11.8%) |
| Utilities | 5 (100.0%) | 0 (0.0%) |
| Information | 0 (0.0%) | 0 (0.0%) |
| Finance & Insurance | 0 (0.0%) | 15 (100.0%) |
| Real Estate, Rental & Leasing | 15 (100.0%) | 0 (0.0%) |
| Professional & Scientific | 6 (100.0%) | 0 (0.0%) |
| Enterprise Management | 0 (0.0%) | 0 (0.0%) |
| Administrative & Support | 4 (100.0%) | 0 (0.0%) |
| Educational Services | 0 (0.0%) | 16 (100.0%) |
| Health Care & Social Assistance | 14 (27.5%) | 37 (72.6%) |
| Arts, Entertainment & Recreation | 0 (0.0%) | 0 (0.0%) |
| Accommodation & Food Services | 0 (0.0%) | 11 (100.0%) |
| Public Administration | 22 (100.0%) | 0 (0.0%) |
| Total | 136 (58.1%) | 98 (41.9%) |
Education in Enterprise
School Enrollment in Enterprise
The most common levels of schooling among the 165 students in Enterprise are elementary school (59 | 35.8%), middle school (41 | 24.8%), and high school (38 | 23.0%).
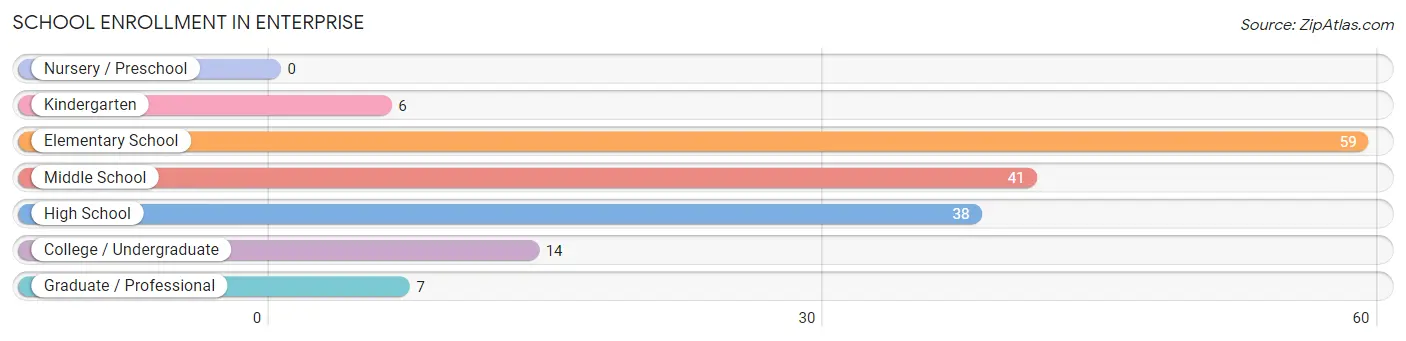
| School Level | # Students | % Students |
| Nursery / Preschool | 0 | 0.0% |
| Kindergarten | 6 | 3.6% |
| Elementary School | 59 | 35.8% |
| Middle School | 41 | 24.8% |
| High School | 38 | 23.0% |
| College / Undergraduate | 14 | 8.5% |
| Graduate / Professional | 7 | 4.2% |
| Total | 165 | 100.0% |
School Enrollment by Age by Funding Source in Enterprise
Out of a total of 165 students who are enrolled in schools in Enterprise, 39 (23.6%) attend a private institution, while the remaining 126 (76.4%) are enrolled in public schools. The age group of 5 to 9 year old has the highest likelihood of being enrolled in private schools, with 23 (39.0% in the age bracket) enrolled. Conversely, the age group of 15 to 17 year olds has the lowest likelihood of being enrolled in a private school, with 36 (100.0% in the age bracket) attending a public institution.
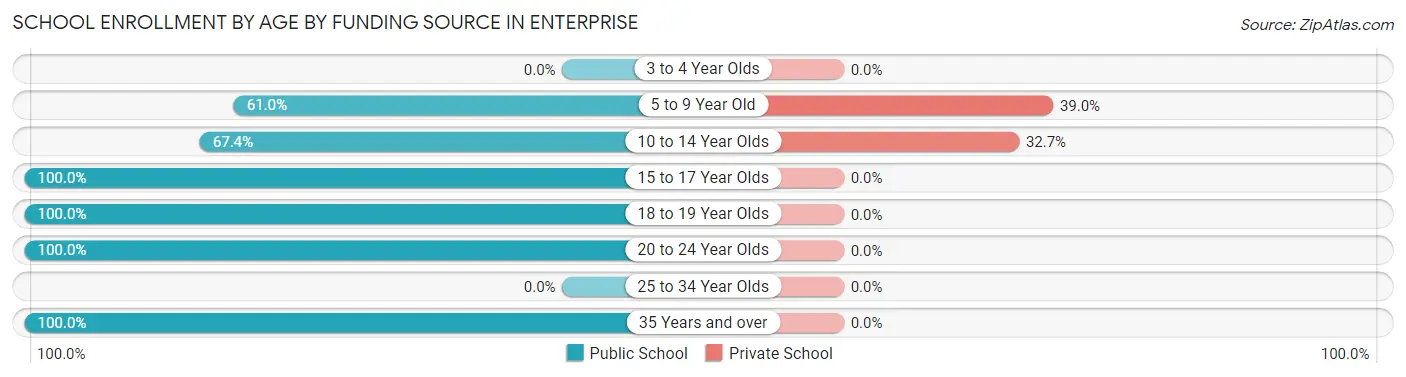
| Age Bracket | Public School | Private School |
| 3 to 4 Year Olds | 0 (0.0%) | 0 (0.0%) |
| 5 to 9 Year Old | 36 (61.0%) | 23 (39.0%) |
| 10 to 14 Year Olds | 33 (67.3%) | 16 (32.7%) |
| 15 to 17 Year Olds | 36 (100.0%) | 0 (0.0%) |
| 18 to 19 Year Olds | 3 (100.0%) | 0 (0.0%) |
| 20 to 24 Year Olds | 9 (100.0%) | 0 (0.0%) |
| 25 to 34 Year Olds | 0 (0.0%) | 0 (0.0%) |
| 35 Years and over | 9 (100.0%) | 0 (0.0%) |
| Total | 126 (76.4%) | 39 (23.6%) |
Educational Attainment by Field of Study in Enterprise
Science & technology (28 | 31.1%), business (23 | 25.6%), engineering (19 | 21.1%), liberal arts & history (8 | 8.9%), and education (5 | 5.6%) are the most common fields of study among 90 individuals in Enterprise who have obtained a bachelor's degree or higher.
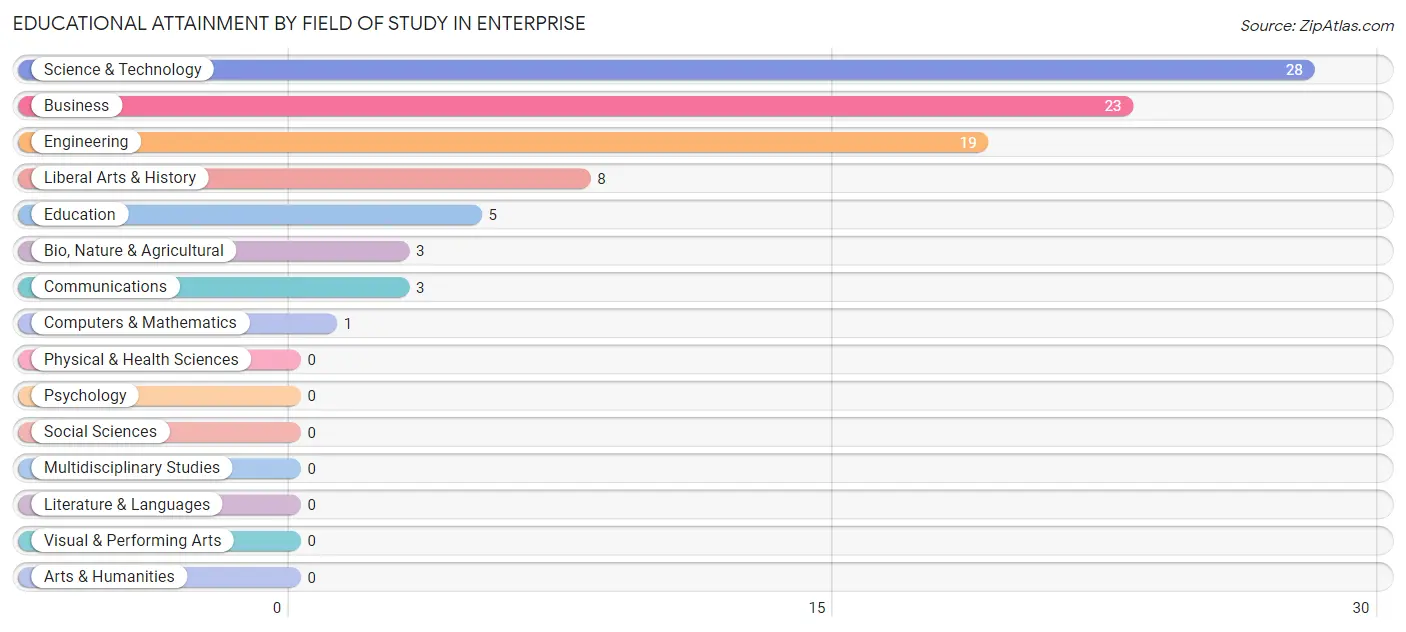
| Field of Study | # Graduates | % Graduates |
| Computers & Mathematics | 1 | 1.1% |
| Bio, Nature & Agricultural | 3 | 3.3% |
| Physical & Health Sciences | 0 | 0.0% |
| Psychology | 0 | 0.0% |
| Social Sciences | 0 | 0.0% |
| Engineering | 19 | 21.1% |
| Multidisciplinary Studies | 0 | 0.0% |
| Science & Technology | 28 | 31.1% |
| Business | 23 | 25.6% |
| Education | 5 | 5.6% |
| Literature & Languages | 0 | 0.0% |
| Liberal Arts & History | 8 | 8.9% |
| Visual & Performing Arts | 0 | 0.0% |
| Communications | 3 | 3.3% |
| Arts & Humanities | 0 | 0.0% |
| Total | 90 | 100.0% |
Transportation & Commute in Enterprise
Vehicle Availability by Sex in Enterprise
The most prevalent vehicle ownership categories in Enterprise are males with 3 vehicles (87, accounting for 58.4%) and females with 3 vehicles (42, making up 88.8%).
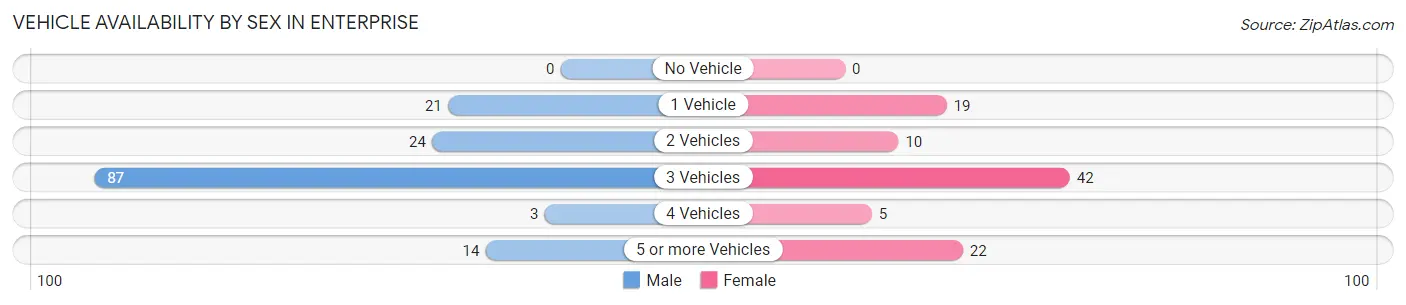
| Vehicles Available | Male | Female |
| No Vehicle | 0 (0.0%) | 0 (0.0%) |
| 1 Vehicle | 21 (14.1%) | 19 (19.4%) |
| 2 Vehicles | 24 (16.1%) | 10 (10.2%) |
| 3 Vehicles | 87 (58.4%) | 42 (42.9%) |
| 4 Vehicles | 3 (2.0%) | 5 (5.1%) |
| 5 or more Vehicles | 14 (9.4%) | 22 (22.5%) |
| Total | 149 (100.0%) | 98 (100.0%) |
Commute Time in Enterprise
The most frequently occuring commute durations in Enterprise are 25 to 29 minutes (65 commuters, 27.2%), 60 to 89 minutes (42 commuters, 17.6%), and 30 to 34 minutes (36 commuters, 15.1%).
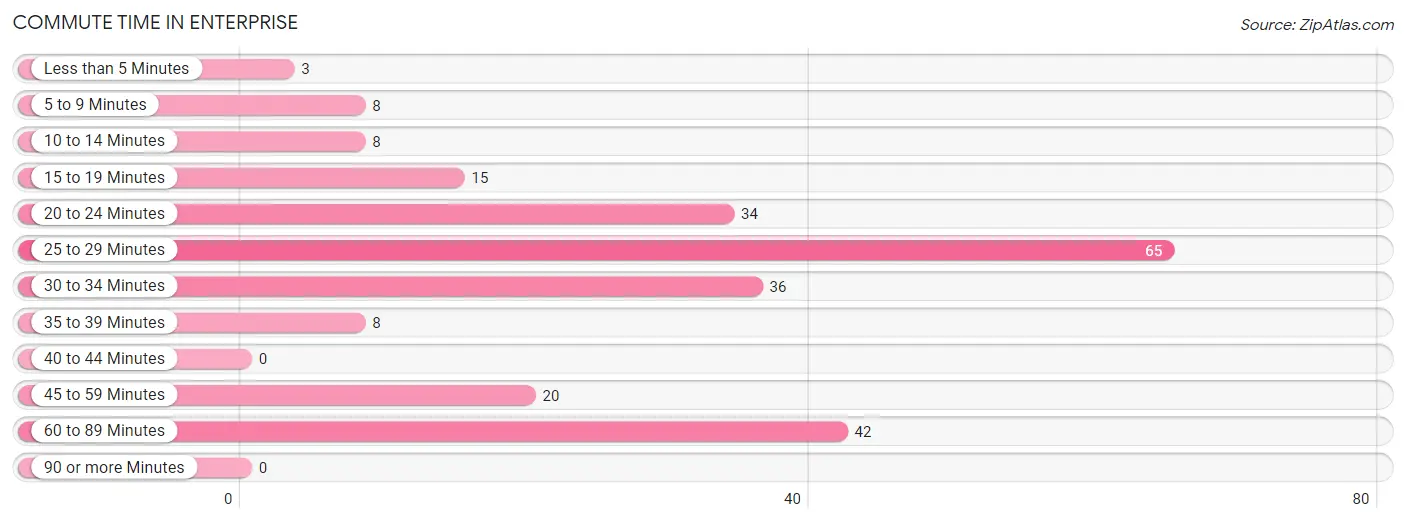
| Commute Time | # Commuters | % Commuters |
| Less than 5 Minutes | 3 | 1.3% |
| 5 to 9 Minutes | 8 | 3.4% |
| 10 to 14 Minutes | 8 | 3.4% |
| 15 to 19 Minutes | 15 | 6.3% |
| 20 to 24 Minutes | 34 | 14.2% |
| 25 to 29 Minutes | 65 | 27.2% |
| 30 to 34 Minutes | 36 | 15.1% |
| 35 to 39 Minutes | 8 | 3.4% |
| 40 to 44 Minutes | 0 | 0.0% |
| 45 to 59 Minutes | 20 | 8.4% |
| 60 to 89 Minutes | 42 | 17.6% |
| 90 or more Minutes | 0 | 0.0% |
Commute Time by Sex in Enterprise
The most common commute times in Enterprise are 60 to 89 minutes (35 commuters, 23.5%) for males and 25 to 29 minutes (32 commuters, 35.6%) for females.
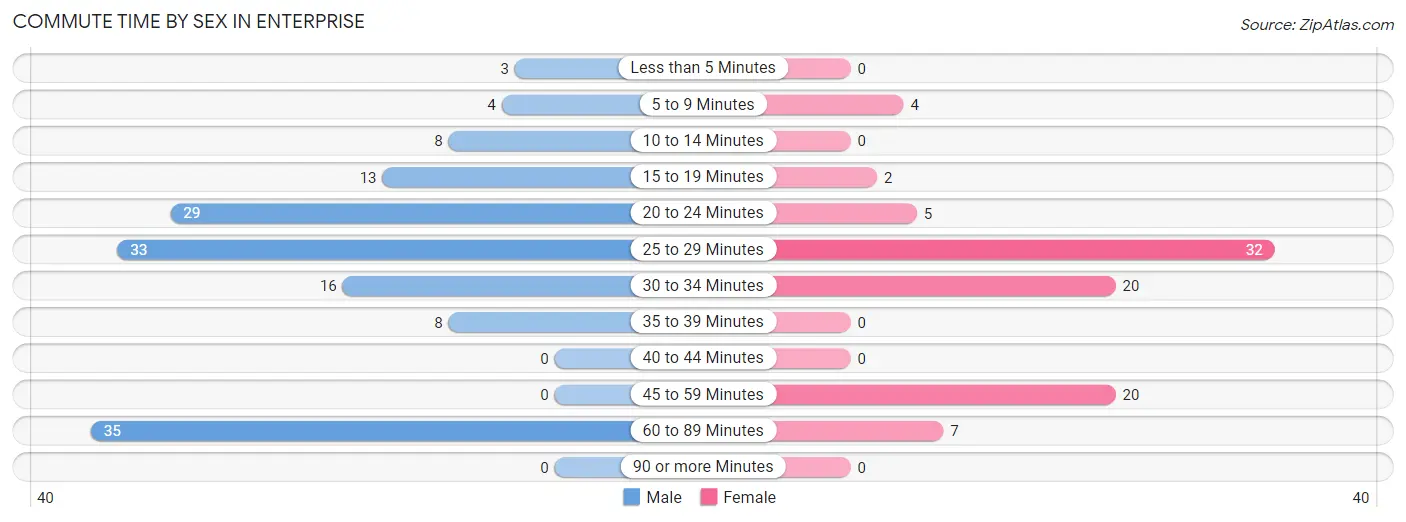
| Commute Time | Male | Female |
| Less than 5 Minutes | 3 (2.0%) | 0 (0.0%) |
| 5 to 9 Minutes | 4 (2.7%) | 4 (4.4%) |
| 10 to 14 Minutes | 8 (5.4%) | 0 (0.0%) |
| 15 to 19 Minutes | 13 (8.7%) | 2 (2.2%) |
| 20 to 24 Minutes | 29 (19.5%) | 5 (5.6%) |
| 25 to 29 Minutes | 33 (22.2%) | 32 (35.6%) |
| 30 to 34 Minutes | 16 (10.7%) | 20 (22.2%) |
| 35 to 39 Minutes | 8 (5.4%) | 0 (0.0%) |
| 40 to 44 Minutes | 0 (0.0%) | 0 (0.0%) |
| 45 to 59 Minutes | 0 (0.0%) | 20 (22.2%) |
| 60 to 89 Minutes | 35 (23.5%) | 7 (7.8%) |
| 90 or more Minutes | 0 (0.0%) | 0 (0.0%) |
Time of Departure to Work by Sex in Enterprise
The most frequent times of departure to work in Enterprise are 6:30 AM to 6:59 AM (48, 32.2%) for males and 7:00 AM to 7:29 AM (35, 38.9%) for females.
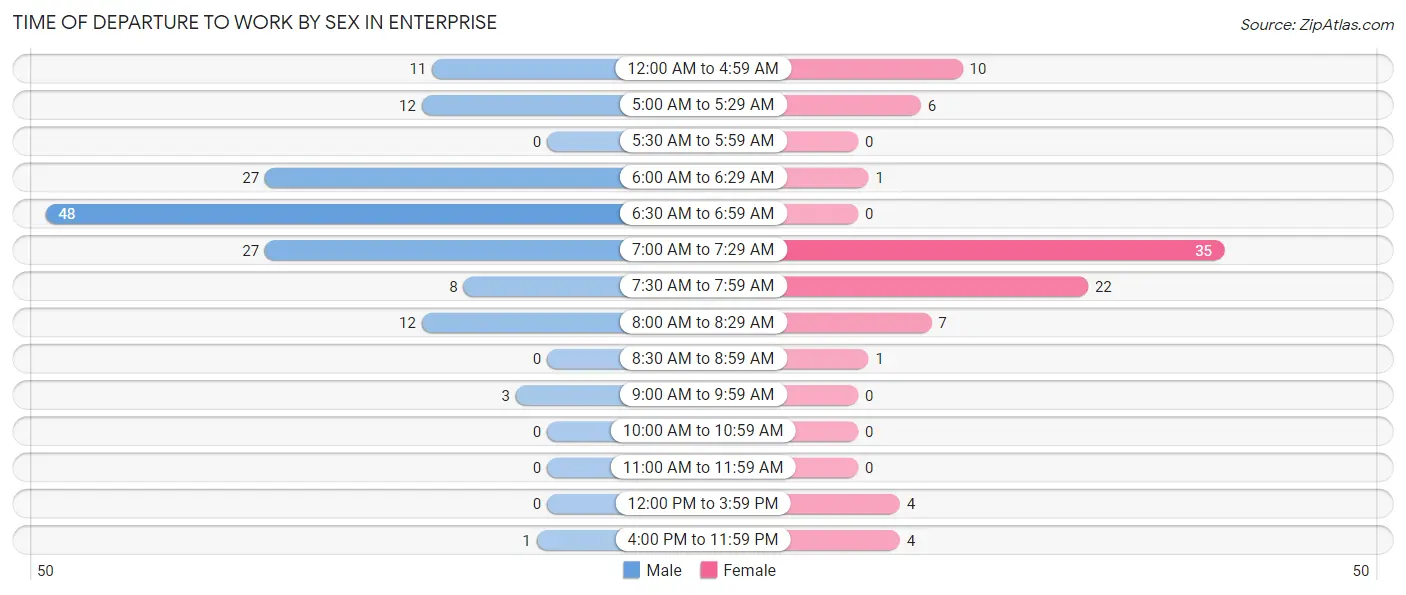
| Time of Departure | Male | Female |
| 12:00 AM to 4:59 AM | 11 (7.4%) | 10 (11.1%) |
| 5:00 AM to 5:29 AM | 12 (8.1%) | 6 (6.7%) |
| 5:30 AM to 5:59 AM | 0 (0.0%) | 0 (0.0%) |
| 6:00 AM to 6:29 AM | 27 (18.1%) | 1 (1.1%) |
| 6:30 AM to 6:59 AM | 48 (32.2%) | 0 (0.0%) |
| 7:00 AM to 7:29 AM | 27 (18.1%) | 35 (38.9%) |
| 7:30 AM to 7:59 AM | 8 (5.4%) | 22 (24.4%) |
| 8:00 AM to 8:29 AM | 12 (8.1%) | 7 (7.8%) |
| 8:30 AM to 8:59 AM | 0 (0.0%) | 1 (1.1%) |
| 9:00 AM to 9:59 AM | 3 (2.0%) | 0 (0.0%) |
| 10:00 AM to 10:59 AM | 0 (0.0%) | 0 (0.0%) |
| 11:00 AM to 11:59 AM | 0 (0.0%) | 0 (0.0%) |
| 12:00 PM to 3:59 PM | 0 (0.0%) | 4 (4.4%) |
| 4:00 PM to 11:59 PM | 1 (0.7%) | 4 (4.4%) |
| Total | 149 (100.0%) | 90 (100.0%) |
Housing Occupancy in Enterprise
Occupancy by Ownership in Enterprise
Of the total 185 dwellings in Enterprise, owner-occupied units account for 144 (77.8%), while renter-occupied units make up 41 (22.2%).
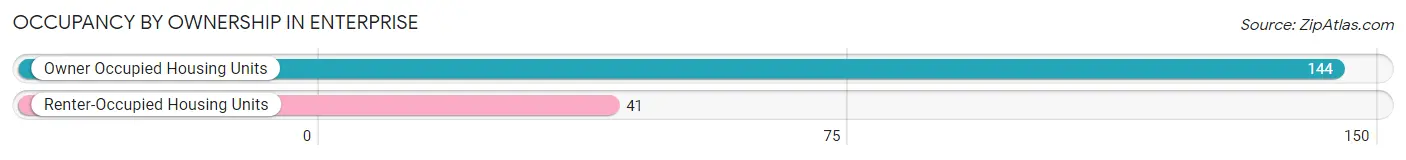
| Occupancy | # Housing Units | % Housing Units |
| Owner Occupied Housing Units | 144 | 77.8% |
| Renter-Occupied Housing Units | 41 | 22.2% |
| Total Occupied Housing Units | 185 | 100.0% |
Occupancy by Household Size in Enterprise
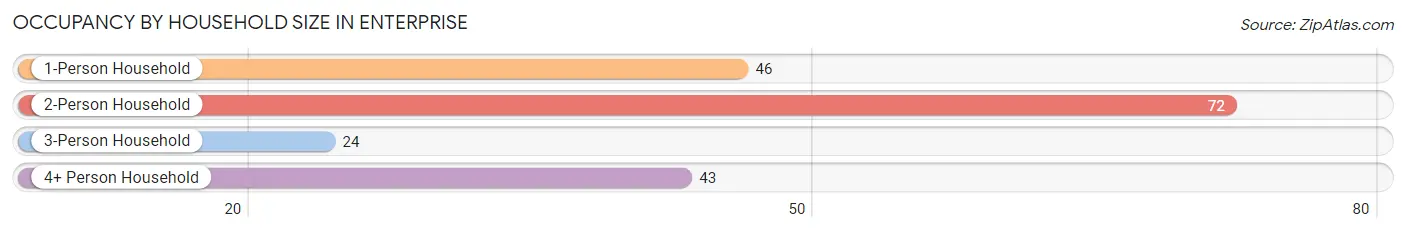
| Household Size | # Housing Units | % Housing Units |
| 1-Person Household | 46 | 24.9% |
| 2-Person Household | 72 | 38.9% |
| 3-Person Household | 24 | 13.0% |
| 4+ Person Household | 43 | 23.2% |
| Total Housing Units | 185 | 100.0% |
Occupancy by Ownership by Household Size in Enterprise
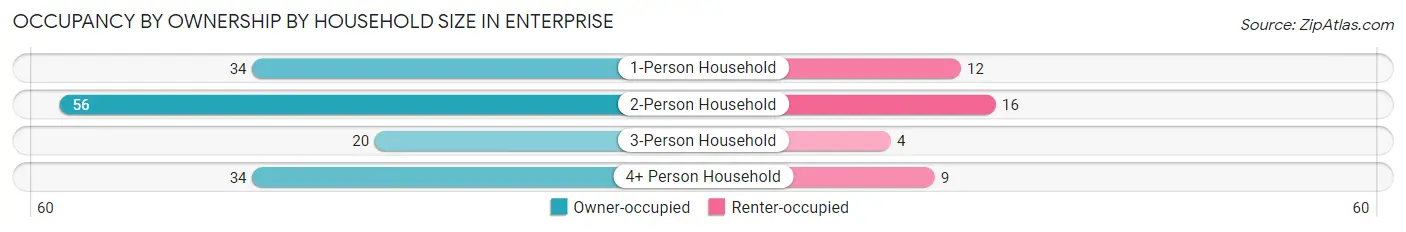
| Household Size | Owner-occupied | Renter-occupied |
| 1-Person Household | 34 (73.9%) | 12 (26.1%) |
| 2-Person Household | 56 (77.8%) | 16 (22.2%) |
| 3-Person Household | 20 (83.3%) | 4 (16.7%) |
| 4+ Person Household | 34 (79.1%) | 9 (20.9%) |
| Total Housing Units | 144 (77.8%) | 41 (22.2%) |
Occupancy by Educational Attainment in Enterprise
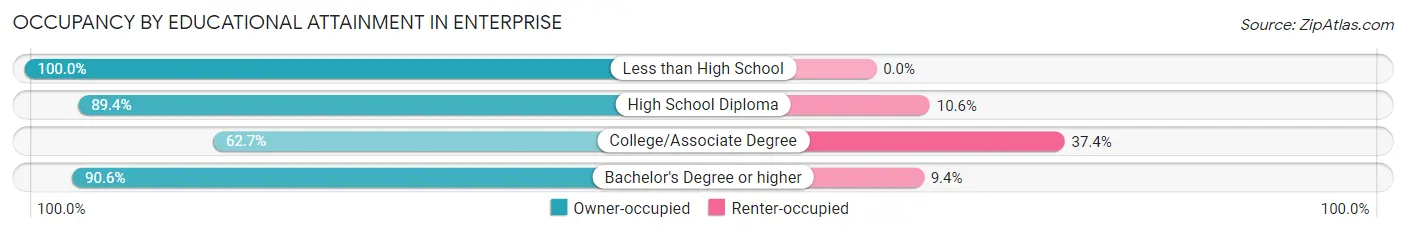
| Household Size | Owner-occupied | Renter-occupied |
| Less than High School | 2 (100.0%) | 0 (0.0%) |
| High School Diploma | 42 (89.4%) | 5 (10.6%) |
| College/Associate Degree | 52 (62.6%) | 31 (37.3%) |
| Bachelor's Degree or higher | 48 (90.6%) | 5 (9.4%) |
Occupancy by Age of Householder in Enterprise
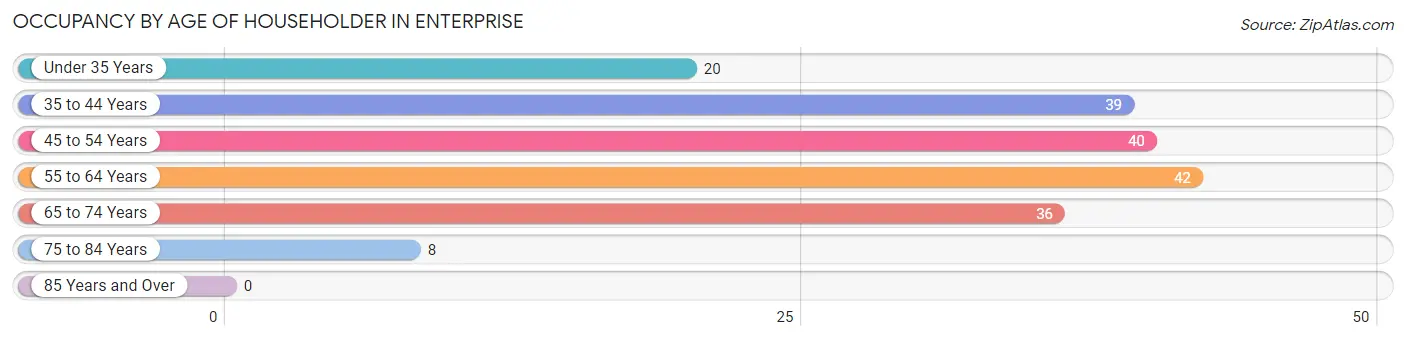
| Age Bracket | # Households | % Households |
| Under 35 Years | 20 | 10.8% |
| 35 to 44 Years | 39 | 21.1% |
| 45 to 54 Years | 40 | 21.6% |
| 55 to 64 Years | 42 | 22.7% |
| 65 to 74 Years | 36 | 19.5% |
| 75 to 84 Years | 8 | 4.3% |
| 85 Years and Over | 0 | 0.0% |
| Total | 185 | 100.0% |
Housing Finances in Enterprise
Median Income by Occupancy in Enterprise
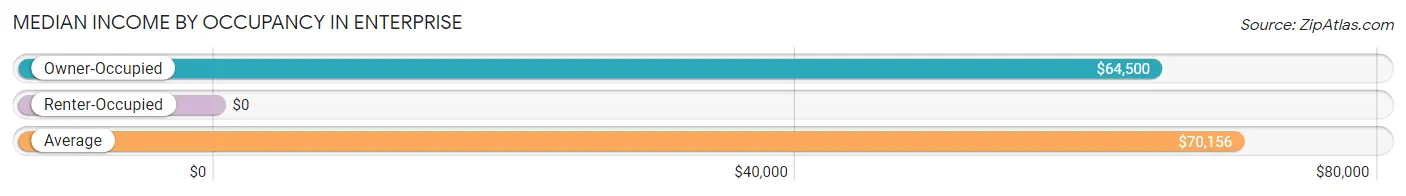
| Occupancy Type | # Households | Median Income |
| Owner-Occupied | 144 (77.8%) | $64,500 |
| Renter-Occupied | 41 (22.2%) | $0 |
| Average | 185 (100.0%) | $70,156 |
Occupancy by Householder Income Bracket in Enterprise
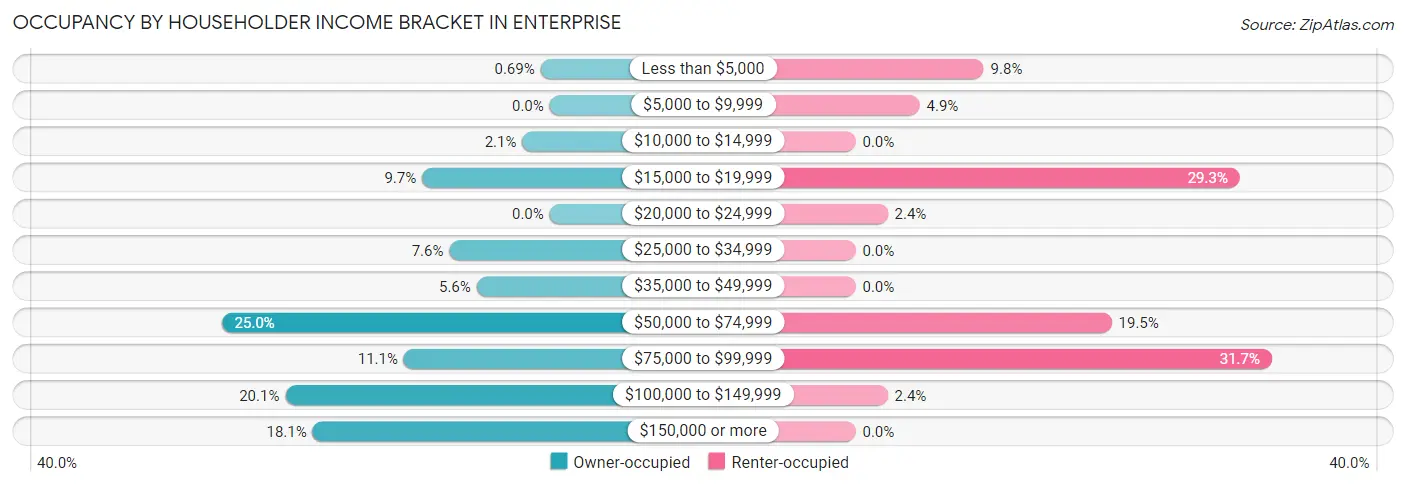
| Income Bracket | Owner-occupied | Renter-occupied |
| Less than $5,000 | 1 (0.7%) | 4 (9.8%) |
| $5,000 to $9,999 | 0 (0.0%) | 2 (4.9%) |
| $10,000 to $14,999 | 3 (2.1%) | 0 (0.0%) |
| $15,000 to $19,999 | 14 (9.7%) | 12 (29.3%) |
| $20,000 to $24,999 | 0 (0.0%) | 1 (2.4%) |
| $25,000 to $34,999 | 11 (7.6%) | 0 (0.0%) |
| $35,000 to $49,999 | 8 (5.6%) | 0 (0.0%) |
| $50,000 to $74,999 | 36 (25.0%) | 8 (19.5%) |
| $75,000 to $99,999 | 16 (11.1%) | 13 (31.7%) |
| $100,000 to $149,999 | 29 (20.1%) | 1 (2.4%) |
| $150,000 or more | 26 (18.1%) | 0 (0.0%) |
| Total | 144 (100.0%) | 41 (100.0%) |
Monthly Housing Cost Tiers in Enterprise
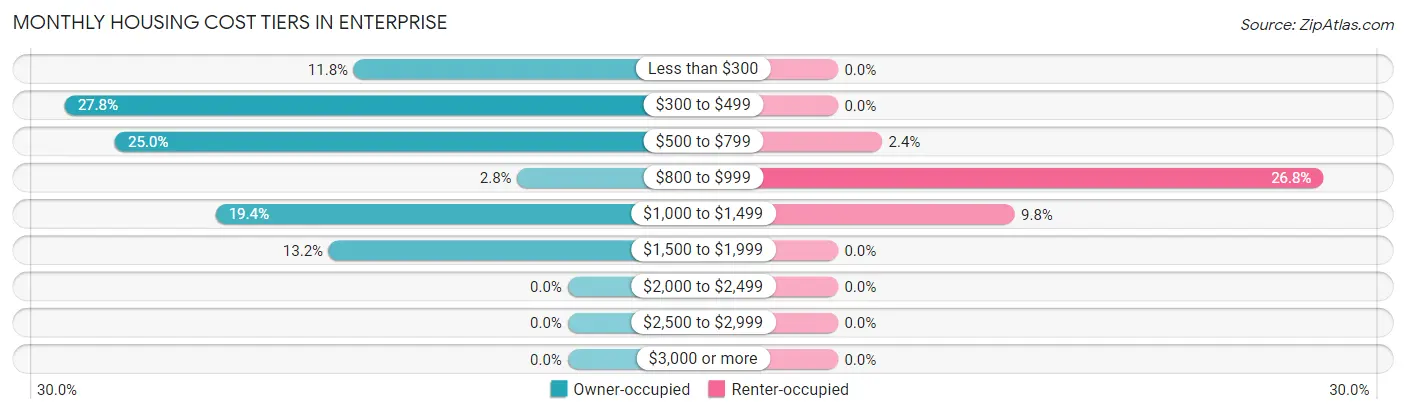
| Monthly Cost | Owner-occupied | Renter-occupied |
| Less than $300 | 17 (11.8%) | 0 (0.0%) |
| $300 to $499 | 40 (27.8%) | 0 (0.0%) |
| $500 to $799 | 36 (25.0%) | 1 (2.4%) |
| $800 to $999 | 4 (2.8%) | 11 (26.8%) |
| $1,000 to $1,499 | 28 (19.4%) | 4 (9.8%) |
| $1,500 to $1,999 | 19 (13.2%) | 0 (0.0%) |
| $2,000 to $2,499 | 0 (0.0%) | 0 (0.0%) |
| $2,500 to $2,999 | 0 (0.0%) | 0 (0.0%) |
| $3,000 or more | 0 (0.0%) | 0 (0.0%) |
| Total | 144 (100.0%) | 41 (100.0%) |
Physical Housing Characteristics in Enterprise
Housing Structures in Enterprise
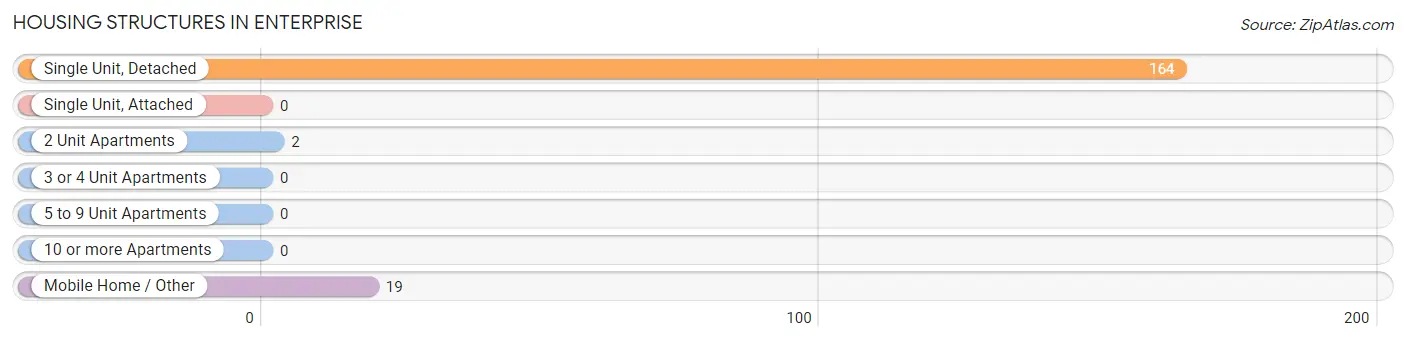
| Structure Type | # Housing Units | % Housing Units |
| Single Unit, Detached | 164 | 88.6% |
| Single Unit, Attached | 0 | 0.0% |
| 2 Unit Apartments | 2 | 1.1% |
| 3 or 4 Unit Apartments | 0 | 0.0% |
| 5 to 9 Unit Apartments | 0 | 0.0% |
| 10 or more Apartments | 0 | 0.0% |
| Mobile Home / Other | 19 | 10.3% |
| Total | 185 | 100.0% |
Housing Structures by Occupancy in Enterprise
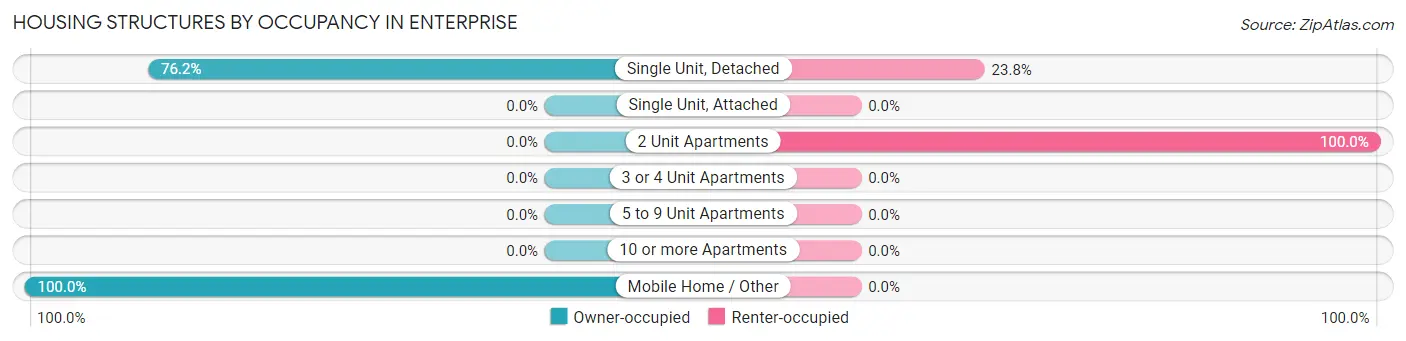
| Structure Type | Owner-occupied | Renter-occupied |
| Single Unit, Detached | 125 (76.2%) | 39 (23.8%) |
| Single Unit, Attached | 0 (0.0%) | 0 (0.0%) |
| 2 Unit Apartments | 0 (0.0%) | 2 (100.0%) |
| 3 or 4 Unit Apartments | 0 (0.0%) | 0 (0.0%) |
| 5 to 9 Unit Apartments | 0 (0.0%) | 0 (0.0%) |
| 10 or more Apartments | 0 (0.0%) | 0 (0.0%) |
| Mobile Home / Other | 19 (100.0%) | 0 (0.0%) |
| Total | 144 (77.8%) | 41 (22.2%) |
Housing Structures by Number of Rooms in Enterprise
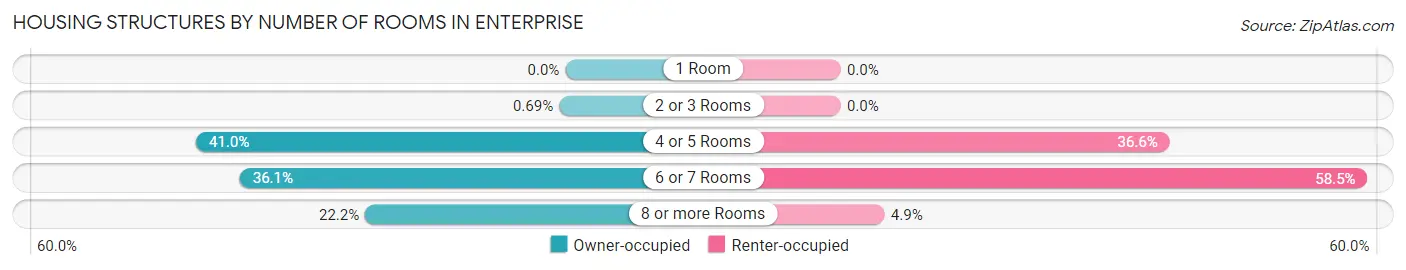
| Number of Rooms | Owner-occupied | Renter-occupied |
| 1 Room | 0 (0.0%) | 0 (0.0%) |
| 2 or 3 Rooms | 1 (0.7%) | 0 (0.0%) |
| 4 or 5 Rooms | 59 (41.0%) | 15 (36.6%) |
| 6 or 7 Rooms | 52 (36.1%) | 24 (58.5%) |
| 8 or more Rooms | 32 (22.2%) | 2 (4.9%) |
| Total | 144 (100.0%) | 41 (100.0%) |
Housing Structure by Heating Type in Enterprise
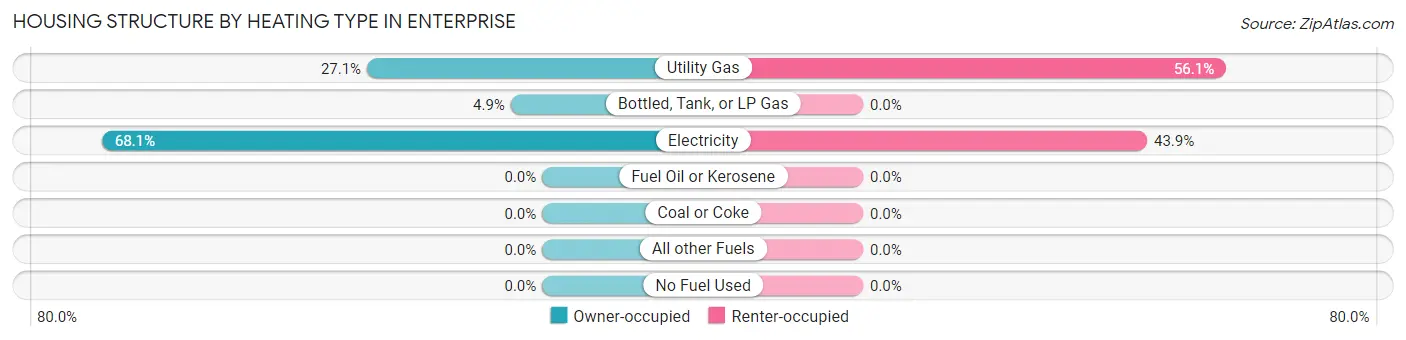
| Heating Type | Owner-occupied | Renter-occupied |
| Utility Gas | 39 (27.1%) | 23 (56.1%) |
| Bottled, Tank, or LP Gas | 7 (4.9%) | 0 (0.0%) |
| Electricity | 98 (68.1%) | 18 (43.9%) |
| Fuel Oil or Kerosene | 0 (0.0%) | 0 (0.0%) |
| Coal or Coke | 0 (0.0%) | 0 (0.0%) |
| All other Fuels | 0 (0.0%) | 0 (0.0%) |
| No Fuel Used | 0 (0.0%) | 0 (0.0%) |
| Total | 144 (100.0%) | 41 (100.0%) |
Household Vehicle Usage in Enterprise
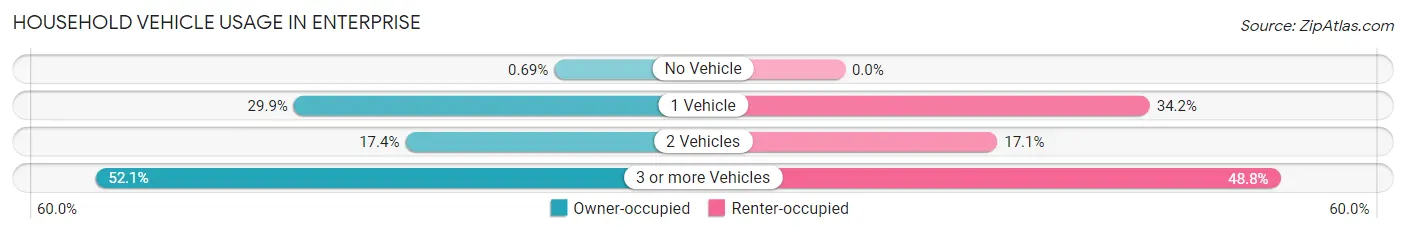
| Vehicles per Household | Owner-occupied | Renter-occupied |
| No Vehicle | 1 (0.7%) | 0 (0.0%) |
| 1 Vehicle | 43 (29.9%) | 14 (34.2%) |
| 2 Vehicles | 25 (17.4%) | 7 (17.1%) |
| 3 or more Vehicles | 75 (52.1%) | 20 (48.8%) |
| Total | 144 (100.0%) | 41 (100.0%) |
Real Estate & Mortgages in Enterprise
Real Estate and Mortgage Overview in Enterprise
| Characteristic | Without Mortgage | With Mortgage |
| Housing Units | 75 | 69 |
| Median Property Value | $78,600 | $130,400 |
| Median Household Income | $51,875 | $14 |
| Monthly Housing Costs | $343 | $0 |
| Real Estate Taxes | $550 | $3 |
Property Value by Mortgage Status in Enterprise
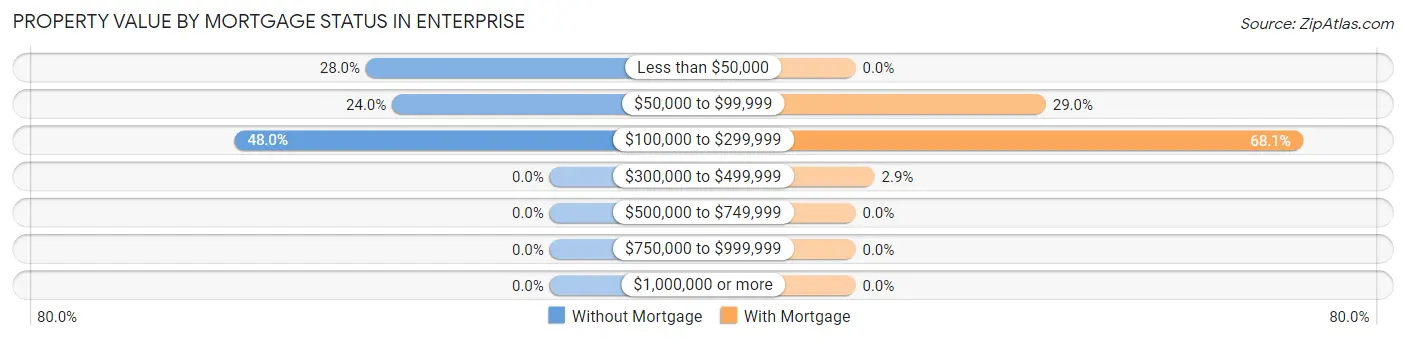
| Property Value | Without Mortgage | With Mortgage |
| Less than $50,000 | 21 (28.0%) | 0 (0.0%) |
| $50,000 to $99,999 | 18 (24.0%) | 20 (29.0%) |
| $100,000 to $299,999 | 36 (48.0%) | 47 (68.1%) |
| $300,000 to $499,999 | 0 (0.0%) | 2 (2.9%) |
| $500,000 to $749,999 | 0 (0.0%) | 0 (0.0%) |
| $750,000 to $999,999 | 0 (0.0%) | 0 (0.0%) |
| $1,000,000 or more | 0 (0.0%) | 0 (0.0%) |
| Total | 75 (100.0%) | 69 (100.0%) |
Household Income by Mortgage Status in Enterprise
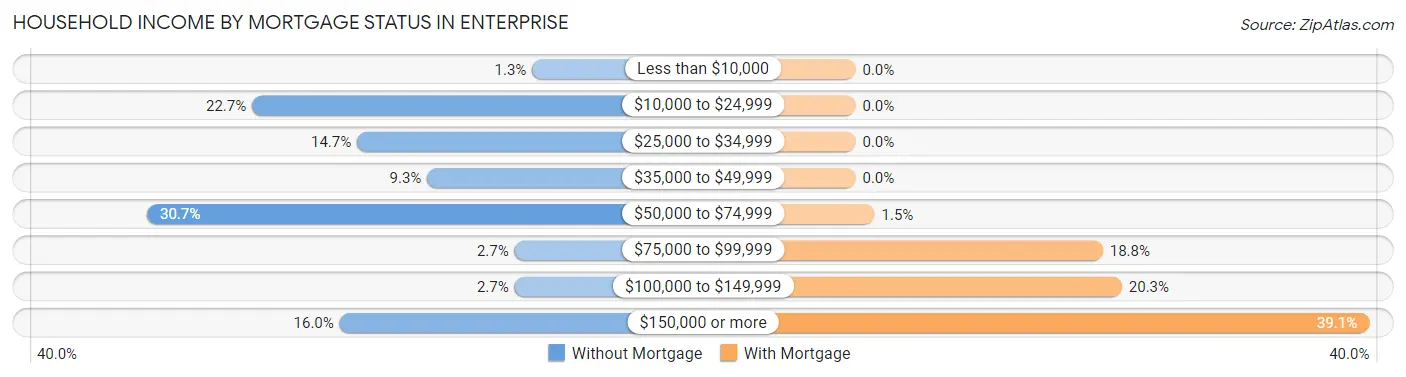
| Household Income | Without Mortgage | With Mortgage |
| Less than $10,000 | 1 (1.3%) | 0 (0.0%) |
| $10,000 to $24,999 | 17 (22.7%) | 0 (0.0%) |
| $25,000 to $34,999 | 11 (14.7%) | 0 (0.0%) |
| $35,000 to $49,999 | 7 (9.3%) | 0 (0.0%) |
| $50,000 to $74,999 | 23 (30.7%) | 1 (1.5%) |
| $75,000 to $99,999 | 2 (2.7%) | 13 (18.8%) |
| $100,000 to $149,999 | 2 (2.7%) | 14 (20.3%) |
| $150,000 or more | 12 (16.0%) | 27 (39.1%) |
| Total | 75 (100.0%) | 69 (100.0%) |
Property Value to Household Income Ratio in Enterprise
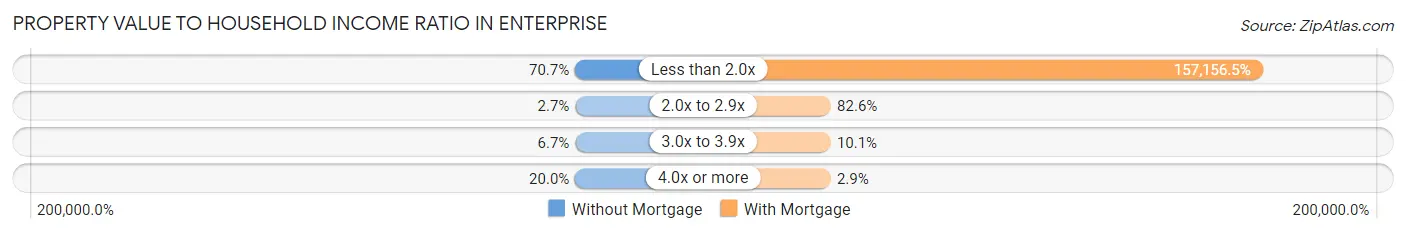
| Value-to-Income Ratio | Without Mortgage | With Mortgage |
| Less than 2.0x | 53 (70.7%) | 108,438 (157,156.5%) |
| 2.0x to 2.9x | 2 (2.7%) | 57 (82.6%) |
| 3.0x to 3.9x | 5 (6.7%) | 7 (10.1%) |
| 4.0x or more | 15 (20.0%) | 2 (2.9%) |
| Total | 75 (100.0%) | 69 (100.0%) |
Real Estate Taxes by Mortgage Status in Enterprise
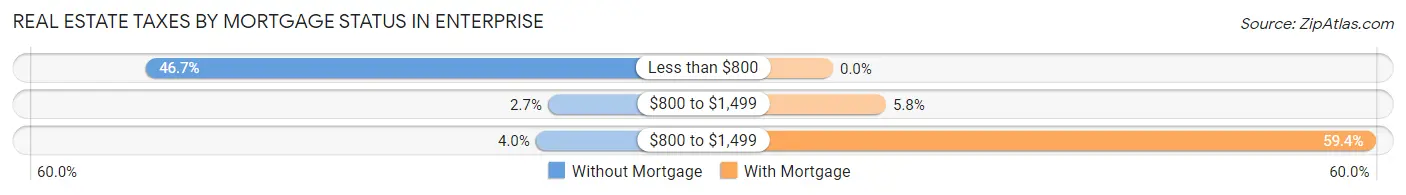
| Property Taxes | Without Mortgage | With Mortgage |
| Less than $800 | 35 (46.7%) | 0 (0.0%) |
| $800 to $1,499 | 2 (2.7%) | 4 (5.8%) |
| $800 to $1,499 | 3 (4.0%) | 41 (59.4%) |
| Total | 75 (100.0%) | 69 (100.0%) |
Health & Disability in Enterprise
Health Insurance Coverage by Age in Enterprise
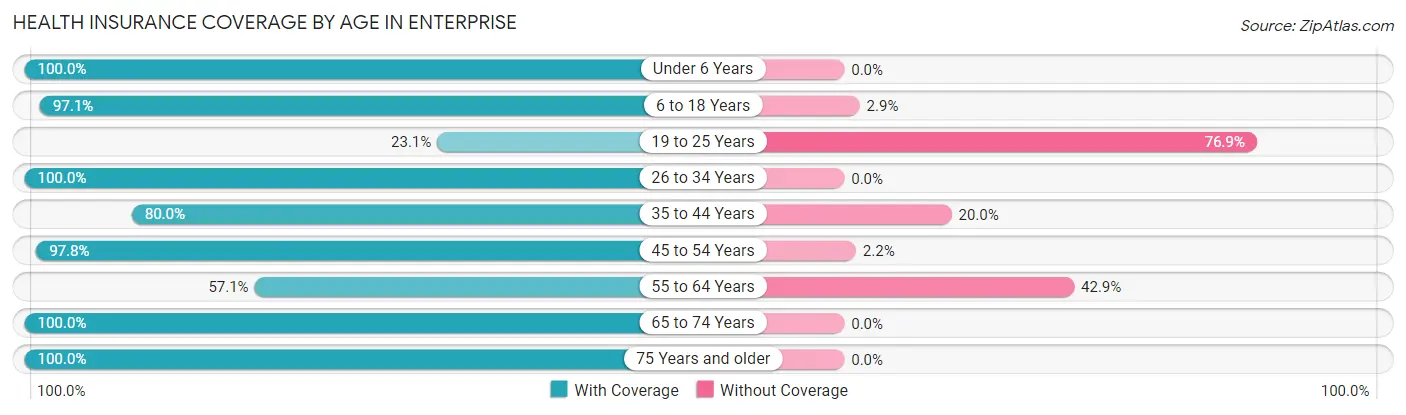
| Age Bracket | With Coverage | Without Coverage |
| Under 6 Years | 11 (100.0%) | 0 (0.0%) |
| 6 to 18 Years | 136 (97.1%) | 4 (2.9%) |
| 19 to 25 Years | 15 (23.1%) | 50 (76.9%) |
| 26 to 34 Years | 25 (100.0%) | 0 (0.0%) |
| 35 to 44 Years | 40 (80.0%) | 10 (20.0%) |
| 45 to 54 Years | 90 (97.8%) | 2 (2.2%) |
| 55 to 64 Years | 24 (57.1%) | 18 (42.9%) |
| 65 to 74 Years | 60 (100.0%) | 0 (0.0%) |
| 75 Years and older | 8 (100.0%) | 0 (0.0%) |
| Total | 409 (83.0%) | 84 (17.0%) |
Health Insurance Coverage by Citizenship Status in Enterprise
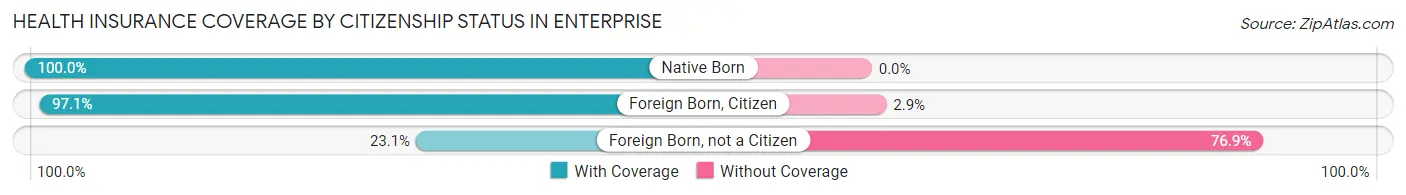
| Citizenship Status | With Coverage | Without Coverage |
| Native Born | 11 (100.0%) | 0 (0.0%) |
| Foreign Born, Citizen | 136 (97.1%) | 4 (2.9%) |
| Foreign Born, not a Citizen | 15 (23.1%) | 50 (76.9%) |
Health Insurance Coverage by Household Income in Enterprise
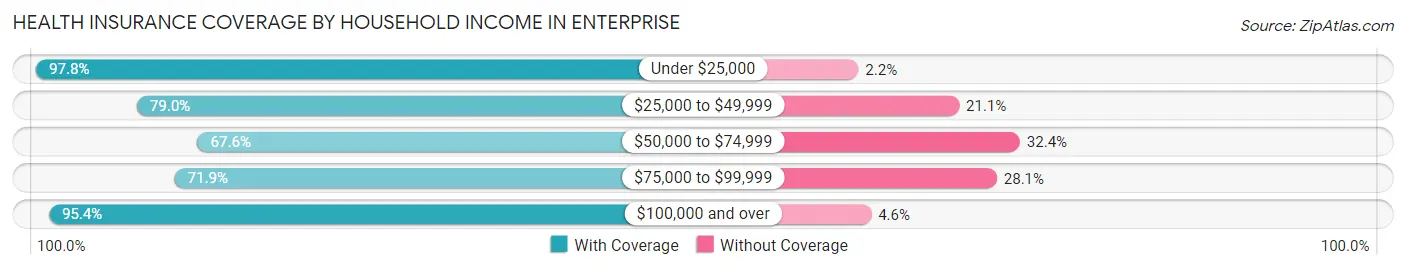
| Household Income | With Coverage | Without Coverage |
| Under $25,000 | 45 (97.8%) | 1 (2.2%) |
| $25,000 to $49,999 | 30 (78.9%) | 8 (21.0%) |
| $50,000 to $74,999 | 100 (67.6%) | 48 (32.4%) |
| $75,000 to $99,999 | 46 (71.9%) | 18 (28.1%) |
| $100,000 and over | 188 (95.4%) | 9 (4.6%) |
Public vs Private Health Insurance Coverage by Age in Enterprise
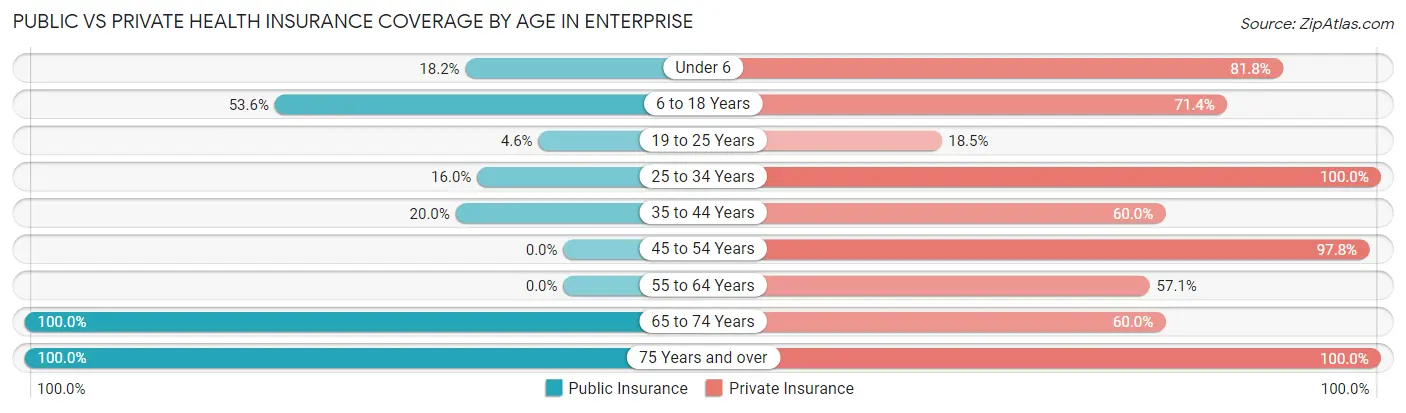
| Age Bracket | Public Insurance | Private Insurance |
| Under 6 | 2 (18.2%) | 9 (81.8%) |
| 6 to 18 Years | 75 (53.6%) | 100 (71.4%) |
| 19 to 25 Years | 3 (4.6%) | 12 (18.5%) |
| 25 to 34 Years | 4 (16.0%) | 25 (100.0%) |
| 35 to 44 Years | 10 (20.0%) | 30 (60.0%) |
| 45 to 54 Years | 0 (0.0%) | 90 (97.8%) |
| 55 to 64 Years | 0 (0.0%) | 24 (57.1%) |
| 65 to 74 Years | 60 (100.0%) | 36 (60.0%) |
| 75 Years and over | 8 (100.0%) | 8 (100.0%) |
| Total | 162 (32.9%) | 334 (67.7%) |
Disability Status by Sex by Age in Enterprise
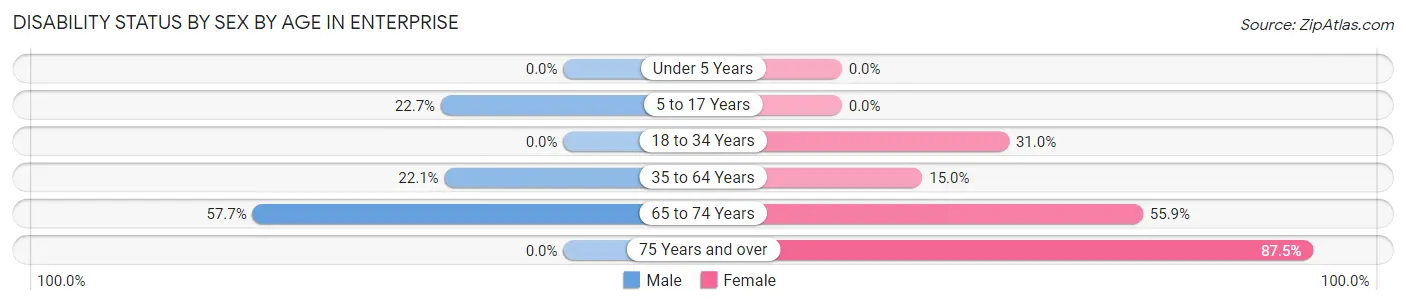
| Age Bracket | Male | Female |
| Under 5 Years | 0 (0.0%) | 0 (0.0%) |
| 5 to 17 Years | 10 (22.7%) | 0 (0.0%) |
| 18 to 34 Years | 0 (0.0%) | 9 (31.0%) |
| 35 to 64 Years | 17 (22.1%) | 16 (14.9%) |
| 65 to 74 Years | 15 (57.7%) | 19 (55.9%) |
| 75 Years and over | 0 (0.0%) | 7 (87.5%) |
Disability Class by Sex by Age in Enterprise
Disability Class: Hearing Difficulty
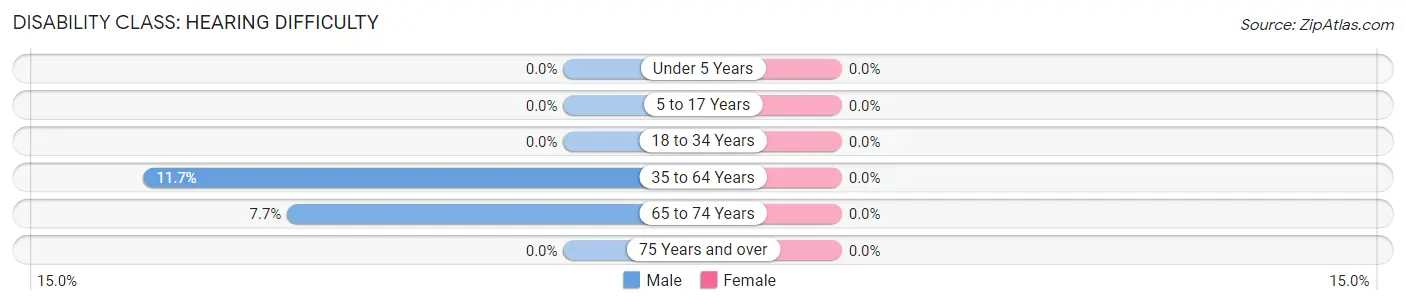
| Age Bracket | Male | Female |
| Under 5 Years | 0 (0.0%) | 0 (0.0%) |
| 5 to 17 Years | 0 (0.0%) | 0 (0.0%) |
| 18 to 34 Years | 0 (0.0%) | 0 (0.0%) |
| 35 to 64 Years | 9 (11.7%) | 0 (0.0%) |
| 65 to 74 Years | 2 (7.7%) | 0 (0.0%) |
| 75 Years and over | 0 (0.0%) | 0 (0.0%) |
Disability Class: Vision Difficulty
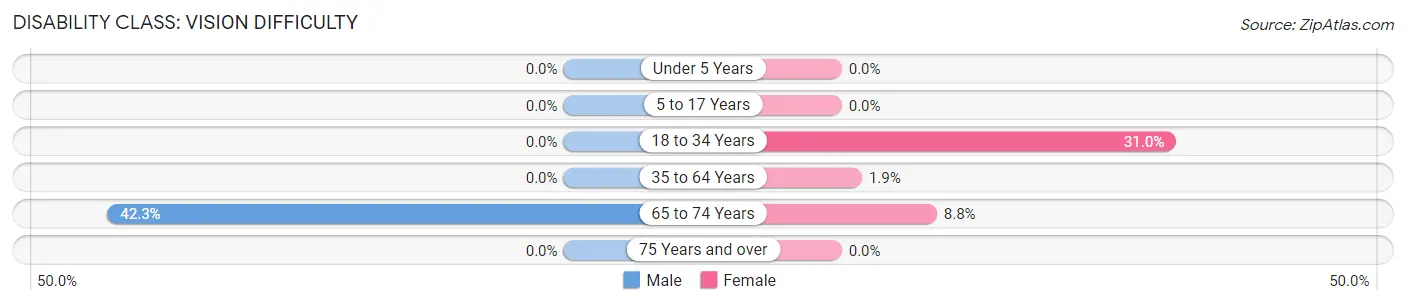
| Age Bracket | Male | Female |
| Under 5 Years | 0 (0.0%) | 0 (0.0%) |
| 5 to 17 Years | 0 (0.0%) | 0 (0.0%) |
| 18 to 34 Years | 0 (0.0%) | 9 (31.0%) |
| 35 to 64 Years | 0 (0.0%) | 2 (1.9%) |
| 65 to 74 Years | 11 (42.3%) | 3 (8.8%) |
| 75 Years and over | 0 (0.0%) | 0 (0.0%) |
Disability Class: Cognitive Difficulty
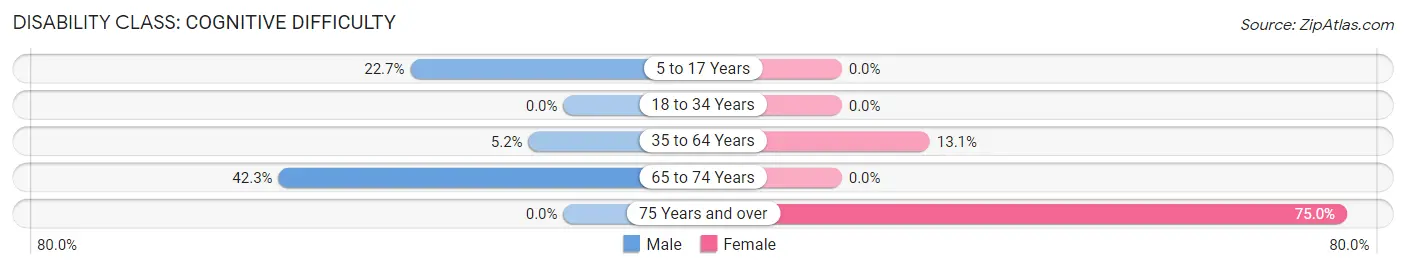
| Age Bracket | Male | Female |
| 5 to 17 Years | 10 (22.7%) | 0 (0.0%) |
| 18 to 34 Years | 0 (0.0%) | 0 (0.0%) |
| 35 to 64 Years | 4 (5.2%) | 14 (13.1%) |
| 65 to 74 Years | 11 (42.3%) | 0 (0.0%) |
| 75 Years and over | 0 (0.0%) | 6 (75.0%) |
Disability Class: Ambulatory Difficulty
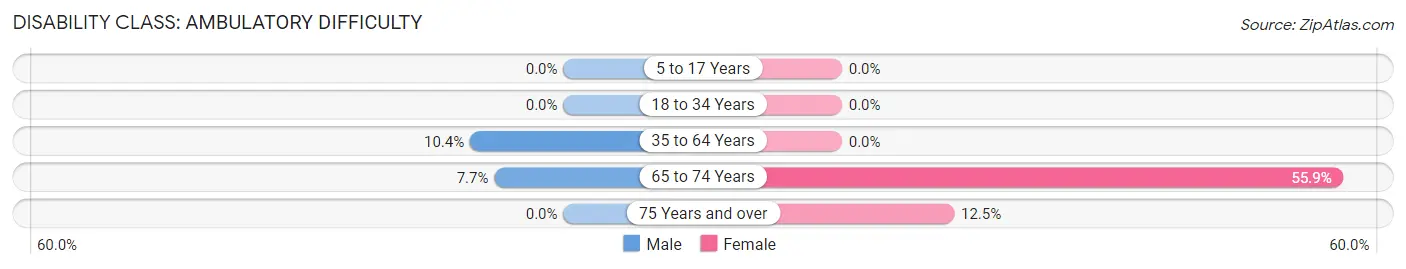
| Age Bracket | Male | Female |
| 5 to 17 Years | 0 (0.0%) | 0 (0.0%) |
| 18 to 34 Years | 0 (0.0%) | 0 (0.0%) |
| 35 to 64 Years | 8 (10.4%) | 0 (0.0%) |
| 65 to 74 Years | 2 (7.7%) | 19 (55.9%) |
| 75 Years and over | 0 (0.0%) | 1 (12.5%) |
Disability Class: Self-Care Difficulty
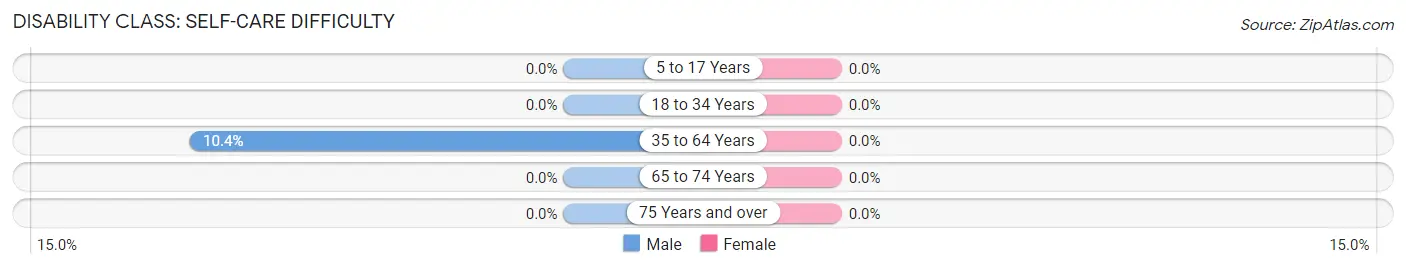
| Age Bracket | Male | Female |
| 5 to 17 Years | 0 (0.0%) | 0 (0.0%) |
| 18 to 34 Years | 0 (0.0%) | 0 (0.0%) |
| 35 to 64 Years | 8 (10.4%) | 0 (0.0%) |
| 65 to 74 Years | 0 (0.0%) | 0 (0.0%) |
| 75 Years and over | 0 (0.0%) | 0 (0.0%) |
Technology Access in Enterprise
Computing Device Access in Enterprise
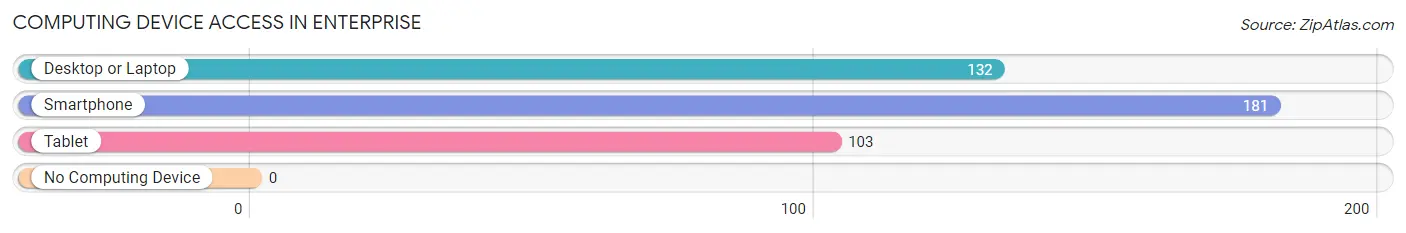
| Device Type | # Households | % Households |
| Desktop or Laptop | 132 | 71.4% |
| Smartphone | 181 | 97.8% |
| Tablet | 103 | 55.7% |
| No Computing Device | 0 | 0.0% |
| Total | 185 | 100.0% |
Internet Access in Enterprise
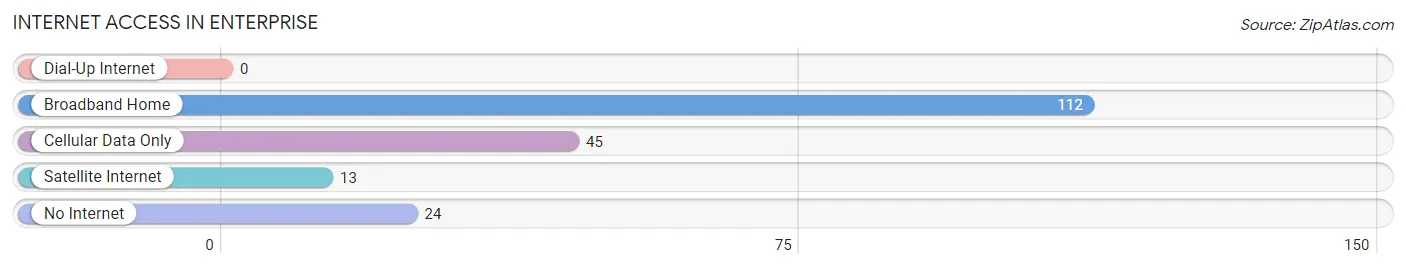
| Internet Type | # Households | % Households |
| Dial-Up Internet | 0 | 0.0% |
| Broadband Home | 112 | 60.5% |
| Cellular Data Only | 45 | 24.3% |
| Satellite Internet | 13 | 7.0% |
| No Internet | 24 | 13.0% |
| Total | 185 | 100.0% |
Enterprise Summary
Enterprise, Mississippi is a small city located in Clarke County, Mississippi. It is the county seat of Clarke County and is located in the southeastern part of the state. The city has a population of approximately 5,000 people and is part of the Meridian, Mississippi Metropolitan Statistical Area.
History
The area that is now Enterprise was first settled in the early 1800s by settlers from Georgia and the Carolinas. The town was originally known as "New Hope" and was later renamed "Enterprise" in 1837. The name was chosen to reflect the spirit of enterprise and progress that the settlers were hoping to achieve.
The town was officially incorporated in 1839 and was the first town in Clarke County to be incorporated. The town was an important trading center for the surrounding area and was the site of the first courthouse in the county.
In the late 1800s, the town was a major railroad hub and was the site of the first railroad station in the county. The railroad brought new economic opportunities to the area and helped to spur the growth of the town.
Geography
Enterprise is located in the southeastern part of Mississippi, in Clarke County. The city is situated on the banks of the Chickasawhay River and is surrounded by rolling hills and forests. The city is located approximately 30 miles from the Gulf of Mexico and is part of the Gulf Coast region.
The climate in Enterprise is humid subtropical, with hot, humid summers and mild winters. The average annual temperature is around 70 degrees Fahrenheit. The average annual precipitation is around 50 inches.
Economy
The economy of Enterprise is largely based on agriculture and manufacturing. The city is home to several large manufacturing plants, including a paper mill, a furniture factory, and a plastics plant. The city is also home to several agricultural operations, including poultry farms, cattle farms, and timber operations.
The city is also home to several retail stores and restaurants. The city is served by several major highways, including Interstate 59 and U.S. Route 45.
Demographics
As of the 2010 census, the population of Enterprise was 5,037. The racial makeup of the city was 57.3% White, 39.2% African American, 0.3% Native American, 0.7% Asian, 0.1% Pacific Islander, 1.2% from other races, and 1.4% from two or more races. Hispanic or Latino of any race were 2.3% of the population.
The median household income in Enterprise was $30,938, and the median family income was $37,917. The per capita income for the city was $17,845. About 22.3% of the population was below the poverty line.
Common Questions
What is Per Capita Income in Enterprise?
Per Capita income in Enterprise is $31,359.
What is the Median Family Income in Enterprise?
Median Family Income in Enterprise is $81,161.
What is the Median Household income in Enterprise?
Median Household Income in Enterprise is $70,156.
What is Family Income Deficit in Enterprise?
Family Income Deficit in Enterprise is $15,071.
Families that are below poverty line in Enterprise earn $15,071 less on average than the poverty threshold level.
What is Inequality or Gini Index in Enterprise?
Inequality or Gini Index in Enterprise is 0.43.
What is the Total Population of Enterprise?
Total Population of Enterprise is 514.
What is the Total Male Population of Enterprise?
Total Male Population of Enterprise is 236.
What is the Total Female Population of Enterprise?
Total Female Population of Enterprise is 278.
What is the Ratio of Males per 100 Females in Enterprise?
There are 84.89 Males per 100 Females in Enterprise.
What is the Ratio of Females per 100 Males in Enterprise?
There are 117.80 Females per 100 Males in Enterprise.
What is the Median Population Age in Enterprise?
Median Population Age in Enterprise is 37.5 Years.
What is the Average Family Size in Enterprise
Average Family Size in Enterprise is 3.2 People.
What is the Average Household Size in Enterprise
Average Household Size in Enterprise is 2.8 People.
How Large is the Labor Force in Enterprise?
There are 258 People in the Labor Forcein in Enterprise.
What is the Percentage of People in the Labor Force in Enterprise?
66.8% of People are in the Labor Force in Enterprise.
What is the Unemployment Rate in Enterprise?
Unemployment Rate in Enterprise is 1.3%.