Zip Codes with the Highest Percentage of Population Employed in Real Estate, Rental & Leasing in Tupelo, MS
RELATED REPORTS & OPTIONS
Real Estate, Rental & Leasing
Tupelo
Compare Zip Codes
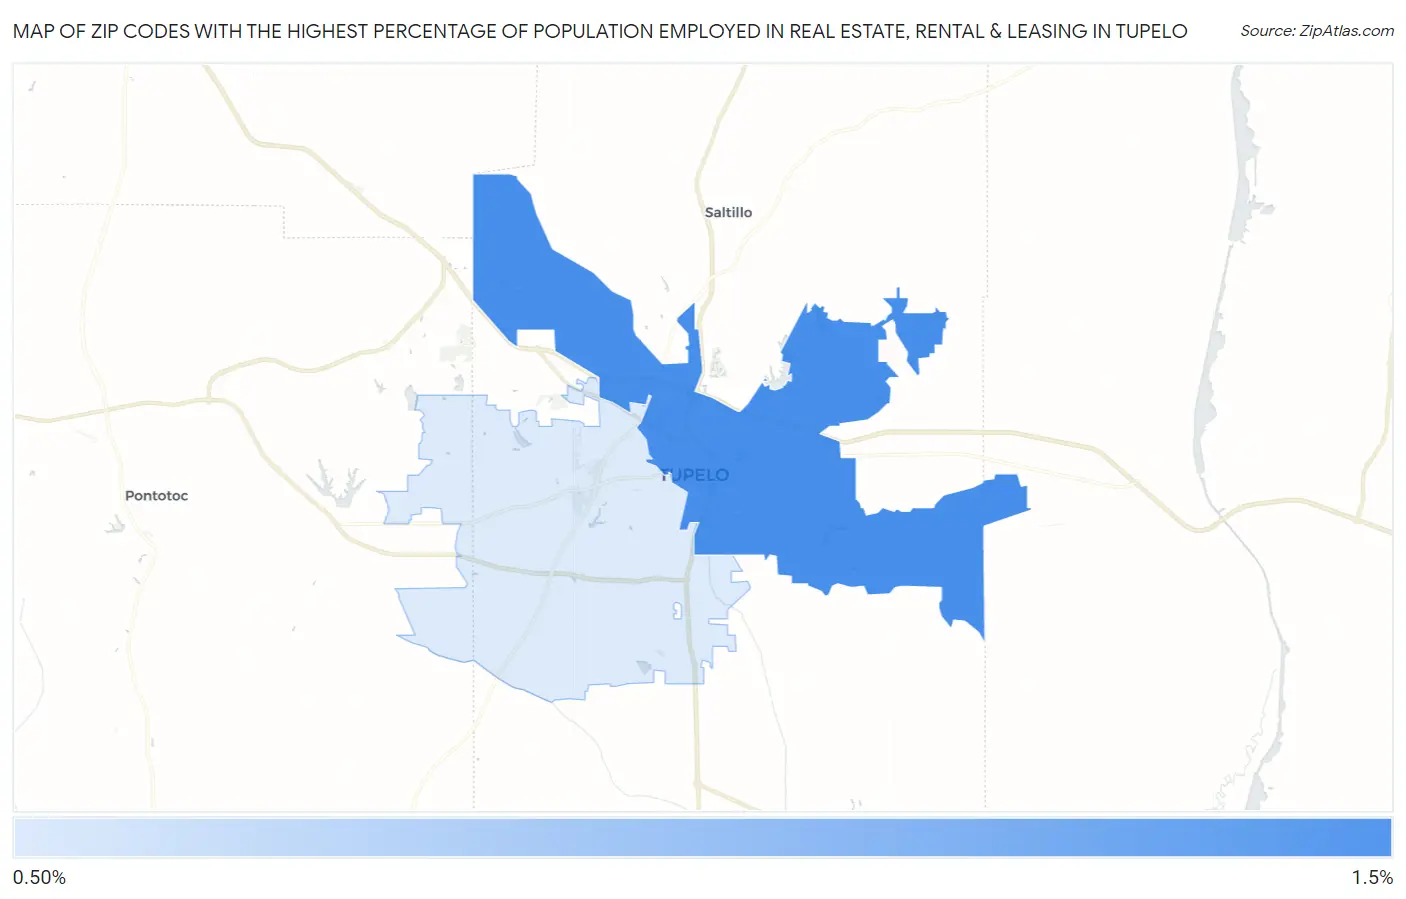
Map of Zip Codes with the Highest Percentage of Population Employed in Real Estate, Rental & Leasing in Tupelo
1.1%
1.2%
Zip Codes with the Highest Percentage of Population Employed in Real Estate, Rental & Leasing in Tupelo, MS
| Zip Code | % Employed | vs State | vs National | |
| 1. | 38804 | 1.2% | 1.3%(-0.066)#107 | 1.9%(-0.707)#13,608 |
| 2. | 38801 | 1.1% | 1.3%(-0.173)#117 | 1.9%(-0.814)#14,479 |
1
Common Questions
What are the Top Zip Codes with the Highest Percentage of Population Employed in Real Estate, Rental & Leasing in Tupelo, MS?
Top Zip Codes with the Highest Percentage of Population Employed in Real Estate, Rental & Leasing in Tupelo, MS are:
What zip code has the Highest Percentage of Population Employed in Real Estate, Rental & Leasing in Tupelo, MS?
38804 has the Highest Percentage of Population Employed in Real Estate, Rental & Leasing in Tupelo, MS with 1.2%.
What is the Percentage of Population Employed in Real Estate, Rental & Leasing in Tupelo, MS?
Percentage of Population Employed in Real Estate, Rental & Leasing in Tupelo is 1.3%.
What is the Percentage of Population Employed in Real Estate, Rental & Leasing in Mississippi?
Percentage of Population Employed in Real Estate, Rental & Leasing in Mississippi is 1.3%.
What is the Percentage of Population Employed in Real Estate, Rental & Leasing in the United States?
Percentage of Population Employed in Real Estate, Rental & Leasing in the United States is 1.9%.