Florence, MS Map & Demographics
Florence Map
Florence Overview
$32,524
PER CAPITA INCOME
$94,446
AVG FAMILY INCOME
$88,750
AVG HOUSEHOLD INCOME
28.5%
WAGE / INCOME GAP [ % ]
71.5¢/ $1
WAGE / INCOME GAP [ $ ]
0.35
INEQUALITY / GINI INDEX
4,596
TOTAL POPULATION
2,361
MALE POPULATION
2,235
FEMALE POPULATION
105.64
MALES / 100 FEMALES
94.66
FEMALES / 100 MALES
37.3
MEDIAN AGE
3.0
AVG FAMILY SIZE
2.6
AVG HOUSEHOLD SIZE
2,622
LABOR FORCE [ PEOPLE ]
75.9%
PERCENT IN LABOR FORCE
7.9%
UNEMPLOYMENT RATE
Florence Zip Codes
Florence Area Codes
Income in Florence
Income Overview in Florence
Per Capita Income in Florence is $32,524, while median incomes of families and households are $94,446 and $88,750 respectively.
| Characteristic | Number | Measure |
| Per Capita Income | 4,596 | $32,524 |
| Median Family Income | 1,273 | $94,446 |
| Mean Family Income | 1,273 | $89,282 |
| Median Household Income | 1,780 | $88,750 |
| Mean Household Income | 1,780 | $83,323 |
| Income Deficit | 1,273 | $0 |
| Wage / Income Gap (%) | 4,596 | 28.50% |
| Wage / Income Gap ($) | 4,596 | 71.50¢ per $1 |
| Gini / Inequality Index | 4,596 | 0.35 |
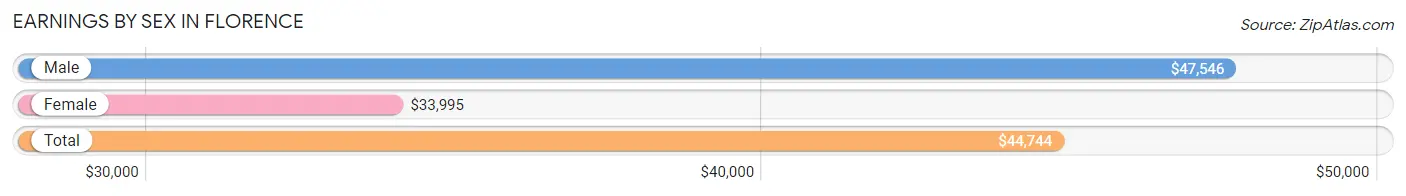
Earnings by Sex in Florence
Average Earnings in Florence are $44,744, $47,546 for men and $33,995 for women, a difference of 28.5%.
| Sex | Number | Average Earnings |
| Male | 1,139 (46.2%) | $47,546 |
| Female | 1,327 (53.8%) | $33,995 |
| Total | 2,466 (100.0%) | $44,744 |
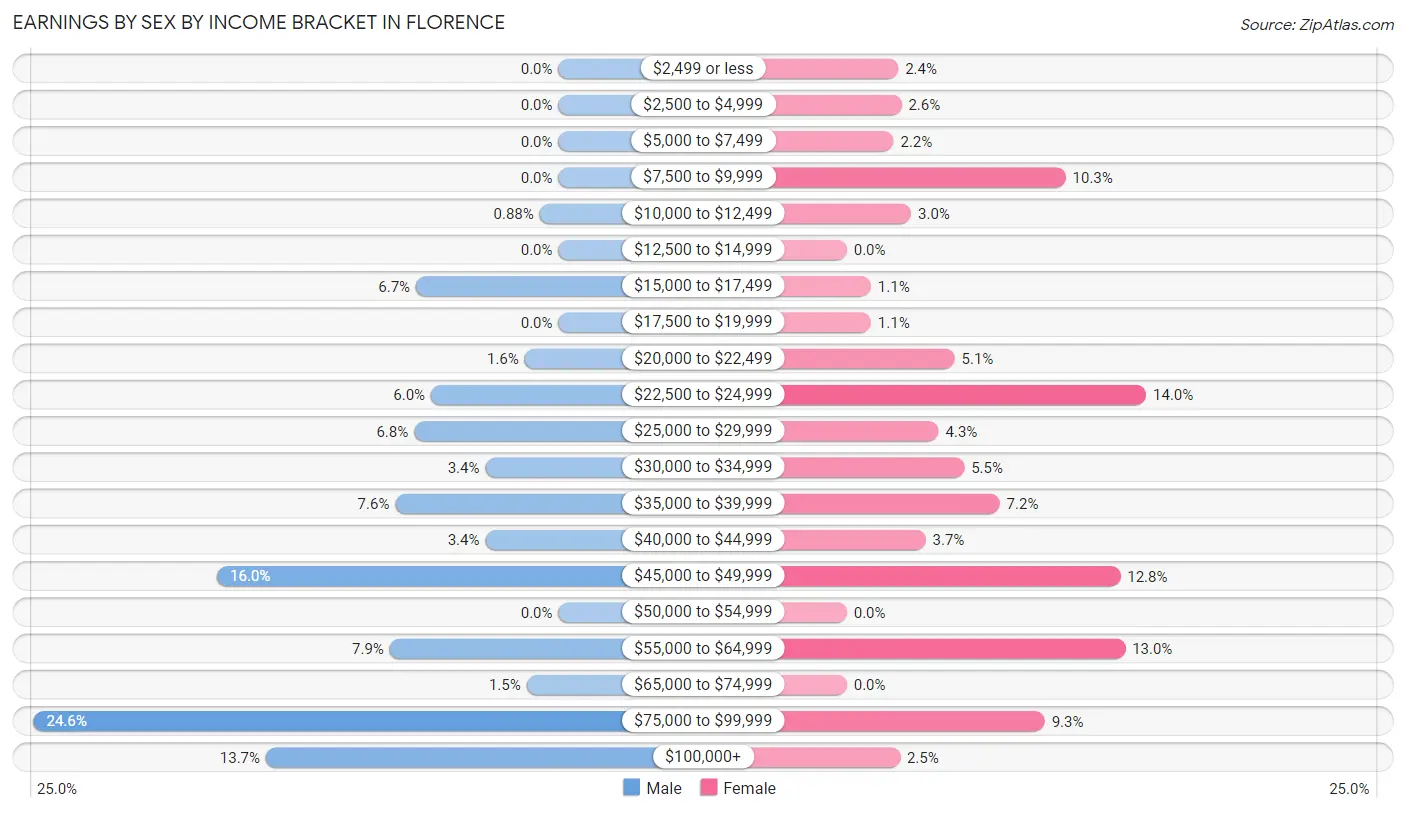
Earnings by Sex by Income Bracket in Florence
The most common earnings brackets in Florence are $75,000 to $99,999 for men (280 | 24.6%) and $22,500 to $24,999 for women (186 | 14.0%).
| Income | Male | Female |
| $2,499 or less | 0 (0.0%) | 32 (2.4%) |
| $2,500 to $4,999 | 0 (0.0%) | 34 (2.6%) |
| $5,000 to $7,499 | 0 (0.0%) | 29 (2.2%) |
| $7,500 to $9,999 | 0 (0.0%) | 136 (10.2%) |
| $10,000 to $12,499 | 10 (0.9%) | 40 (3.0%) |
| $12,500 to $14,999 | 0 (0.0%) | 0 (0.0%) |
| $15,000 to $17,499 | 76 (6.7%) | 15 (1.1%) |
| $17,500 to $19,999 | 0 (0.0%) | 15 (1.1%) |
| $20,000 to $22,499 | 18 (1.6%) | 67 (5.1%) |
| $22,500 to $24,999 | 68 (6.0%) | 186 (14.0%) |
| $25,000 to $29,999 | 77 (6.8%) | 57 (4.3%) |
| $30,000 to $34,999 | 39 (3.4%) | 73 (5.5%) |
| $35,000 to $39,999 | 87 (7.6%) | 95 (7.2%) |
| $40,000 to $44,999 | 39 (3.4%) | 49 (3.7%) |
| $45,000 to $49,999 | 182 (16.0%) | 170 (12.8%) |
| $50,000 to $54,999 | 0 (0.0%) | 0 (0.0%) |
| $55,000 to $64,999 | 90 (7.9%) | 173 (13.0%) |
| $65,000 to $74,999 | 17 (1.5%) | 0 (0.0%) |
| $75,000 to $99,999 | 280 (24.6%) | 123 (9.3%) |
| $100,000+ | 156 (13.7%) | 33 (2.5%) |
| Total | 1,139 (100.0%) | 1,327 (100.0%) |
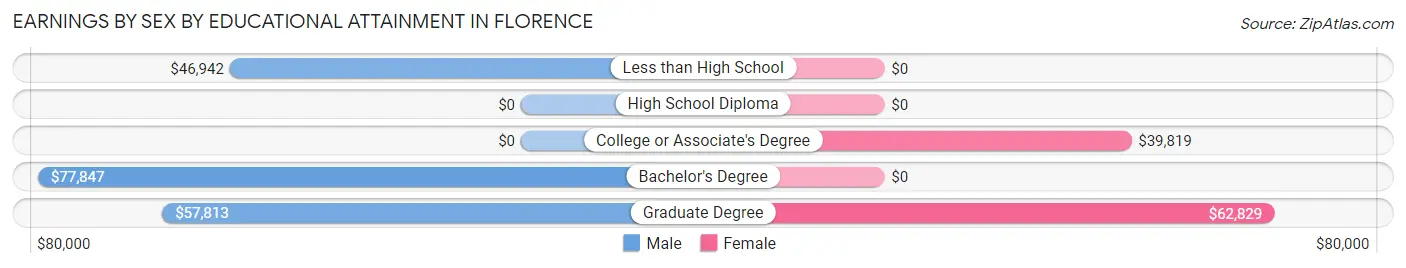
Earnings by Sex by Educational Attainment in Florence
Average earnings in Florence are $58,041 for men and $38,116 for women, a difference of 34.3%. Men with an educational attainment of bachelor's degree enjoy the highest average annual earnings of $77,847, while those with less than high school education earn the least with $46,942. Women with an educational attainment of graduate degree earn the most with the average annual earnings of $62,829, while those with college or associate's degree education have the smallest earnings of $39,819.
| Educational Attainment | Male Income | Female Income |
| Less than High School | $46,942 | $0 |
| High School Diploma | - | - |
| College or Associate's Degree | - | - |
| Bachelor's Degree | $77,847 | $0 |
| Graduate Degree | $57,813 | $62,829 |
| Total | $58,041 | $38,116 |
Family Income in Florence
Family Income Brackets in Florence
According to the Florence family income data, there are 451 families falling into the $100,000 to $149,999 income range, which is the most common income bracket and makes up 35.4% of all families.
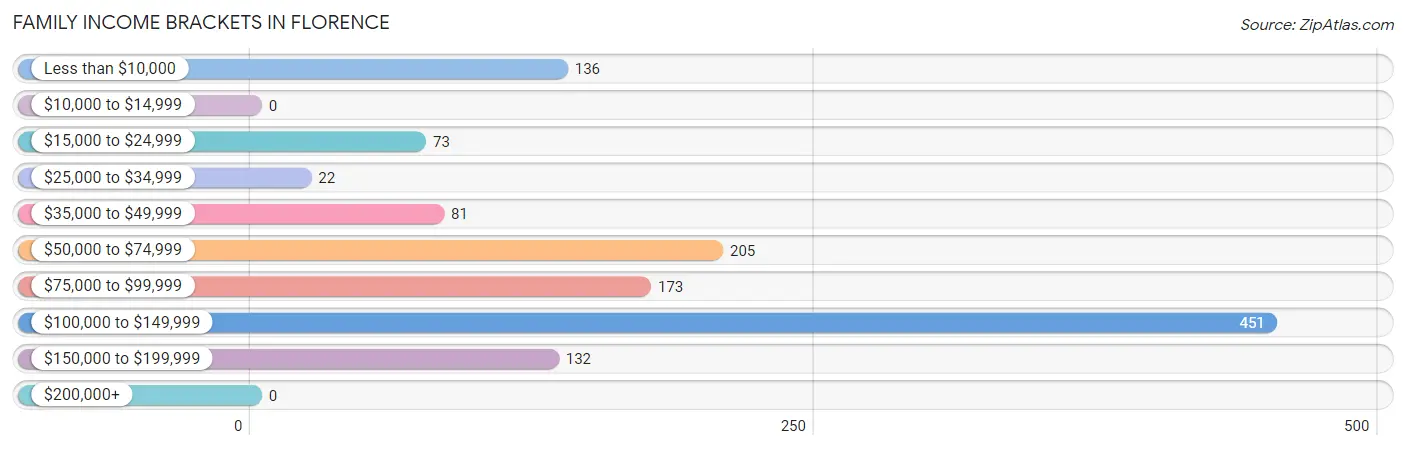
| Income Bracket | # Families | % Families |
| Less than $10,000 | 136 | 10.7% |
| $10,000 to $14,999 | 0 | 0.0% |
| $15,000 to $24,999 | 73 | 5.7% |
| $25,000 to $34,999 | 22 | 1.7% |
| $35,000 to $49,999 | 81 | 6.4% |
| $50,000 to $74,999 | 205 | 16.1% |
| $75,000 to $99,999 | 173 | 13.6% |
| $100,000 to $149,999 | 451 | 35.4% |
| $150,000 to $199,999 | 132 | 10.4% |
| $200,000+ | 0 | 0.0% |
Family Income by Famaliy Size in Florence
4-person families (175 | 13.8%) account for the highest median family income in Florence with $111,518 per family, while 2-person families (529 | 41.6%) have the highest median income of $46,970 per family member.
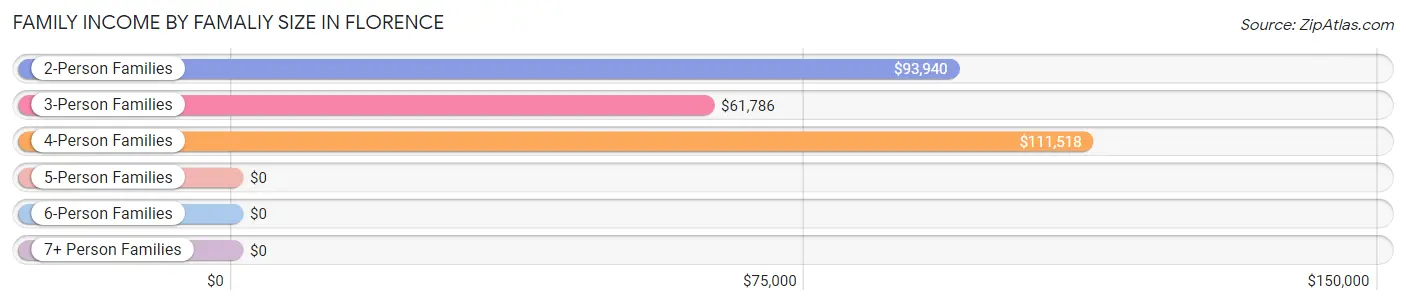
| Income Bracket | # Families | Median Income |
| 2-Person Families | 529 (41.6%) | $93,940 |
| 3-Person Families | 398 (31.3%) | $61,786 |
| 4-Person Families | 175 (13.8%) | $111,518 |
| 5-Person Families | 171 (13.4%) | $0 |
| 6-Person Families | 0 (0.0%) | $0 |
| 7+ Person Families | 0 (0.0%) | $0 |
| Total | 1,273 (100.0%) | $94,446 |
Family Income by Number of Earners in Florence
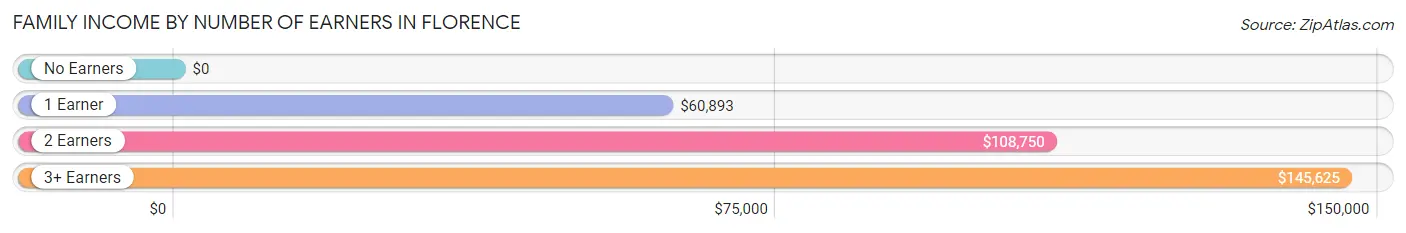
| Number of Earners | # Families | Median Income |
| No Earners | 106 (8.3%) | $0 |
| 1 Earner | 434 (34.1%) | $60,893 |
| 2 Earners | 631 (49.6%) | $108,750 |
| 3+ Earners | 102 (8.0%) | $145,625 |
| Total | 1,273 (100.0%) | $94,446 |
Household Income in Florence
Household Income Brackets in Florence
With 527 households falling in the category, the $100,000 to $149,999 income range is the most frequent in Florence, accounting for 29.6% of all households.
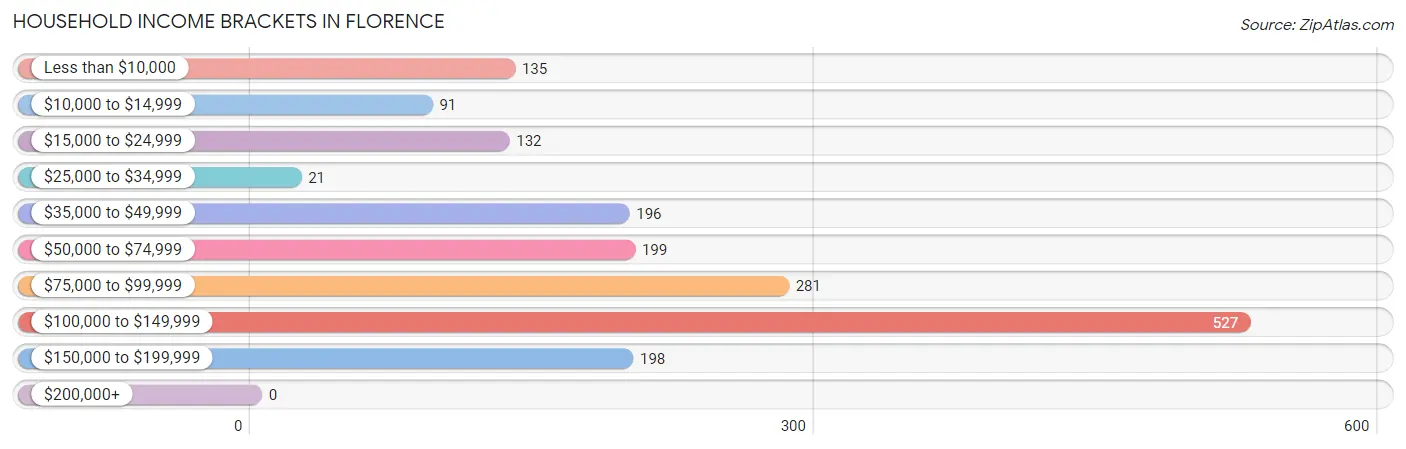
| Income Bracket | # Households | % Households |
| Less than $10,000 | 135 | 7.6% |
| $10,000 to $14,999 | 91 | 5.1% |
| $15,000 to $24,999 | 132 | 7.4% |
| $25,000 to $34,999 | 21 | 1.2% |
| $35,000 to $49,999 | 196 | 11.0% |
| $50,000 to $74,999 | 199 | 11.2% |
| $75,000 to $99,999 | 281 | 15.8% |
| $100,000 to $149,999 | 527 | 29.6% |
| $150,000 to $199,999 | 198 | 11.1% |
| $200,000+ | 0 | 0.0% |
Household Income by Householder Age in Florence
The median household income in Florence is $88,750, with the highest median household income of $128,116 found in the 45 to 64 years age bracket for the primary householder. A total of 585 households (32.9%) fall into this category. Meanwhile, the 15 to 24 years age bracket for the primary householder has the lowest median household income of $0, with 22 households (1.2%) in this group.
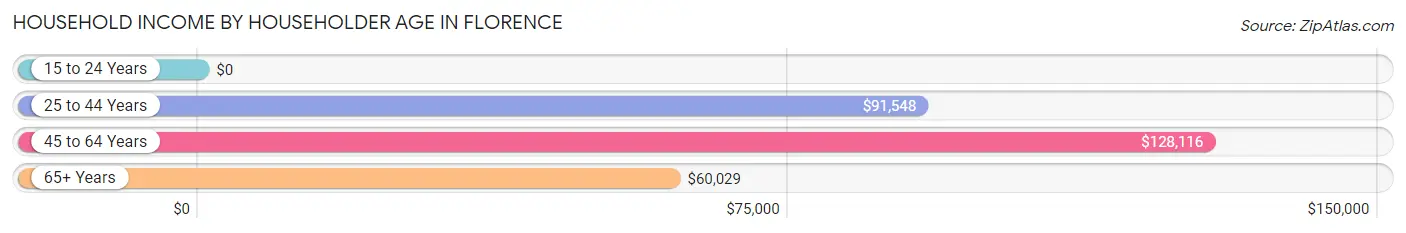
| Income Bracket | # Households | Median Income |
| 15 to 24 Years | 22 (1.2%) | $0 |
| 25 to 44 Years | 712 (40.0%) | $91,548 |
| 45 to 64 Years | 585 (32.9%) | $128,116 |
| 65+ Years | 461 (25.9%) | $60,029 |
| Total | 1,780 (100.0%) | $88,750 |
Poverty in Florence
Income Below Poverty by Sex and Age in Florence
With 14.9% poverty level for males and 12.4% for females among the residents of Florence, 18 to 24 year old males and under 5 year old females are the most vulnerable to poverty, with 102 males (55.1%) and 49 females (43.0%) in their respective age groups living below the poverty level.
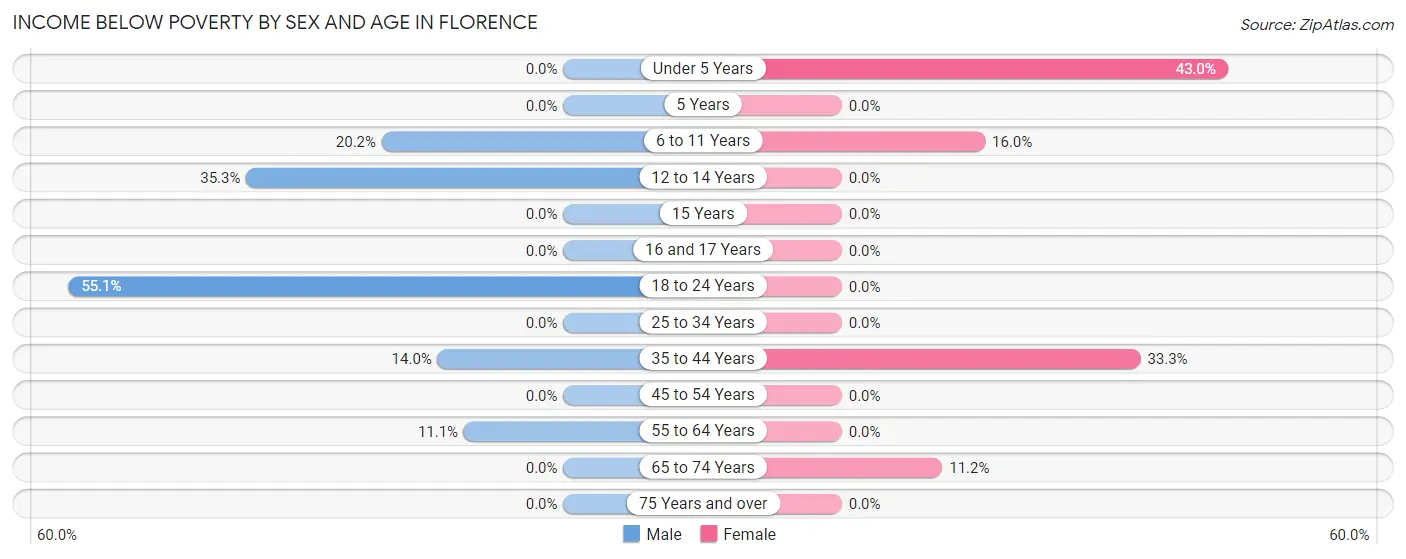
| Age Bracket | Male | Female |
| Under 5 Years | 0 (0.0%) | 49 (43.0%) |
| 5 Years | 0 (0.0%) | 0 (0.0%) |
| 6 to 11 Years | 59 (20.2%) | 45 (16.0%) |
| 12 to 14 Years | 107 (35.3%) | 0 (0.0%) |
| 15 Years | 0 (0.0%) | 0 (0.0%) |
| 16 and 17 Years | 0 (0.0%) | 0 (0.0%) |
| 18 to 24 Years | 102 (55.1%) | 0 (0.0%) |
| 25 to 34 Years | 0 (0.0%) | 0 (0.0%) |
| 35 to 44 Years | 57 (14.0%) | 151 (33.3%) |
| 45 to 54 Years | 0 (0.0%) | 0 (0.0%) |
| 55 to 64 Years | 28 (11.1%) | 0 (0.0%) |
| 65 to 74 Years | 0 (0.0%) | 31 (11.2%) |
| 75 Years and over | 0 (0.0%) | 0 (0.0%) |
| Total | 353 (14.9%) | 276 (12.4%) |
Income Above Poverty by Sex and Age in Florence
According to the poverty statistics in Florence, males aged under 5 years and females aged 5 years are the age groups that are most secure financially, with 100.0% of males and 100.0% of females in these age groups living above the poverty line.
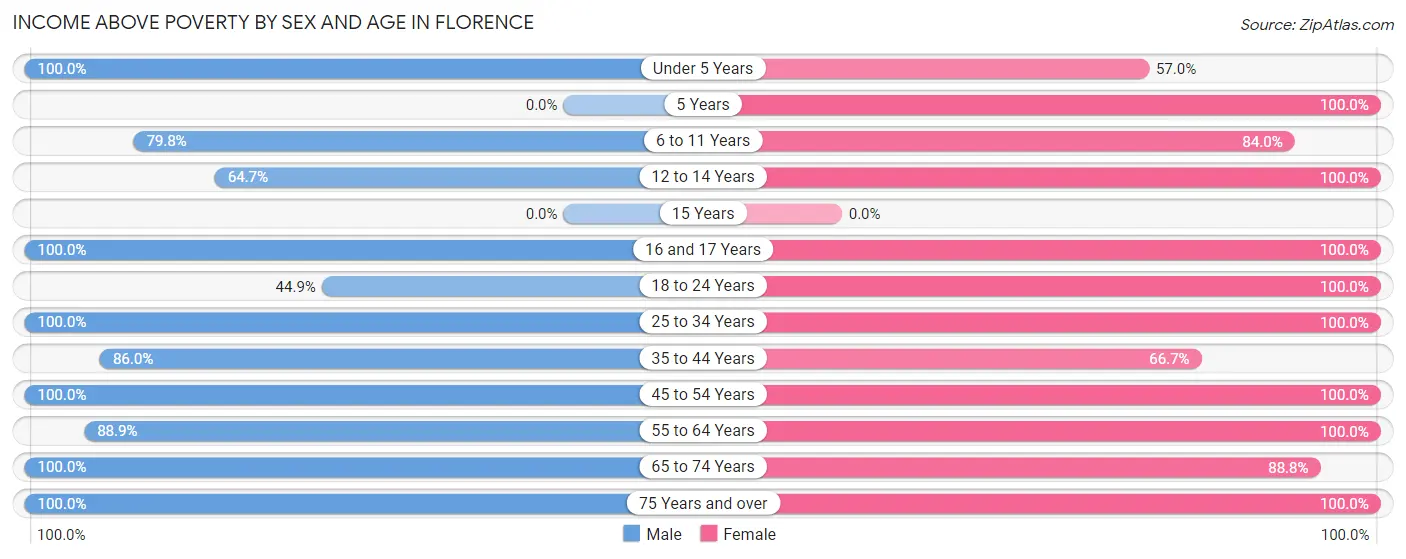
| Age Bracket | Male | Female |
| Under 5 Years | 114 (100.0%) | 65 (57.0%) |
| 5 Years | 0 (0.0%) | 19 (100.0%) |
| 6 to 11 Years | 233 (79.8%) | 237 (84.0%) |
| 12 to 14 Years | 196 (64.7%) | 17 (100.0%) |
| 15 Years | 0 (0.0%) | 0 (0.0%) |
| 16 and 17 Years | 95 (100.0%) | 32 (100.0%) |
| 18 to 24 Years | 83 (44.9%) | 107 (100.0%) |
| 25 to 34 Years | 288 (100.0%) | 300 (100.0%) |
| 35 to 44 Years | 350 (86.0%) | 303 (66.7%) |
| 45 to 54 Years | 136 (100.0%) | 321 (100.0%) |
| 55 to 64 Years | 225 (88.9%) | 196 (100.0%) |
| 65 to 74 Years | 234 (100.0%) | 246 (88.8%) |
| 75 Years and over | 54 (100.0%) | 98 (100.0%) |
| Total | 2,008 (85.1%) | 1,941 (87.5%) |
Income Below Poverty Among Married-Couple Families in Florence
The poverty statistics for married-couple families in Florence show that 3.4% or 32 of the total 954 families live below the poverty line. Families with 1 or 2 children have the highest poverty rate of 5.5%, comprising of 16 families. On the other hand, families with 3 or 4 children have the lowest poverty rate of 0.0%, which includes 0 families.
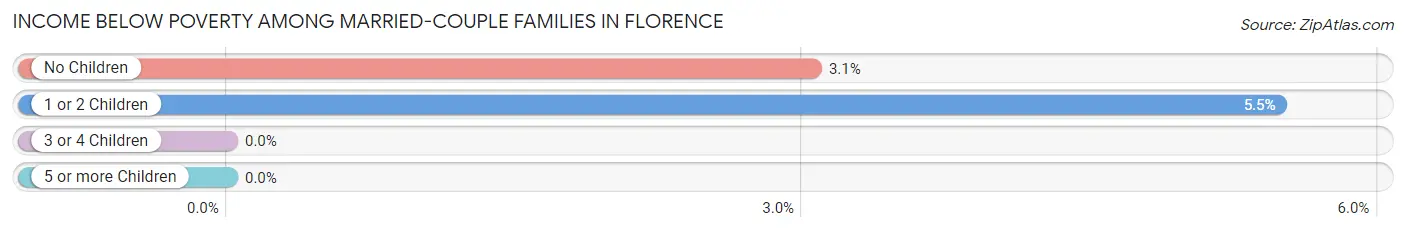
| Children | Above Poverty | Below Poverty |
| No Children | 509 (97.0%) | 16 (3.0%) |
| 1 or 2 Children | 276 (94.5%) | 16 (5.5%) |
| 3 or 4 Children | 137 (100.0%) | 0 (0.0%) |
| 5 or more Children | 0 (0.0%) | 0 (0.0%) |
| Total | 922 (96.7%) | 32 (3.4%) |
Income Below Poverty Among Single-Parent Households in Florence
According to the poverty data in Florence, 100.0% or 41 single-father households and 48.9% or 136 single-mother households are living below the poverty line. Among single-father households, those with 3 or 4 children have the highest poverty rate, with 41 households (100.0%) experiencing poverty. Likewise, among single-mother households, those with 1 or 2 children have the highest poverty rate, with 136 households (52.7%) falling below the poverty line.
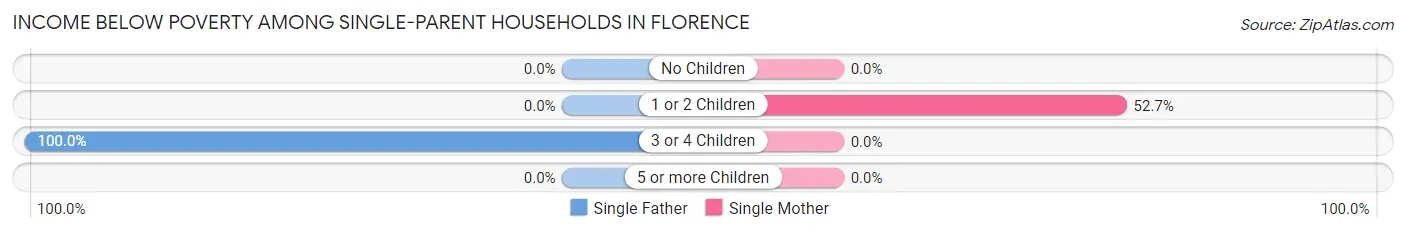
| Children | Single Father | Single Mother |
| No Children | 0 (0.0%) | 0 (0.0%) |
| 1 or 2 Children | 0 (0.0%) | 136 (52.7%) |
| 3 or 4 Children | 41 (100.0%) | 0 (0.0%) |
| 5 or more Children | 0 (0.0%) | 0 (0.0%) |
| Total | 41 (100.0%) | 136 (48.9%) |
Income Below Poverty Among Married-Couple vs Single-Parent Households in Florence
The poverty data for Florence shows that 32 of the married-couple family households (3.4%) and 177 of the single-parent households (55.5%) are living below the poverty level. Within the married-couple family households, those with 1 or 2 children have the highest poverty rate, with 16 households (5.5%) falling below the poverty line. Among the single-parent households, those with 3 or 4 children have the highest poverty rate, with 41 household (100.0%) living below poverty.
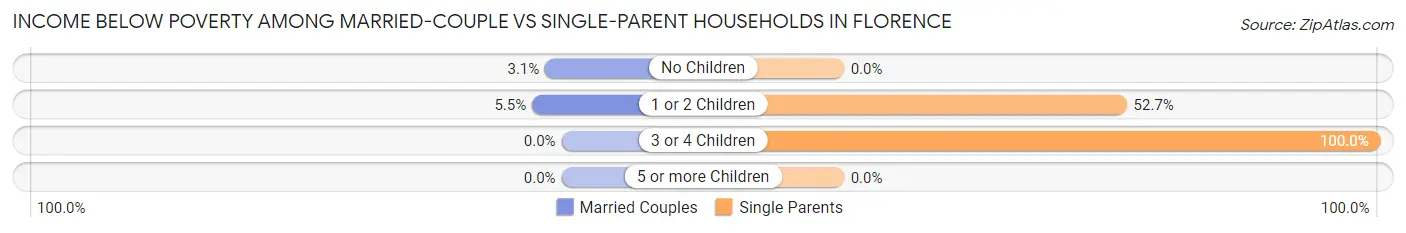
| Children | Married-Couple Families | Single-Parent Households |
| No Children | 16 (3.0%) | 0 (0.0%) |
| 1 or 2 Children | 16 (5.5%) | 136 (52.7%) |
| 3 or 4 Children | 0 (0.0%) | 41 (100.0%) |
| 5 or more Children | 0 (0.0%) | 0 (0.0%) |
| Total | 32 (3.4%) | 177 (55.5%) |
Race in Florence
The most populous races in Florence are White / Caucasian (3,981 | 86.6%), Black / African American (593 | 12.9%), and Hispanic or Latino (13 | 0.3%).
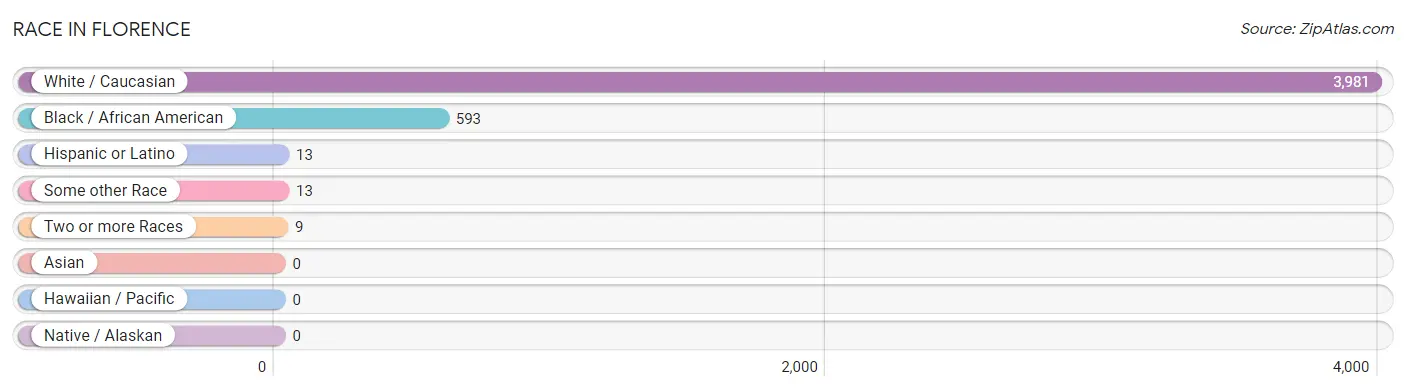
| Race | # Population | % Population |
| Asian | 0 | 0.0% |
| Black / African American | 593 | 12.9% |
| Hawaiian / Pacific | 0 | 0.0% |
| Hispanic or Latino | 13 | 0.3% |
| Native / Alaskan | 0 | 0.0% |
| White / Caucasian | 3,981 | 86.6% |
| Two or more Races | 9 | 0.2% |
| Some other Race | 13 | 0.3% |
| Total | 4,596 | 100.0% |
Ancestry in Florence
The most populous ancestries reported in Florence are English (635 | 13.8%), American (322 | 7.0%), Irish (256 | 5.6%), Scotch-Irish (239 | 5.2%), and German (122 | 2.6%), together accounting for 34.3% of all Florence residents.
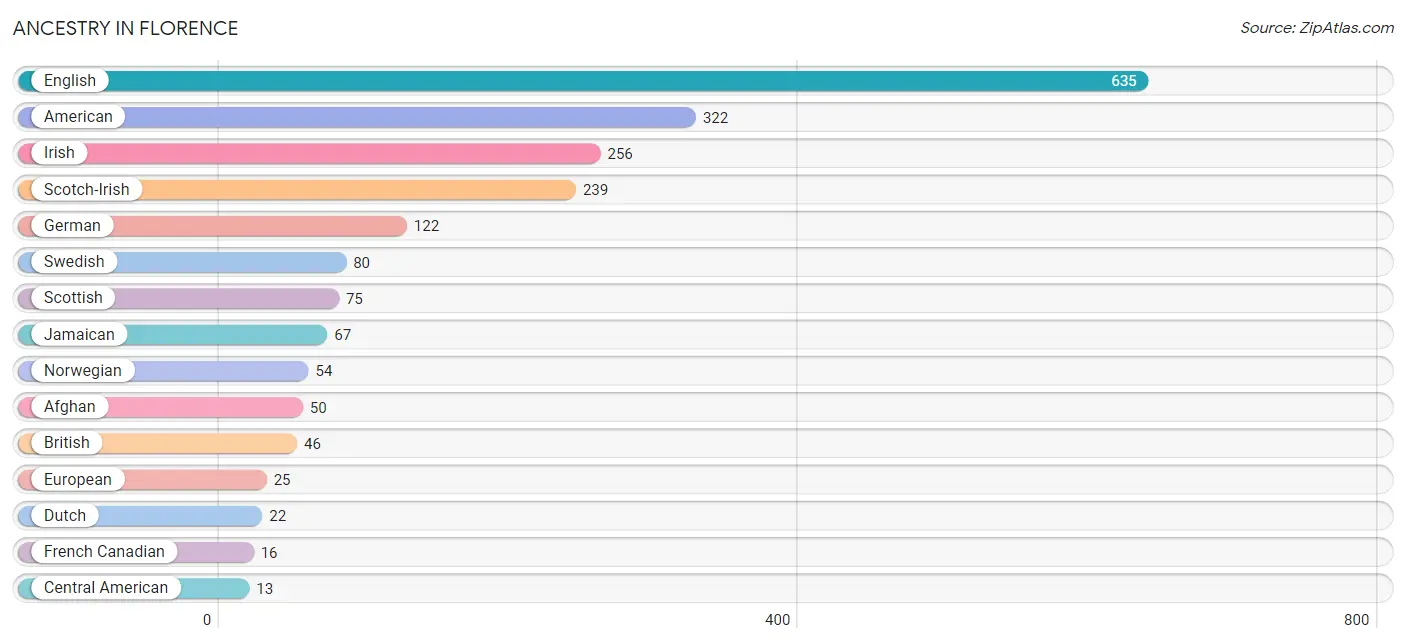
| Ancestry | # Population | % Population |
| Afghan | 50 | 1.1% |
| American | 322 | 7.0% |
| British | 46 | 1.0% |
| Central American | 13 | 0.3% |
| Cherokee | 1 | 0.0% |
| Choctaw | 8 | 0.2% |
| Dutch | 22 | 0.5% |
| English | 635 | 13.8% |
| European | 25 | 0.5% |
| French Canadian | 16 | 0.4% |
| German | 122 | 2.6% |
| Honduran | 13 | 0.3% |
| Irish | 256 | 5.6% |
| Jamaican | 67 | 1.5% |
| Norwegian | 54 | 1.2% |
| Scandinavian | 8 | 0.2% |
| Scotch-Irish | 239 | 5.2% |
| Scottish | 75 | 1.6% |
| Swedish | 80 | 1.7% | View All 19 Rows |
Immigrants in Florence
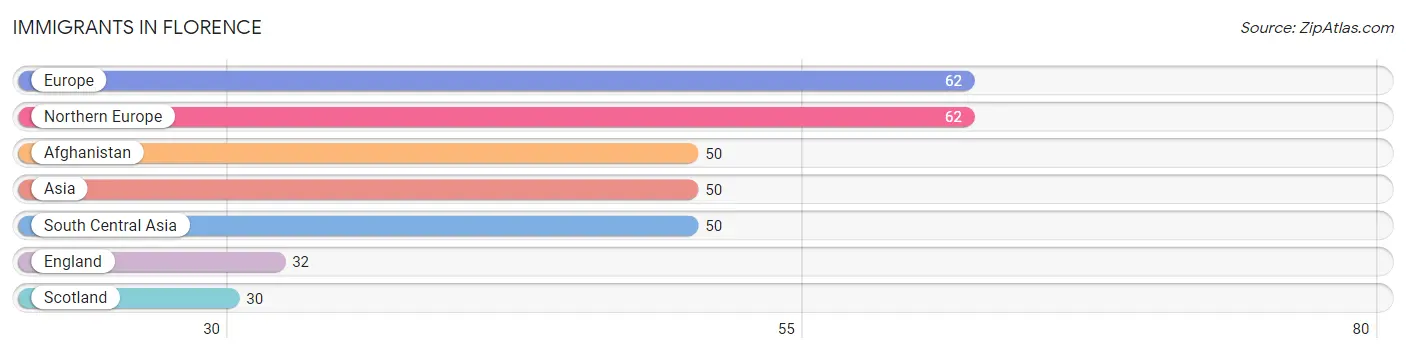
The most numerous immigrant groups reported in Florence came from Europe (62 | 1.3%), Northern Europe (62 | 1.3%), Afghanistan (50 | 1.1%), Asia (50 | 1.1%), and South Central Asia (50 | 1.1%), together accounting for 6.0% of all Florence residents.
| Immigration Origin | # Population | % Population |
| Afghanistan | 50 | 1.1% |
| Asia | 50 | 1.1% |
| England | 32 | 0.7% |
| Europe | 62 | 1.3% |
| Northern Europe | 62 | 1.3% |
| Scotland | 30 | 0.6% |
| South Central Asia | 50 | 1.1% | View All 7 Rows |
Sex and Age in Florence
Sex and Age in Florence
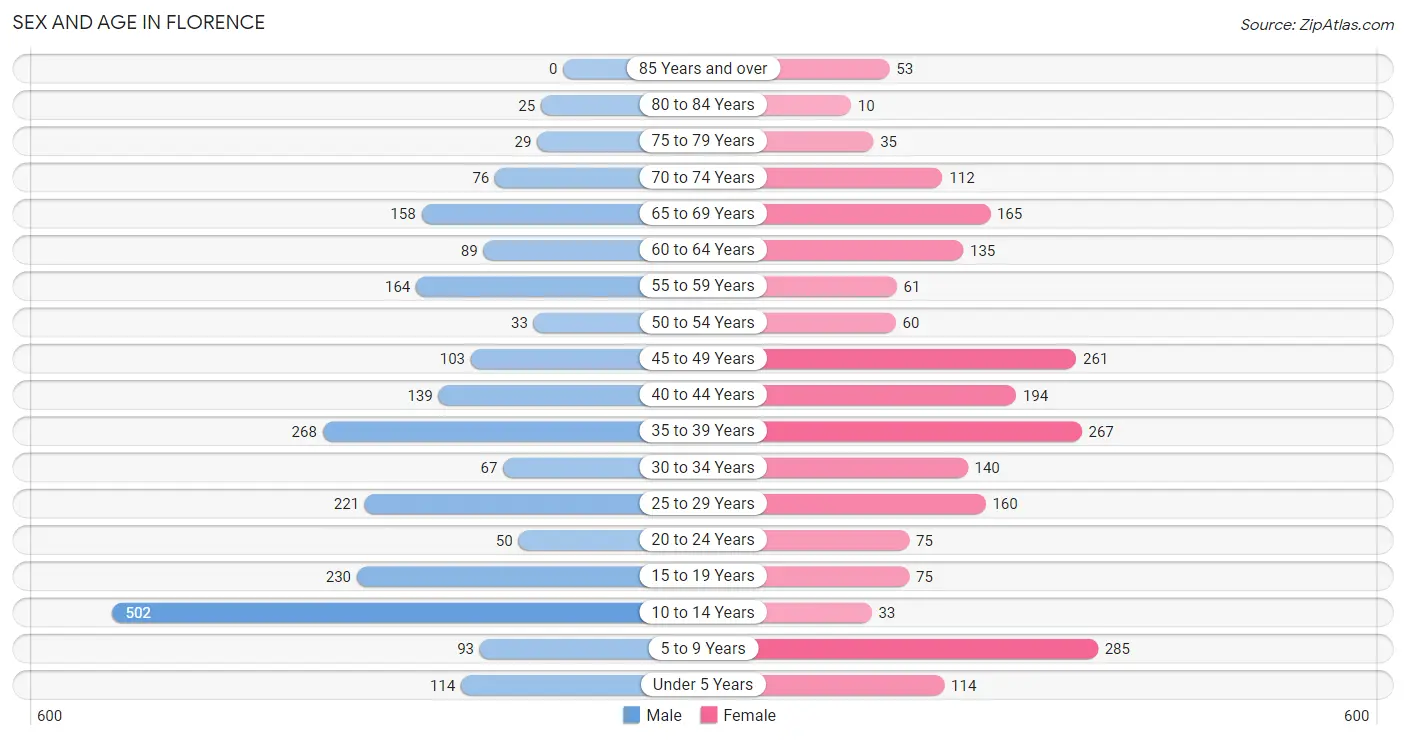
The most populous age groups in Florence are 10 to 14 Years (502 | 21.3%) for men and 5 to 9 Years (285 | 12.8%) for women.
| Age Bracket | Male | Female |
| Under 5 Years | 114 (4.8%) | 114 (5.1%) |
| 5 to 9 Years | 93 (3.9%) | 285 (12.8%) |
| 10 to 14 Years | 502 (21.3%) | 33 (1.5%) |
| 15 to 19 Years | 230 (9.7%) | 75 (3.4%) |
| 20 to 24 Years | 50 (2.1%) | 75 (3.4%) |
| 25 to 29 Years | 221 (9.4%) | 160 (7.2%) |
| 30 to 34 Years | 67 (2.8%) | 140 (6.3%) |
| 35 to 39 Years | 268 (11.4%) | 267 (11.9%) |
| 40 to 44 Years | 139 (5.9%) | 194 (8.7%) |
| 45 to 49 Years | 103 (4.4%) | 261 (11.7%) |
| 50 to 54 Years | 33 (1.4%) | 60 (2.7%) |
| 55 to 59 Years | 164 (7.0%) | 61 (2.7%) |
| 60 to 64 Years | 89 (3.8%) | 135 (6.0%) |
| 65 to 69 Years | 158 (6.7%) | 165 (7.4%) |
| 70 to 74 Years | 76 (3.2%) | 112 (5.0%) |
| 75 to 79 Years | 29 (1.2%) | 35 (1.6%) |
| 80 to 84 Years | 25 (1.1%) | 10 (0.4%) |
| 85 Years and over | 0 (0.0%) | 53 (2.4%) |
| Total | 2,361 (100.0%) | 2,235 (100.0%) |
Families and Households in Florence
Median Family Size in Florence
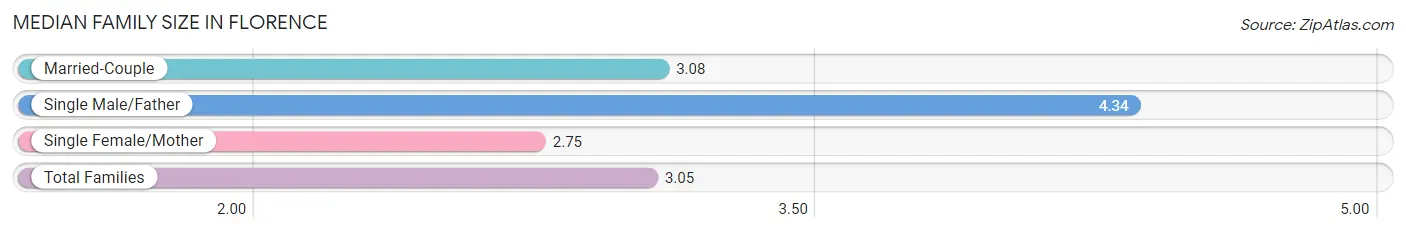
The median family size in Florence is 3.05 persons per family, with single male/father families (41 | 3.2%) accounting for the largest median family size of 4.34 persons per family. On the other hand, single female/mother families (278 | 21.8%) represent the smallest median family size with 2.75 persons per family.
| Family Type | # Families | Family Size |
| Married-Couple | 954 (74.9%) | 3.08 |
| Single Male/Father | 41 (3.2%) | 4.34 |
| Single Female/Mother | 278 (21.8%) | 2.75 |
| Total Families | 1,273 (100.0%) | 3.05 |
Median Household Size in Florence
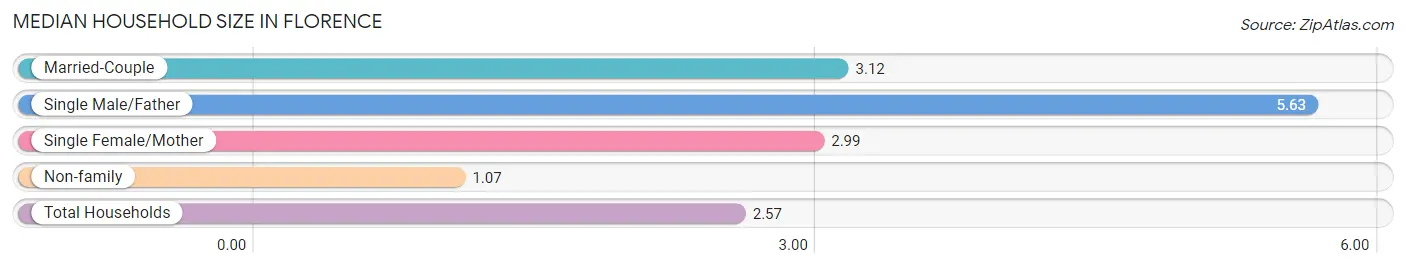
The median household size in Florence is 2.57 persons per household, with single male/father households (41 | 2.3%) accounting for the largest median household size of 5.63 persons per household. non-family households (507 | 28.5%) represent the smallest median household size with 1.07 persons per household.
| Household Type | # Households | Household Size |
| Married-Couple | 954 (53.6%) | 3.12 |
| Single Male/Father | 41 (2.3%) | 5.63 |
| Single Female/Mother | 278 (15.6%) | 2.99 |
| Non-family | 507 (28.5%) | 1.07 |
| Total Households | 1,780 (100.0%) | 2.57 |
Household Size by Marriage Status in Florence
Out of a total of 1,780 households in Florence, 1,273 (71.5%) are family households, while 507 (28.5%) are nonfamily households. The most numerous type of family households are 2-person households, comprising 464, and the most common type of nonfamily households are 1-person households, comprising 482.
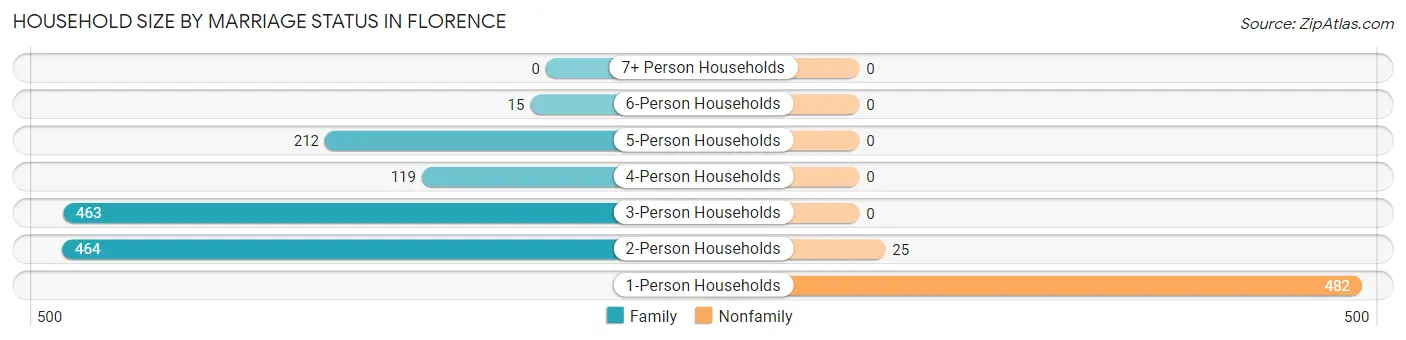
| Household Size | Family Households | Nonfamily Households |
| 1-Person Households | - | 482 (27.1%) |
| 2-Person Households | 464 (26.1%) | 25 (1.4%) |
| 3-Person Households | 463 (26.0%) | 0 (0.0%) |
| 4-Person Households | 119 (6.7%) | 0 (0.0%) |
| 5-Person Households | 212 (11.9%) | 0 (0.0%) |
| 6-Person Households | 15 (0.8%) | 0 (0.0%) |
| 7+ Person Households | 0 (0.0%) | 0 (0.0%) |
| Total | 1,273 (71.5%) | 507 (28.5%) |
Female Fertility in Florence
Fertility by Age in Florence
Average fertility rate in Florence is 43.0 births per 1,000 women. Women in the age bracket of 20 to 34 years have the highest fertility rate with 69.0 births per 1,000 women. Women in the age bracket of 20 to 34 years acount for 52.0% of all women with births.
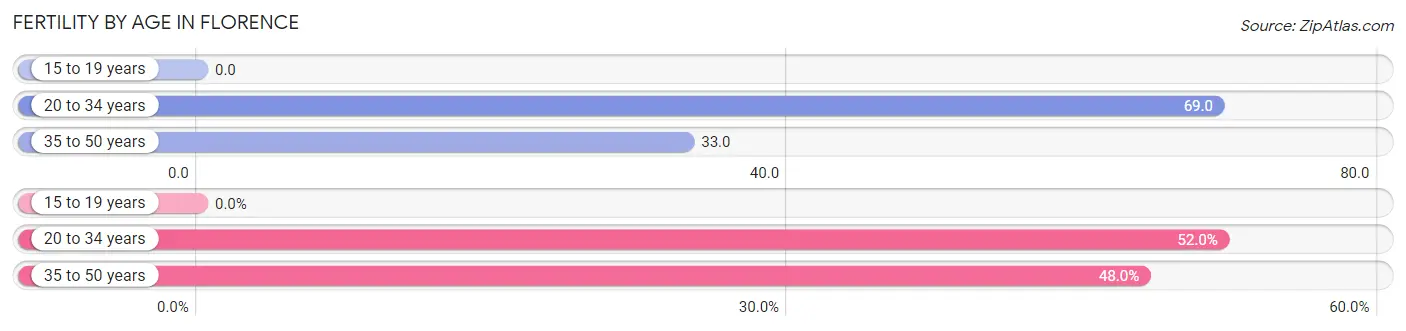
| Age Bracket | Women with Births | Births / 1,000 Women |
| 15 to 19 years | 0 (0.0%) | 0.0 |
| 20 to 34 years | 26 (52.0%) | 69.0 |
| 35 to 50 years | 24 (48.0%) | 33.0 |
| Total | 50 (100.0%) | 43.0 |
Fertility by Age by Marriage Status in Florence
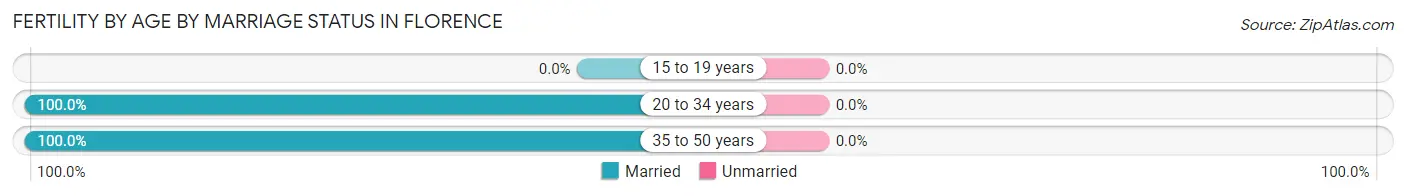
| Age Bracket | Married | Unmarried |
| 15 to 19 years | 0 (0.0%) | 0 (0.0%) |
| 20 to 34 years | 26 (100.0%) | 0 (0.0%) |
| 35 to 50 years | 24 (100.0%) | 0 (0.0%) |
| Total | 50 (100.0%) | 0 (0.0%) |
Fertility by Education in Florence
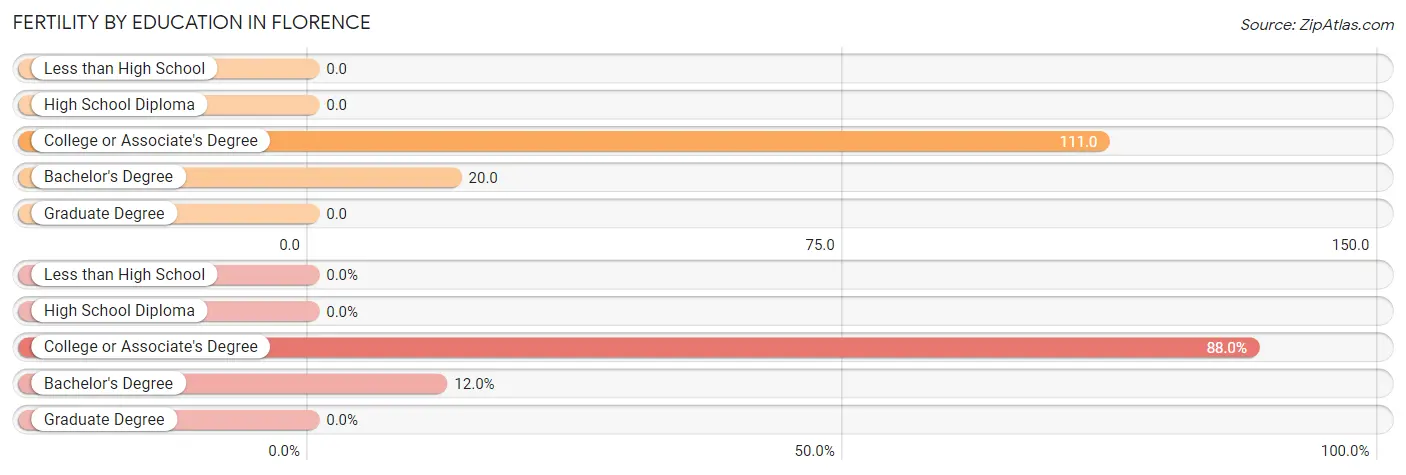
| Educational Attainment | Women with Births | Births / 1,000 Women |
| Less than High School | 0 (0.0%) | 0.0 |
| High School Diploma | 0 (0.0%) | 0.0 |
| College or Associate's Degree | 44 (88.0%) | 111.0 |
| Bachelor's Degree | 6 (12.0%) | 20.0 |
| Graduate Degree | 0 (0.0%) | 0.0 |
| Total | 50 (100.0%) | 43.0 |
Fertility by Education by Marriage Status in Florence
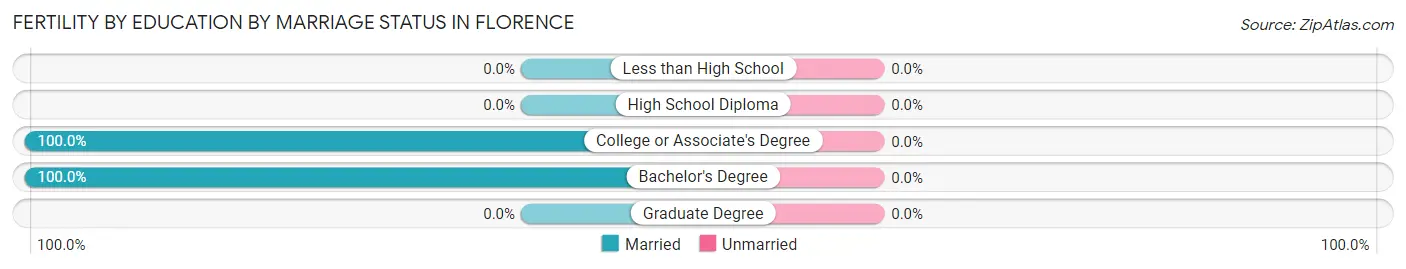
| Educational Attainment | Married | Unmarried |
| Less than High School | 0 (0.0%) | 0 (0.0%) |
| High School Diploma | 0 (0.0%) | 0 (0.0%) |
| College or Associate's Degree | 44 (100.0%) | 0 (0.0%) |
| Bachelor's Degree | 6 (100.0%) | 0 (0.0%) |
| Graduate Degree | 0 (0.0%) | 0 (0.0%) |
| Total | 50 (100.0%) | 0 (0.0%) |
Employment Characteristics in Florence
Employment by Class of Employer in Florence
Among the 2,398 employed individuals in Florence, private company employees (1,666 | 69.5%), not-for-profit organizations (327 | 13.6%), and self-employed (incorporated) (100 | 4.2%) make up the most common classes of employment.
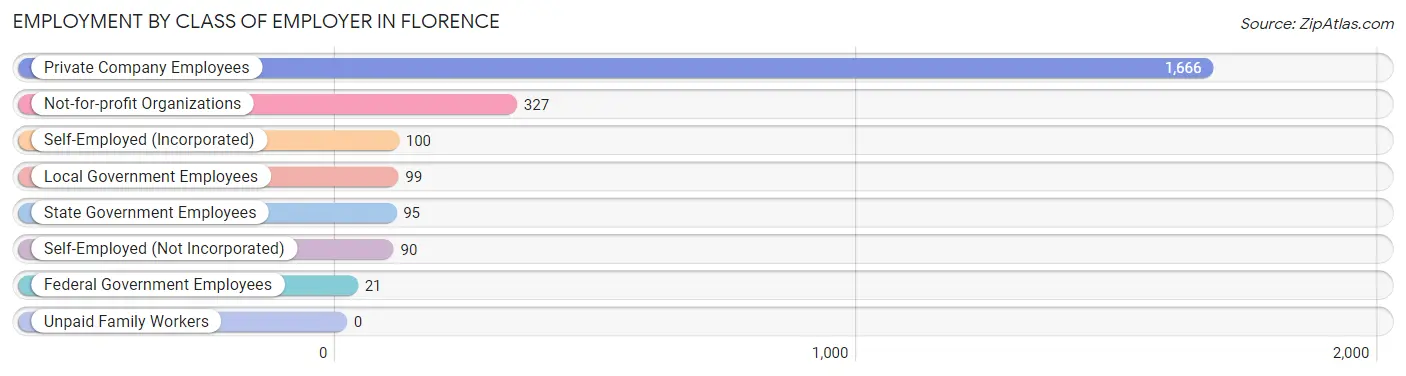
| Employer Class | # Employees | % Employees |
| Private Company Employees | 1,666 | 69.5% |
| Self-Employed (Incorporated) | 100 | 4.2% |
| Self-Employed (Not Incorporated) | 90 | 3.7% |
| Not-for-profit Organizations | 327 | 13.6% |
| Local Government Employees | 99 | 4.1% |
| State Government Employees | 95 | 4.0% |
| Federal Government Employees | 21 | 0.9% |
| Unpaid Family Workers | 0 | 0.0% |
| Total | 2,398 | 100.0% |
Employment Status by Age in Florence
According to the labor force statistics for Florence, out of the total population over 16 years of age (3,455), 75.9% or 2,622 individuals are in the labor force, with 7.9% or 207 of them unemployed. The age group with the highest labor force participation rate is 20 to 24 years, with 100.0% or 125 individuals in the labor force. Within the labor force, the 16 to 19 years age range has the highest percentage of unemployed individuals, with 77.0% or 174 of them being unemployed.
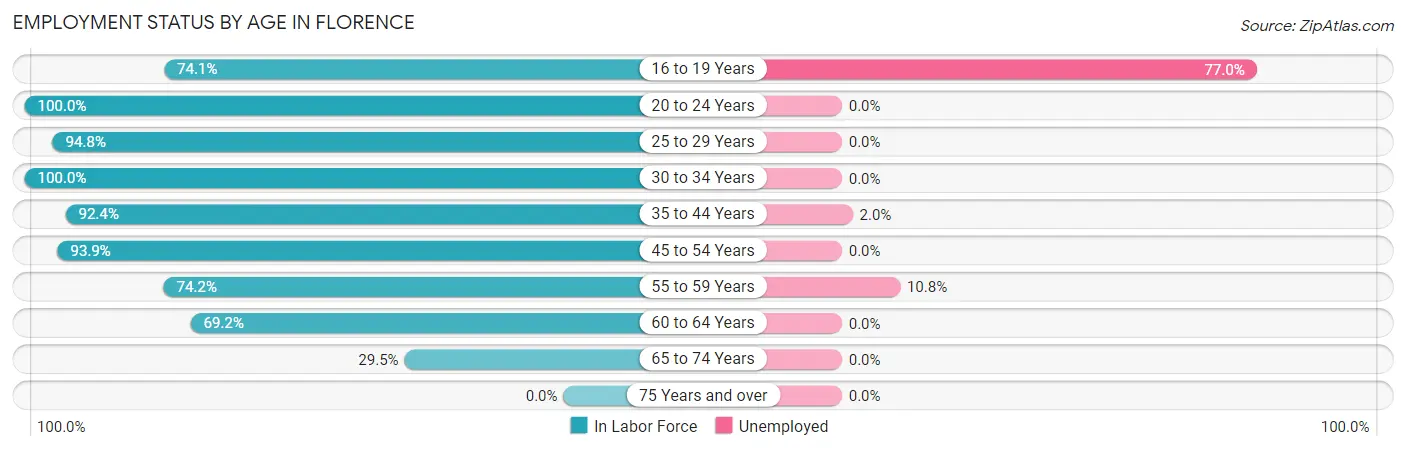
| Age Bracket | In Labor Force | Unemployed |
| 16 to 19 Years | 226 (74.1%) | 174 (77.0%) |
| 20 to 24 Years | 125 (100.0%) | 0 (0.0%) |
| 25 to 29 Years | 361 (94.8%) | 0 (0.0%) |
| 30 to 34 Years | 207 (100.0%) | 0 (0.0%) |
| 35 to 44 Years | 802 (92.4%) | 16 (2.0%) |
| 45 to 54 Years | 429 (93.9%) | 0 (0.0%) |
| 55 to 59 Years | 167 (74.2%) | 18 (10.8%) |
| 60 to 64 Years | 155 (69.2%) | 0 (0.0%) |
| 65 to 74 Years | 151 (29.5%) | 0 (0.0%) |
| 75 Years and over | 0 (0.0%) | 0 (0.0%) |
| Total | 2,622 (75.9%) | 207 (7.9%) |
Employment Status by Educational Attainment in Florence
According to labor force statistics for Florence, 89.8% of individuals (2,121) out of the total population between 25 and 64 years of age (2,362) are in the labor force, with 1.6% or 34 of them being unemployed. The group with the highest labor force participation rate are those with the educational attainment of high school diploma, with 92.9% or 793 individuals in the labor force. Within the labor force, individuals with college / associate degree education have the highest percentage of unemployment, with 5.9% or 34 of them being unemployed.
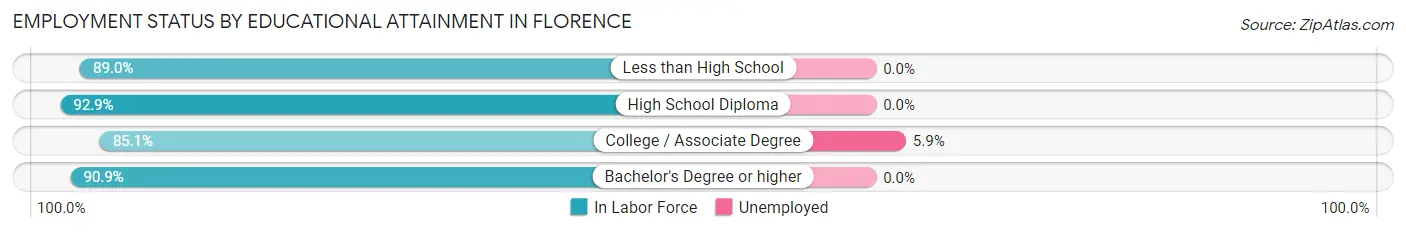
| Educational Attainment | In Labor Force | Unemployed |
| Less than High School | 154 (89.0%) | 0 (0.0%) |
| High School Diploma | 793 (92.9%) | 0 (0.0%) |
| College / Associate Degree | 575 (85.1%) | 40 (5.9%) |
| Bachelor's Degree or higher | 599 (90.9%) | 0 (0.0%) |
| Total | 2,121 (89.8%) | 38 (1.6%) |
Employment Occupations by Sex in Florence
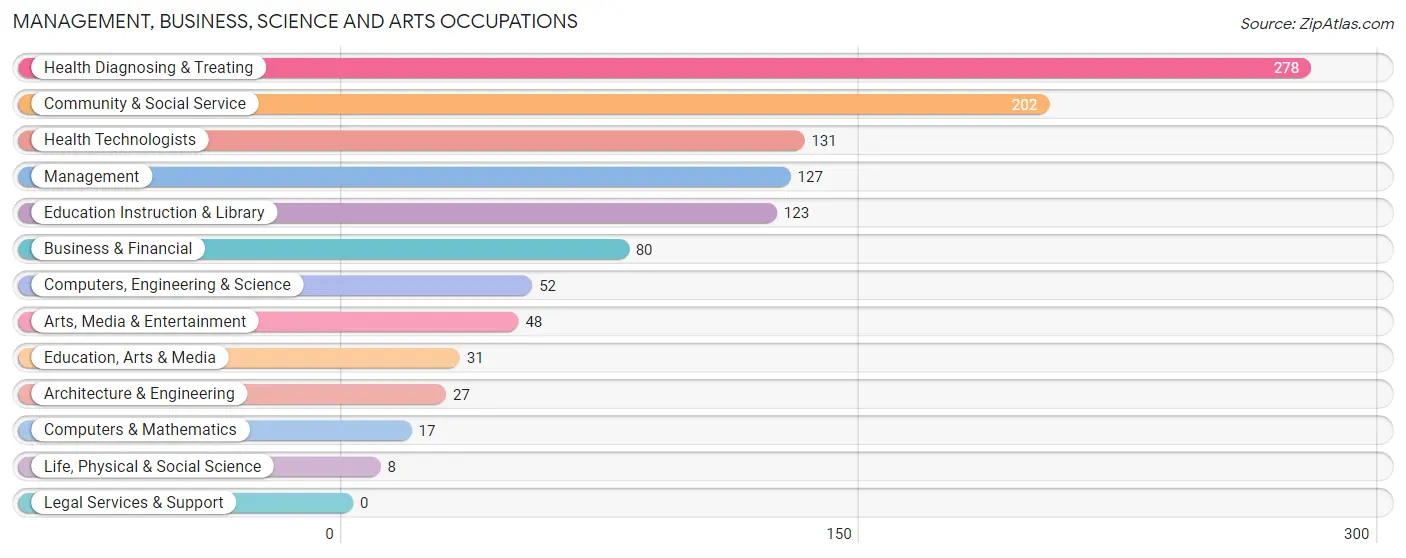
Management, Business, Science and Arts Occupations
The most common Management, Business, Science and Arts occupations in Florence are Health Diagnosing & Treating (278 | 11.5%), Community & Social Service (202 | 8.4%), Health Technologists (131 | 5.4%), Management (127 | 5.3%), and Education Instruction & Library (123 | 5.1%).
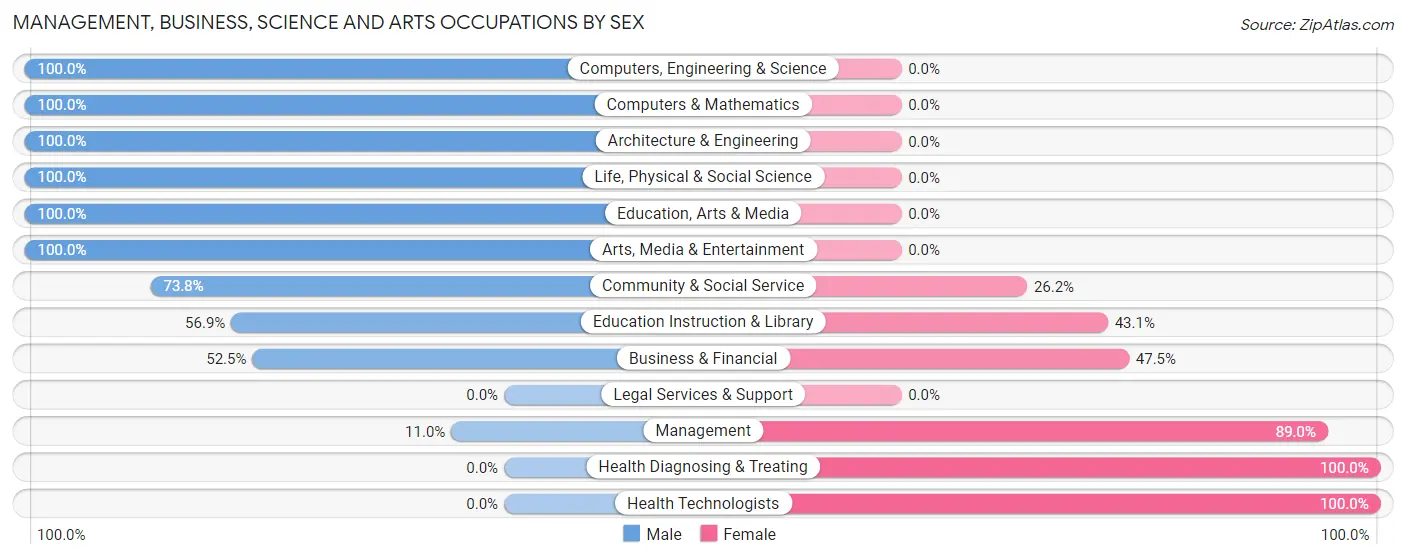
Management, Business, Science and Arts Occupations by Sex
Within the Management, Business, Science and Arts occupations in Florence, the most male-oriented occupations are Computers, Engineering & Science (100.0%), Computers & Mathematics (100.0%), and Architecture & Engineering (100.0%), while the most female-oriented occupations are Health Diagnosing & Treating (100.0%), Health Technologists (100.0%), and Management (89.0%).
| Occupation | Male | Female |
| Management | 14 (11.0%) | 113 (89.0%) |
| Business & Financial | 42 (52.5%) | 38 (47.5%) |
| Computers, Engineering & Science | 52 (100.0%) | 0 (0.0%) |
| Computers & Mathematics | 17 (100.0%) | 0 (0.0%) |
| Architecture & Engineering | 27 (100.0%) | 0 (0.0%) |
| Life, Physical & Social Science | 8 (100.0%) | 0 (0.0%) |
| Community & Social Service | 149 (73.8%) | 53 (26.2%) |
| Education, Arts & Media | 31 (100.0%) | 0 (0.0%) |
| Legal Services & Support | 0 (0.0%) | 0 (0.0%) |
| Education Instruction & Library | 70 (56.9%) | 53 (43.1%) |
| Arts, Media & Entertainment | 48 (100.0%) | 0 (0.0%) |
| Health Diagnosing & Treating | 0 (0.0%) | 278 (100.0%) |
| Health Technologists | 0 (0.0%) | 131 (100.0%) |
| Total (Category) | 257 (34.8%) | 482 (65.2%) |
| Total (Overall) | 1,121 (46.4%) | 1,294 (53.6%) |
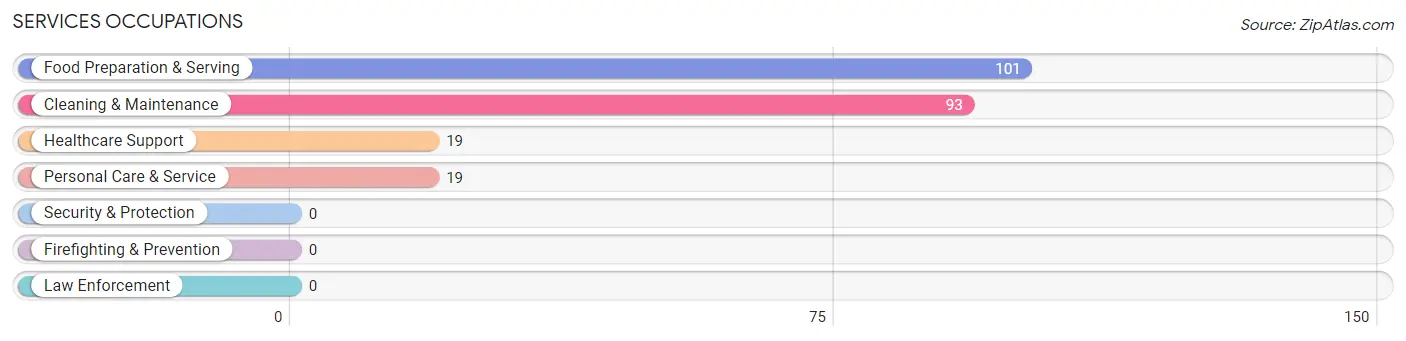
Services Occupations
The most common Services occupations in Florence are Food Preparation & Serving (101 | 4.2%), Cleaning & Maintenance (93 | 3.8%), Healthcare Support (19 | 0.8%), and Personal Care & Service (19 | 0.8%).
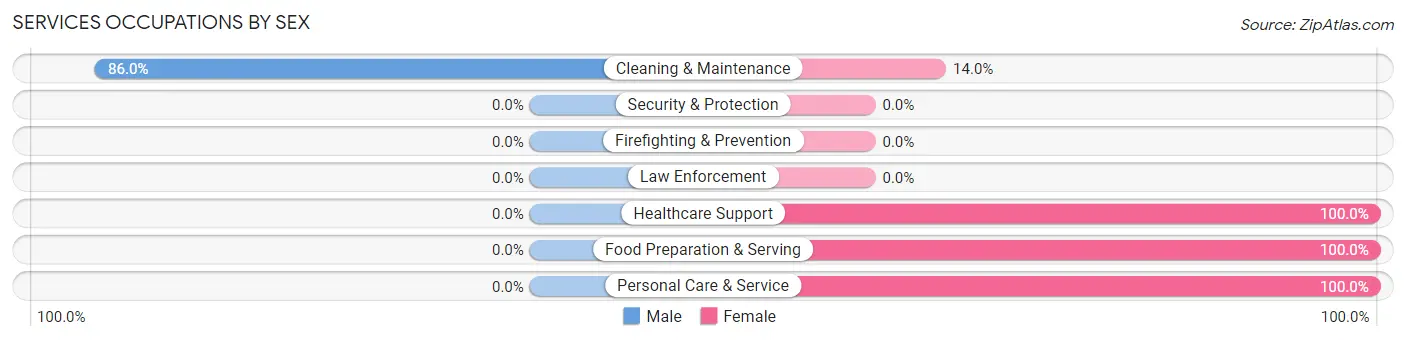
Services Occupations by Sex
| Occupation | Male | Female |
| Healthcare Support | 0 (0.0%) | 19 (100.0%) |
| Security & Protection | 0 (0.0%) | 0 (0.0%) |
| Firefighting & Prevention | 0 (0.0%) | 0 (0.0%) |
| Law Enforcement | 0 (0.0%) | 0 (0.0%) |
| Food Preparation & Serving | 0 (0.0%) | 101 (100.0%) |
| Cleaning & Maintenance | 80 (86.0%) | 13 (14.0%) |
| Personal Care & Service | 0 (0.0%) | 19 (100.0%) |
| Total (Category) | 80 (34.5%) | 152 (65.5%) |
| Total (Overall) | 1,121 (46.4%) | 1,294 (53.6%) |
Sales and Office Occupations
The most common Sales and Office occupations in Florence are Office & Administration (600 | 24.8%), and Sales & Related (284 | 11.8%).

Sales and Office Occupations by Sex

| Occupation | Male | Female |
| Sales & Related | 224 (78.9%) | 60 (21.1%) |
| Office & Administration | 0 (0.0%) | 600 (100.0%) |
| Total (Category) | 224 (25.3%) | 660 (74.7%) |
| Total (Overall) | 1,121 (46.4%) | 1,294 (53.6%) |
Natural Resources, Construction and Maintenance Occupations
The most common Natural Resources, Construction and Maintenance occupations in Florence are Construction & Extraction (165 | 6.8%), and Installation, Maintenance & Repair (35 | 1.5%).
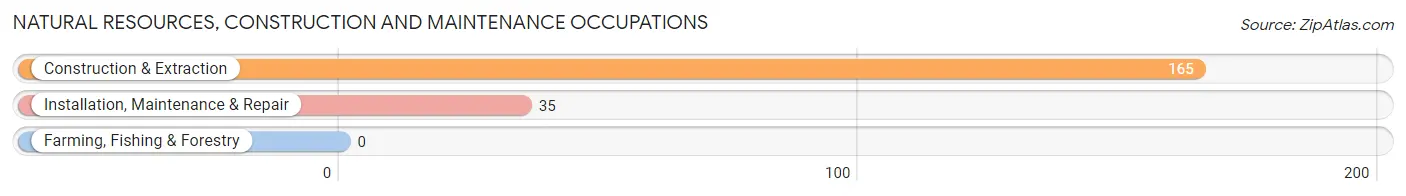
Natural Resources, Construction and Maintenance Occupations by Sex
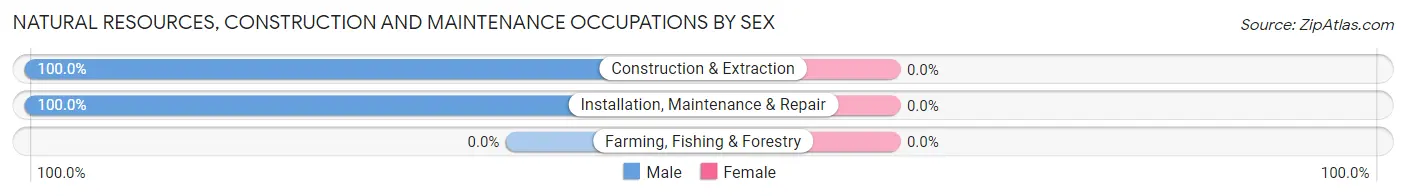
| Occupation | Male | Female |
| Farming, Fishing & Forestry | 0 (0.0%) | 0 (0.0%) |
| Construction & Extraction | 165 (100.0%) | 0 (0.0%) |
| Installation, Maintenance & Repair | 35 (100.0%) | 0 (0.0%) |
| Total (Category) | 200 (100.0%) | 0 (0.0%) |
| Total (Overall) | 1,121 (46.4%) | 1,294 (53.6%) |
Production, Transportation and Moving Occupations
The most common Production, Transportation and Moving occupations in Florence are Transportation (291 | 12.0%), Production (53 | 2.2%), and Material Moving (16 | 0.7%).
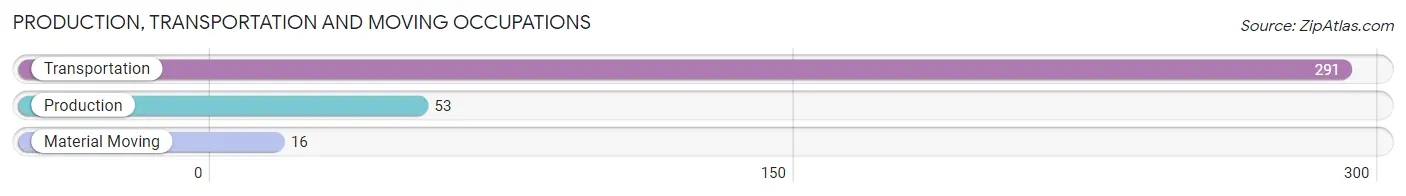
Production, Transportation and Moving Occupations by Sex
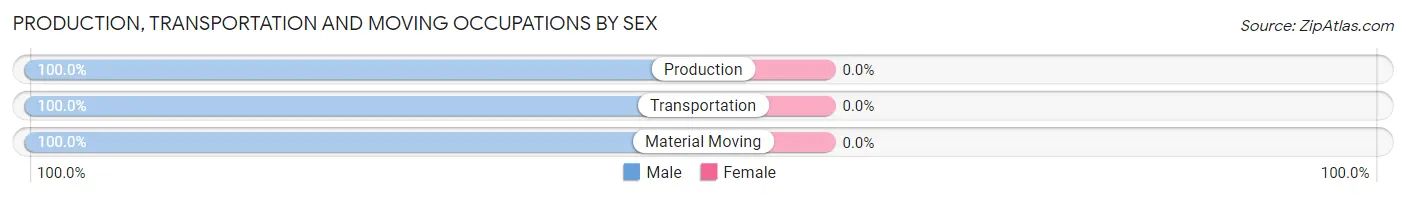
| Occupation | Male | Female |
| Production | 53 (100.0%) | 0 (0.0%) |
| Transportation | 291 (100.0%) | 0 (0.0%) |
| Material Moving | 16 (100.0%) | 0 (0.0%) |
| Total (Category) | 360 (100.0%) | 0 (0.0%) |
| Total (Overall) | 1,121 (46.4%) | 1,294 (53.6%) |
Employment Industries by Sex in Florence
Employment Industries in Florence
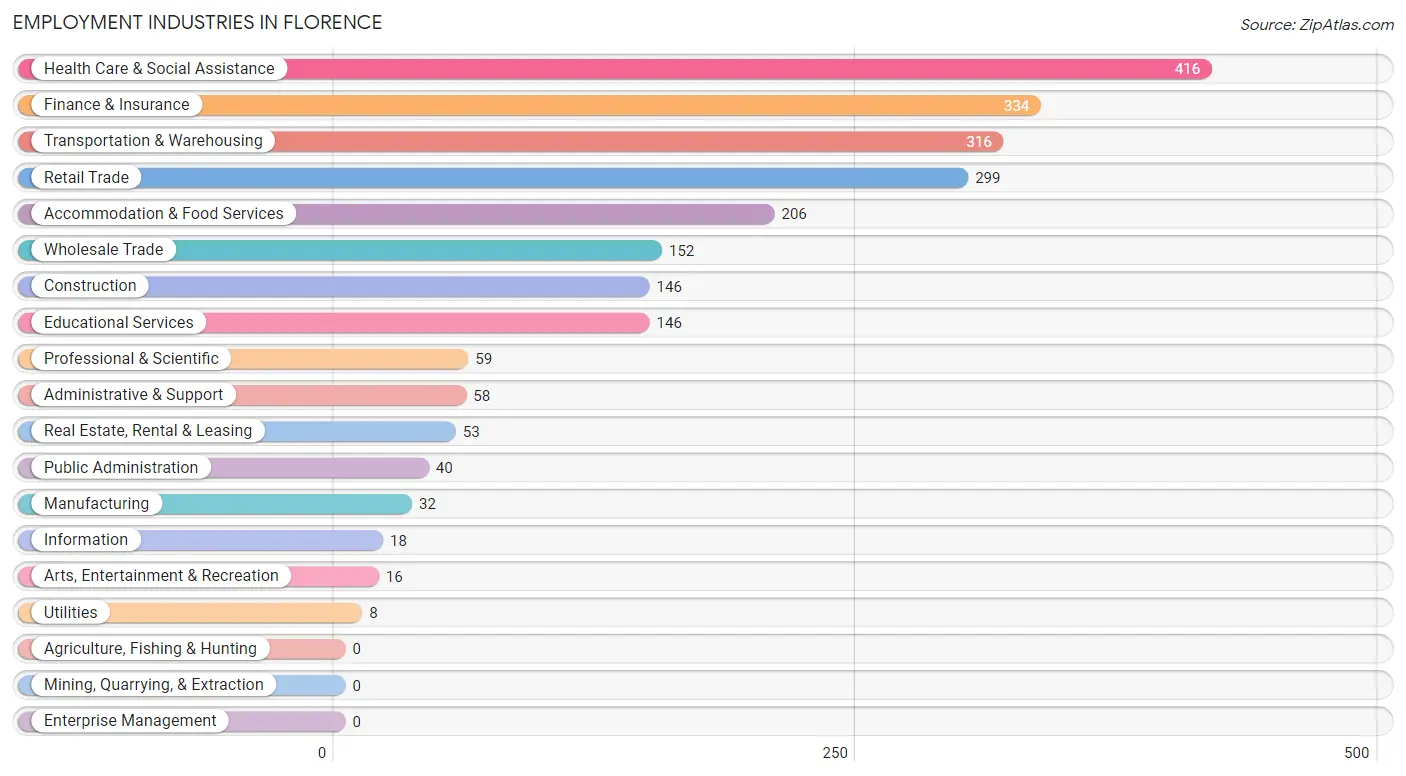
The major employment industries in Florence include Health Care & Social Assistance (416 | 17.2%), Finance & Insurance (334 | 13.8%), Transportation & Warehousing (316 | 13.1%), Retail Trade (299 | 12.4%), and Accommodation & Food Services (206 | 8.5%).
Employment Industries by Sex in Florence
The Florence industries that see more men than women are Construction (100.0%), Wholesale Trade (100.0%), and Utilities (100.0%), whereas the industries that tend to have a higher number of women are Finance & Insurance (100.0%), Arts, Entertainment & Recreation (100.0%), and Accommodation & Food Services (100.0%).
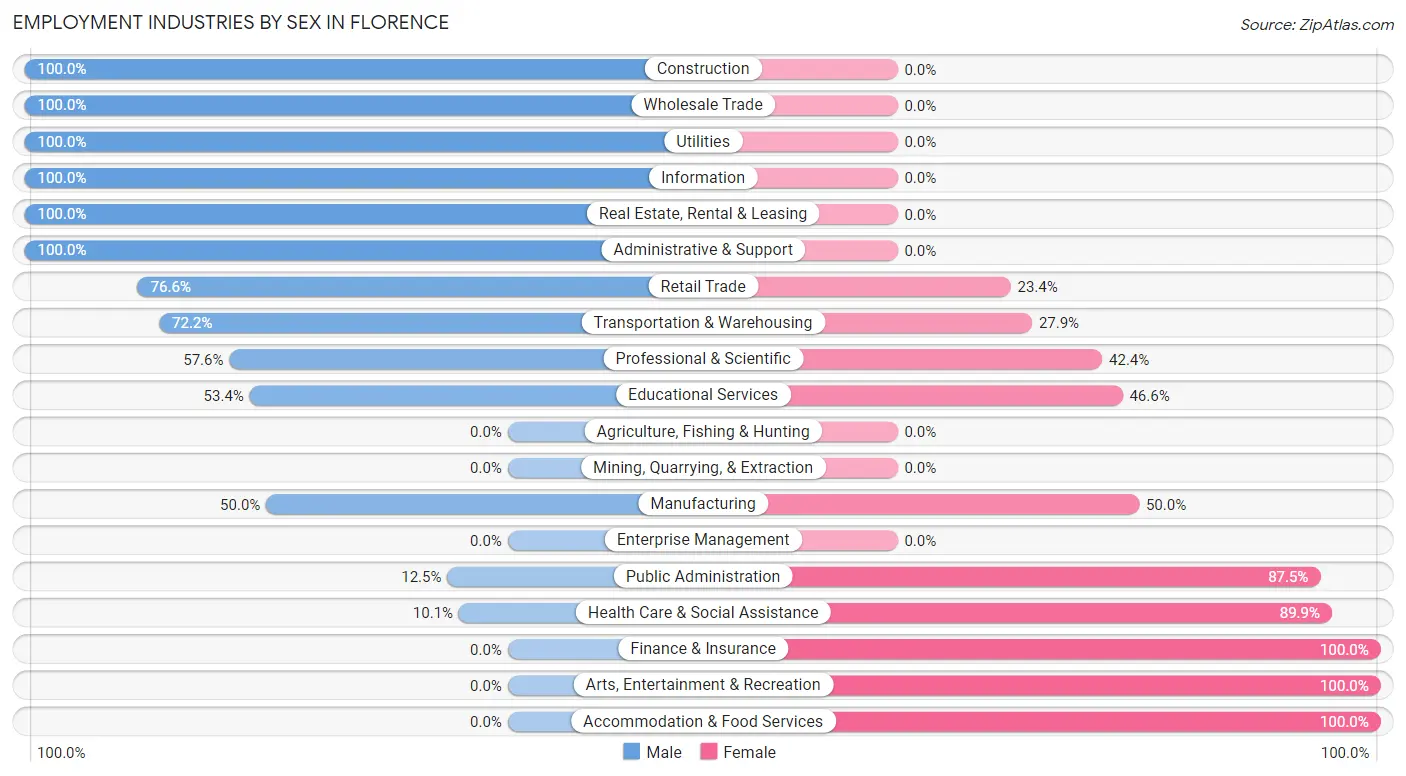
| Industry | Male | Female |
| Agriculture, Fishing & Hunting | 0 (0.0%) | 0 (0.0%) |
| Mining, Quarrying, & Extraction | 0 (0.0%) | 0 (0.0%) |
| Construction | 146 (100.0%) | 0 (0.0%) |
| Manufacturing | 16 (50.0%) | 16 (50.0%) |
| Wholesale Trade | 152 (100.0%) | 0 (0.0%) |
| Retail Trade | 229 (76.6%) | 70 (23.4%) |
| Transportation & Warehousing | 228 (72.2%) | 88 (27.9%) |
| Utilities | 8 (100.0%) | 0 (0.0%) |
| Information | 18 (100.0%) | 0 (0.0%) |
| Finance & Insurance | 0 (0.0%) | 334 (100.0%) |
| Real Estate, Rental & Leasing | 53 (100.0%) | 0 (0.0%) |
| Professional & Scientific | 34 (57.6%) | 25 (42.4%) |
| Enterprise Management | 0 (0.0%) | 0 (0.0%) |
| Administrative & Support | 58 (100.0%) | 0 (0.0%) |
| Educational Services | 78 (53.4%) | 68 (46.6%) |
| Health Care & Social Assistance | 42 (10.1%) | 374 (89.9%) |
| Arts, Entertainment & Recreation | 0 (0.0%) | 16 (100.0%) |
| Accommodation & Food Services | 0 (0.0%) | 206 (100.0%) |
| Public Administration | 5 (12.5%) | 35 (87.5%) |
| Total | 1,121 (46.4%) | 1,294 (53.6%) |
Education in Florence
School Enrollment in Florence
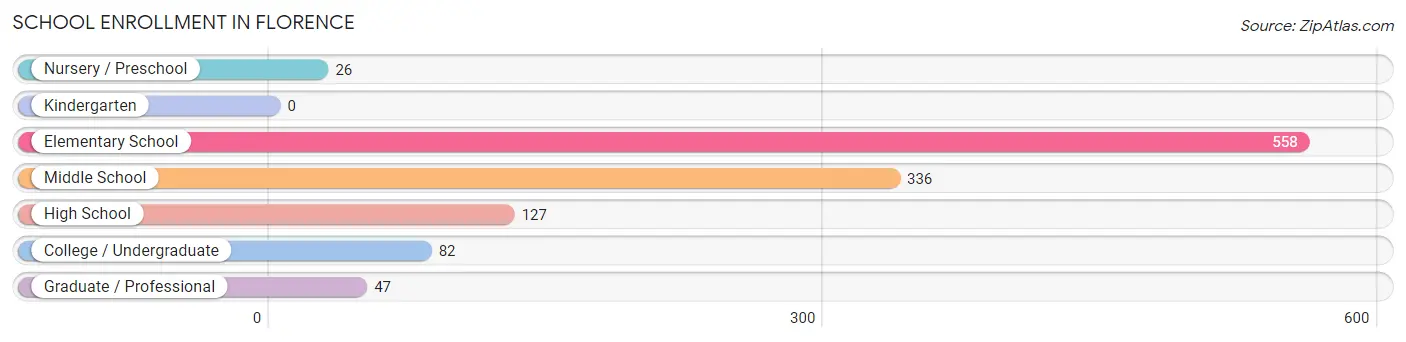
The most common levels of schooling among the 1,176 students in Florence are elementary school (558 | 47.4%), middle school (336 | 28.6%), and high school (127 | 10.8%).
| School Level | # Students | % Students |
| Nursery / Preschool | 26 | 2.2% |
| Kindergarten | 0 | 0.0% |
| Elementary School | 558 | 47.4% |
| Middle School | 336 | 28.6% |
| High School | 127 | 10.8% |
| College / Undergraduate | 82 | 7.0% |
| Graduate / Professional | 47 | 4.0% |
| Total | 1,176 | 100.0% |
School Enrollment by Age by Funding Source in Florence
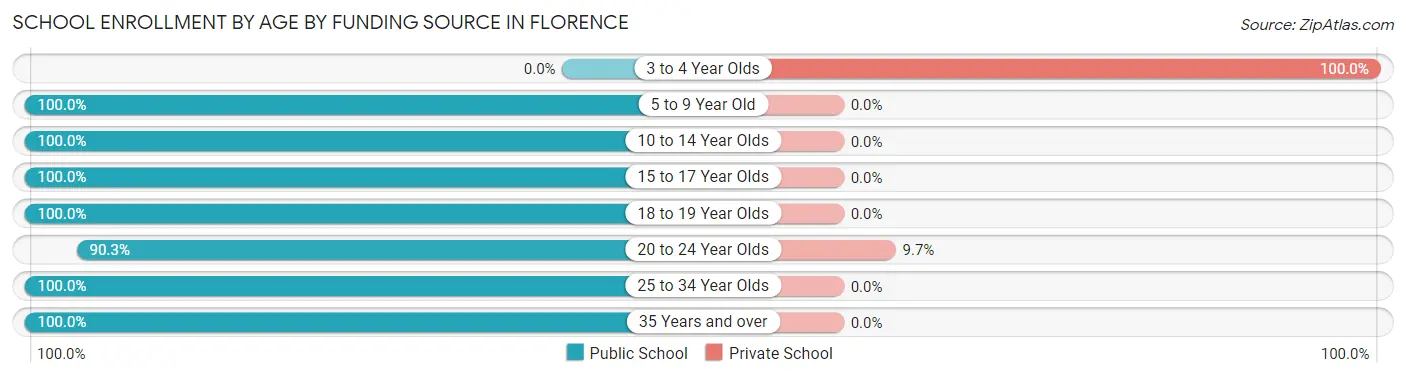
Out of a total of 1,176 students who are enrolled in schools in Florence, 11 (0.9%) attend a private institution, while the remaining 1,165 (99.1%) are enrolled in public schools. The age group of 3 to 4 year olds has the highest likelihood of being enrolled in private schools, with 7 (100.0% in the age bracket) enrolled. Conversely, the age group of 5 to 9 year old has the lowest likelihood of being enrolled in a private school, with 378 (100.0% in the age bracket) attending a public institution.
| Age Bracket | Public School | Private School |
| 3 to 4 Year Olds | 0 (0.0%) | 7 (100.0%) |
| 5 to 9 Year Old | 378 (100.0%) | 0 (0.0%) |
| 10 to 14 Year Olds | 535 (100.0%) | 0 (0.0%) |
| 15 to 17 Year Olds | 127 (100.0%) | 0 (0.0%) |
| 18 to 19 Year Olds | 41 (100.0%) | 0 (0.0%) |
| 20 to 24 Year Olds | 28 (90.3%) | 3 (9.7%) |
| 25 to 34 Year Olds | 13 (100.0%) | 0 (0.0%) |
| 35 Years and over | 44 (100.0%) | 0 (0.0%) |
| Total | 1,165 (99.1%) | 11 (0.9%) |
Educational Attainment by Field of Study in Florence
Science & technology (237 | 30.2%), business (222 | 28.3%), education (88 | 11.2%), engineering (63 | 8.0%), and psychology (44 | 5.6%) are the most common fields of study among 785 individuals in Florence who have obtained a bachelor's degree or higher.
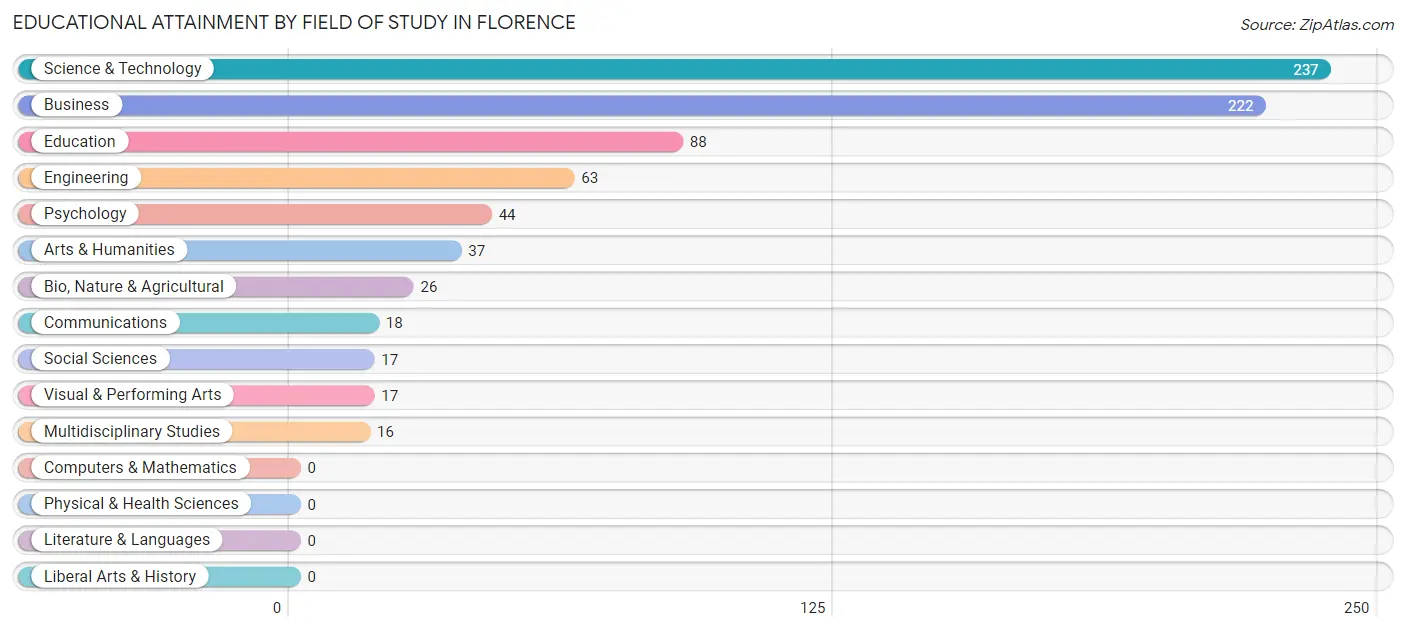
| Field of Study | # Graduates | % Graduates |
| Computers & Mathematics | 0 | 0.0% |
| Bio, Nature & Agricultural | 26 | 3.3% |
| Physical & Health Sciences | 0 | 0.0% |
| Psychology | 44 | 5.6% |
| Social Sciences | 17 | 2.2% |
| Engineering | 63 | 8.0% |
| Multidisciplinary Studies | 16 | 2.0% |
| Science & Technology | 237 | 30.2% |
| Business | 222 | 28.3% |
| Education | 88 | 11.2% |
| Literature & Languages | 0 | 0.0% |
| Liberal Arts & History | 0 | 0.0% |
| Visual & Performing Arts | 17 | 2.2% |
| Communications | 18 | 2.3% |
| Arts & Humanities | 37 | 4.7% |
| Total | 785 | 100.0% |
Transportation & Commute in Florence
Vehicle Availability by Sex in Florence
The most prevalent vehicle ownership categories in Florence are males with 2 vehicles (475, accounting for 42.4%) and females with 2 vehicles (477, making up 37.3%).
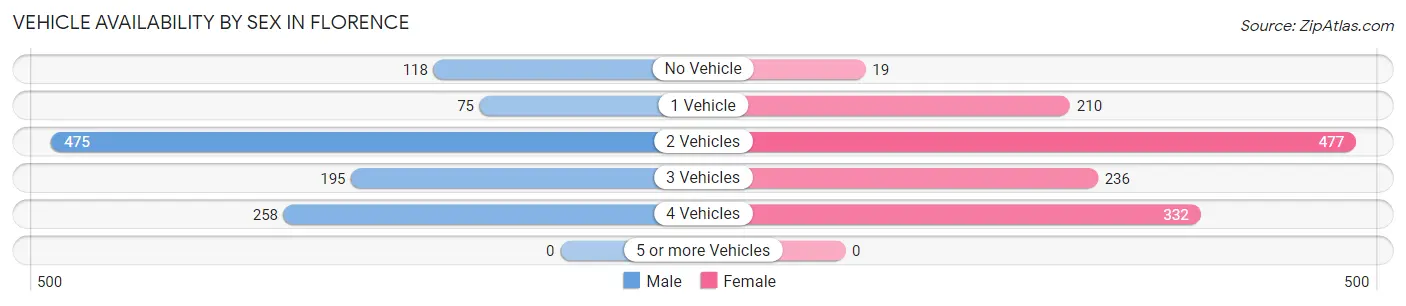
| Vehicles Available | Male | Female |
| No Vehicle | 118 (10.5%) | 19 (1.5%) |
| 1 Vehicle | 75 (6.7%) | 210 (16.5%) |
| 2 Vehicles | 475 (42.4%) | 477 (37.4%) |
| 3 Vehicles | 195 (17.4%) | 236 (18.5%) |
| 4 Vehicles | 258 (23.0%) | 332 (26.1%) |
| 5 or more Vehicles | 0 (0.0%) | 0 (0.0%) |
| Total | 1,121 (100.0%) | 1,274 (100.0%) |
Commute Time in Florence
The most frequently occuring commute durations in Florence are 30 to 34 minutes (826 commuters, 36.4%), 40 to 44 minutes (404 commuters, 17.8%), and 20 to 24 minutes (287 commuters, 12.7%).
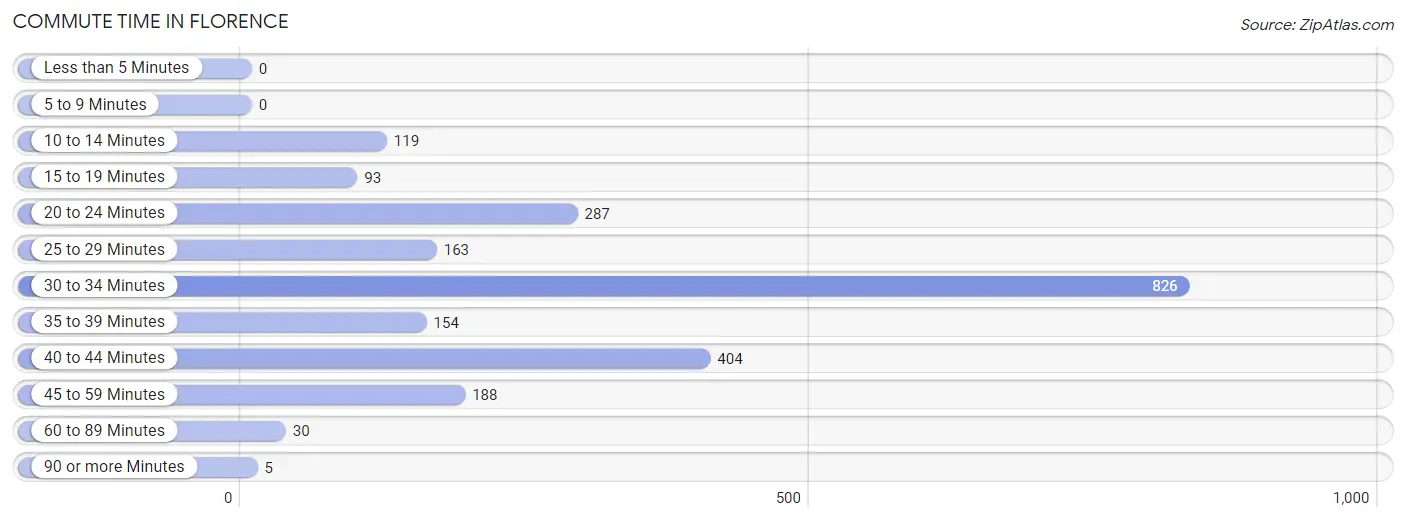
| Commute Time | # Commuters | % Commuters |
| Less than 5 Minutes | 0 | 0.0% |
| 5 to 9 Minutes | 0 | 0.0% |
| 10 to 14 Minutes | 119 | 5.2% |
| 15 to 19 Minutes | 93 | 4.1% |
| 20 to 24 Minutes | 287 | 12.7% |
| 25 to 29 Minutes | 163 | 7.2% |
| 30 to 34 Minutes | 826 | 36.4% |
| 35 to 39 Minutes | 154 | 6.8% |
| 40 to 44 Minutes | 404 | 17.8% |
| 45 to 59 Minutes | 188 | 8.3% |
| 60 to 89 Minutes | 30 | 1.3% |
| 90 or more Minutes | 5 | 0.2% |
Commute Time by Sex in Florence
The most common commute times in Florence are 30 to 34 minutes (512 commuters, 45.7%) for males and 30 to 34 minutes (314 commuters, 27.4%) for females.
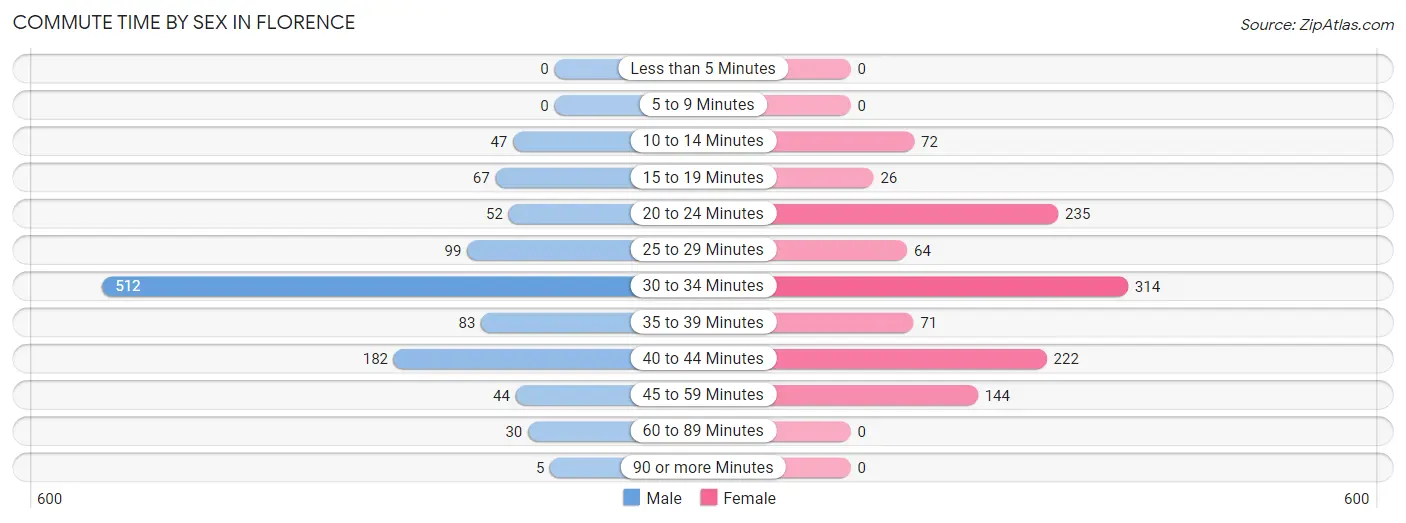
| Commute Time | Male | Female |
| Less than 5 Minutes | 0 (0.0%) | 0 (0.0%) |
| 5 to 9 Minutes | 0 (0.0%) | 0 (0.0%) |
| 10 to 14 Minutes | 47 (4.2%) | 72 (6.3%) |
| 15 to 19 Minutes | 67 (6.0%) | 26 (2.3%) |
| 20 to 24 Minutes | 52 (4.6%) | 235 (20.5%) |
| 25 to 29 Minutes | 99 (8.8%) | 64 (5.6%) |
| 30 to 34 Minutes | 512 (45.7%) | 314 (27.4%) |
| 35 to 39 Minutes | 83 (7.4%) | 71 (6.2%) |
| 40 to 44 Minutes | 182 (16.2%) | 222 (19.3%) |
| 45 to 59 Minutes | 44 (3.9%) | 144 (12.5%) |
| 60 to 89 Minutes | 30 (2.7%) | 0 (0.0%) |
| 90 or more Minutes | 5 (0.4%) | 0 (0.0%) |
Time of Departure to Work by Sex in Florence
The most frequent times of departure to work in Florence are 6:00 AM to 6:29 AM (318, 28.4%) for males and 7:00 AM to 7:29 AM (383, 33.4%) for females.
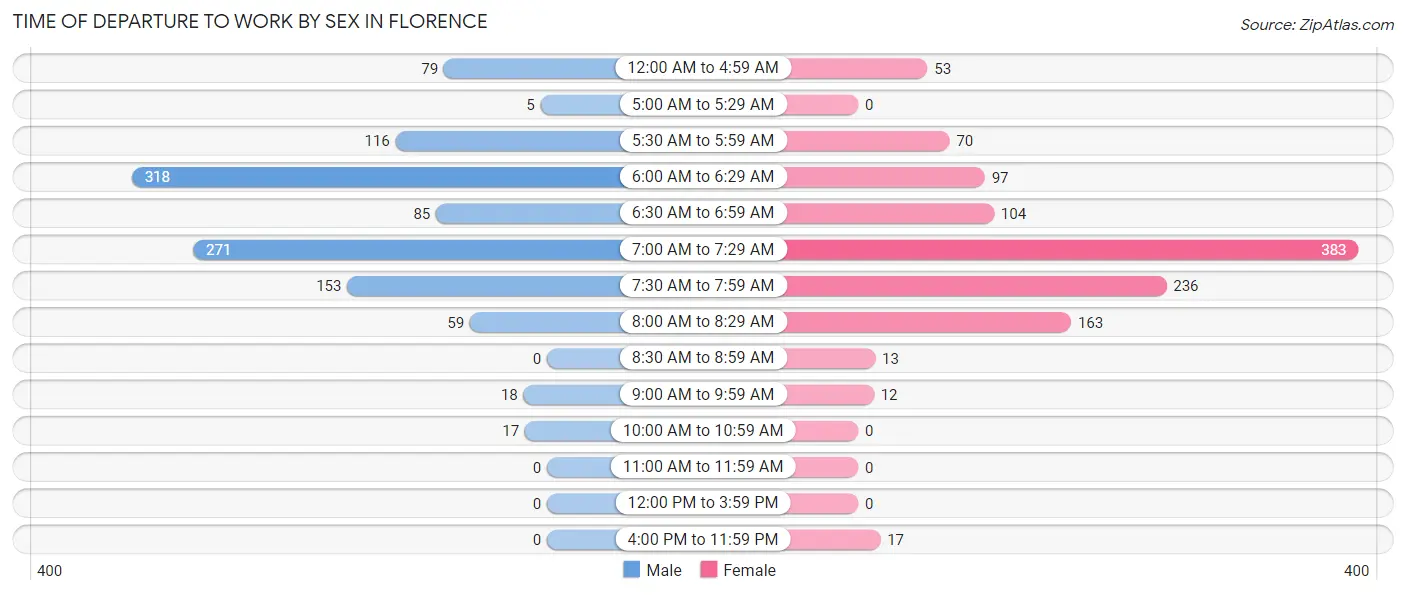
| Time of Departure | Male | Female |
| 12:00 AM to 4:59 AM | 79 (7.0%) | 53 (4.6%) |
| 5:00 AM to 5:29 AM | 5 (0.4%) | 0 (0.0%) |
| 5:30 AM to 5:59 AM | 116 (10.3%) | 70 (6.1%) |
| 6:00 AM to 6:29 AM | 318 (28.4%) | 97 (8.5%) |
| 6:30 AM to 6:59 AM | 85 (7.6%) | 104 (9.1%) |
| 7:00 AM to 7:29 AM | 271 (24.2%) | 383 (33.4%) |
| 7:30 AM to 7:59 AM | 153 (13.7%) | 236 (20.6%) |
| 8:00 AM to 8:29 AM | 59 (5.3%) | 163 (14.2%) |
| 8:30 AM to 8:59 AM | 0 (0.0%) | 13 (1.1%) |
| 9:00 AM to 9:59 AM | 18 (1.6%) | 12 (1.1%) |
| 10:00 AM to 10:59 AM | 17 (1.5%) | 0 (0.0%) |
| 11:00 AM to 11:59 AM | 0 (0.0%) | 0 (0.0%) |
| 12:00 PM to 3:59 PM | 0 (0.0%) | 0 (0.0%) |
| 4:00 PM to 11:59 PM | 0 (0.0%) | 17 (1.5%) |
| Total | 1,121 (100.0%) | 1,148 (100.0%) |
Housing Occupancy in Florence
Occupancy by Ownership in Florence
Of the total 1,780 dwellings in Florence, owner-occupied units account for 1,189 (66.8%), while renter-occupied units make up 591 (33.2%).
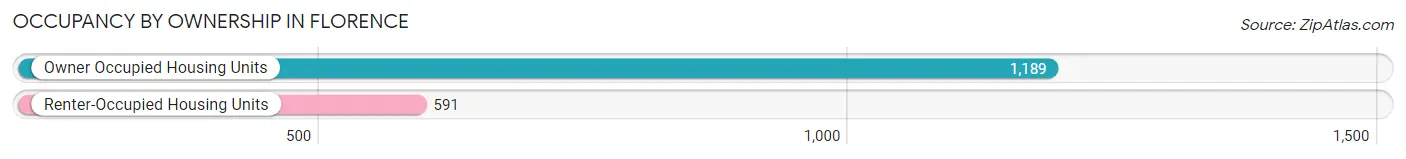
| Occupancy | # Housing Units | % Housing Units |
| Owner Occupied Housing Units | 1,189 | 66.8% |
| Renter-Occupied Housing Units | 591 | 33.2% |
| Total Occupied Housing Units | 1,780 | 100.0% |
Occupancy by Household Size in Florence
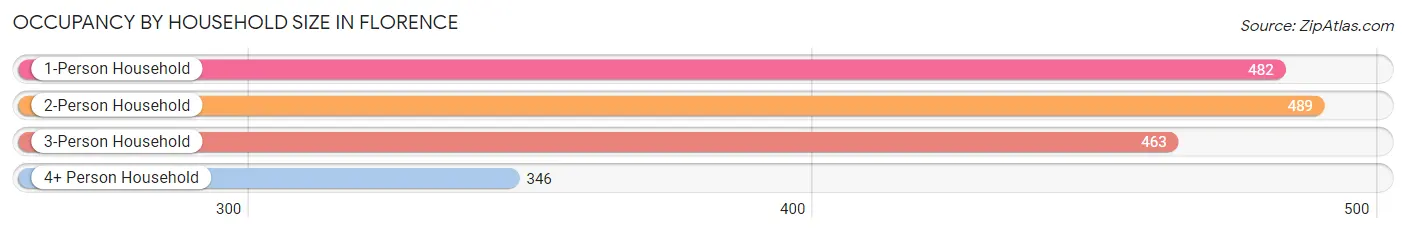
| Household Size | # Housing Units | % Housing Units |
| 1-Person Household | 482 | 27.1% |
| 2-Person Household | 489 | 27.5% |
| 3-Person Household | 463 | 26.0% |
| 4+ Person Household | 346 | 19.4% |
| Total Housing Units | 1,780 | 100.0% |
Occupancy by Ownership by Household Size in Florence
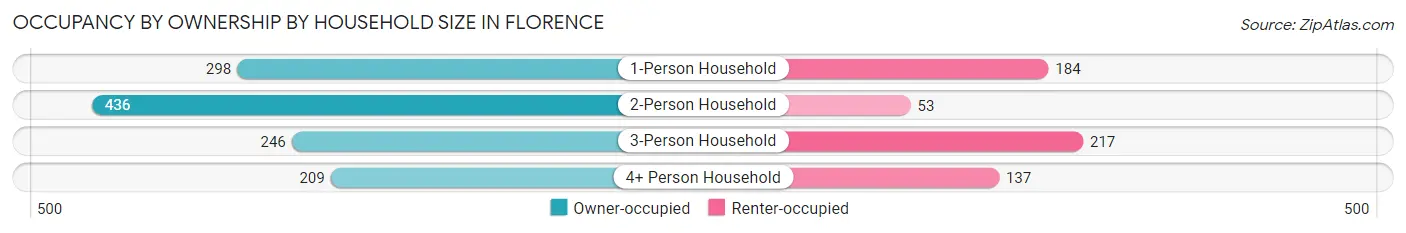
| Household Size | Owner-occupied | Renter-occupied |
| 1-Person Household | 298 (61.8%) | 184 (38.2%) |
| 2-Person Household | 436 (89.2%) | 53 (10.8%) |
| 3-Person Household | 246 (53.1%) | 217 (46.9%) |
| 4+ Person Household | 209 (60.4%) | 137 (39.6%) |
| Total Housing Units | 1,189 (66.8%) | 591 (33.2%) |
Occupancy by Educational Attainment in Florence
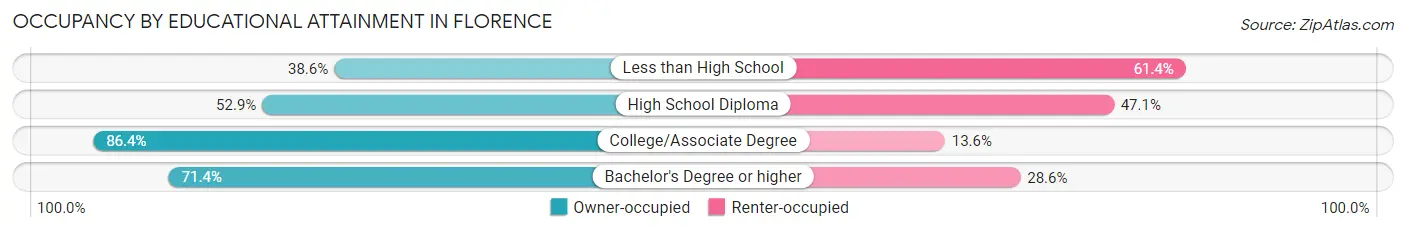
| Household Size | Owner-occupied | Renter-occupied |
| Less than High School | 17 (38.6%) | 27 (61.4%) |
| High School Diploma | 392 (52.9%) | 349 (47.1%) |
| College/Associate Degree | 400 (86.4%) | 63 (13.6%) |
| Bachelor's Degree or higher | 380 (71.4%) | 152 (28.6%) |
Occupancy by Age of Householder in Florence
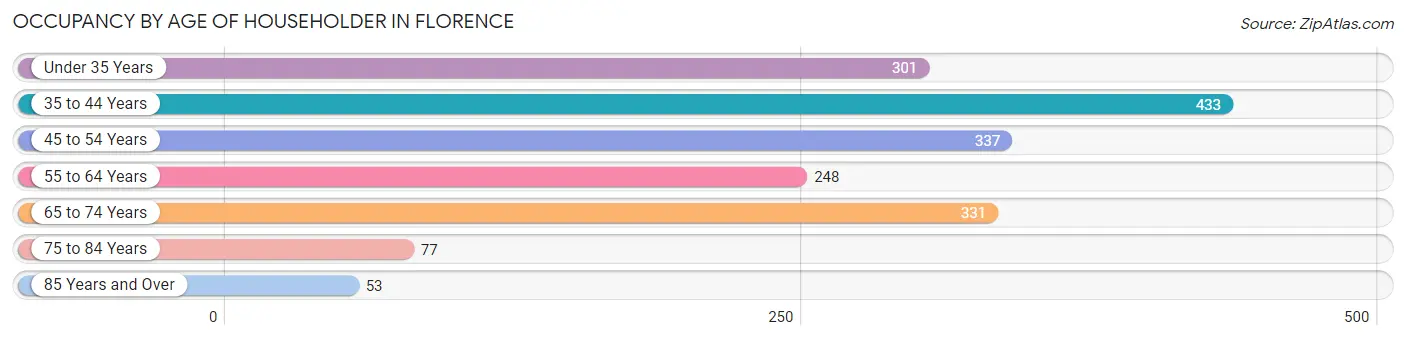
| Age Bracket | # Households | % Households |
| Under 35 Years | 301 | 16.9% |
| 35 to 44 Years | 433 | 24.3% |
| 45 to 54 Years | 337 | 18.9% |
| 55 to 64 Years | 248 | 13.9% |
| 65 to 74 Years | 331 | 18.6% |
| 75 to 84 Years | 77 | 4.3% |
| 85 Years and Over | 53 | 3.0% |
| Total | 1,780 | 100.0% |
Housing Finances in Florence
Median Income by Occupancy in Florence
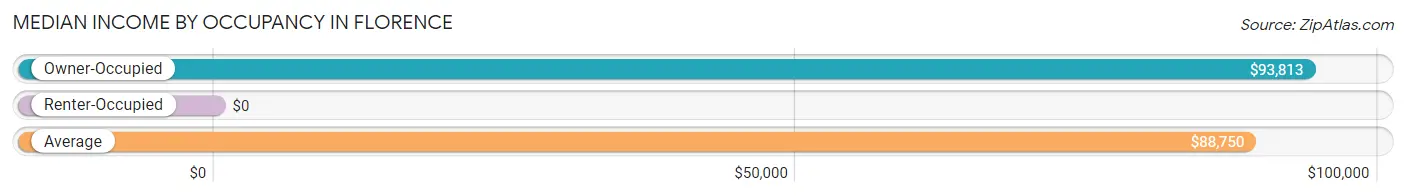
| Occupancy Type | # Households | Median Income |
| Owner-Occupied | 1,189 (66.8%) | $93,813 |
| Renter-Occupied | 591 (33.2%) | $0 |
| Average | 1,780 (100.0%) | $88,750 |
Occupancy by Householder Income Bracket in Florence
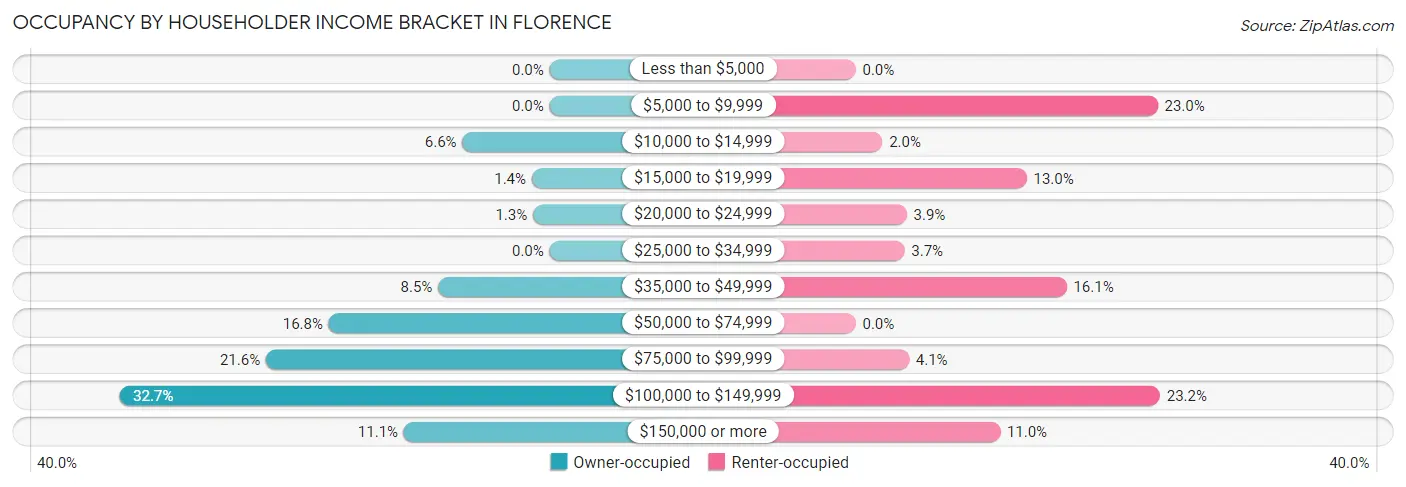
| Income Bracket | Owner-occupied | Renter-occupied |
| Less than $5,000 | 0 (0.0%) | 0 (0.0%) |
| $5,000 to $9,999 | 0 (0.0%) | 136 (23.0%) |
| $10,000 to $14,999 | 79 (6.6%) | 12 (2.0%) |
| $15,000 to $19,999 | 16 (1.3%) | 77 (13.0%) |
| $20,000 to $24,999 | 15 (1.3%) | 23 (3.9%) |
| $25,000 to $34,999 | 0 (0.0%) | 22 (3.7%) |
| $35,000 to $49,999 | 101 (8.5%) | 95 (16.1%) |
| $50,000 to $74,999 | 200 (16.8%) | 0 (0.0%) |
| $75,000 to $99,999 | 257 (21.6%) | 24 (4.1%) |
| $100,000 to $149,999 | 389 (32.7%) | 137 (23.2%) |
| $150,000 or more | 132 (11.1%) | 65 (11.0%) |
| Total | 1,189 (100.0%) | 591 (100.0%) |
Monthly Housing Cost Tiers in Florence
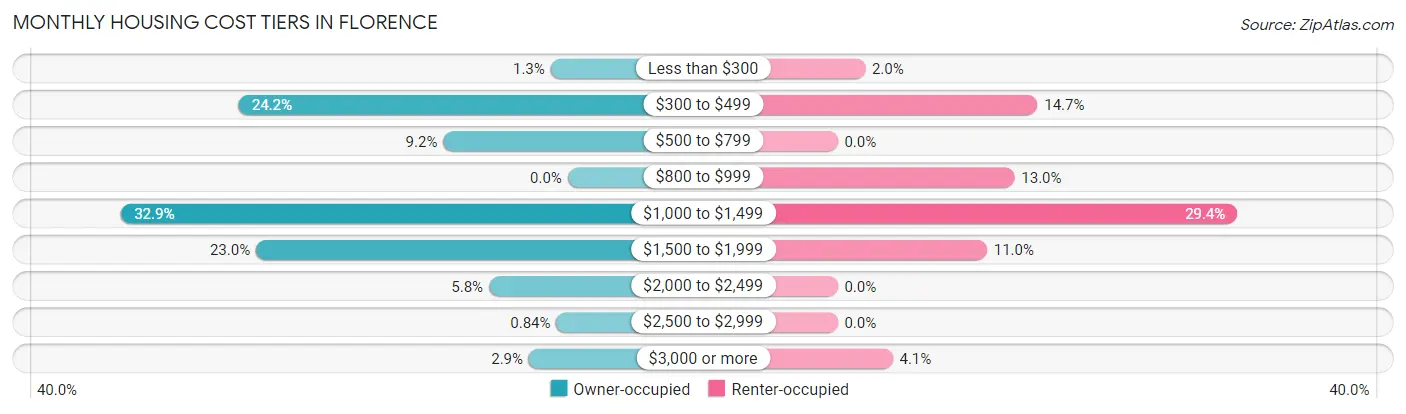
| Monthly Cost | Owner-occupied | Renter-occupied |
| Less than $300 | 15 (1.3%) | 12 (2.0%) |
| $300 to $499 | 288 (24.2%) | 87 (14.7%) |
| $500 to $799 | 109 (9.2%) | 0 (0.0%) |
| $800 to $999 | 0 (0.0%) | 77 (13.0%) |
| $1,000 to $1,499 | 391 (32.9%) | 174 (29.4%) |
| $1,500 to $1,999 | 273 (23.0%) | 65 (11.0%) |
| $2,000 to $2,499 | 69 (5.8%) | 0 (0.0%) |
| $2,500 to $2,999 | 10 (0.8%) | 0 (0.0%) |
| $3,000 or more | 34 (2.9%) | 24 (4.1%) |
| Total | 1,189 (100.0%) | 591 (100.0%) |
Physical Housing Characteristics in Florence
Housing Structures in Florence
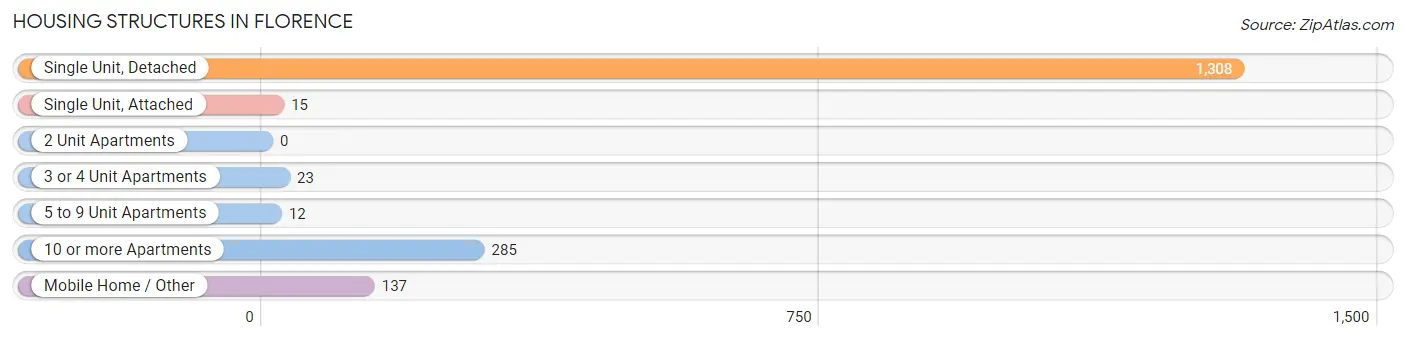
| Structure Type | # Housing Units | % Housing Units |
| Single Unit, Detached | 1,308 | 73.5% |
| Single Unit, Attached | 15 | 0.8% |
| 2 Unit Apartments | 0 | 0.0% |
| 3 or 4 Unit Apartments | 23 | 1.3% |
| 5 to 9 Unit Apartments | 12 | 0.7% |
| 10 or more Apartments | 285 | 16.0% |
| Mobile Home / Other | 137 | 7.7% |
| Total | 1,780 | 100.0% |
Housing Structures by Occupancy in Florence
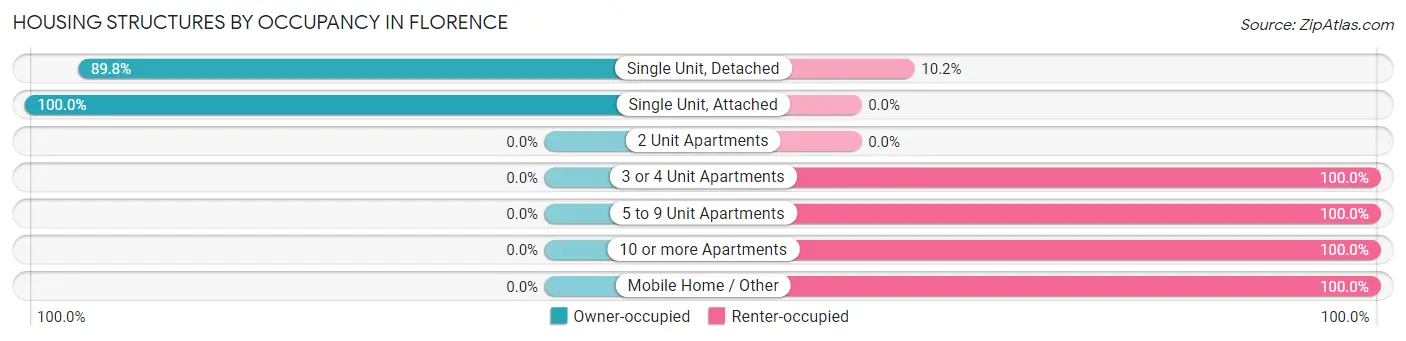
| Structure Type | Owner-occupied | Renter-occupied |
| Single Unit, Detached | 1,174 (89.8%) | 134 (10.2%) |
| Single Unit, Attached | 15 (100.0%) | 0 (0.0%) |
| 2 Unit Apartments | 0 (0.0%) | 0 (0.0%) |
| 3 or 4 Unit Apartments | 0 (0.0%) | 23 (100.0%) |
| 5 to 9 Unit Apartments | 0 (0.0%) | 12 (100.0%) |
| 10 or more Apartments | 0 (0.0%) | 285 (100.0%) |
| Mobile Home / Other | 0 (0.0%) | 137 (100.0%) |
| Total | 1,189 (66.8%) | 591 (33.2%) |
Housing Structures by Number of Rooms in Florence
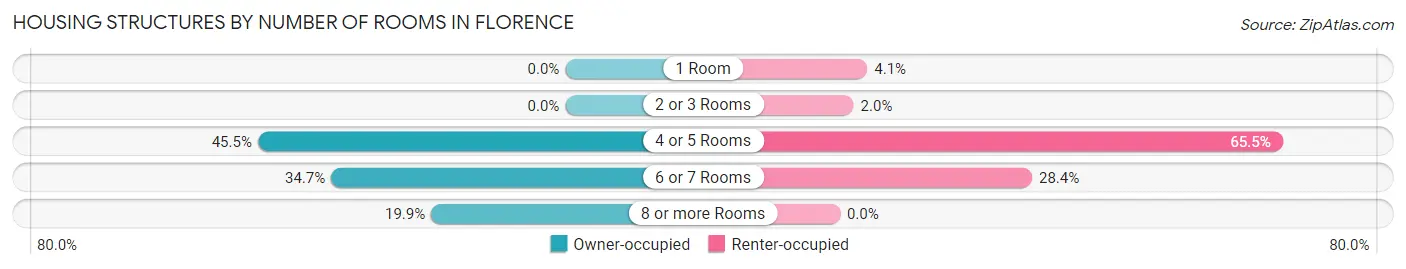
| Number of Rooms | Owner-occupied | Renter-occupied |
| 1 Room | 0 (0.0%) | 24 (4.1%) |
| 2 or 3 Rooms | 0 (0.0%) | 12 (2.0%) |
| 4 or 5 Rooms | 541 (45.5%) | 387 (65.5%) |
| 6 or 7 Rooms | 412 (34.6%) | 168 (28.4%) |
| 8 or more Rooms | 236 (19.9%) | 0 (0.0%) |
| Total | 1,189 (100.0%) | 591 (100.0%) |
Housing Structure by Heating Type in Florence
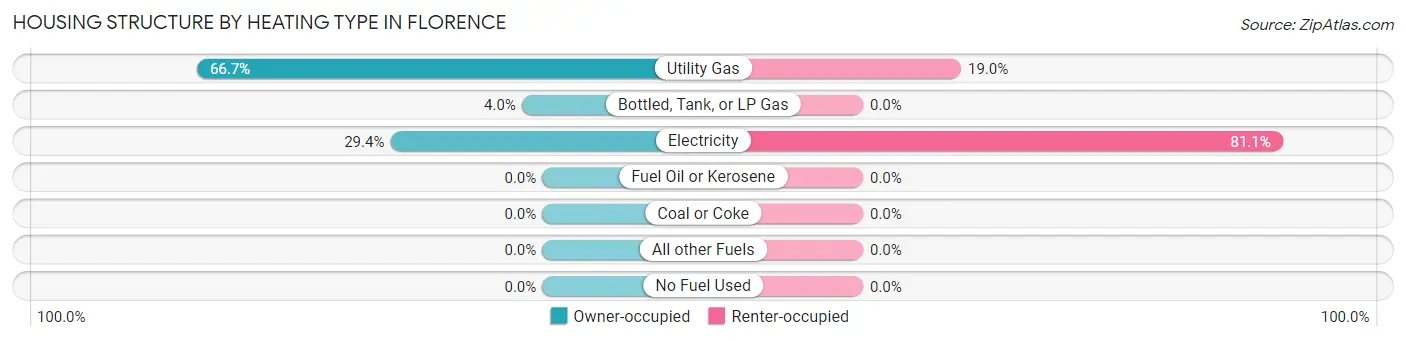
| Heating Type | Owner-occupied | Renter-occupied |
| Utility Gas | 793 (66.7%) | 112 (19.0%) |
| Bottled, Tank, or LP Gas | 47 (4.0%) | 0 (0.0%) |
| Electricity | 349 (29.3%) | 479 (81.0%) |
| Fuel Oil or Kerosene | 0 (0.0%) | 0 (0.0%) |
| Coal or Coke | 0 (0.0%) | 0 (0.0%) |
| All other Fuels | 0 (0.0%) | 0 (0.0%) |
| No Fuel Used | 0 (0.0%) | 0 (0.0%) |
| Total | 1,189 (100.0%) | 591 (100.0%) |
Household Vehicle Usage in Florence
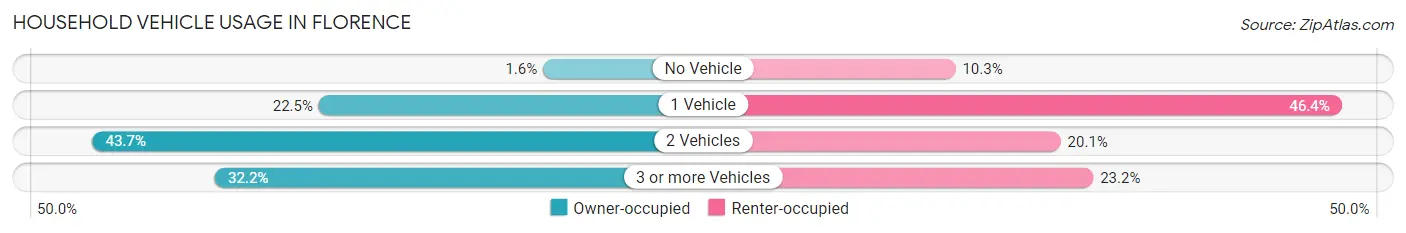
| Vehicles per Household | Owner-occupied | Renter-occupied |
| No Vehicle | 19 (1.6%) | 61 (10.3%) |
| 1 Vehicle | 268 (22.5%) | 274 (46.4%) |
| 2 Vehicles | 519 (43.6%) | 119 (20.1%) |
| 3 or more Vehicles | 383 (32.2%) | 137 (23.2%) |
| Total | 1,189 (100.0%) | 591 (100.0%) |
Real Estate & Mortgages in Florence
Real Estate and Mortgage Overview in Florence
| Characteristic | Without Mortgage | With Mortgage |
| Housing Units | 306 | 883 |
| Median Property Value | $208,100 | $194,200 |
| Median Household Income | $78,750 | $103 |
| Monthly Housing Costs | $416 | $34 |
| Real Estate Taxes | $831 | $32 |
Property Value by Mortgage Status in Florence
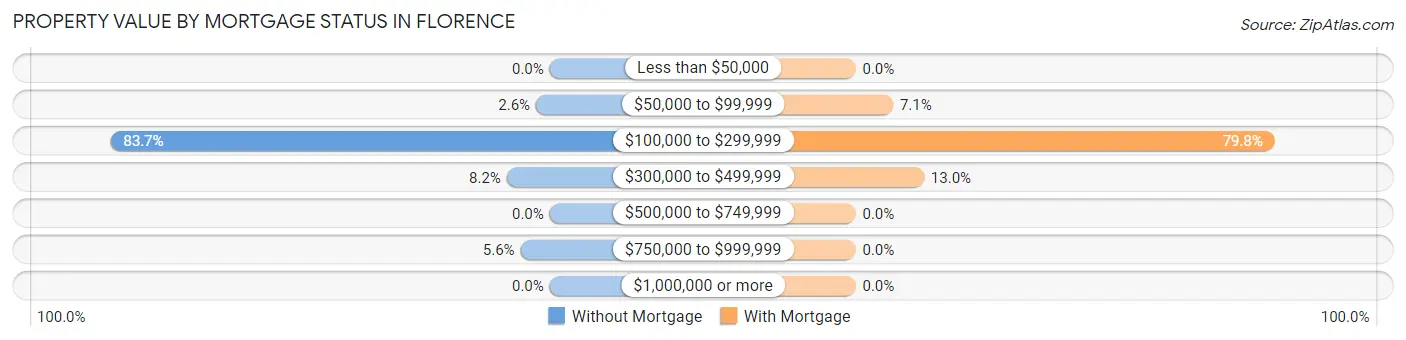
| Property Value | Without Mortgage | With Mortgage |
| Less than $50,000 | 0 (0.0%) | 0 (0.0%) |
| $50,000 to $99,999 | 8 (2.6%) | 63 (7.1%) |
| $100,000 to $299,999 | 256 (83.7%) | 705 (79.8%) |
| $300,000 to $499,999 | 25 (8.2%) | 115 (13.0%) |
| $500,000 to $749,999 | 0 (0.0%) | 0 (0.0%) |
| $750,000 to $999,999 | 17 (5.6%) | 0 (0.0%) |
| $1,000,000 or more | 0 (0.0%) | 0 (0.0%) |
| Total | 306 (100.0%) | 883 (100.0%) |
Household Income by Mortgage Status in Florence
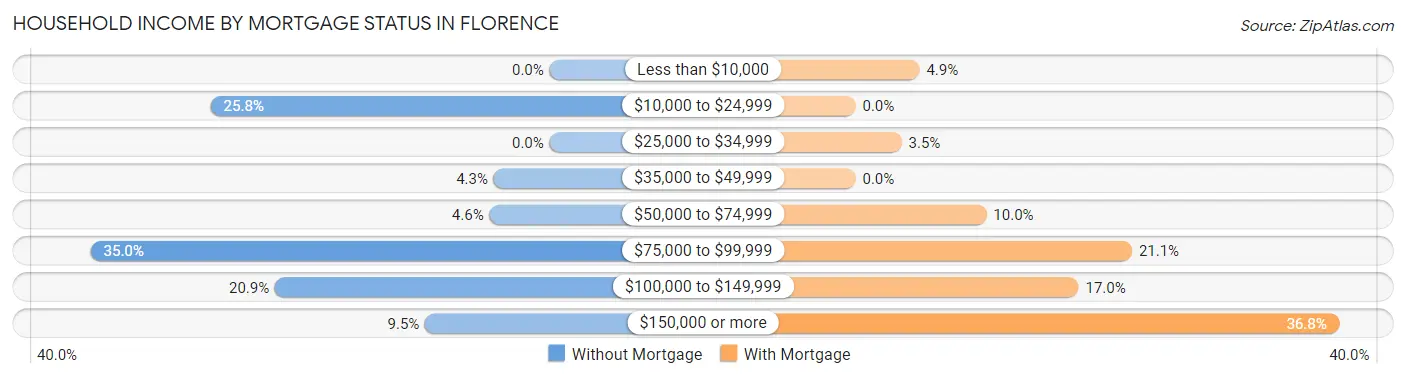
| Household Income | Without Mortgage | With Mortgage |
| Less than $10,000 | 0 (0.0%) | 43 (4.9%) |
| $10,000 to $24,999 | 79 (25.8%) | 0 (0.0%) |
| $25,000 to $34,999 | 0 (0.0%) | 31 (3.5%) |
| $35,000 to $49,999 | 13 (4.3%) | 0 (0.0%) |
| $50,000 to $74,999 | 14 (4.6%) | 88 (10.0%) |
| $75,000 to $99,999 | 107 (35.0%) | 186 (21.1%) |
| $100,000 to $149,999 | 64 (20.9%) | 150 (17.0%) |
| $150,000 or more | 29 (9.5%) | 325 (36.8%) |
| Total | 306 (100.0%) | 883 (100.0%) |
Property Value to Household Income Ratio in Florence
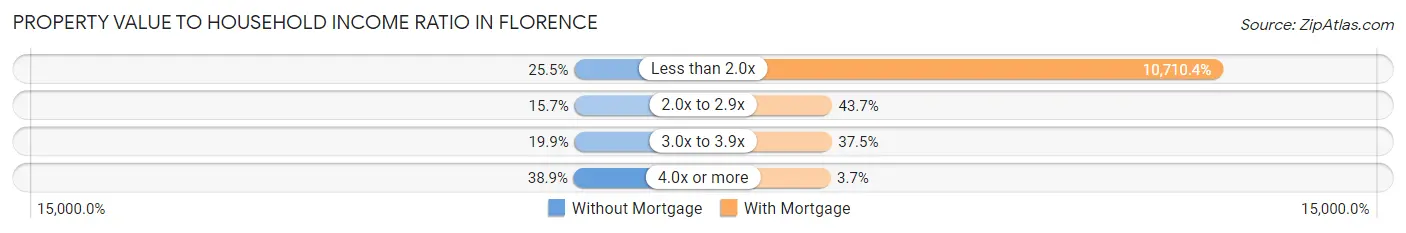
| Value-to-Income Ratio | Without Mortgage | With Mortgage |
| Less than 2.0x | 78 (25.5%) | 94,573 (10,710.4%) |
| 2.0x to 2.9x | 48 (15.7%) | 386 (43.7%) |
| 3.0x to 3.9x | 61 (19.9%) | 331 (37.5%) |
| 4.0x or more | 119 (38.9%) | 33 (3.7%) |
| Total | 306 (100.0%) | 883 (100.0%) |
Real Estate Taxes by Mortgage Status in Florence
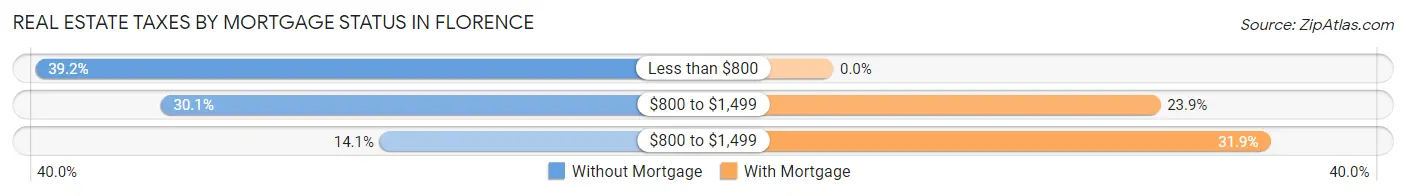
| Property Taxes | Without Mortgage | With Mortgage |
| Less than $800 | 120 (39.2%) | 0 (0.0%) |
| $800 to $1,499 | 92 (30.1%) | 211 (23.9%) |
| $800 to $1,499 | 43 (14.1%) | 282 (31.9%) |
| Total | 306 (100.0%) | 883 (100.0%) |
Health & Disability in Florence
Health Insurance Coverage by Age in Florence
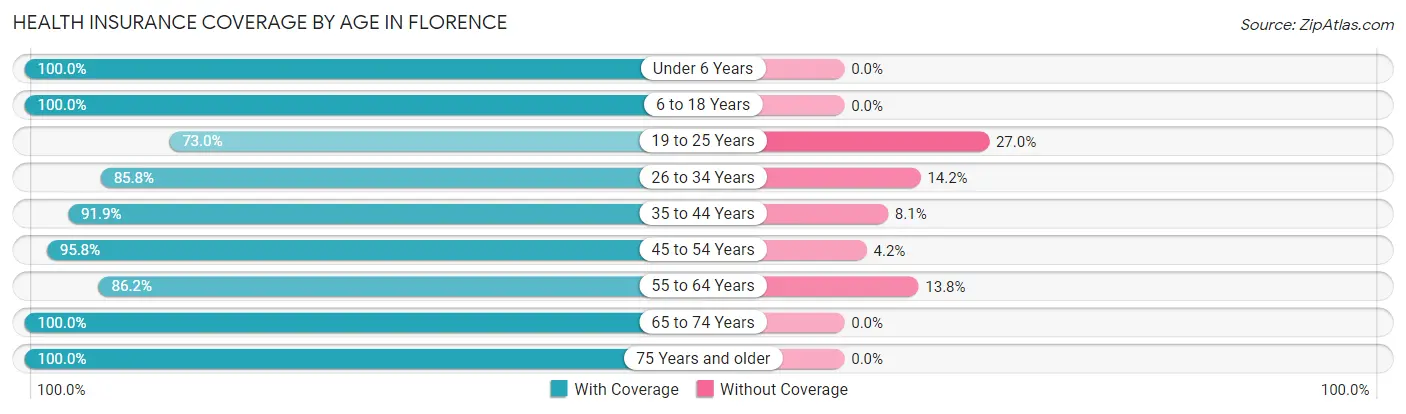
| Age Bracket | With Coverage | Without Coverage |
| Under 6 Years | 247 (100.0%) | 0 (0.0%) |
| 6 to 18 Years | 1,041 (100.0%) | 0 (0.0%) |
| 19 to 25 Years | 276 (73.0%) | 102 (27.0%) |
| 26 to 34 Years | 423 (85.8%) | 70 (14.2%) |
| 35 to 44 Years | 791 (91.9%) | 70 (8.1%) |
| 45 to 54 Years | 438 (95.8%) | 19 (4.2%) |
| 55 to 64 Years | 387 (86.2%) | 62 (13.8%) |
| 65 to 74 Years | 511 (100.0%) | 0 (0.0%) |
| 75 Years and older | 152 (100.0%) | 0 (0.0%) |
| Total | 4,266 (93.0%) | 323 (7.0%) |
Health Insurance Coverage by Citizenship Status in Florence
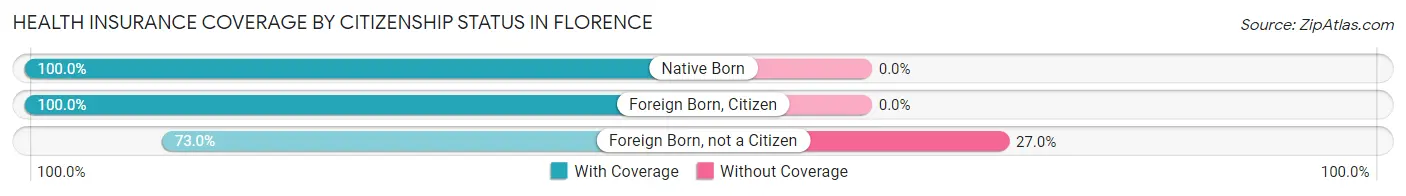
| Citizenship Status | With Coverage | Without Coverage |
| Native Born | 247 (100.0%) | 0 (0.0%) |
| Foreign Born, Citizen | 1,041 (100.0%) | 0 (0.0%) |
| Foreign Born, not a Citizen | 276 (73.0%) | 102 (27.0%) |
Health Insurance Coverage by Household Income in Florence
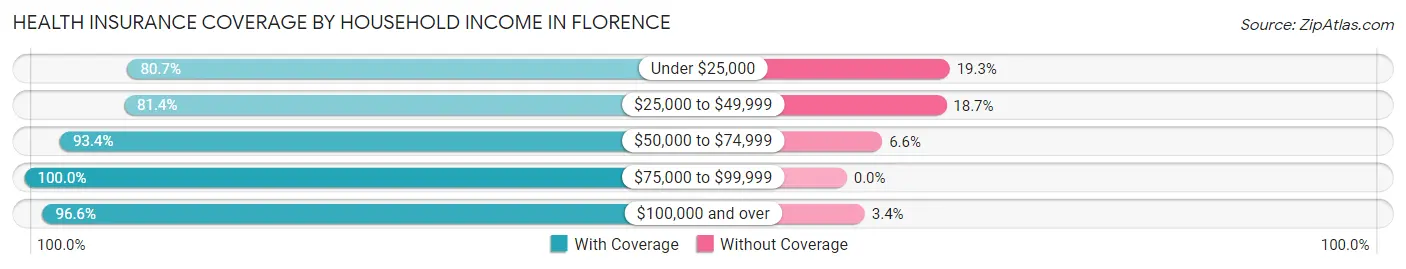
| Household Income | With Coverage | Without Coverage |
| Under $25,000 | 494 (80.7%) | 118 (19.3%) |
| $25,000 to $49,999 | 410 (81.4%) | 94 (18.6%) |
| $50,000 to $74,999 | 436 (93.4%) | 31 (6.6%) |
| $75,000 to $99,999 | 628 (100.0%) | 0 (0.0%) |
| $100,000 and over | 2,287 (96.6%) | 80 (3.4%) |
Public vs Private Health Insurance Coverage by Age in Florence
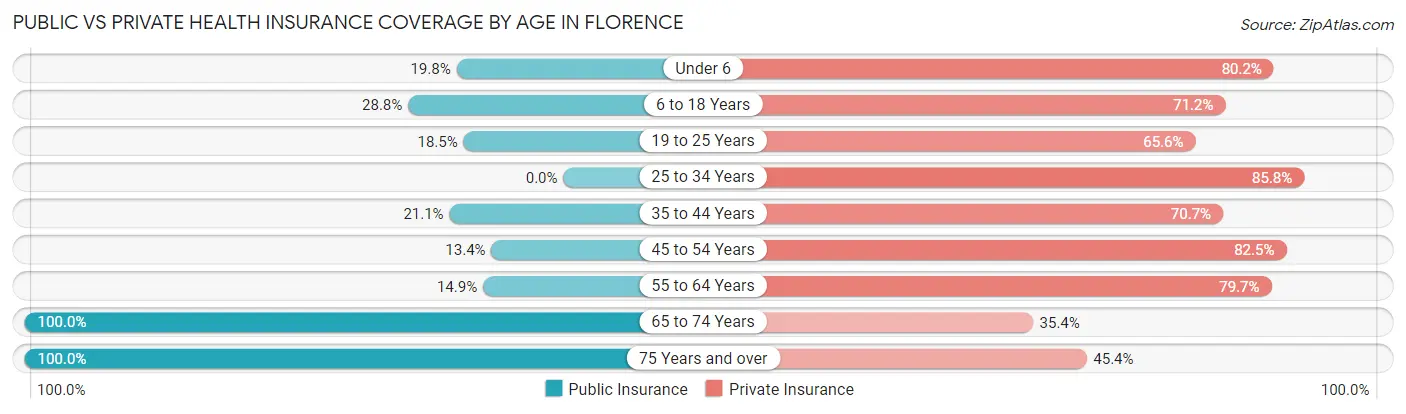
| Age Bracket | Public Insurance | Private Insurance |
| Under 6 | 49 (19.8%) | 198 (80.2%) |
| 6 to 18 Years | 300 (28.8%) | 741 (71.2%) |
| 19 to 25 Years | 70 (18.5%) | 248 (65.6%) |
| 25 to 34 Years | 0 (0.0%) | 423 (85.8%) |
| 35 to 44 Years | 182 (21.1%) | 609 (70.7%) |
| 45 to 54 Years | 61 (13.4%) | 377 (82.5%) |
| 55 to 64 Years | 67 (14.9%) | 358 (79.7%) |
| 65 to 74 Years | 511 (100.0%) | 181 (35.4%) |
| 75 Years and over | 152 (100.0%) | 69 (45.4%) |
| Total | 1,392 (30.3%) | 3,204 (69.8%) |
Disability Status by Sex by Age in Florence
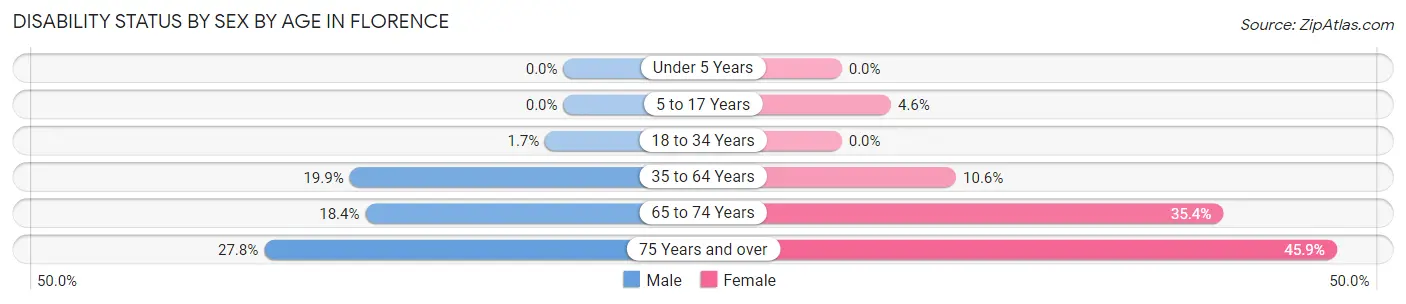
| Age Bracket | Male | Female |
| Under 5 Years | 0 (0.0%) | 0 (0.0%) |
| 5 to 17 Years | 0 (0.0%) | 16 (4.6%) |
| 18 to 34 Years | 8 (1.7%) | 0 (0.0%) |
| 35 to 64 Years | 158 (19.9%) | 103 (10.6%) |
| 65 to 74 Years | 43 (18.4%) | 98 (35.4%) |
| 75 Years and over | 15 (27.8%) | 45 (45.9%) |
Disability Class by Sex by Age in Florence
Disability Class: Hearing Difficulty
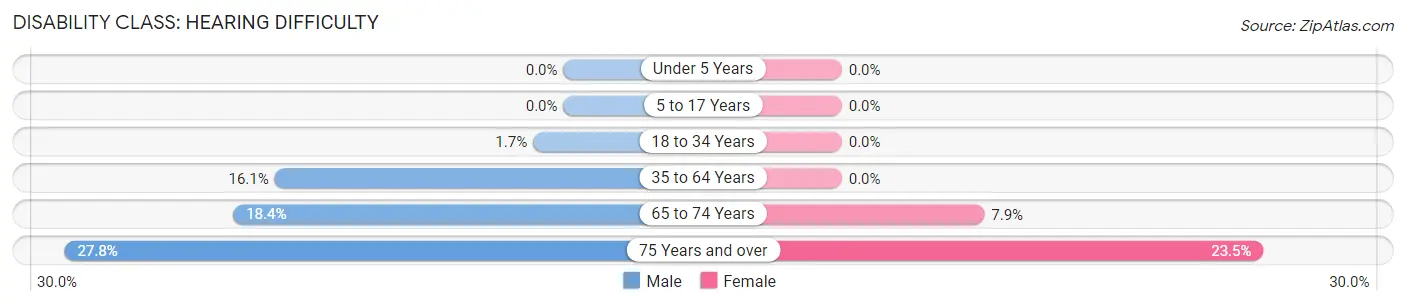
| Age Bracket | Male | Female |
| Under 5 Years | 0 (0.0%) | 0 (0.0%) |
| 5 to 17 Years | 0 (0.0%) | 0 (0.0%) |
| 18 to 34 Years | 8 (1.7%) | 0 (0.0%) |
| 35 to 64 Years | 128 (16.1%) | 0 (0.0%) |
| 65 to 74 Years | 43 (18.4%) | 22 (7.9%) |
| 75 Years and over | 15 (27.8%) | 23 (23.5%) |
Disability Class: Vision Difficulty
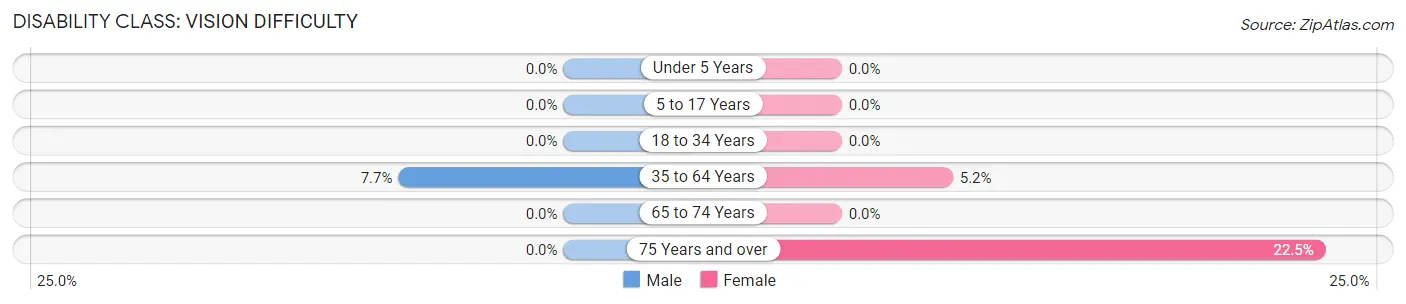
| Age Bracket | Male | Female |
| Under 5 Years | 0 (0.0%) | 0 (0.0%) |
| 5 to 17 Years | 0 (0.0%) | 0 (0.0%) |
| 18 to 34 Years | 0 (0.0%) | 0 (0.0%) |
| 35 to 64 Years | 61 (7.7%) | 50 (5.1%) |
| 65 to 74 Years | 0 (0.0%) | 0 (0.0%) |
| 75 Years and over | 0 (0.0%) | 22 (22.5%) |
Disability Class: Cognitive Difficulty
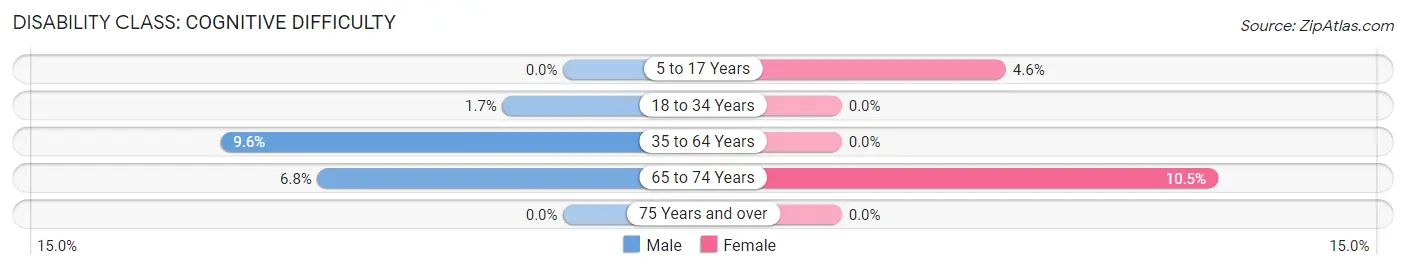
| Age Bracket | Male | Female |
| 5 to 17 Years | 0 (0.0%) | 16 (4.6%) |
| 18 to 34 Years | 8 (1.7%) | 0 (0.0%) |
| 35 to 64 Years | 76 (9.6%) | 0 (0.0%) |
| 65 to 74 Years | 16 (6.8%) | 29 (10.5%) |
| 75 Years and over | 0 (0.0%) | 0 (0.0%) |
Disability Class: Ambulatory Difficulty
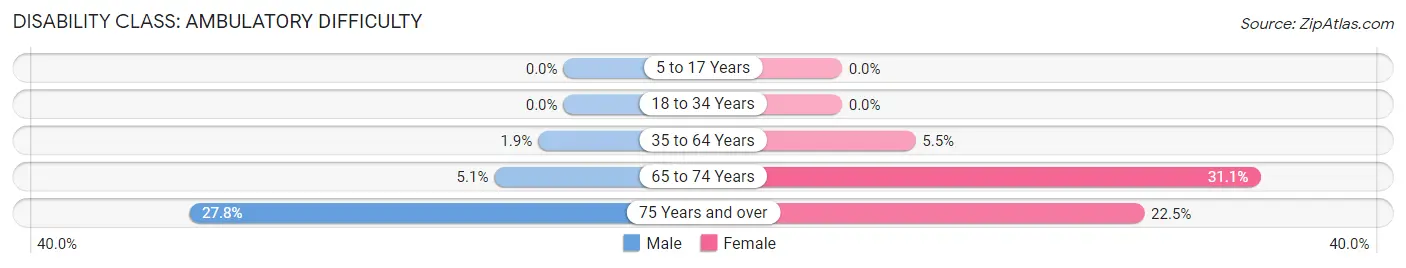
| Age Bracket | Male | Female |
| 5 to 17 Years | 0 (0.0%) | 0 (0.0%) |
| 18 to 34 Years | 0 (0.0%) | 0 (0.0%) |
| 35 to 64 Years | 15 (1.9%) | 53 (5.5%) |
| 65 to 74 Years | 12 (5.1%) | 86 (31.0%) |
| 75 Years and over | 15 (27.8%) | 22 (22.5%) |
Disability Class: Self-Care Difficulty
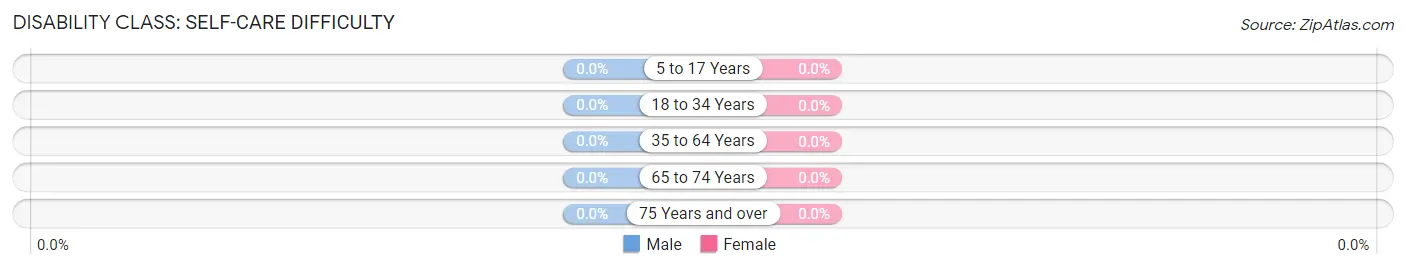
| Age Bracket | Male | Female |
| 5 to 17 Years | 0 (0.0%) | 0 (0.0%) |
| 18 to 34 Years | 0 (0.0%) | 0 (0.0%) |
| 35 to 64 Years | 0 (0.0%) | 0 (0.0%) |
| 65 to 74 Years | 0 (0.0%) | 0 (0.0%) |
| 75 Years and over | 0 (0.0%) | 0 (0.0%) |
Technology Access in Florence
Computing Device Access in Florence
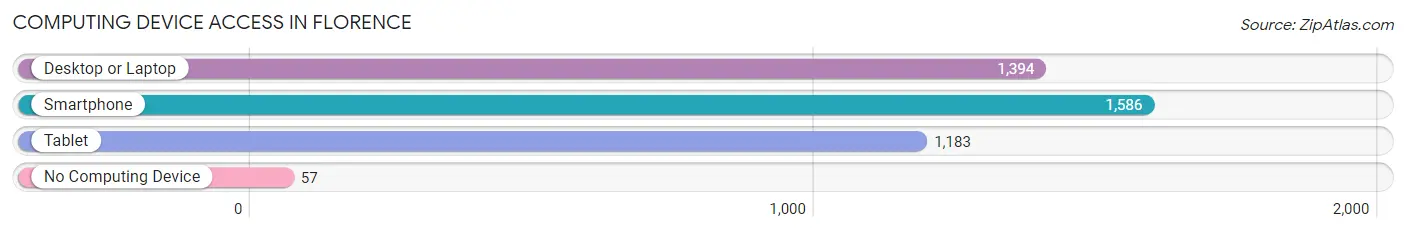
| Device Type | # Households | % Households |
| Desktop or Laptop | 1,394 | 78.3% |
| Smartphone | 1,586 | 89.1% |
| Tablet | 1,183 | 66.5% |
| No Computing Device | 57 | 3.2% |
| Total | 1,780 | 100.0% |
Internet Access in Florence
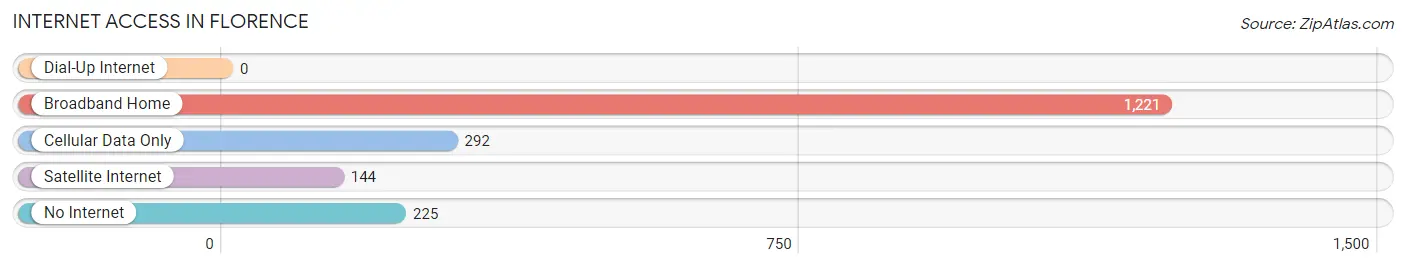
| Internet Type | # Households | % Households |
| Dial-Up Internet | 0 | 0.0% |
| Broadband Home | 1,221 | 68.6% |
| Cellular Data Only | 292 | 16.4% |
| Satellite Internet | 144 | 8.1% |
| No Internet | 225 | 12.6% |
| Total | 1,780 | 100.0% |
Florence Summary
Florence, Mississippi is a small town located in Rankin County, Mississippi. It is situated on the banks of the Pearl River, about 20 miles east of Jackson, the state capital. The town was founded in 1837 and named after Florence, Italy. It is a rural community with a population of approximately 1,500 people.
History
Florence was founded in 1837 by a group of settlers from Florence, Italy. The town was originally known as “Florence Station” and was a stop on the Mississippi Central Railroad. The town was officially incorporated in 1845 and was named after Florence, Italy.
In the late 19th century, Florence was a thriving agricultural community. Cotton was the main crop grown in the area and the town was home to several cotton gins and warehouses. The town also had a sawmill, gristmill, and a brickyard.
In the early 20th century, Florence experienced a period of growth and development. The town was home to several businesses, including a bank, a hotel, a movie theater, and a variety of stores. The town also had a public school and a library.
Geography
Florence is located in Rankin County, Mississippi. It is situated on the banks of the Pearl River, about 20 miles east of Jackson, the state capital. The town is located in a rural area and is surrounded by farmland. The town is located at an elevation of approximately 200 feet above sea level.
The climate in Florence is humid subtropical, with hot, humid summers and mild winters. The average annual temperature is around 70 degrees Fahrenheit. The average annual precipitation is around 50 inches.
Economy
The economy of Florence is largely based on agriculture. The town is home to several farms that grow cotton, corn, soybeans, and other crops. The town also has several businesses, including a bank, a hotel, a movie theater, and a variety of stores.
Demographics
As of the 2010 census, the population of Florence was 1,500. The racial makeup of the town was 79.2% White, 18.2% African American, 0.7% Native American, 0.2% Asian, and 1.7% from other races. The median household income was $30,000 and the median family income was $37,000.
Florence is a small, rural town with a rich history and a strong sense of community. The town is home to a variety of businesses and is surrounded by farmland. The town has a diverse population and a strong economy based on agriculture.
Common Questions
What is Per Capita Income in Florence?
Per Capita income in Florence is $32,524.
What is the Median Family Income in Florence?
Median Family Income in Florence is $94,446.
What is the Median Household income in Florence?
Median Household Income in Florence is $88,750.
What is Income or Wage Gap in Florence?
Income or Wage Gap in Florence is 28.5%.
Women in Florence earn 71.5 cents for every dollar earned by a man.
What is Inequality or Gini Index in Florence?
Inequality or Gini Index in Florence is 0.35.
What is the Total Population of Florence?
Total Population of Florence is 4,596.
What is the Total Male Population of Florence?
Total Male Population of Florence is 2,361.
What is the Total Female Population of Florence?
Total Female Population of Florence is 2,235.
What is the Ratio of Males per 100 Females in Florence?
There are 105.64 Males per 100 Females in Florence.
What is the Ratio of Females per 100 Males in Florence?
There are 94.66 Females per 100 Males in Florence.
What is the Median Population Age in Florence?
Median Population Age in Florence is 37.3 Years.
What is the Average Family Size in Florence
Average Family Size in Florence is 3.0 People.
What is the Average Household Size in Florence
Average Household Size in Florence is 2.6 People.
How Large is the Labor Force in Florence?
There are 2,622 People in the Labor Forcein in Florence.
What is the Percentage of People in the Labor Force in Florence?
75.9% of People are in the Labor Force in Florence.
What is the Unemployment Rate in Florence?
Unemployment Rate in Florence is 7.9%.