Zip Codes with the Highest Percentage of Population Employed in Life, Physical & Social Science in Pascagoula, MS
RELATED REPORTS & OPTIONS
Life, Physical & Social Science
Pascagoula
Compare Zip Codes
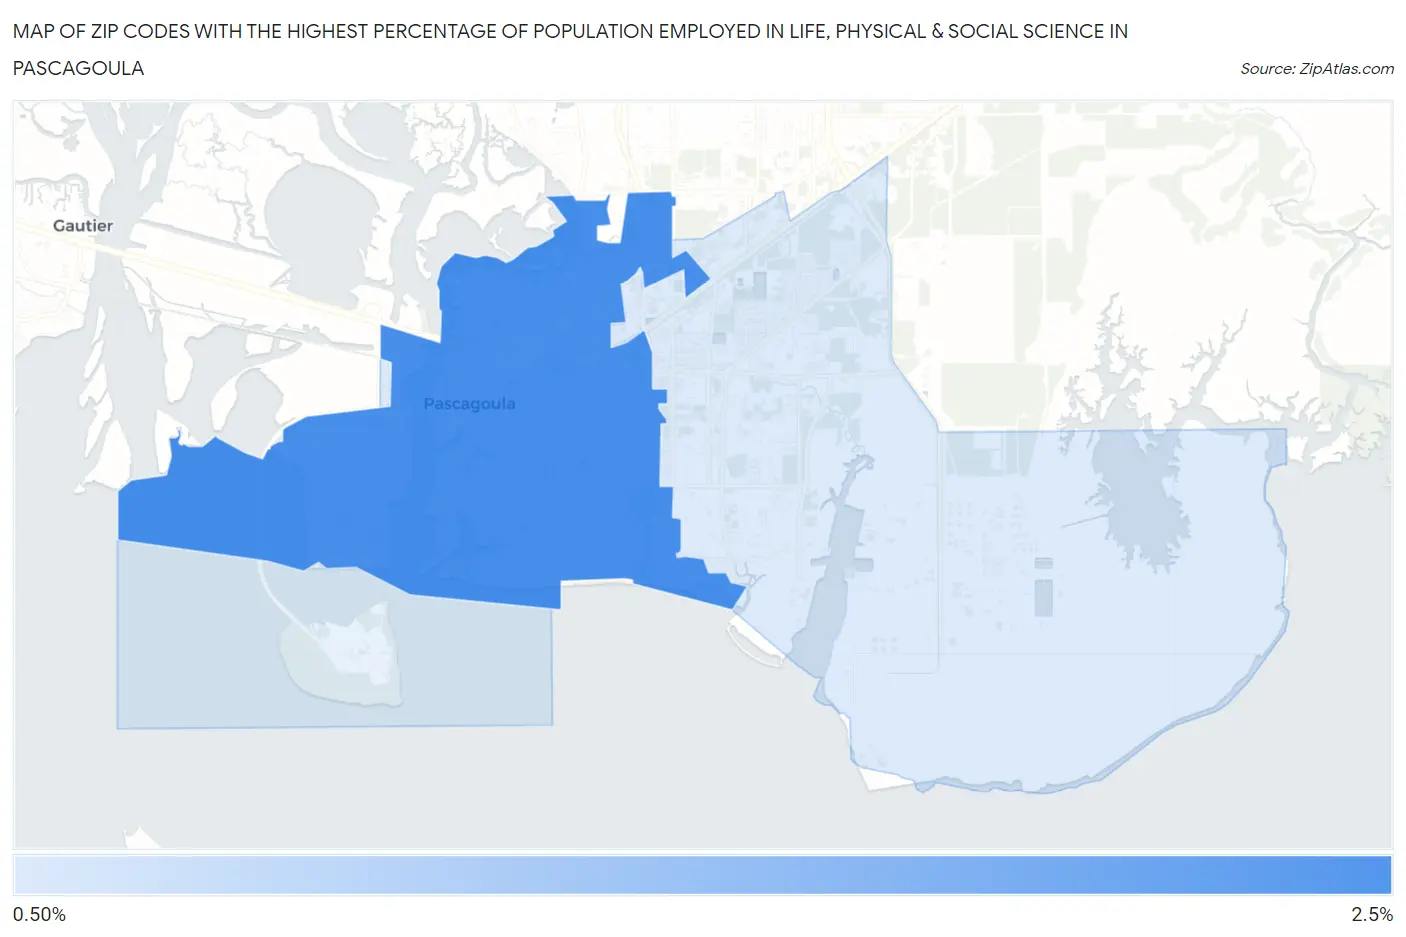
Map of Zip Codes with the Highest Percentage of Population Employed in Life, Physical & Social Science in Pascagoula
0.92%
2.2%
Zip Codes with the Highest Percentage of Population Employed in Life, Physical & Social Science in Pascagoula, MS
| Zip Code | % Employed | vs State | vs National | |
| 1. | 39567 | 2.2% | 0.76%(+1.47)#27 | 1.1%(+1.14)#3,112 |
| 2. | 39581 | 0.92% | 0.76%(+0.155)#82 | 1.1%(-0.171)#9,761 |
1
Common Questions
What are the Top Zip Codes with the Highest Percentage of Population Employed in Life, Physical & Social Science in Pascagoula, MS?
Top Zip Codes with the Highest Percentage of Population Employed in Life, Physical & Social Science in Pascagoula, MS are:
What zip code has the Highest Percentage of Population Employed in Life, Physical & Social Science in Pascagoula, MS?
39567 has the Highest Percentage of Population Employed in Life, Physical & Social Science in Pascagoula, MS with 2.2%.
What is the Percentage of Population Employed in Life, Physical & Social Science in Pascagoula, MS?
Percentage of Population Employed in Life, Physical & Social Science in Pascagoula is 1.5%.
What is the Percentage of Population Employed in Life, Physical & Social Science in Mississippi?
Percentage of Population Employed in Life, Physical & Social Science in Mississippi is 0.76%.
What is the Percentage of Population Employed in Life, Physical & Social Science in the United States?
Percentage of Population Employed in Life, Physical & Social Science in the United States is 1.1%.