Zip Codes with the Highest Percentage of Population Employed in Life, Physical & Social Science in Jackson, MS
RELATED REPORTS & OPTIONS
Life, Physical & Social Science
Jackson
Compare Zip Codes
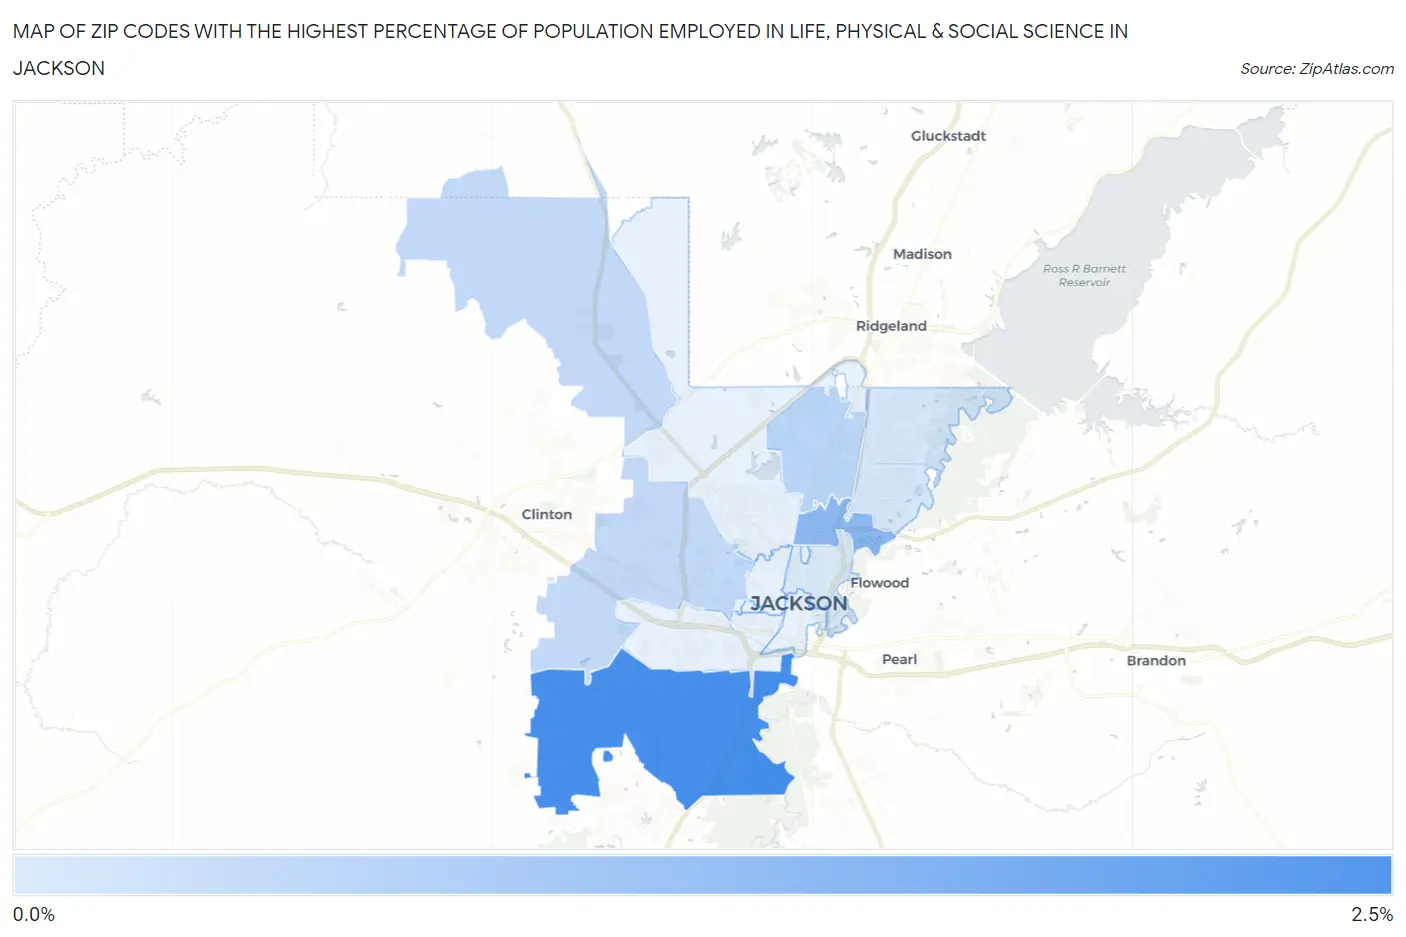
Map of Zip Codes with the Highest Percentage of Population Employed in Life, Physical & Social Science in Jackson
0.25%
2.2%
Zip Codes with the Highest Percentage of Population Employed in Life, Physical & Social Science in Jackson, MS
| Zip Code | % Employed | vs State | vs National | |
| 1. | 39212 | 2.2% | 0.76%(+1.40)#30 | 1.1%(+1.07)#3,275 |
| 2. | 39216 | 1.3% | 0.76%(+0.524)#56 | 1.1%(+0.198)#6,873 |
| 3. | 39206 | 0.69% | 0.76%(-0.073)#97 | 1.1%(-0.399)#12,131 |
| 4. | 39209 | 0.59% | 0.76%(-0.176)#105 | 1.1%(-0.502)#13,430 |
| 5. | 39211 | 0.34% | 0.76%(-0.422)#137 | 1.1%(-0.748)#16,496 |
| 6. | 39202 | 0.25% | 0.76%(-0.512)#156 | 1.1%(-0.838)#17,608 |
1
Common Questions
What are the Top 10 Zip Codes with the Highest Percentage of Population Employed in Life, Physical & Social Science in Jackson, MS?
Top 10 Zip Codes with the Highest Percentage of Population Employed in Life, Physical & Social Science in Jackson, MS are:
What zip code has the Highest Percentage of Population Employed in Life, Physical & Social Science in Jackson, MS?
39212 has the Highest Percentage of Population Employed in Life, Physical & Social Science in Jackson, MS with 2.2%.
What is the Percentage of Population Employed in Life, Physical & Social Science in Jackson, MS?
Percentage of Population Employed in Life, Physical & Social Science in Jackson is 0.69%.
What is the Percentage of Population Employed in Life, Physical & Social Science in Mississippi?
Percentage of Population Employed in Life, Physical & Social Science in Mississippi is 0.76%.
What is the Percentage of Population Employed in Life, Physical & Social Science in the United States?
Percentage of Population Employed in Life, Physical & Social Science in the United States is 1.1%.