Nonimmigrants Disability Age Under 5
COMPARE
Nonimmigrants
Select to Compare
Disability Age Under 5
Nonimmigrants Disability Age Under 5
1.6%
DISABILITY | AGE UNDER 5
0.0/ 100
METRIC RATING
297th/ 347
METRIC RANK
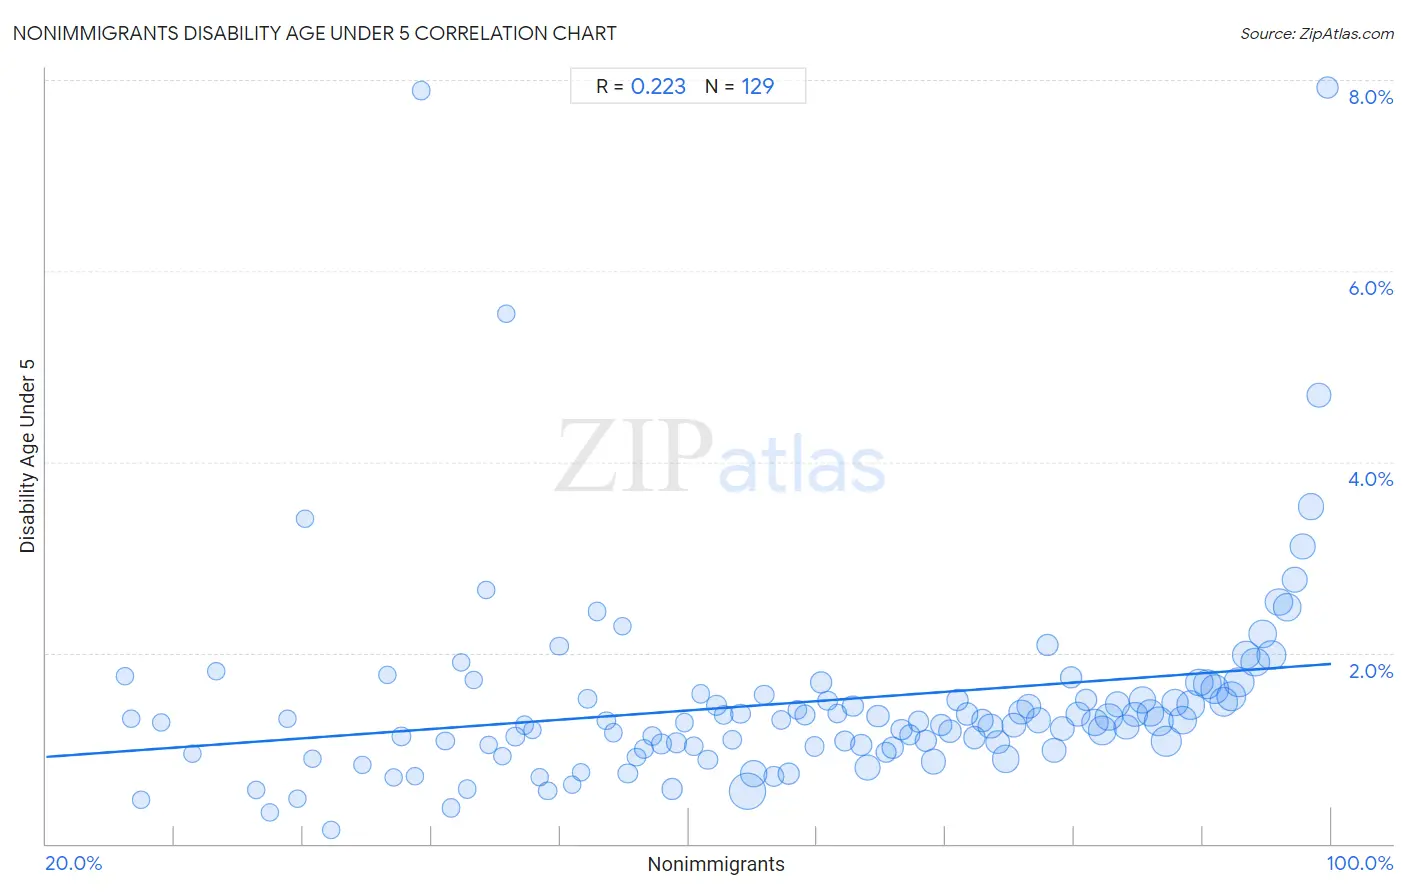
Nonimmigrants Disability Age Under 5 Correlation Chart
The statistical analysis conducted on geographies consisting of 262,587,524 people shows a weak positive correlation between the proportion of Nonimmigrants and percentage of population with a disability under the age of 5 in the United States with a correlation coefficient (R) of 0.223 and weighted average of 1.6%. On average, for every 1% (one percent) increase in Nonimmigrants within a typical geography, there is an increase of 0.012% in percentage of population with a disability under the age of 5.
It is essential to understand that the correlation between the percentage of Nonimmigrants and percentage of population with a disability under the age of 5 does not imply a direct cause-and-effect relationship. It remains uncertain whether the presence of Nonimmigrants influences an upward or downward trend in the level of percentage of population with a disability under the age of 5 within an area, or if Nonimmigrants simply ended up residing in those areas with higher or lower levels of percentage of population with a disability under the age of 5 due to other factors.
Demographics Similar to Nonimmigrants by Disability Age Under 5
In terms of disability age under 5, the demographic groups most similar to Nonimmigrants are Cajun (1.6%, a difference of 0.010%), Portuguese (1.6%, a difference of 0.58%), Shoshone (1.6%, a difference of 0.91%), Polish (1.6%, a difference of 0.96%), and Finnish (1.6%, a difference of 1.0%).
| Demographics | Rating | Rank | Disability Age Under 5 |
| Czechs | 0.0 /100 | #290 | Tragic 1.5% |
| Northern Europeans | 0.0 /100 | #291 | Tragic 1.6% |
| Italians | 0.0 /100 | #292 | Tragic 1.6% |
| Lithuanians | 0.0 /100 | #293 | Tragic 1.6% |
| Swedes | 0.0 /100 | #294 | Tragic 1.6% |
| Finns | 0.0 /100 | #295 | Tragic 1.6% |
| Poles | 0.0 /100 | #296 | Tragic 1.6% |
| Nonimmigrants | 0.0 /100 | #297 | Tragic 1.6% |
| Cajuns | 0.0 /100 | #298 | Tragic 1.6% |
| Portuguese | 0.0 /100 | #299 | Tragic 1.6% |
| Shoshone | 0.0 /100 | #300 | Tragic 1.6% |
| German Russians | 0.0 /100 | #301 | Tragic 1.6% |
| Welsh | 0.0 /100 | #302 | Tragic 1.6% |
| Swiss | 0.0 /100 | #303 | Tragic 1.6% |
| Seminole | 0.0 /100 | #304 | Tragic 1.6% |
Nonimmigrants Disability Age Under 5 Correlation Summary
| Measurement | Nonimmigrants Data | Disability Age Under 5 Data |
| Minimum | 24.9% | 0.14% |
| Maximum | 99.8% | 7.9% |
| Range | 74.9% | 7.8% |
| Mean | 66.9% | 1.5% |
| Median | 67.8% | 1.3% |
| Interquartile 25% (IQ1) | 51.0% | 1.0% |
| Interquartile 75% (IQ3) | 84.0% | 1.5% |
| Interquartile Range (IQR) | 33.1% | 0.54% |
| Standard Deviation (Sample) | 20.1% | 1.1% |
| Standard Deviation (Population) | 20.0% | 1.1% |
Correlation Details
| Nonimmigrants Percentile | Sample Size | Disability Age Under 5 |
[ 24.5% - 25.0% ] 24.90% | 71,088 | 1.8% |
[ 25.0% - 25.5% ] 25.32% | 46,798 | 1.3% |
[ 25.5% - 26.0% ] 25.88% | 222,996 | 0.46% |
[ 27.0% - 27.5% ] 27.15% | 57,066 | 1.3% |
[ 29.0% - 29.5% ] 29.12% | 79,495 | 0.94% |
[ 30.5% - 31.0% ] 30.62% | 34,335 | 1.8% |
[ 33.0% - 33.5% ] 33.09% | 52,851 | 0.56% |
[ 33.5% - 34.0% ] 33.91% | 102,618 | 0.33% |
[ 35.0% - 35.5% ] 35.03% | 21,778 | 1.3% |
[ 35.5% - 36.0% ] 35.62% | 56,696 | 0.48% |
[ 36.0% - 36.5% ] 36.12% | 13,163 | 3.4% |
[ 36.5% - 37.0% ] 36.57% | 24,597 | 0.88% |
[ 37.5% - 38.0% ] 37.71% | 83,069 | 0.14% |
[ 39.5% - 40.0% ] 39.66% | 112,750 | 0.82% |
[ 41.0% - 41.5% ] 41.21% | 146,628 | 1.8% |
[ 41.5% - 42.0% ] 41.66% | 67,394 | 0.69% |
[ 42.0% - 42.5% ] 42.13% | 484,697 | 1.1% |
[ 42.5% - 43.0% ] 42.93% | 67,287 | 0.70% |
[ 43.0% - 43.5% ] 43.36% | 37,340 | 7.9% |
[ 44.5% - 45.0% ] 44.85% | 293,259 | 1.1% |
[ 45.0% - 45.5% ] 45.19% | 224,465 | 0.38% |
[ 45.5% - 46.0% ] 45.84% | 104,461 | 1.9% |
[ 46.0% - 46.5% ] 46.21% | 304,106 | 0.57% |
[ 46.5% - 47.0% ] 46.64% | 52,152 | 1.7% |
[ 47.0% - 47.5% ] 47.37% | 51,153 | 2.7% |
[ 47.5% - 48.0% ] 47.57% | 100,373 | 1.0% |
[ 48.0% - 48.5% ] 48.42% | 88,180 | 0.92% |
[ 48.5% - 49.0% ] 48.67% | 5,922 | 5.6% |
[ 49.0% - 49.5% ] 49.19% | 286,005 | 1.1% |
[ 49.5% - 50.0% ] 49.77% | 447,437 | 1.2% |
[ 50.0% - 50.5% ] 50.30% | 76,658 | 1.2% |
[ 50.5% - 51.0% ] 50.70% | 311,092 | 0.70% |
[ 51.0% - 51.5% ] 51.20% | 458,014 | 0.55% |
[ 51.5% - 52.0% ] 51.93% | 115,911 | 2.1% |
[ 52.5% - 53.0% ] 52.73% | 333,419 | 0.62% |
[ 53.0% - 53.5% ] 53.28% | 247,652 | 0.75% |
[ 53.5% - 54.0% ] 53.69% | 603,999 | 1.5% |
[ 54.0% - 54.5% ] 54.28% | 423,834 | 2.4% |
[ 54.5% - 55.0% ] 54.87% | 537,868 | 1.3% |
[ 55.0% - 55.5% ] 55.32% | 429,993 | 1.2% |
[ 55.5% - 56.0% ] 55.84% | 46,788 | 2.3% |
[ 56.0% - 56.5% ] 56.22% | 963,049 | 0.74% |
[ 56.5% - 57.0% ] 56.76% | 384,271 | 0.91% |
[ 57.0% - 57.5% ] 57.21% | 449,985 | 0.99% |
[ 57.5% - 58.0% ] 57.73% | 842,318 | 1.1% |
[ 58.0% - 58.5% ] 58.30% | 1,064,515 | 1.0% |
[ 58.5% - 59.0% ] 58.95% | 1,658,265 | 0.57% |
[ 59.0% - 59.5% ] 59.23% | 1,029,266 | 1.1% |
[ 59.5% - 60.0% ] 59.73% | 552,250 | 1.3% |
[ 60.0% - 60.5% ] 60.32% | 660,456 | 1.0% |
[ 60.5% - 61.0% ] 60.75% | 544,637 | 1.6% |
[ 61.0% - 61.5% ] 61.19% | 904,573 | 0.88% |
[ 61.5% - 62.0% ] 61.74% | 977,018 | 1.4% |
[ 62.0% - 62.5% ] 62.18% | 722,334 | 1.4% |
[ 62.5% - 63.0% ] 62.72% | 876,182 | 1.1% |
[ 63.0% - 63.5% ] 63.23% | 692,025 | 1.4% |
[ 63.5% - 64.0% ] 63.67% | 9,500,588 | 0.54% |
[ 64.0% - 64.5% ] 64.06% | 4,535,505 | 0.74% |
[ 64.5% - 65.0% ] 64.70% | 819,031 | 1.6% |
[ 65.0% - 65.5% ] 65.31% | 1,141,560 | 0.71% |
[ 65.5% - 66.0% ] 65.73% | 686,703 | 1.3% |
[ 66.0% - 66.5% ] 66.24% | 1,981,665 | 0.74% |
[ 66.5% - 67.0% ] 66.74% | 790,538 | 1.4% |
[ 67.0% - 67.5% ] 67.26% | 1,325,244 | 1.3% |
[ 67.5% - 68.0% ] 67.85% | 1,067,570 | 1.0% |
[ 68.0% - 68.5% ] 68.24% | 2,020,413 | 1.7% |
[ 68.5% - 69.0% ] 68.67% | 1,146,113 | 1.5% |
[ 69.0% - 69.5% ] 69.23% | 883,562 | 1.4% |
[ 69.5% - 70.0% ] 69.73% | 1,496,113 | 1.1% |
[ 70.0% - 70.5% ] 70.22% | 1,464,894 | 1.4% |
[ 70.5% - 71.0% ] 70.71% | 1,892,101 | 1.0% |
[ 71.0% - 71.5% ] 71.10% | 3,736,615 | 0.80% |
[ 71.5% - 72.0% ] 71.78% | 2,052,091 | 1.3% |
[ 72.0% - 72.5% ] 72.29% | 1,463,169 | 0.95% |
[ 72.5% - 73.0% ] 72.70% | 1,663,893 | 1.0% |
[ 73.0% - 73.5% ] 73.23% | 1,622,514 | 1.2% |
[ 73.5% - 74.0% ] 73.75% | 1,468,651 | 1.1% |
[ 74.0% - 74.5% ] 74.33% | 1,455,675 | 1.3% |
[ 74.5% - 75.0% ] 74.76% | 2,360,158 | 1.1% |
[ 75.0% - 75.5% ] 75.23% | 3,468,664 | 0.86% |
[ 75.5% - 76.0% ] 75.72% | 1,910,392 | 1.2% |
[ 76.0% - 76.5% ] 76.23% | 2,580,464 | 1.2% |
[ 76.5% - 77.0% ] 76.74% | 1,881,087 | 1.5% |
[ 77.0% - 77.5% ] 77.32% | 2,314,523 | 1.4% |
[ 77.5% - 78.0% ] 77.78% | 2,459,775 | 1.1% |
[ 78.0% - 78.5% ] 78.25% | 1,988,798 | 1.3% |
[ 78.5% - 79.0% ] 78.78% | 3,312,140 | 1.2% |
[ 79.0% - 79.5% ] 79.24% | 2,950,008 | 1.1% |
[ 79.5% - 80.0% ] 79.74% | 4,945,461 | 0.88% |
[ 80.0% - 80.5% ] 80.27% | 3,040,868 | 1.2% |
[ 80.5% - 81.0% ] 80.71% | 3,586,700 | 1.4% |
[ 81.0% - 81.5% ] 81.20% | 3,130,272 | 1.4% |
[ 81.5% - 82.0% ] 81.75% | 3,499,004 | 1.3% |
[ 82.0% - 82.5% ] 82.33% | 1,916,018 | 2.1% |
[ 82.5% - 83.0% ] 82.73% | 2,804,536 | 0.98% |
[ 83.0% - 83.5% ] 83.27% | 3,392,421 | 1.2% |
[ 83.5% - 84.0% ] 83.80% | 2,072,831 | 1.7% |
[ 84.0% - 84.5% ] 84.23% | 2,704,094 | 1.4% |
[ 84.5% - 85.0% ] 84.75% | 2,027,515 | 1.5% |
[ 85.0% - 85.5% ] 85.29% | 4,460,472 | 1.3% |
[ 85.5% - 86.0% ] 85.76% | 5,267,501 | 1.2% |
[ 86.0% - 86.5% ] 86.17% | 4,912,259 | 1.3% |
[ 86.5% - 87.0% ] 86.71% | 3,276,313 | 1.5% |
[ 87.0% - 87.5% ] 87.25% | 3,645,067 | 1.2% |
[ 87.5% - 88.0% ] 87.80% | 3,786,507 | 1.4% |
[ 88.0% - 88.5% ] 88.24% | 4,514,612 | 1.5% |
[ 88.5% - 89.0% ] 88.74% | 4,004,700 | 1.4% |
[ 89.0% - 89.5% ] 89.27% | 5,636,357 | 1.3% |
[ 89.5% - 90.0% ] 89.74% | 6,313,524 | 1.1% |
[ 90.0% - 90.5% ] 90.24% | 4,403,957 | 1.5% |
[ 90.5% - 91.0% ] 90.74% | 4,907,192 | 1.3% |
[ 91.0% - 91.5% ] 91.25% | 5,597,969 | 1.5% |
[ 91.5% - 92.0% ] 91.79% | 4,482,099 | 1.7% |
[ 92.0% - 92.5% ] 92.28% | 5,218,156 | 1.7% |
[ 92.5% - 93.0% ] 92.74% | 5,312,903 | 1.6% |
[ 93.0% - 93.5% ] 93.27% | 5,109,501 | 1.5% |
[ 93.5% - 94.0% ] 93.75% | 5,687,806 | 1.5% |
[ 94.0% - 94.5% ] 94.27% | 6,024,437 | 1.7% |
[ 94.5% - 95.0% ] 94.73% | 5,096,236 | 2.0% |
[ 95.0% - 95.5% ] 95.25% | 5,453,455 | 1.9% |
[ 95.5% - 96.0% ] 95.75% | 4,876,368 | 2.2% |
[ 96.0% - 96.5% ] 96.27% | 5,542,241 | 2.0% |
[ 96.5% - 97.0% ] 96.76% | 4,897,207 | 2.5% |
[ 97.0% - 97.5% ] 97.27% | 5,334,957 | 2.5% |
[ 97.5% - 98.0% ] 97.75% | 4,086,135 | 2.8% |
[ 98.0% - 98.5% ] 98.23% | 3,629,926 | 3.1% |
[ 98.5% - 99.0% ] 98.73% | 4,034,127 | 3.5% |
[ 99.0% - 99.5% ] 99.22% | 2,977,591 | 4.7% |
[ 99.5% - 100.0% ] 99.78% | 1,891,481 | 7.9% |