Nonimmigrants vs Immigrants from Vietnam Wage/Income Gap
COMPARE
Nonimmigrants
Immigrants from Vietnam
Wage/Income Gap
Wage/Income Gap Comparison
Nonimmigrants
Immigrants from Vietnam
27.2%
WAGE/INCOME GAP
3.3/ 100
METRIC RATING
246th/ 347
METRIC RANK
25.2%
WAGE/INCOME GAP
77.7/ 100
METRIC RATING
155th/ 347
METRIC RANK
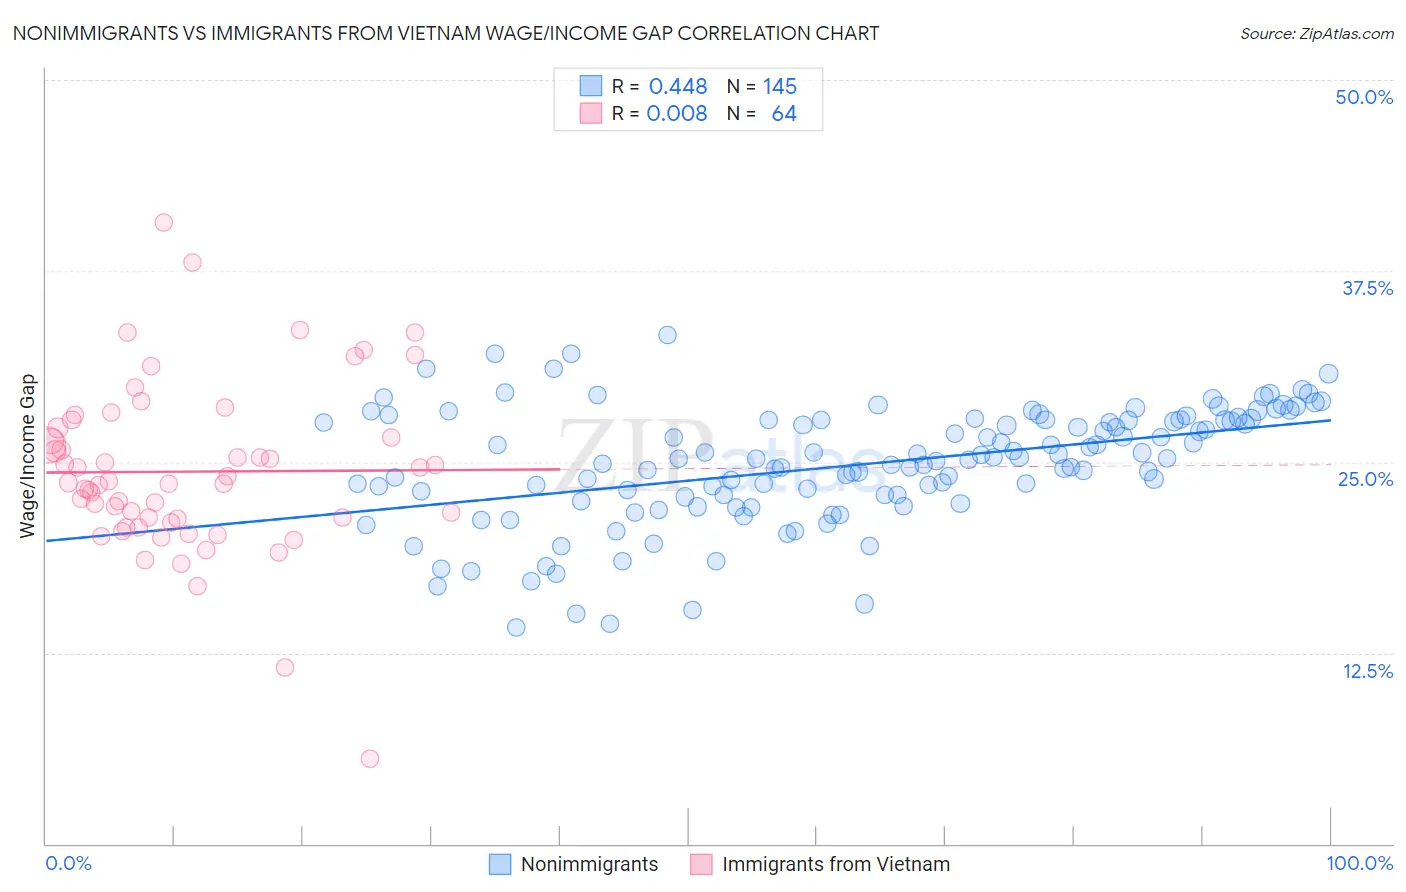
Nonimmigrants vs Immigrants from Vietnam Wage/Income Gap Correlation Chart
The statistical analysis conducted on geographies consisting of 579,671,089 people shows a moderate positive correlation between the proportion of Nonimmigrants and wage/income gap percentage in the United States with a correlation coefficient (R) of 0.448 and weighted average of 27.2%. Similarly, the statistical analysis conducted on geographies consisting of 404,669,724 people shows no correlation between the proportion of Immigrants from Vietnam and wage/income gap percentage in the United States with a correlation coefficient (R) of 0.008 and weighted average of 25.2%, a difference of 7.7%.
Wage/Income Gap Correlation Summary
| Measurement | Nonimmigrants | Immigrants from Vietnam |
| Minimum | 14.2% | 5.6% |
| Maximum | 33.3% | 40.6% |
| Range | 19.1% | 35.1% |
| Mean | 24.8% | 24.4% |
| Median | 25.2% | 23.6% |
| Interquartile 25% (IQ1) | 22.8% | 21.1% |
| Interquartile 75% (IQ3) | 27.7% | 26.9% |
| Interquartile Range (IQR) | 5.0% | 5.8% |
| Standard Deviation (Sample) | 3.8% | 5.6% |
| Standard Deviation (Population) | 3.8% | 5.6% |
Similar Demographics by Wage/Income Gap
Demographics Similar to Nonimmigrants by Wage/Income Gap
In terms of wage/income gap, the demographic groups most similar to Nonimmigrants are Immigrants from the Azores (27.2%, a difference of 0.080%), Chickasaw (27.2%, a difference of 0.090%), Spanish (27.1%, a difference of 0.16%), Immigrants from Sri Lanka (27.1%, a difference of 0.17%), and Creek (27.1%, a difference of 0.22%).
| Demographics | Rating | Rank | Wage/Income Gap |
| Estonians | 4.3 /100 | #239 | Tragic 27.1% |
| Immigrants | Europe | 3.8 /100 | #240 | Tragic 27.1% |
| Creek | 3.8 /100 | #241 | Tragic 27.1% |
| Immigrants | Sri Lanka | 3.7 /100 | #242 | Tragic 27.1% |
| Spanish | 3.6 /100 | #243 | Tragic 27.1% |
| Chickasaw | 3.5 /100 | #244 | Tragic 27.2% |
| Immigrants | Azores | 3.5 /100 | #245 | Tragic 27.2% |
| Immigrants | Nonimmigrants | 3.3 /100 | #246 | Tragic 27.2% |
| Celtics | 2.8 /100 | #247 | Tragic 27.3% |
| Cypriots | 2.8 /100 | #248 | Tragic 27.3% |
| Carpatho Rusyns | 2.7 /100 | #249 | Tragic 27.3% |
| Immigrants | Czechoslovakia | 2.7 /100 | #250 | Tragic 27.3% |
| Immigrants | Norway | 2.5 /100 | #251 | Tragic 27.3% |
| Ukrainians | 2.4 /100 | #252 | Tragic 27.3% |
| Portuguese | 2.2 /100 | #253 | Tragic 27.4% |
Demographics Similar to Immigrants from Vietnam by Wage/Income Gap
In terms of wage/income gap, the demographic groups most similar to Immigrants from Vietnam are Blackfeet (25.2%, a difference of 0.040%), Immigrants from Northern Africa (25.2%, a difference of 0.040%), Immigrants from Mexico (25.3%, a difference of 0.12%), Costa Rican (25.3%, a difference of 0.18%), and Immigrants from Zimbabwe (25.3%, a difference of 0.36%).
| Demographics | Rating | Rank | Wage/Income Gap |
| Iroquois | 83.9 /100 | #148 | Excellent 25.1% |
| Immigrants | Peru | 82.6 /100 | #149 | Excellent 25.1% |
| Immigrants | Immigrants | 82.3 /100 | #150 | Excellent 25.1% |
| Taiwanese | 81.6 /100 | #151 | Excellent 25.1% |
| Uruguayans | 81.3 /100 | #152 | Excellent 25.2% |
| Blackfeet | 78.1 /100 | #153 | Good 25.2% |
| Immigrants | Northern Africa | 78.1 /100 | #154 | Good 25.2% |
| Immigrants | Vietnam | 77.7 /100 | #155 | Good 25.2% |
| Immigrants | Mexico | 76.4 /100 | #156 | Good 25.3% |
| Costa Ricans | 75.8 /100 | #157 | Good 25.3% |
| Immigrants | Zimbabwe | 73.7 /100 | #158 | Good 25.3% |
| Puget Sound Salish | 73.0 /100 | #159 | Good 25.3% |
| French American Indians | 72.5 /100 | #160 | Good 25.4% |
| Albanians | 69.4 /100 | #161 | Good 25.4% |
| Shoshone | 69.0 /100 | #162 | Good 25.4% |