Nonimmigrants 1 or more Vehicles in Household
COMPARE
Nonimmigrants
Select to Compare
1 or more Vehicles in Household
Nonimmigrants 1 or more Vehicles in Household
92.2%
1+ VEHICLES AVAILABLE
99.9/ 100
METRIC RATING
45th/ 347
METRIC RANK
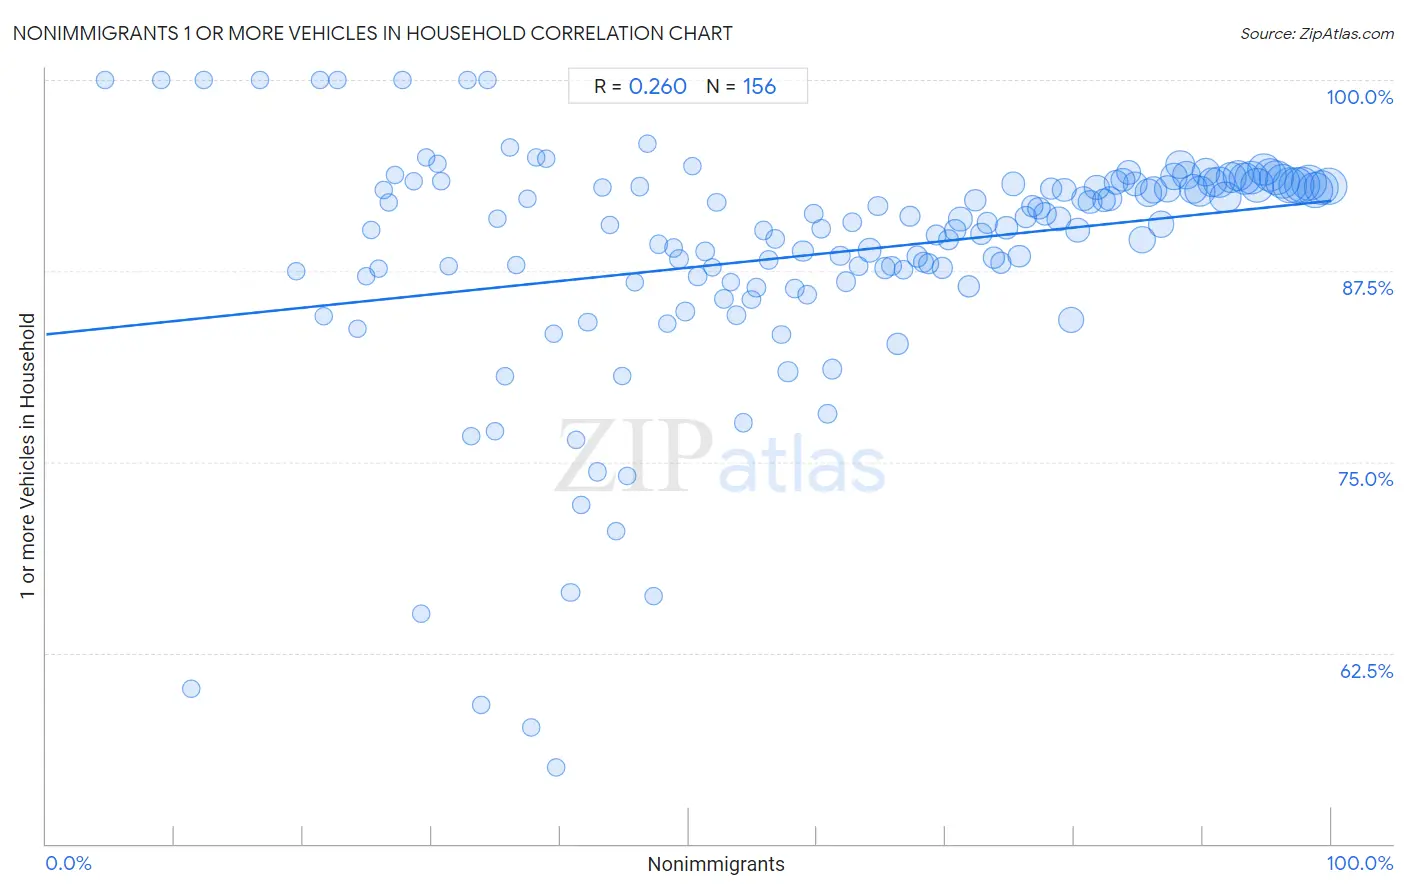
Nonimmigrants 1 or more Vehicles in Household Correlation Chart
The statistical analysis conducted on geographies consisting of 574,303,261 people shows a weak positive correlation between the proportion of Nonimmigrants and percentage of households with 1 or more vehicles available in the United States with a correlation coefficient (R) of 0.260 and weighted average of 92.2%. On average, for every 1% (one percent) increase in Nonimmigrants within a typical geography, there is an increase of 0.087% in percentage of households with 1 or more vehicles available.
It is essential to understand that the correlation between the percentage of Nonimmigrants and percentage of households with 1 or more vehicles available does not imply a direct cause-and-effect relationship. It remains uncertain whether the presence of Nonimmigrants influences an upward or downward trend in the level of percentage of households with 1 or more vehicles available within an area, or if Nonimmigrants simply ended up residing in those areas with higher or lower levels of percentage of households with 1 or more vehicles available due to other factors.
Demographics Similar to Nonimmigrants by 1 or more Vehicles in Household
In terms of 1 or more vehicles in household, the demographic groups most similar to Nonimmigrants are Choctaw (92.2%, a difference of 0.020%), Immigrants from Fiji (92.2%, a difference of 0.020%), Northern European (92.2%, a difference of 0.030%), Spanish (92.3%, a difference of 0.040%), and Immigrants from Taiwan (92.3%, a difference of 0.050%).
| Demographics | Rating | Rank | 1 or more Vehicles in Household |
| Immigrants from Vietnam | 99.9 /100 | #38 | Exceptional 92.3% |
| Swiss | 99.9 /100 | #39 | Exceptional 92.3% |
| Creek | 99.9 /100 | #40 | Exceptional 92.3% |
| Immigrants from Taiwan | 99.9 /100 | #41 | Exceptional 92.3% |
| Chickasaw | 99.9 /100 | #42 | Exceptional 92.3% |
| Spanish | 99.9 /100 | #43 | Exceptional 92.3% |
| Choctaw | 99.9 /100 | #44 | Exceptional 92.2% |
| Nonimmigrants | 99.9 /100 | #45 | Exceptional 92.2% |
| Immigrants from Fiji | 99.9 /100 | #46 | Exceptional 92.2% |
| Northern Europeans | 99.9 /100 | #47 | Exceptional 92.2% |
| Belgians | 99.9 /100 | #48 | Exceptional 92.1% |
| Afghans | 99.9 /100 | #49 | Exceptional 92.1% |
| Guamanians/Chamorros | 99.9 /100 | #50 | Exceptional 92.1% |
| Celtics | 99.9 /100 | #51 | Exceptional 92.1% |
| Koreans | 99.9 /100 | #52 | Exceptional 92.1% |
Nonimmigrants 1 or more Vehicles in Household Correlation Summary
| Measurement | Nonimmigrants Data | 1 or more Vehicles in Household Data |
| Minimum | 4.6% | 55.0% |
| Maximum | 99.8% | 100.0% |
| Range | 95.3% | 45.0% |
| Mean | 60.0% | 88.6% |
| Median | 60.5% | 90.6% |
| Interquartile 25% (IQ1) | 41.0% | 87.0% |
| Interquartile 75% (IQ3) | 80.5% | 93.2% |
| Interquartile Range (IQR) | 39.5% | 6.2% |
| Standard Deviation (Sample) | 24.0% | 8.1% |
| Standard Deviation (Population) | 23.9% | 8.0% |
Correlation Details
| Nonimmigrants Percentile | Sample Size | 1 or more Vehicles in Household |
[ 4.5% - 5.0% ] 4.57% | 197 | 100.0% |
[ 8.5% - 9.0% ] 8.93% | 112 | 100.0% |
[ 11.0% - 11.5% ] 11.31% | 168 | 60.2% |
[ 12.0% - 12.5% ] 12.28% | 171 | 100.0% |
[ 16.5% - 17.0% ] 16.67% | 72 | 100.0% |
[ 19.0% - 19.5% ] 19.42% | 1,030 | 87.4% |
[ 21.0% - 21.5% ] 21.35% | 178 | 100.0% |
[ 21.5% - 22.0% ] 21.63% | 42,178 | 84.5% |
[ 22.5% - 23.0% ] 22.62% | 84 | 100.0% |
[ 24.0% - 24.5% ] 24.26% | 1,018 | 83.7% |
[ 24.5% - 25.0% ] 24.90% | 71,088 | 87.2% |
[ 25.0% - 25.5% ] 25.32% | 46,798 | 90.2% |
[ 25.5% - 26.0% ] 25.85% | 257,769 | 87.6% |
[ 26.0% - 26.5% ] 26.25% | 19,452 | 92.8% |
[ 26.5% - 27.0% ] 26.69% | 29,830 | 92.0% |
[ 27.0% - 27.5% ] 27.15% | 57,226 | 93.8% |
[ 27.5% - 28.0% ] 27.68% | 289 | 100.0% |
[ 28.5% - 29.0% ] 28.63% | 45,620 | 93.4% |
[ 29.0% - 29.5% ] 29.21% | 138,182 | 65.0% |
[ 29.5% - 30.0% ] 29.61% | 115,169 | 94.9% |
[ 30.0% - 30.5% ] 30.42% | 766 | 94.5% |
[ 30.5% - 31.0% ] 30.74% | 90,830 | 93.4% |
[ 31.0% - 31.5% ] 31.32% | 119,624 | 87.8% |
[ 32.5% - 33.0% ] 32.77% | 177 | 100.0% |
[ 33.0% - 33.5% ] 33.09% | 109,332 | 76.7% |
[ 33.5% - 34.0% ] 33.83% | 153,024 | 59.1% |
[ 34.0% - 34.5% ] 34.34% | 99 | 100.0% |
[ 34.5% - 35.0% ] 34.90% | 53,246 | 77.0% |
[ 35.0% - 35.5% ] 35.12% | 105,802 | 90.9% |
[ 35.5% - 36.0% ] 35.67% | 109,357 | 80.6% |
[ 36.0% - 36.5% ] 36.09% | 117,426 | 95.6% |
[ 36.5% - 37.0% ] 36.58% | 26,861 | 87.9% |
[ 37.0% - 37.5% ] 37.42% | 26,268 | 92.2% |
[ 37.5% - 38.0% ] 37.72% | 94,284 | 57.6% |
[ 38.0% - 38.5% ] 38.12% | 128,910 | 94.9% |
[ 38.5% - 39.0% ] 38.87% | 58,079 | 94.8% |
[ 39.0% - 39.5% ] 39.47% | 36,448 | 83.4% |
[ 39.5% - 40.0% ] 39.70% | 154,124 | 55.0% |
[ 40.5% - 41.0% ] 40.81% | 87,048 | 66.5% |
[ 41.0% - 41.5% ] 41.20% | 221,572 | 76.4% |
[ 41.5% - 42.0% ] 41.66% | 98,862 | 72.2% |
[ 42.0% - 42.5% ] 42.16% | 598,269 | 84.1% |
[ 42.5% - 43.0% ] 42.87% | 110,585 | 74.3% |
[ 43.0% - 43.5% ] 43.28% | 75,873 | 93.0% |
[ 43.5% - 44.0% ] 43.83% | 91,519 | 90.5% |
[ 44.0% - 44.5% ] 44.39% | 148,599 | 70.4% |
[ 44.5% - 45.0% ] 44.82% | 482,191 | 80.6% |
[ 45.0% - 45.5% ] 45.22% | 593,729 | 74.1% |
[ 45.5% - 46.0% ] 45.83% | 375,434 | 86.7% |
[ 46.0% - 46.5% ] 46.19% | 463,452 | 93.0% |
[ 46.5% - 47.0% ] 46.77% | 137,110 | 95.8% |
[ 47.0% - 47.5% ] 47.24% | 236,458 | 66.2% |
[ 47.5% - 48.0% ] 47.68% | 205,023 | 89.3% |
[ 48.0% - 48.5% ] 48.33% | 305,963 | 84.1% |
[ 48.5% - 49.0% ] 48.82% | 322,007 | 89.0% |
[ 49.0% - 49.5% ] 49.21% | 730,765 | 88.3% |
[ 49.5% - 50.0% ] 49.72% | 640,826 | 84.8% |
[ 50.0% - 50.5% ] 50.31% | 165,718 | 94.4% |
[ 50.5% - 51.0% ] 50.72% | 847,337 | 87.1% |
[ 51.0% - 51.5% ] 51.26% | 845,868 | 88.8% |
[ 51.5% - 52.0% ] 51.86% | 169,826 | 87.7% |
[ 52.0% - 52.5% ] 52.17% | 277,561 | 92.0% |
[ 52.5% - 53.0% ] 52.70% | 841,371 | 85.7% |
[ 53.0% - 53.5% ] 53.28% | 708,284 | 86.8% |
[ 53.5% - 54.0% ] 53.70% | 775,976 | 84.6% |
[ 54.0% - 54.5% ] 54.25% | 710,381 | 77.6% |
[ 54.5% - 55.0% ] 54.86% | 871,806 | 85.6% |
[ 55.0% - 55.5% ] 55.28% | 858,656 | 86.4% |
[ 55.5% - 56.0% ] 55.80% | 369,253 | 90.1% |
[ 56.0% - 56.5% ] 56.21% | 1,290,311 | 88.2% |
[ 56.5% - 57.0% ] 56.74% | 890,544 | 89.6% |
[ 57.0% - 57.5% ] 57.22% | 816,236 | 83.3% |
[ 57.5% - 58.0% ] 57.72% | 1,501,804 | 80.9% |
[ 58.0% - 58.5% ] 58.27% | 1,525,850 | 86.3% |
[ 58.5% - 59.0% ] 58.89% | 2,639,001 | 88.8% |
[ 59.0% - 59.5% ] 59.24% | 1,734,022 | 86.0% |
[ 59.5% - 60.0% ] 59.75% | 1,249,703 | 91.3% |
[ 60.0% - 60.5% ] 60.31% | 1,209,914 | 90.3% |
[ 60.5% - 61.0% ] 60.77% | 1,154,486 | 78.1% |
[ 61.0% - 61.5% ] 61.19% | 1,612,241 | 81.1% |
[ 61.5% - 62.0% ] 61.77% | 1,934,643 | 88.5% |
[ 62.0% - 62.5% ] 62.24% | 1,537,593 | 86.8% |
[ 62.5% - 63.0% ] 62.74% | 1,598,067 | 90.7% |
[ 63.0% - 63.5% ] 63.23% | 1,322,357 | 87.8% |
[ 64.0% - 64.5% ] 64.09% | 5,381,430 | 88.8% |
[ 64.5% - 65.0% ] 64.74% | 1,587,217 | 91.7% |
[ 65.0% - 65.5% ] 65.26% | 2,390,850 | 87.7% |
[ 65.5% - 66.0% ] 65.77% | 1,749,851 | 87.8% |
[ 66.0% - 66.5% ] 66.26% | 3,250,013 | 82.7% |
[ 66.5% - 67.0% ] 66.73% | 1,734,912 | 87.6% |
[ 67.0% - 67.5% ] 67.25% | 2,370,289 | 91.1% |
[ 67.5% - 68.0% ] 67.79% | 2,889,947 | 88.4% |
[ 68.0% - 68.5% ] 68.25% | 2,833,510 | 88.1% |
[ 68.5% - 69.0% ] 68.69% | 2,414,630 | 88.0% |
[ 69.0% - 69.5% ] 69.26% | 2,241,601 | 89.8% |
[ 69.5% - 70.0% ] 69.73% | 2,702,420 | 87.7% |
[ 70.0% - 70.5% ] 70.24% | 2,779,639 | 89.6% |
[ 70.5% - 71.0% ] 70.73% | 3,120,582 | 90.2% |
[ 71.0% - 71.5% ] 71.14% | 5,113,852 | 90.9% |
[ 71.5% - 72.0% ] 71.76% | 3,349,414 | 86.5% |
[ 72.0% - 72.5% ] 72.27% | 2,970,242 | 92.1% |
[ 72.5% - 73.0% ] 72.73% | 3,319,129 | 89.9% |
[ 73.0% - 73.5% ] 73.24% | 2,756,803 | 90.6% |
[ 73.5% - 74.0% ] 73.76% | 3,199,820 | 88.4% |
[ 74.0% - 74.5% ] 74.31% | 2,919,510 | 88.0% |
[ 74.5% - 75.0% ] 74.75% | 4,180,593 | 90.3% |
[ 75.0% - 75.5% ] 75.25% | 5,522,011 | 93.2% |
[ 75.5% - 76.0% ] 75.72% | 3,618,906 | 88.4% |
[ 76.0% - 76.5% ] 76.24% | 4,199,927 | 91.0% |
[ 76.5% - 77.0% ] 76.76% | 3,757,247 | 91.8% |
[ 77.0% - 77.5% ] 77.27% | 4,307,260 | 91.6% |
[ 77.5% - 78.0% ] 77.77% | 4,428,140 | 91.3% |
[ 78.0% - 78.5% ] 78.23% | 3,714,816 | 92.9% |
[ 78.5% - 79.0% ] 78.77% | 5,561,551 | 90.9% |
[ 79.0% - 79.5% ] 79.23% | 4,832,249 | 92.8% |
[ 79.5% - 80.0% ] 79.73% | 7,120,391 | 84.3% |
[ 80.0% - 80.5% ] 80.27% | 5,465,821 | 90.1% |
[ 80.5% - 81.0% ] 80.74% | 5,943,170 | 92.2% |
[ 81.0% - 81.5% ] 81.22% | 5,660,465 | 92.0% |
[ 81.5% - 82.0% ] 81.75% | 5,997,590 | 93.0% |
[ 82.0% - 82.5% ] 82.30% | 4,132,666 | 92.1% |
[ 82.5% - 83.0% ] 82.75% | 5,951,782 | 92.2% |
[ 83.0% - 83.5% ] 83.26% | 6,104,227 | 93.3% |
[ 83.5% - 84.0% ] 83.77% | 5,021,406 | 93.5% |
[ 84.0% - 84.5% ] 84.23% | 5,918,426 | 94.0% |
[ 84.5% - 85.0% ] 84.77% | 5,439,732 | 93.2% |
[ 85.0% - 85.5% ] 85.27% | 8,588,837 | 89.5% |
[ 85.5% - 86.0% ] 85.76% | 8,823,808 | 92.6% |
[ 86.0% - 86.5% ] 86.20% | 8,314,446 | 92.8% |
[ 86.5% - 87.0% ] 86.75% | 7,148,833 | 90.6% |
[ 87.0% - 87.5% ] 87.25% | 7,946,606 | 92.9% |
[ 87.5% - 88.0% ] 87.78% | 7,696,502 | 93.7% |
[ 88.0% - 88.5% ] 88.24% | 9,933,185 | 94.4% |
[ 88.5% - 89.0% ] 88.76% | 8,915,041 | 93.8% |
[ 89.0% - 89.5% ] 89.26% | 10,249,816 | 92.9% |
[ 89.5% - 90.0% ] 89.74% | 11,708,092 | 92.7% |
[ 90.0% - 90.5% ] 90.24% | 9,891,475 | 94.0% |
[ 90.5% - 91.0% ] 90.75% | 10,788,846 | 93.3% |
[ 91.0% - 91.5% ] 91.26% | 12,114,104 | 93.3% |
[ 91.5% - 92.0% ] 91.77% | 11,976,757 | 92.3% |
[ 92.0% - 92.5% ] 92.26% | 11,617,438 | 93.6% |
[ 92.5% - 93.0% ] 92.76% | 12,647,069 | 93.7% |
[ 93.0% - 93.5% ] 93.25% | 13,099,037 | 93.5% |
[ 93.5% - 94.0% ] 93.76% | 13,694,333 | 93.6% |
[ 94.0% - 94.5% ] 94.25% | 14,481,257 | 93.1% |
[ 94.5% - 95.0% ] 94.74% | 13,500,870 | 94.1% |
[ 95.0% - 95.5% ] 95.25% | 13,917,227 | 93.8% |
[ 95.5% - 96.0% ] 95.75% | 14,676,958 | 93.6% |
[ 96.0% - 96.5% ] 96.25% | 14,891,024 | 93.3% |
[ 96.5% - 97.0% ] 96.76% | 15,715,059 | 93.1% |
[ 97.0% - 97.5% ] 97.26% | 15,821,829 | 93.1% |
[ 97.5% - 98.0% ] 97.76% | 16,654,651 | 93.1% |
[ 98.0% - 98.5% ] 98.25% | 15,755,871 | 93.3% |
[ 98.5% - 99.0% ] 98.75% | 15,914,729 | 92.8% |
[ 99.0% - 99.5% ] 99.24% | 14,922,747 | 92.9% |
[ 99.5% - 100.0% ] 99.84% | 17,347,395 | 93.0% |