Nonimmigrants vs Samoan Wage/Income Gap
COMPARE
Nonimmigrants
Samoan
Wage/Income Gap
Wage/Income Gap Comparison
Nonimmigrants
Samoans
27.2%
WAGE/INCOME GAP
3.3/ 100
METRIC RATING
246th/ 347
METRIC RANK
26.0%
WAGE/INCOME GAP
38.6/ 100
METRIC RATING
179th/ 347
METRIC RANK
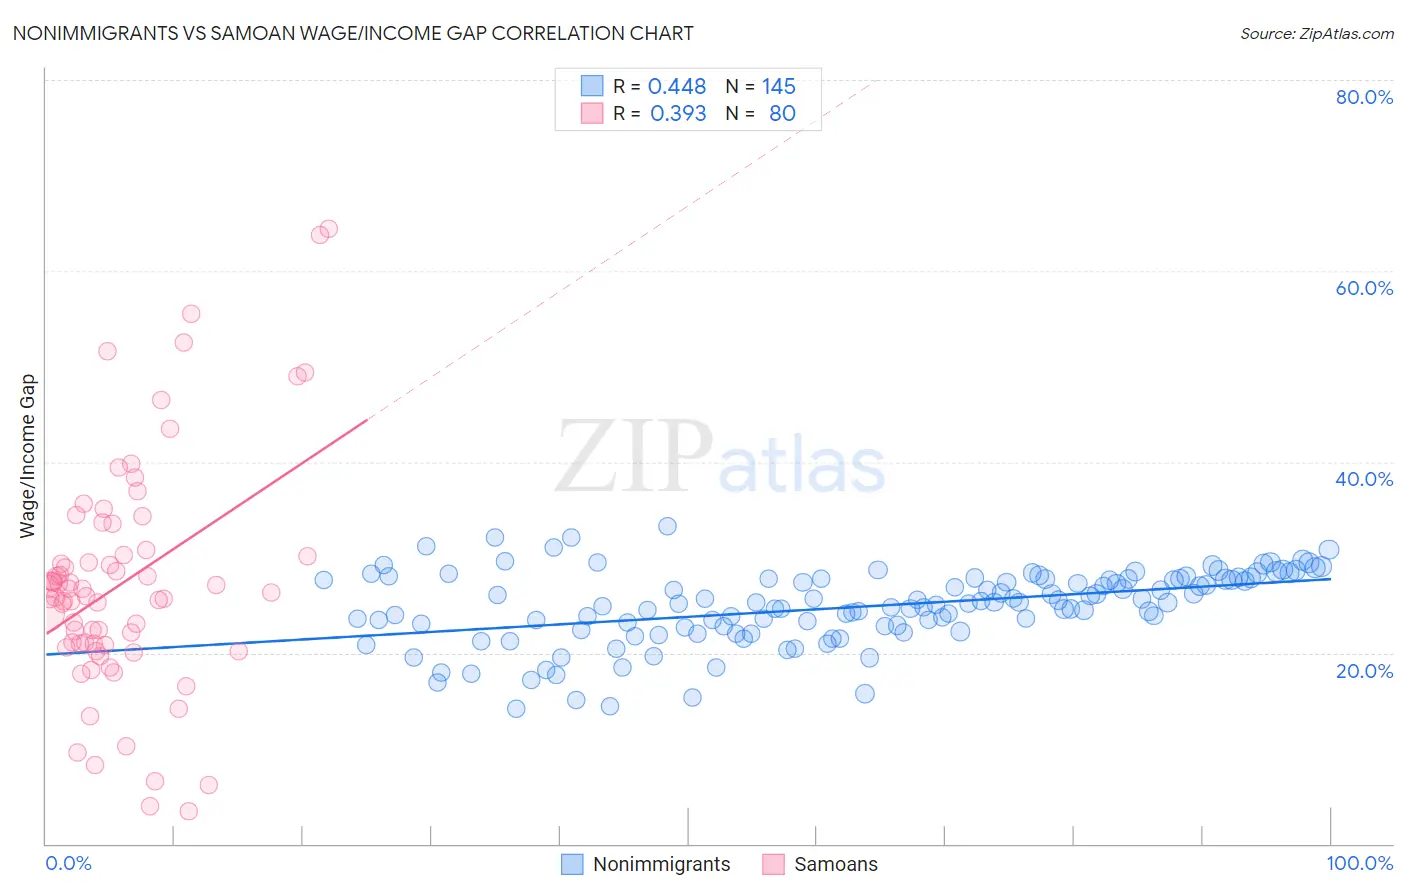
Nonimmigrants vs Samoan Wage/Income Gap Correlation Chart
The statistical analysis conducted on geographies consisting of 579,671,089 people shows a moderate positive correlation between the proportion of Nonimmigrants and wage/income gap percentage in the United States with a correlation coefficient (R) of 0.448 and weighted average of 27.2%. Similarly, the statistical analysis conducted on geographies consisting of 225,082,264 people shows a mild positive correlation between the proportion of Samoans and wage/income gap percentage in the United States with a correlation coefficient (R) of 0.393 and weighted average of 26.0%, a difference of 4.7%.
Wage/Income Gap Correlation Summary
| Measurement | Nonimmigrants | Samoan |
| Minimum | 14.2% | 3.4% |
| Maximum | 33.3% | 64.4% |
| Range | 19.1% | 61.0% |
| Mean | 24.8% | 27.4% |
| Median | 25.2% | 26.1% |
| Interquartile 25% (IQ1) | 22.8% | 20.9% |
| Interquartile 75% (IQ3) | 27.7% | 30.5% |
| Interquartile Range (IQR) | 5.0% | 9.6% |
| Standard Deviation (Sample) | 3.8% | 12.1% |
| Standard Deviation (Population) | 3.8% | 12.1% |
Similar Demographics by Wage/Income Gap
Demographics Similar to Nonimmigrants by Wage/Income Gap
In terms of wage/income gap, the demographic groups most similar to Nonimmigrants are Immigrants from the Azores (27.2%, a difference of 0.080%), Chickasaw (27.2%, a difference of 0.090%), Spanish (27.1%, a difference of 0.16%), Immigrants from Sri Lanka (27.1%, a difference of 0.17%), and Creek (27.1%, a difference of 0.22%).
| Demographics | Rating | Rank | Wage/Income Gap |
| Estonians | 4.3 /100 | #239 | Tragic 27.1% |
| Immigrants | Europe | 3.8 /100 | #240 | Tragic 27.1% |
| Creek | 3.8 /100 | #241 | Tragic 27.1% |
| Immigrants | Sri Lanka | 3.7 /100 | #242 | Tragic 27.1% |
| Spanish | 3.6 /100 | #243 | Tragic 27.1% |
| Chickasaw | 3.5 /100 | #244 | Tragic 27.2% |
| Immigrants | Azores | 3.5 /100 | #245 | Tragic 27.2% |
| Immigrants | Nonimmigrants | 3.3 /100 | #246 | Tragic 27.2% |
| Celtics | 2.8 /100 | #247 | Tragic 27.3% |
| Cypriots | 2.8 /100 | #248 | Tragic 27.3% |
| Carpatho Rusyns | 2.7 /100 | #249 | Tragic 27.3% |
| Immigrants | Czechoslovakia | 2.7 /100 | #250 | Tragic 27.3% |
| Immigrants | Norway | 2.5 /100 | #251 | Tragic 27.3% |
| Ukrainians | 2.4 /100 | #252 | Tragic 27.3% |
| Portuguese | 2.2 /100 | #253 | Tragic 27.4% |
Demographics Similar to Samoans by Wage/Income Gap
In terms of wage/income gap, the demographic groups most similar to Samoans are Guamanian/Chamorro (26.0%, a difference of 0.040%), Immigrants from Bolivia (26.0%, a difference of 0.15%), Chinese (25.9%, a difference of 0.23%), Immigrants from Serbia (26.0%, a difference of 0.23%), and Immigrants from Kazakhstan (26.0%, a difference of 0.24%).
| Demographics | Rating | Rank | Wage/Income Gap |
| Immigrants | Chile | 53.2 /100 | #172 | Average 25.7% |
| Immigrants | Belarus | 52.9 /100 | #173 | Average 25.7% |
| Alaskan Athabascans | 50.0 /100 | #174 | Average 25.8% |
| Sri Lankans | 47.0 /100 | #175 | Average 25.8% |
| Paraguayans | 46.7 /100 | #176 | Average 25.8% |
| Cambodians | 45.1 /100 | #177 | Average 25.8% |
| Chinese | 42.0 /100 | #178 | Average 25.9% |
| Samoans | 38.6 /100 | #179 | Fair 26.0% |
| Guamanians/Chamorros | 38.0 /100 | #180 | Fair 26.0% |
| Immigrants | Bolivia | 36.4 /100 | #181 | Fair 26.0% |
| Immigrants | Serbia | 35.4 /100 | #182 | Fair 26.0% |
| Immigrants | Kazakhstan | 35.2 /100 | #183 | Fair 26.0% |
| Mexicans | 34.4 /100 | #184 | Fair 26.0% |
| Pakistanis | 33.7 /100 | #185 | Fair 26.1% |
| Immigrants | Indonesia | 32.5 /100 | #186 | Fair 26.1% |