Nonimmigrants Disability
COMPARE
Nonimmigrants
Select to Compare
Disability
Nonimmigrants Disability
13.2%
DISABILITY
0.0/ 100
METRIC RATING
295th/ 347
METRIC RANK
Nonimmigrants Disability Correlation Chart
The statistical analysis conducted on geographies consisting of 585,046,981 people shows a weak positive correlation between the proportion of Nonimmigrants and percentage of population with a disability in the United States with a correlation coefficient (R) of 0.296 and weighted average of 13.2%. On average, for every 1% (one percent) increase in Nonimmigrants within a typical geography, there is an increase of 0.042% in percentage of population with a disability.
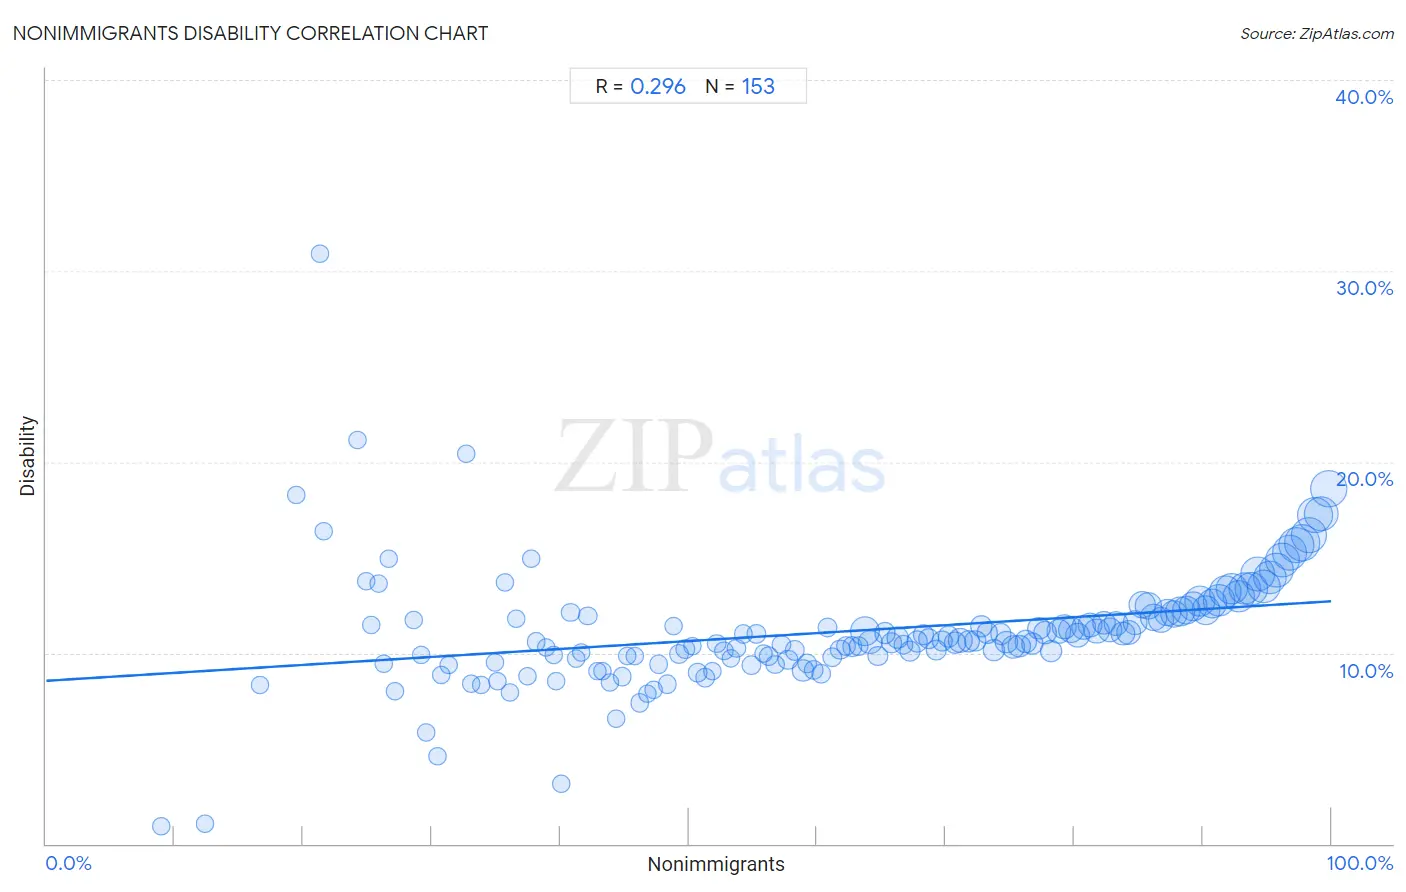
It is essential to understand that the correlation between the percentage of Nonimmigrants and percentage of population with a disability does not imply a direct cause-and-effect relationship. It remains uncertain whether the presence of Nonimmigrants influences an upward or downward trend in the level of percentage of population with a disability within an area, or if Nonimmigrants simply ended up residing in those areas with higher or lower levels of percentage of population with a disability due to other factors.
Demographics Similar to Nonimmigrants by Disability
In terms of disability, the demographic groups most similar to Nonimmigrants are Central American Indian (13.2%, a difference of 0.040%), Hopi (13.2%, a difference of 0.10%), Alaska Native (13.2%, a difference of 0.11%), Celtic (13.1%, a difference of 0.12%), and French (13.2%, a difference of 0.12%).
| Demographics | Rating | Rank | Disability |
| Whites/Caucasians | 0.0 /100 | #288 | Tragic 13.0% |
| Slovaks | 0.0 /100 | #289 | Tragic 13.0% |
| Cheyenne | 0.0 /100 | #290 | Tragic 13.0% |
| Yaqui | 0.0 /100 | #291 | Tragic 13.1% |
| Aleuts | 0.0 /100 | #292 | Tragic 13.1% |
| Marshallese | 0.0 /100 | #293 | Tragic 13.1% |
| Celtics | 0.0 /100 | #294 | Tragic 13.1% |
| Nonimmigrants | 0.0 /100 | #295 | Tragic 13.2% |
| Central American Indians | 0.0 /100 | #296 | Tragic 13.2% |
| Hopi | 0.0 /100 | #297 | Tragic 13.2% |
| Alaska Natives | 0.0 /100 | #298 | Tragic 13.2% |
| French | 0.0 /100 | #299 | Tragic 13.2% |
| Pennsylvania Germans | 0.0 /100 | #300 | Tragic 13.2% |
| Immigrants from Micronesia | 0.0 /100 | #301 | Tragic 13.2% |
| Arapaho | 0.0 /100 | #302 | Tragic 13.2% |
Nonimmigrants Disability Correlation Summary
| Measurement | Nonimmigrants Data | Disability Data |
| Minimum | 8.9% | 0.89% |
| Maximum | 99.8% | 30.9% |
| Range | 90.9% | 30.0% |
| Mean | 61.2% | 11.1% |
| Median | 61.8% | 10.6% |
| Interquartile 25% (IQ1) | 42.5% | 9.7% |
| Interquartile 75% (IQ3) | 81.0% | 12.1% |
| Interquartile Range (IQR) | 38.5% | 2.4% |
| Standard Deviation (Sample) | 23.0% | 3.2% |
| Standard Deviation (Population) | 23.0% | 3.2% |
Correlation Details
| Nonimmigrants Percentile | Sample Size | Disability |
[ 8.5% - 9.0% ] 8.93% | 112 | 0.89% |
[ 12.0% - 12.5% ] 12.37% | 97 | 1.0% |
[ 16.5% - 17.0% ] 16.67% | 72 | 8.3% |
[ 19.0% - 19.5% ] 19.42% | 1,030 | 18.2% |
[ 21.0% - 21.5% ] 21.35% | 178 | 30.9% |
[ 21.5% - 22.0% ] 21.63% | 42,081 | 16.3% |
[ 24.0% - 24.5% ] 24.26% | 1,018 | 21.1% |
[ 24.5% - 25.0% ] 24.90% | 71,088 | 13.7% |
[ 25.0% - 25.5% ] 25.32% | 46,798 | 11.5% |
[ 25.5% - 26.0% ] 25.85% | 257,738 | 13.6% |
[ 26.0% - 26.5% ] 26.25% | 19,452 | 9.4% |
[ 26.5% - 27.0% ] 26.69% | 29,830 | 14.9% |
[ 27.0% - 27.5% ] 27.15% | 57,226 | 8.0% |
[ 28.5% - 29.0% ] 28.63% | 45,620 | 11.7% |
[ 29.0% - 29.5% ] 29.21% | 138,182 | 9.9% |
[ 29.5% - 30.0% ] 29.61% | 115,169 | 5.8% |
[ 30.0% - 30.5% ] 30.42% | 766 | 4.6% |
[ 30.5% - 31.0% ] 30.74% | 90,791 | 8.8% |
[ 31.0% - 31.5% ] 31.32% | 119,624 | 9.3% |
[ 32.5% - 33.0% ] 32.65% | 49 | 20.4% |
[ 33.0% - 33.5% ] 33.09% | 109,332 | 8.4% |
[ 33.5% - 34.0% ] 33.83% | 153,024 | 8.3% |
[ 34.5% - 35.0% ] 34.90% | 53,206 | 9.5% |
[ 35.0% - 35.5% ] 35.12% | 105,802 | 8.5% |
[ 35.5% - 36.0% ] 35.67% | 109,357 | 13.7% |
[ 36.0% - 36.5% ] 36.10% | 117,893 | 7.9% |
[ 36.5% - 37.0% ] 36.58% | 26,861 | 11.8% |
[ 37.0% - 37.5% ] 37.42% | 26,090 | 8.7% |
[ 37.5% - 38.0% ] 37.72% | 94,284 | 14.9% |
[ 38.0% - 38.5% ] 38.12% | 128,876 | 10.6% |
[ 38.5% - 39.0% ] 38.87% | 58,079 | 10.3% |
[ 39.0% - 39.5% ] 39.47% | 36,392 | 9.9% |
[ 39.5% - 40.0% ] 39.70% | 154,064 | 8.5% |
[ 40.0% - 40.5% ] 40.08% | 15,969 | 3.1% |
[ 40.5% - 41.0% ] 40.81% | 87,048 | 12.1% |
[ 41.0% - 41.5% ] 41.20% | 221,458 | 9.7% |
[ 41.5% - 42.0% ] 41.66% | 98,125 | 10.0% |
[ 42.0% - 42.5% ] 42.16% | 598,156 | 11.9% |
[ 42.5% - 43.0% ] 42.87% | 110,508 | 9.0% |
[ 43.0% - 43.5% ] 43.28% | 75,873 | 9.0% |
[ 43.5% - 44.0% ] 43.83% | 91,519 | 8.5% |
[ 44.0% - 44.5% ] 44.39% | 148,289 | 6.6% |
[ 44.5% - 45.0% ] 44.82% | 482,758 | 8.8% |
[ 45.0% - 45.5% ] 45.22% | 593,718 | 9.8% |
[ 45.5% - 46.0% ] 45.83% | 374,895 | 9.8% |
[ 46.0% - 46.5% ] 46.19% | 463,452 | 7.4% |
[ 46.5% - 47.0% ] 46.77% | 137,110 | 7.9% |
[ 47.0% - 47.5% ] 47.24% | 236,458 | 8.1% |
[ 47.5% - 48.0% ] 47.68% | 205,023 | 9.4% |
[ 48.0% - 48.5% ] 48.33% | 305,963 | 8.4% |
[ 48.5% - 49.0% ] 48.82% | 322,007 | 11.4% |
[ 49.0% - 49.5% ] 49.21% | 730,592 | 9.9% |
[ 49.5% - 50.0% ] 49.72% | 640,772 | 10.2% |
[ 50.0% - 50.5% ] 50.31% | 165,718 | 10.4% |
[ 50.5% - 51.0% ] 50.72% | 847,337 | 8.9% |
[ 51.0% - 51.5% ] 51.26% | 845,868 | 8.7% |
[ 51.5% - 52.0% ] 51.86% | 169,549 | 9.0% |
[ 52.0% - 52.5% ] 52.17% | 277,561 | 10.5% |
[ 52.5% - 53.0% ] 52.70% | 841,320 | 10.1% |
[ 53.0% - 53.5% ] 53.28% | 708,226 | 9.7% |
[ 53.5% - 54.0% ] 53.70% | 775,976 | 10.2% |
[ 54.0% - 54.5% ] 54.25% | 710,381 | 11.0% |
[ 54.5% - 55.0% ] 54.86% | 871,806 | 9.3% |
[ 55.0% - 55.5% ] 55.28% | 858,656 | 11.0% |
[ 55.5% - 56.0% ] 55.80% | 369,140 | 10.0% |
[ 56.0% - 56.5% ] 56.21% | 1,289,971 | 9.8% |
[ 56.5% - 57.0% ] 56.74% | 890,451 | 9.4% |
[ 57.0% - 57.5% ] 57.22% | 816,236 | 10.4% |
[ 57.5% - 58.0% ] 57.72% | 1,501,490 | 9.6% |
[ 58.0% - 58.5% ] 58.27% | 1,525,927 | 10.1% |
[ 58.5% - 59.0% ] 58.89% | 2,639,001 | 9.1% |
[ 59.0% - 59.5% ] 59.24% | 1,733,718 | 9.4% |
[ 59.5% - 60.0% ] 59.75% | 1,249,748 | 9.1% |
[ 60.0% - 60.5% ] 60.31% | 1,209,808 | 8.9% |
[ 60.5% - 61.0% ] 60.77% | 1,154,338 | 11.3% |
[ 61.0% - 61.5% ] 61.19% | 1,611,983 | 9.8% |
[ 61.5% - 62.0% ] 61.77% | 1,934,404 | 10.2% |
[ 62.0% - 62.5% ] 62.24% | 1,537,537 | 10.4% |
[ 62.5% - 63.0% ] 62.74% | 1,598,067 | 10.3% |
[ 63.0% - 63.5% ] 63.23% | 1,322,140 | 10.3% |
[ 63.5% - 64.0% ] 63.68% | 10,447,094 | 11.1% |
[ 64.0% - 64.5% ] 64.09% | 5,381,430 | 10.6% |
[ 64.5% - 65.0% ] 64.74% | 1,587,007 | 9.8% |
[ 65.0% - 65.5% ] 65.26% | 2,390,314 | 11.0% |
[ 65.5% - 66.0% ] 65.77% | 1,749,196 | 10.5% |
[ 66.0% - 66.5% ] 66.26% | 3,249,951 | 10.8% |
[ 66.5% - 67.0% ] 66.73% | 1,734,969 | 10.4% |
[ 67.0% - 67.5% ] 67.25% | 2,370,289 | 10.1% |
[ 67.5% - 68.0% ] 67.79% | 2,889,680 | 10.6% |
[ 68.0% - 68.5% ] 68.25% | 2,833,466 | 11.0% |
[ 68.5% - 69.0% ] 68.69% | 2,414,492 | 10.7% |
[ 69.0% - 69.5% ] 69.26% | 2,240,938 | 10.2% |
[ 69.5% - 70.0% ] 69.73% | 2,702,077 | 10.6% |
[ 70.0% - 70.5% ] 70.24% | 2,779,612 | 10.8% |
[ 70.5% - 71.0% ] 70.73% | 3,120,684 | 10.5% |
[ 71.0% - 71.5% ] 71.14% | 5,113,354 | 10.7% |
[ 71.5% - 72.0% ] 71.76% | 3,348,816 | 10.6% |
[ 72.0% - 72.5% ] 72.27% | 2,979,429 | 10.6% |
[ 72.5% - 73.0% ] 72.73% | 3,319,044 | 11.4% |
[ 73.0% - 73.5% ] 73.24% | 2,755,951 | 11.0% |
[ 73.5% - 74.0% ] 73.76% | 3,199,599 | 10.1% |
[ 74.0% - 74.5% ] 74.31% | 2,919,989 | 11.0% |
[ 74.5% - 75.0% ] 74.75% | 4,180,246 | 10.6% |
[ 75.0% - 75.5% ] 75.25% | 5,522,011 | 10.3% |
[ 75.5% - 76.0% ] 75.72% | 3,618,255 | 10.3% |
[ 76.0% - 76.5% ] 76.24% | 4,199,201 | 10.6% |
[ 76.5% - 77.0% ] 76.76% | 3,756,670 | 10.5% |
[ 77.0% - 77.5% ] 77.27% | 4,305,206 | 11.3% |
[ 77.5% - 78.0% ] 77.77% | 4,427,646 | 11.1% |
[ 78.0% - 78.5% ] 78.23% | 3,716,936 | 10.1% |
[ 78.5% - 79.0% ] 78.77% | 5,562,043 | 11.1% |
[ 79.0% - 79.5% ] 79.23% | 4,834,353 | 11.4% |
[ 79.5% - 80.0% ] 79.73% | 7,120,521 | 11.2% |
[ 80.0% - 80.5% ] 80.27% | 5,466,457 | 10.9% |
[ 80.5% - 81.0% ] 80.74% | 5,949,172 | 11.4% |
[ 81.0% - 81.5% ] 81.22% | 5,664,804 | 11.5% |
[ 81.5% - 82.0% ] 81.75% | 5,999,033 | 11.1% |
[ 82.0% - 82.5% ] 82.30% | 4,133,885 | 11.6% |
[ 82.5% - 83.0% ] 82.75% | 5,954,363 | 11.2% |
[ 83.0% - 83.5% ] 83.26% | 6,104,060 | 11.5% |
[ 83.5% - 84.0% ] 83.77% | 5,020,627 | 11.0% |
[ 84.0% - 84.5% ] 84.23% | 5,918,225 | 11.1% |
[ 84.5% - 85.0% ] 84.77% | 5,448,617 | 11.6% |
[ 85.0% - 85.5% ] 85.27% | 8,588,197 | 12.5% |
[ 85.5% - 86.0% ] 85.76% | 8,829,889 | 12.5% |
[ 86.0% - 86.5% ] 86.20% | 8,316,546 | 11.9% |
[ 86.5% - 87.0% ] 86.75% | 7,150,724 | 11.7% |
[ 87.0% - 87.5% ] 87.25% | 7,973,299 | 12.1% |
[ 87.5% - 88.0% ] 87.78% | 7,700,133 | 12.1% |
[ 88.0% - 88.5% ] 88.24% | 9,940,845 | 12.2% |
[ 88.5% - 89.0% ] 88.76% | 8,921,651 | 12.2% |
[ 89.0% - 89.5% ] 89.26% | 10,266,072 | 12.5% |
[ 89.5% - 90.0% ] 89.74% | 11,708,012 | 12.7% |
[ 90.0% - 90.5% ] 90.24% | 9,906,891 | 12.2% |
[ 90.5% - 91.0% ] 90.75% | 10,802,291 | 12.6% |
[ 91.0% - 91.5% ] 91.26% | 12,117,336 | 12.8% |
[ 91.5% - 92.0% ] 91.77% | 11,980,773 | 13.2% |
[ 92.0% - 92.5% ] 92.26% | 11,627,436 | 13.3% |
[ 92.5% - 93.0% ] 92.76% | 12,656,694 | 13.0% |
[ 93.0% - 93.5% ] 93.25% | 13,110,616 | 13.4% |
[ 93.5% - 94.0% ] 93.76% | 13,732,931 | 13.3% |
[ 94.0% - 94.5% ] 94.25% | 14,498,970 | 14.1% |
[ 94.5% - 95.0% ] 94.74% | 13,519,234 | 13.5% |
[ 95.0% - 95.5% ] 95.25% | 13,939,311 | 14.0% |
[ 95.5% - 96.0% ] 95.75% | 14,678,464 | 14.3% |
[ 96.0% - 96.5% ] 96.25% | 14,913,449 | 14.8% |
[ 96.5% - 97.0% ] 96.76% | 15,746,570 | 15.3% |
[ 97.0% - 97.5% ] 97.26% | 15,847,382 | 15.6% |
[ 97.5% - 98.0% ] 97.76% | 16,694,154 | 15.8% |
[ 98.0% - 98.5% ] 98.25% | 15,759,946 | 16.2% |
[ 98.5% - 99.0% ] 98.75% | 15,921,505 | 17.2% |
[ 99.0% - 99.5% ] 99.24% | 14,930,045 | 17.3% |
[ 99.5% - 100.0% ] 99.84% | 17,231,672 | 18.6% |