Nonimmigrants Self-Care Disability
COMPARE
Nonimmigrants
Select to Compare
Self-Care Disability
Nonimmigrants Self-Care Disability
2.6%
SELF-CARE DISABILITY
0.3/ 100
METRIC RATING
258th/ 347
METRIC RANK
Nonimmigrants Self-Care Disability Correlation Chart
The statistical analysis conducted on geographies consisting of 581,524,838 people shows a weak negative correlation between the proportion of Nonimmigrants and percentage of population with self-care disability in the United States with a correlation coefficient (R) of -0.250 and weighted average of 2.6%. On average, for every 1% (one percent) increase in Nonimmigrants within a typical geography, there is a decrease of 0.0097% in percentage of population with self-care disability.
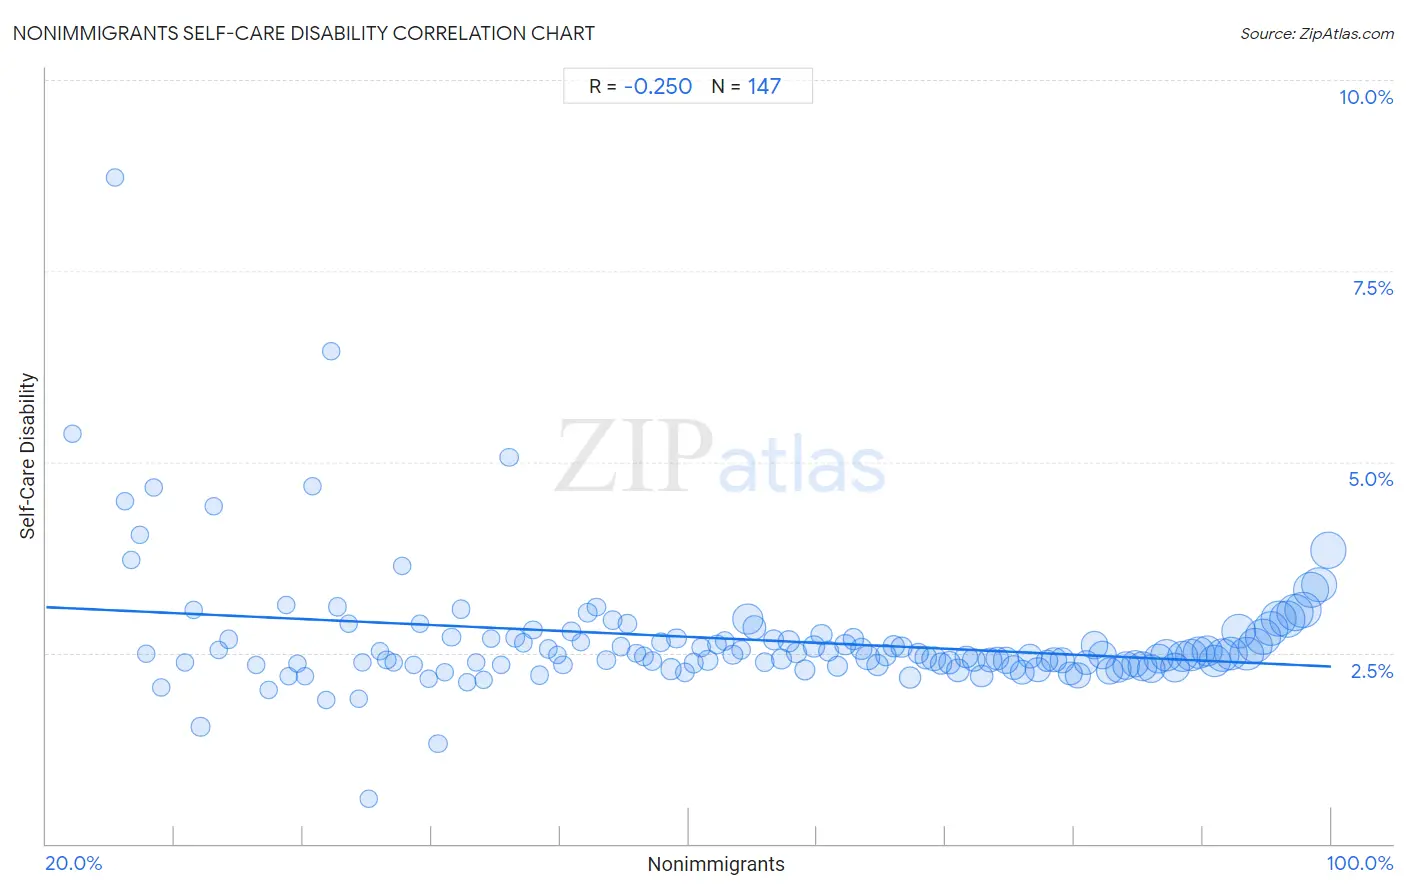
It is essential to understand that the correlation between the percentage of Nonimmigrants and percentage of population with self-care disability does not imply a direct cause-and-effect relationship. It remains uncertain whether the presence of Nonimmigrants influences an upward or downward trend in the level of percentage of population with self-care disability within an area, or if Nonimmigrants simply ended up residing in those areas with higher or lower levels of percentage of population with self-care disability due to other factors.
Demographics Similar to Nonimmigrants by Self-Care Disability
In terms of self-care disability, the demographic groups most similar to Nonimmigrants are Potawatomi (2.6%, a difference of 0.070%), Immigrants from Belarus (2.6%, a difference of 0.070%), Chippewa (2.6%, a difference of 0.11%), Arapaho (2.6%, a difference of 0.13%), and Immigrants from Central America (2.6%, a difference of 0.27%).
| Demographics | Rating | Rank | Self-Care Disability |
| Immigrants from Liberia | 0.4 /100 | #251 | Tragic 2.6% |
| Immigrants from Bangladesh | 0.4 /100 | #252 | Tragic 2.6% |
| Immigrants from Haiti | 0.3 /100 | #253 | Tragic 2.6% |
| Haitians | 0.3 /100 | #254 | Tragic 2.6% |
| Tsimshian | 0.3 /100 | #255 | Tragic 2.6% |
| Immigrants from Central America | 0.3 /100 | #256 | Tragic 2.6% |
| Potawatomi | 0.3 /100 | #257 | Tragic 2.6% |
| Nonimmigrants | 0.3 /100 | #258 | Tragic 2.6% |
| Immigrants from Belarus | 0.2 /100 | #259 | Tragic 2.6% |
| Chippewa | 0.2 /100 | #260 | Tragic 2.6% |
| Arapaho | 0.2 /100 | #261 | Tragic 2.6% |
| Shoshone | 0.2 /100 | #262 | Tragic 2.7% |
| Immigrants from Latin America | 0.2 /100 | #263 | Tragic 2.7% |
| Immigrants from Iran | 0.2 /100 | #264 | Tragic 2.7% |
| Immigrants from Nicaragua | 0.2 /100 | #265 | Tragic 2.7% |
Nonimmigrants Self-Care Disability Correlation Summary
| Measurement | Nonimmigrants Data | Self-Care Disability Data |
| Minimum | 21.6% | 0.58% |
| Maximum | 99.8% | 8.7% |
| Range | 78.2% | 8.1% |
| Mean | 63.0% | 2.7% |
| Median | 63.2% | 2.5% |
| Interquartile 25% (IQ1) | 44.8% | 2.3% |
| Interquartile 75% (IQ3) | 81.7% | 2.7% |
| Interquartile Range (IQR) | 36.9% | 0.36% |
| Standard Deviation (Sample) | 21.7% | 0.84% |
| Standard Deviation (Population) | 21.7% | 0.84% |
Correlation Details
| Nonimmigrants Percentile | Sample Size | Self-Care Disability |
[ 21.5% - 22.0% ] 21.63% | 42,081 | 5.4% |
[ 24.0% - 24.5% ] 24.26% | 1,018 | 8.7% |
[ 24.5% - 25.0% ] 24.90% | 71,088 | 4.5% |
[ 25.0% - 25.5% ] 25.32% | 46,798 | 3.7% |
[ 25.5% - 26.0% ] 25.85% | 257,738 | 4.0% |
[ 26.0% - 26.5% ] 26.25% | 19,399 | 2.5% |
[ 26.5% - 27.0% ] 26.69% | 29,830 | 4.7% |
[ 27.0% - 27.5% ] 27.15% | 57,226 | 2.1% |
[ 28.5% - 29.0% ] 28.63% | 45,620 | 2.4% |
[ 29.0% - 29.5% ] 29.21% | 138,035 | 3.1% |
[ 29.5% - 30.0% ] 29.61% | 115,169 | 1.5% |
[ 30.0% - 30.5% ] 30.42% | 766 | 4.4% |
[ 30.5% - 31.0% ] 30.74% | 90,791 | 2.5% |
[ 31.0% - 31.5% ] 31.32% | 119,624 | 2.7% |
[ 33.0% - 33.5% ] 33.09% | 109,332 | 2.3% |
[ 33.5% - 34.0% ] 33.83% | 152,851 | 2.0% |
[ 34.5% - 35.0% ] 34.92% | 51,333 | 3.1% |
[ 35.0% - 35.5% ] 35.12% | 104,741 | 2.2% |
[ 35.5% - 36.0% ] 35.67% | 109,357 | 2.4% |
[ 36.0% - 36.5% ] 36.09% | 117,426 | 2.2% |
[ 36.5% - 37.0% ] 36.58% | 24,955 | 4.7% |
[ 37.0% - 37.5% ] 37.42% | 26,090 | 1.9% |
[ 37.5% - 38.0% ] 37.72% | 93,794 | 6.5% |
[ 38.0% - 38.5% ] 38.12% | 128,746 | 3.1% |
[ 38.5% - 39.0% ] 38.87% | 58,079 | 2.9% |
[ 39.0% - 39.5% ] 39.47% | 36,392 | 1.9% |
[ 39.5% - 40.0% ] 39.70% | 154,064 | 2.4% |
[ 40.0% - 40.5% ] 40.08% | 15,664 | 0.58% |
[ 40.5% - 41.0% ] 40.81% | 86,903 | 2.5% |
[ 41.0% - 41.5% ] 41.20% | 221,458 | 2.4% |
[ 41.5% - 42.0% ] 41.66% | 97,943 | 2.4% |
[ 42.0% - 42.5% ] 42.16% | 596,139 | 3.6% |
[ 42.5% - 43.0% ] 42.87% | 110,508 | 2.3% |
[ 43.0% - 43.5% ] 43.28% | 75,873 | 2.9% |
[ 43.5% - 44.0% ] 43.83% | 89,843 | 2.2% |
[ 44.0% - 44.5% ] 44.39% | 148,289 | 1.3% |
[ 44.5% - 45.0% ] 44.82% | 482,691 | 2.2% |
[ 45.0% - 45.5% ] 45.22% | 593,586 | 2.7% |
[ 45.5% - 46.0% ] 45.83% | 370,692 | 3.1% |
[ 46.0% - 46.5% ] 46.19% | 463,452 | 2.1% |
[ 46.5% - 47.0% ] 46.77% | 130,421 | 2.4% |
[ 47.0% - 47.5% ] 47.24% | 236,458 | 2.1% |
[ 47.5% - 48.0% ] 47.68% | 204,872 | 2.7% |
[ 48.0% - 48.5% ] 48.33% | 305,734 | 2.3% |
[ 48.5% - 49.0% ] 48.82% | 319,766 | 5.1% |
[ 49.0% - 49.5% ] 49.21% | 730,167 | 2.7% |
[ 49.5% - 50.0% ] 49.72% | 640,494 | 2.6% |
[ 50.0% - 50.5% ] 50.31% | 165,718 | 2.8% |
[ 50.5% - 51.0% ] 50.72% | 846,575 | 2.2% |
[ 51.0% - 51.5% ] 51.26% | 842,067 | 2.5% |
[ 51.5% - 52.0% ] 51.86% | 168,854 | 2.5% |
[ 52.0% - 52.5% ] 52.17% | 277,496 | 2.3% |
[ 52.5% - 53.0% ] 52.70% | 841,252 | 2.8% |
[ 53.0% - 53.5% ] 53.28% | 694,636 | 2.6% |
[ 53.5% - 54.0% ] 53.70% | 774,831 | 3.0% |
[ 54.0% - 54.5% ] 54.25% | 704,973 | 3.1% |
[ 54.5% - 55.0% ] 54.86% | 871,621 | 2.4% |
[ 55.0% - 55.5% ] 55.28% | 858,196 | 2.9% |
[ 55.5% - 56.0% ] 55.80% | 369,140 | 2.6% |
[ 56.0% - 56.5% ] 56.21% | 1,286,121 | 2.9% |
[ 56.5% - 57.0% ] 56.74% | 888,429 | 2.5% |
[ 57.0% - 57.5% ] 57.22% | 815,790 | 2.4% |
[ 57.5% - 58.0% ] 57.72% | 1,498,140 | 2.4% |
[ 58.0% - 58.5% ] 58.27% | 1,523,600 | 2.6% |
[ 58.5% - 59.0% ] 58.89% | 2,636,336 | 2.3% |
[ 59.0% - 59.5% ] 59.24% | 1,733,444 | 2.7% |
[ 59.5% - 60.0% ] 59.75% | 1,247,162 | 2.2% |
[ 60.0% - 60.5% ] 60.31% | 1,201,339 | 2.4% |
[ 60.5% - 61.0% ] 60.77% | 1,153,997 | 2.6% |
[ 61.0% - 61.5% ] 61.19% | 1,609,841 | 2.4% |
[ 61.5% - 62.0% ] 61.77% | 1,933,804 | 2.6% |
[ 62.0% - 62.5% ] 62.24% | 1,535,793 | 2.7% |
[ 62.5% - 63.0% ] 62.74% | 1,595,737 | 2.5% |
[ 63.0% - 63.5% ] 63.23% | 1,316,204 | 2.5% |
[ 63.5% - 64.0% ] 63.68% | 10,444,994 | 2.9% |
[ 64.0% - 64.5% ] 64.09% | 5,379,585 | 2.8% |
[ 64.5% - 65.0% ] 64.74% | 1,586,317 | 2.4% |
[ 65.0% - 65.5% ] 65.26% | 2,388,398 | 2.7% |
[ 65.5% - 66.0% ] 65.77% | 1,748,793 | 2.4% |
[ 66.0% - 66.5% ] 66.26% | 3,243,983 | 2.7% |
[ 66.5% - 67.0% ] 66.73% | 1,733,775 | 2.5% |
[ 67.0% - 67.5% ] 67.25% | 2,367,531 | 2.3% |
[ 67.5% - 68.0% ] 67.79% | 2,885,245 | 2.6% |
[ 68.0% - 68.5% ] 68.25% | 2,833,196 | 2.7% |
[ 68.5% - 69.0% ] 68.69% | 2,413,734 | 2.5% |
[ 69.0% - 69.5% ] 69.26% | 2,238,358 | 2.3% |
[ 69.5% - 70.0% ] 69.73% | 2,692,173 | 2.6% |
[ 70.0% - 70.5% ] 70.24% | 2,776,453 | 2.7% |
[ 70.5% - 71.0% ] 70.73% | 3,111,753 | 2.6% |
[ 71.0% - 71.5% ] 71.14% | 5,098,343 | 2.4% |
[ 71.5% - 72.0% ] 71.76% | 3,347,069 | 2.3% |
[ 72.0% - 72.5% ] 72.27% | 2,975,617 | 2.5% |
[ 72.5% - 73.0% ] 72.73% | 3,315,933 | 2.6% |
[ 73.0% - 73.5% ] 73.24% | 2,751,860 | 2.6% |
[ 73.5% - 74.0% ] 73.76% | 3,195,957 | 2.2% |
[ 74.0% - 74.5% ] 74.31% | 2,913,603 | 2.5% |
[ 74.5% - 75.0% ] 74.75% | 4,175,628 | 2.4% |
[ 75.0% - 75.5% ] 75.25% | 5,515,954 | 2.4% |
[ 75.5% - 76.0% ] 75.72% | 3,598,620 | 2.4% |
[ 76.0% - 76.5% ] 76.24% | 4,193,484 | 2.4% |
[ 76.5% - 77.0% ] 76.76% | 3,754,146 | 2.3% |
[ 77.0% - 77.5% ] 77.27% | 4,298,503 | 2.4% |
[ 77.5% - 78.0% ] 77.77% | 4,414,046 | 2.4% |
[ 78.0% - 78.5% ] 78.23% | 3,707,344 | 2.2% |
[ 78.5% - 79.0% ] 78.77% | 5,544,933 | 2.4% |
[ 79.0% - 79.5% ] 79.23% | 4,819,098 | 2.4% |
[ 79.5% - 80.0% ] 79.73% | 7,110,037 | 2.4% |
[ 80.0% - 80.5% ] 80.27% | 5,460,656 | 2.3% |
[ 80.5% - 81.0% ] 80.74% | 5,932,557 | 2.2% |
[ 81.0% - 81.5% ] 81.22% | 5,655,895 | 2.5% |
[ 81.5% - 82.0% ] 81.75% | 5,989,321 | 2.3% |
[ 82.0% - 82.5% ] 82.30% | 4,129,106 | 2.4% |
[ 82.5% - 83.0% ] 82.75% | 5,944,476 | 2.4% |
[ 83.0% - 83.5% ] 83.26% | 6,082,538 | 2.4% |
[ 83.5% - 84.0% ] 83.77% | 5,011,196 | 2.2% |
[ 84.0% - 84.5% ] 84.23% | 5,906,826 | 2.2% |
[ 84.5% - 85.0% ] 84.77% | 5,426,756 | 2.4% |
[ 85.0% - 85.5% ] 85.27% | 8,576,103 | 2.6% |
[ 85.5% - 86.0% ] 85.76% | 8,789,400 | 2.5% |
[ 86.0% - 86.5% ] 86.20% | 8,290,713 | 2.3% |
[ 86.5% - 87.0% ] 86.75% | 7,123,209 | 2.3% |
[ 87.0% - 87.5% ] 87.25% | 7,908,398 | 2.3% |
[ 87.5% - 88.0% ] 87.78% | 7,676,653 | 2.4% |
[ 88.0% - 88.5% ] 88.24% | 9,908,978 | 2.3% |
[ 88.5% - 89.0% ] 88.76% | 8,886,313 | 2.3% |
[ 89.0% - 89.5% ] 89.26% | 10,214,738 | 2.4% |
[ 89.5% - 90.0% ] 89.74% | 11,678,979 | 2.5% |
[ 90.0% - 90.5% ] 90.24% | 9,868,656 | 2.3% |
[ 90.5% - 91.0% ] 90.75% | 10,761,707 | 2.4% |
[ 91.0% - 91.5% ] 91.26% | 12,074,663 | 2.5% |
[ 91.5% - 92.0% ] 91.77% | 11,931,903 | 2.5% |
[ 92.0% - 92.5% ] 92.26% | 11,564,038 | 2.5% |
[ 92.5% - 93.0% ] 92.76% | 12,582,145 | 2.4% |
[ 93.0% - 93.5% ] 93.25% | 13,056,081 | 2.5% |
[ 93.5% - 94.0% ] 93.76% | 13,620,310 | 2.5% |
[ 94.0% - 94.5% ] 94.25% | 14,415,320 | 2.8% |
[ 94.5% - 95.0% ] 94.74% | 13,424,212 | 2.5% |
[ 95.0% - 95.5% ] 95.25% | 13,853,171 | 2.6% |
[ 95.5% - 96.0% ] 95.75% | 14,594,860 | 2.7% |
[ 96.0% - 96.5% ] 96.25% | 14,785,202 | 2.8% |
[ 96.5% - 97.0% ] 96.76% | 15,633,616 | 3.0% |
[ 97.0% - 97.5% ] 97.26% | 15,768,954 | 2.9% |
[ 97.5% - 98.0% ] 97.76% | 16,543,073 | 3.0% |
[ 98.0% - 98.5% ] 98.25% | 15,642,281 | 3.1% |
[ 98.5% - 99.0% ] 98.75% | 15,801,686 | 3.3% |
[ 99.0% - 99.5% ] 99.24% | 14,813,405 | 3.4% |
[ 99.5% - 100.0% ] 99.83% | 16,107,889 | 3.8% |