Zip Codes with the Highest Percentage of Families with Income Below $10,000 in Tifton, GA
RELATED REPORTS & OPTIONS
Family Income | $0-10k
Tifton
Compare Zip Codes
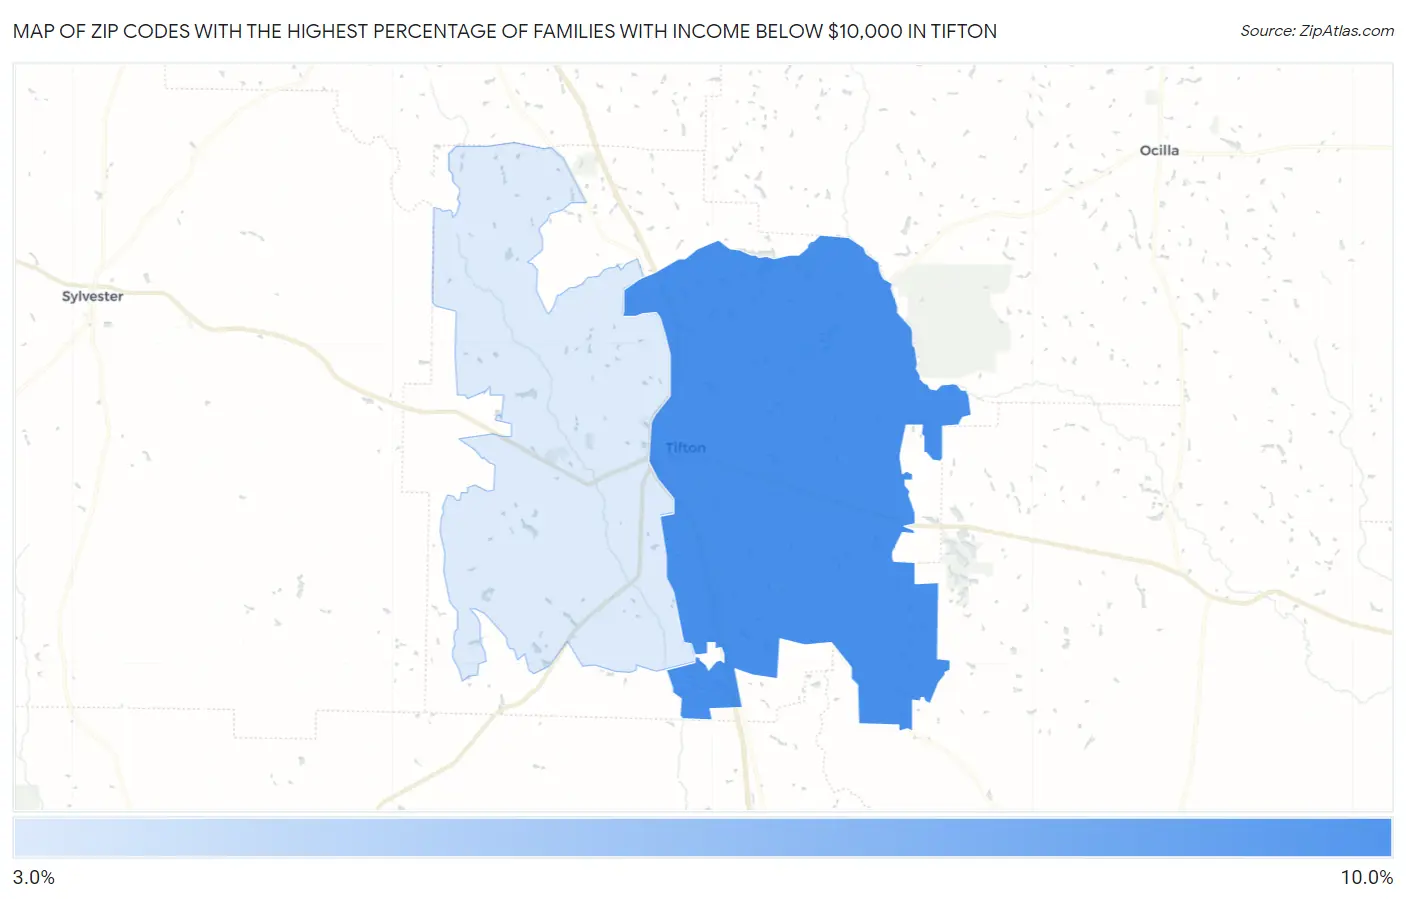
Map of Zip Codes with the Highest Percentage of Families with Income Below $10,000 in Tifton
3.1%
8.3%
Zip Codes with the Highest Percentage of Families with Income Below $10,000 in Tifton, GA
| Zip Code | Families with Income < $10k | vs State | vs National | |
| 1. | 31794 | 8.3% | 3.6%(+4.70)#94 | 3.1%(+5.20)#2,768 |
| 2. | 31793 | 3.1% | 3.6%(-0.500)#367 | 3.1%(=0.000)#10,904 |
1
Common Questions
What are the Top Zip Codes with the Highest Percentage of Families with Income Below $10,000 in Tifton, GA?
Top Zip Codes with the Highest Percentage of Families with Income Below $10,000 in Tifton, GA are:
What zip code has the Highest Percentage of Families with Income Below $10,000 in Tifton, GA?
31794 has the Highest Percentage of Families with Income Below $10,000 in Tifton, GA with 8.3%.
What is the Percentage of Families with Income Below $10,000 in Tifton, GA?
Percentage of Families with Income Below $10,000 in Tifton is 11.4%.
What is the Percentage of Families with Income Below $10,000 in Georgia?
Percentage of Families with Income Below $10,000 in Georgia is 3.6%.
What is the Percentage of Families with Income Below $10,000 in the United States?
Percentage of Families with Income Below $10,000 in the United States is 3.1%.