Zip Codes with the Highest Percentage of Families with Income Below $10,000 in Georgia
RELATED REPORTS & OPTIONS
Family Income | $0-10k
Georgia
Compare Zip Codes
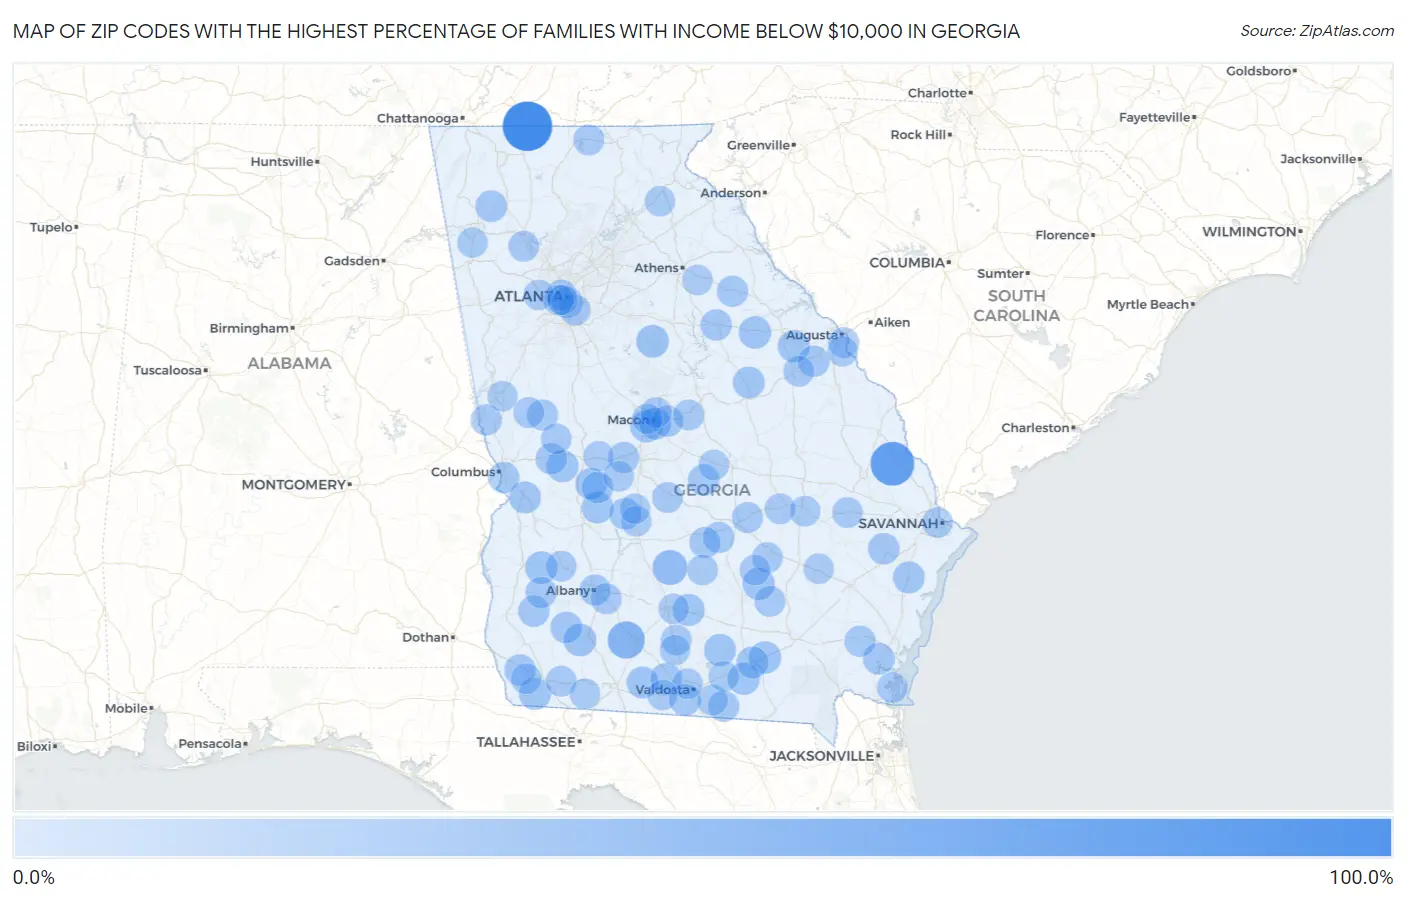
Map of Zip Codes with the Highest Percentage of Families with Income Below $10,000 in Georgia
0.0%
100.0%
Zip Codes with the Highest Percentage of Families with Income Below $10,000 in Georgia
| Zip Code | Families with Income < $10k | vs State | vs National | |
| 1. | 30751 | 100.0% | 3.6%(+96.4)#1 | 3.1%(+96.9)#4 |
| 2. | 30449 | 71.4% | 3.6%(+67.8)#2 | 3.1%(+68.3)#23 |
| 3. | 31753 | 40.0% | 3.6%(+36.4)#3 | 3.1%(+36.9)#110 |
| 4. | 31783 | 29.1% | 3.6%(+25.5)#4 | 3.1%(+26.0)#208 |
| 5. | 31085 | 18.6% | 3.6%(+15.0)#5 | 3.1%(+15.5)#551 |
| 6. | 31730 | 18.5% | 3.6%(+14.9)#6 | 3.1%(+15.4)#557 |
| 7. | 30821 | 18.1% | 3.6%(+14.5)#7 | 3.1%(+15.0)#582 |
| 8. | 31623 | 17.6% | 3.6%(+14.0)#8 | 3.1%(+14.5)#616 |
| 9. | 39886 | 17.3% | 3.6%(+13.7)#9 | 3.1%(+14.2)#640 |
| 10. | 31567 | 17.2% | 3.6%(+13.6)#10 | 3.1%(+14.1)#647 |
| 11. | 31206 | 17.1% | 3.6%(+13.5)#11 | 3.1%(+14.0)#657 |
| 12. | 31630 | 16.6% | 3.6%(+13.0)#12 | 3.1%(+13.5)#702 |
| 13. | 39819 | 16.1% | 3.6%(+12.5)#13 | 3.1%(+13.0)#740 |
| 14. | 30808 | 15.8% | 3.6%(+12.2)#14 | 3.1%(+12.7)#766 |
| 15. | 31058 | 15.5% | 3.6%(+11.9)#15 | 3.1%(+12.4)#804 |
| 16. | 31634 | 15.4% | 3.6%(+11.8)#16 | 3.1%(+12.3)#811 |
| 17. | 31201 | 15.3% | 3.6%(+11.7)#17 | 3.1%(+12.2)#823 |
| 18. | 31635 | 15.3% | 3.6%(+11.7)#18 | 3.1%(+12.2)#825 |
| 19. | 31711 | 15.2% | 3.6%(+11.6)#19 | 3.1%(+12.1)#845 |
| 20. | 31323 | 15.1% | 3.6%(+11.5)#20 | 3.1%(+12.0)#853 |
| 21. | 31749 | 15.0% | 3.6%(+11.4)#21 | 3.1%(+11.9)#863 |
| 22. | 31041 | 14.8% | 3.6%(+11.2)#22 | 3.1%(+11.7)#888 |
| 23. | 31720 | 14.8% | 3.6%(+11.2)#23 | 3.1%(+11.7)#892 |
| 24. | 31094 | 14.7% | 3.6%(+11.1)#24 | 3.1%(+11.6)#898 |
| 25. | 31805 | 14.6% | 3.6%(+11.0)#25 | 3.1%(+11.5)#907 |
| 26. | 39870 | 14.3% | 3.6%(+10.7)#26 | 3.1%(+11.2)#937 |
| 27. | 30733 | 14.1% | 3.6%(+10.5)#27 | 3.1%(+11.0)#962 |
| 28. | 31638 | 13.9% | 3.6%(+10.3)#28 | 3.1%(+10.8)#990 |
| 29. | 31051 | 13.9% | 3.6%(+10.3)#29 | 3.1%(+10.8)#996 |
| 30. | 31068 | 13.5% | 3.6%(+9.90)#30 | 3.1%(+10.4)#1,047 |
| 31. | 31565 | 13.4% | 3.6%(+9.80)#31 | 3.1%(+10.3)#1,061 |
| 32. | 31601 | 13.3% | 3.6%(+9.70)#32 | 3.1%(+10.2)#1,066 |
| 33. | 30805 | 13.1% | 3.6%(+9.50)#33 | 3.1%(+10.00)#1,107 |
| 34. | 39813 | 13.0% | 3.6%(+9.40)#34 | 3.1%(+9.90)#1,119 |
| 35. | 39859 | 13.0% | 3.6%(+9.40)#35 | 3.1%(+9.90)#1,123 |
| 36. | 31315 | 12.8% | 3.6%(+9.20)#36 | 3.1%(+9.70)#1,156 |
| 37. | 31012 | 12.8% | 3.6%(+9.20)#37 | 3.1%(+9.70)#1,165 |
| 38. | 30665 | 12.8% | 3.6%(+9.20)#38 | 3.1%(+9.70)#1,179 |
| 39. | 31217 | 12.3% | 3.6%(+8.70)#39 | 3.1%(+9.20)#1,262 |
| 40. | 31566 | 12.3% | 3.6%(+8.70)#40 | 3.1%(+9.20)#1,266 |
| 41. | 30660 | 12.3% | 3.6%(+8.70)#41 | 3.1%(+9.20)#1,268 |
| 42. | 31810 | 12.1% | 3.6%(+8.50)#42 | 3.1%(+9.00)#1,314 |
| 43. | 31903 | 11.9% | 3.6%(+8.30)#43 | 3.1%(+8.80)#1,340 |
| 44. | 31060 | 11.9% | 3.6%(+8.30)#44 | 3.1%(+8.80)#1,353 |
| 45. | 30315 | 11.8% | 3.6%(+8.20)#45 | 3.1%(+8.70)#1,367 |
| 46. | 39866 | 11.8% | 3.6%(+8.20)#46 | 3.1%(+8.70)#1,378 |
| 47. | 31030 | 11.5% | 3.6%(+7.90)#47 | 3.1%(+8.40)#1,447 |
| 48. | 31648 | 11.4% | 3.6%(+7.80)#48 | 3.1%(+8.30)#1,492 |
| 49. | 31833 | 11.3% | 3.6%(+7.70)#49 | 3.1%(+8.20)#1,504 |
| 50. | 31701 | 11.2% | 3.6%(+7.60)#50 | 3.1%(+8.10)#1,530 |
| 51. | 31816 | 11.1% | 3.6%(+7.50)#51 | 3.1%(+8.00)#1,560 |
| 52. | 30411 | 11.1% | 3.6%(+7.50)#52 | 3.1%(+8.00)#1,561 |
| 53. | 31077 | 11.1% | 3.6%(+7.50)#53 | 3.1%(+8.00)#1,570 |
| 54. | 31636 | 10.6% | 3.6%(+7.00)#54 | 3.1%(+7.50)#1,704 |
| 55. | 30288 | 10.6% | 3.6%(+7.00)#55 | 3.1%(+7.50)#1,705 |
| 56. | 30560 | 10.6% | 3.6%(+7.00)#56 | 3.1%(+7.50)#1,710 |
| 57. | 30833 | 10.6% | 3.6%(+7.00)#57 | 3.1%(+7.50)#1,712 |
| 58. | 31705 | 10.4% | 3.6%(+6.80)#58 | 3.1%(+7.30)#1,777 |
| 59. | 31036 | 10.4% | 3.6%(+6.80)#59 | 3.1%(+7.30)#1,781 |
| 60. | 31031 | 10.4% | 3.6%(+6.80)#60 | 3.1%(+7.30)#1,783 |
| 61. | 30901 | 10.0% | 3.6%(+6.40)#61 | 3.1%(+6.90)#1,907 |
| 62. | 39834 | 10.0% | 3.6%(+6.40)#62 | 3.1%(+6.90)#1,918 |
| 63. | 30137 | 10.0% | 3.6%(+6.40)#63 | 3.1%(+6.90)#1,919 |
| 64. | 30314 | 9.8% | 3.6%(+6.20)#64 | 3.1%(+6.70)#1,985 |
| 65. | 31830 | 9.8% | 3.6%(+6.20)#65 | 3.1%(+6.70)#2,004 |
| 66. | 31750 | 9.7% | 3.6%(+6.10)#66 | 3.1%(+6.60)#2,033 |
| 67. | 31647 | 9.7% | 3.6%(+6.10)#67 | 3.1%(+6.60)#2,041 |
| 68. | 39842 | 9.6% | 3.6%(+6.00)#68 | 3.1%(+6.50)#2,076 |
| 69. | 31554 | 9.6% | 3.6%(+6.00)#69 | 3.1%(+6.50)#2,077 |
| 70. | 31539 | 9.4% | 3.6%(+5.80)#70 | 3.1%(+6.30)#2,159 |
| 71. | 30417 | 9.4% | 3.6%(+5.80)#71 | 3.1%(+6.30)#2,161 |
| 72. | 39825 | 9.3% | 3.6%(+5.70)#72 | 3.1%(+6.20)#2,213 |
| 73. | 30410 | 9.3% | 3.6%(+5.70)#73 | 3.1%(+6.20)#2,217 |
| 74. | 31649 | 9.3% | 3.6%(+5.70)#74 | 3.1%(+6.20)#2,223 |
| 75. | 31532 | 9.3% | 3.6%(+5.70)#75 | 3.1%(+6.20)#2,229 |
| 76. | 30311 | 9.2% | 3.6%(+5.60)#76 | 3.1%(+6.10)#2,244 |
| 77. | 31558 | 9.2% | 3.6%(+5.60)#77 | 3.1%(+6.10)#2,246 |
| 78. | 31211 | 9.2% | 3.6%(+5.60)#78 | 3.1%(+6.10)#2,251 |
| 79. | 31057 | 9.2% | 3.6%(+5.60)#79 | 3.1%(+6.10)#2,280 |
| 80. | 31602 | 9.1% | 3.6%(+5.50)#80 | 3.1%(+6.00)#2,295 |
| 81. | 31827 | 9.1% | 3.6%(+5.50)#81 | 3.1%(+6.00)#2,324 |
| 82. | 30906 | 9.0% | 3.6%(+5.40)#82 | 3.1%(+5.90)#2,352 |
| 83. | 30436 | 8.9% | 3.6%(+5.30)#83 | 3.1%(+5.80)#2,410 |
| 84. | 31022 | 8.9% | 3.6%(+5.30)#84 | 3.1%(+5.80)#2,424 |
| 85. | 30619 | 8.9% | 3.6%(+5.30)#85 | 3.1%(+5.80)#2,428 |
| 86. | 31563 | 8.9% | 3.6%(+5.30)#86 | 3.1%(+5.80)#2,431 |
| 87. | 31415 | 8.8% | 3.6%(+5.20)#87 | 3.1%(+5.70)#2,461 |
| 88. | 31092 | 8.7% | 3.6%(+5.10)#88 | 3.1%(+5.60)#2,524 |
| 89. | 31204 | 8.6% | 3.6%(+5.00)#89 | 3.1%(+5.50)#2,559 |
| 90. | 31643 | 8.5% | 3.6%(+4.90)#90 | 3.1%(+5.40)#2,642 |
| 91. | 30122 | 8.4% | 3.6%(+4.80)#91 | 3.1%(+5.30)#2,714 |
| 92. | 30310 | 8.4% | 3.6%(+4.80)#92 | 3.1%(+5.30)#2,716 |
| 93. | 39828 | 8.4% | 3.6%(+4.80)#93 | 3.1%(+5.30)#2,723 |
| 94. | 31794 | 8.3% | 3.6%(+4.70)#94 | 3.1%(+5.20)#2,768 |
| 95. | 31620 | 8.3% | 3.6%(+4.70)#95 | 3.1%(+5.20)#2,777 |
| 96. | 30147 | 8.3% | 3.6%(+4.70)#96 | 3.1%(+5.20)#2,794 |
| 97. | 31076 | 8.3% | 3.6%(+4.70)#97 | 3.1%(+5.20)#2,798 |
| 98. | 31070 | 8.3% | 3.6%(+4.70)#98 | 3.1%(+5.20)#2,808 |
| 99. | 30510 | 8.2% | 3.6%(+4.60)#99 | 3.1%(+5.10)#2,857 |
| 100. | 30241 | 8.1% | 3.6%(+4.50)#100 | 3.1%(+5.00)#2,903 |
Common Questions
What are the Top 10 Zip Codes with the Highest Percentage of Families with Income Below $10,000 in Georgia?
Top 10 Zip Codes with the Highest Percentage of Families with Income Below $10,000 in Georgia are:
What zip code has the Highest Percentage of Families with Income Below $10,000 in Georgia?
30751 has the Highest Percentage of Families with Income Below $10,000 in Georgia with 100.0%.
What is the Percentage of Families with Income Below $10,000 in the State of Georgia?
Percentage of Families with Income Below $10,000 in Georgia is 3.6%.
What is the Percentage of Families with Income Below $10,000 in the United States?
Percentage of Families with Income Below $10,000 in the United States is 3.1%.