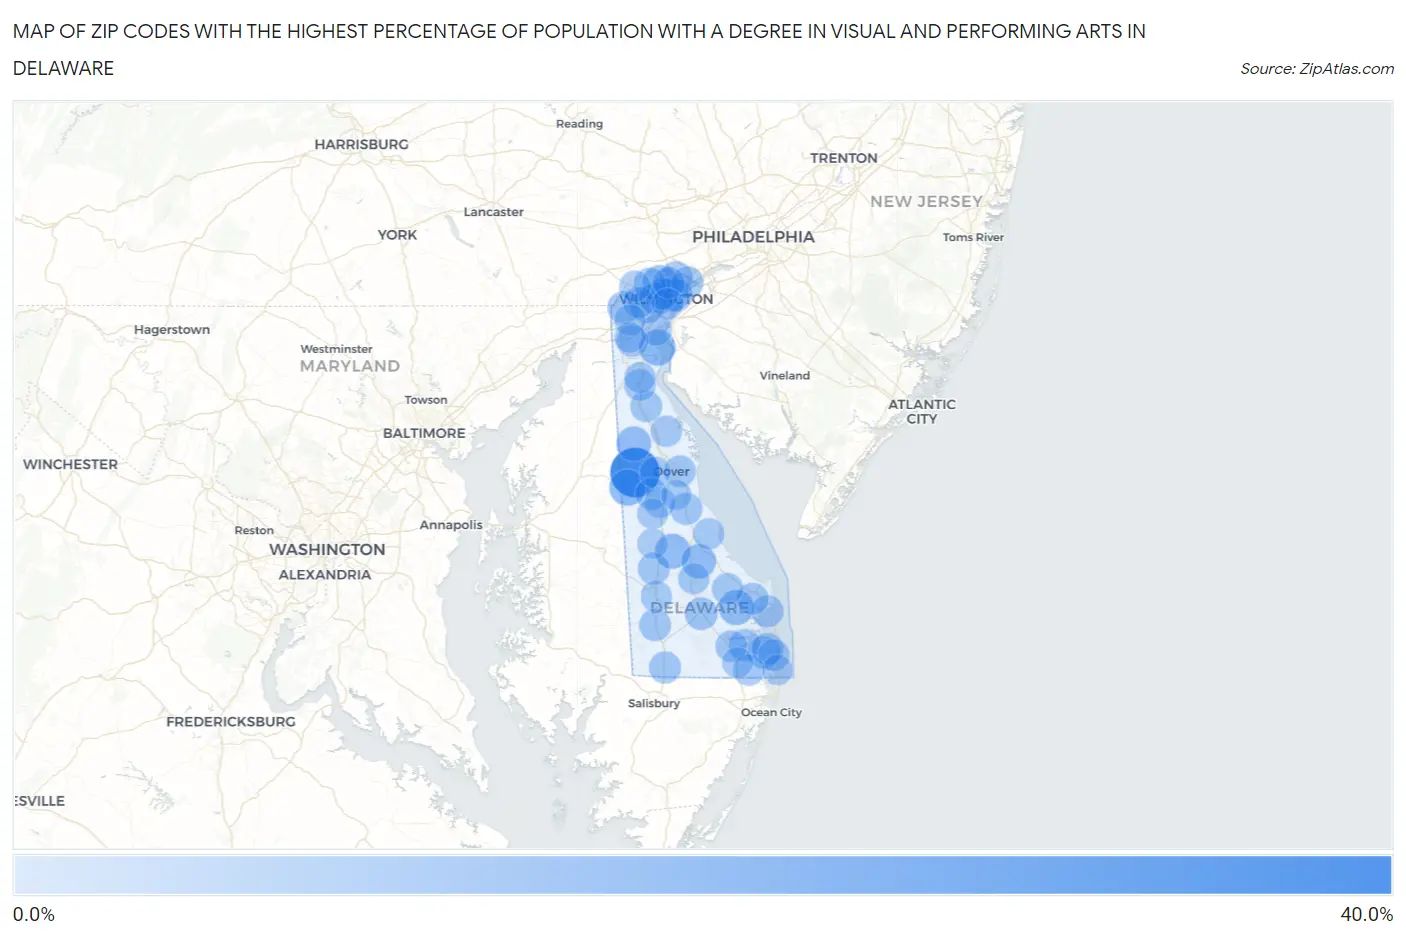
Zip Codes with the Highest Percentage of Population with a Degree in Visual and Performing Arts in Delaware
RELATED REPORTS & OPTIONS
Visual and Performing Arts
Delaware
Compare Zip Codes
Map of Zip Codes with the Highest Percentage of Population with a Degree in Visual and Performing Arts in Delaware
0.0%
40.0%

Zip Codes with the Highest Percentage of Population with a Degree in Visual and Performing Arts in Delaware
| Zip Code | % Graduates | vs State | vs National | |
| 1. | 19953 | 36.1% | 2.9%(+33.2)#1 | 4.3%(+31.9)#147 |
| 2. | 19964 | 11.2% | 2.9%(+8.31)#2 | 4.3%(+6.96)#1,463 |
| 3. | 19706 | 10.9% | 2.9%(+8.03)#3 | 4.3%(+6.69)#1,547 |
| 4. | 19951 | 9.1% | 2.9%(+6.14)#4 | 4.3%(+4.80)#2,241 |
| 5. | 19954 | 8.9% | 2.9%(+5.96)#5 | 4.3%(+4.62)#2,318 |
| 6. | 19938 | 8.3% | 2.9%(+5.37)#6 | 4.3%(+4.02)#2,670 |
| 7. | 19732 | 8.2% | 2.9%(+5.29)#7 | 4.3%(+3.94)#2,719 |
| 8. | 19960 | 7.8% | 2.9%(+4.88)#8 | 4.3%(+3.53)#2,996 |
| 9. | 19802 | 6.2% | 2.9%(+3.28)#9 | 4.3%(+1.93)#4,616 |
| 10. | 19804 | 5.9% | 2.9%(+2.97)#10 | 4.3%(+1.62)#5,052 |
| 11. | 19809 | 5.0% | 2.9%(+2.09)#11 | 4.3%(+0.748)#6,625 |
| 12. | 19805 | 4.9% | 2.9%(+1.98)#12 | 4.3%(+0.640)#6,876 |
| 13. | 19947 | 4.6% | 2.9%(+1.69)#13 | 4.3%(+0.348)#7,558 |
| 14. | 19711 | 4.5% | 2.9%(+1.55)#14 | 4.3%(+0.207)#7,916 |
| 15. | 19967 | 4.3% | 2.9%(+1.38)#15 | 4.3%(+0.041)#8,374 |
| 16. | 19810 | 4.0% | 2.9%(+1.07)#16 | 4.3%(-0.275)#9,323 |
| 17. | 19806 | 3.7% | 2.9%(+0.822)#17 | 4.3%(-0.522)#10,057 |
| 18. | 19971 | 3.7% | 2.9%(+0.775)#18 | 4.3%(-0.569)#10,225 |
| 19. | 19946 | 3.6% | 2.9%(+0.668)#19 | 4.3%(-0.675)#10,575 |
| 20. | 19973 | 3.5% | 2.9%(+0.619)#20 | 4.3%(-0.725)#10,791 |
| 21. | 19703 | 3.4% | 2.9%(+0.490)#21 | 4.3%(-0.854)#11,263 |
| 22. | 19940 | 3.3% | 2.9%(+0.418)#22 | 4.3%(-0.925)#11,511 |
| 23. | 19950 | 3.2% | 2.9%(+0.299)#23 | 4.3%(-1.04)#11,959 |
| 24. | 19807 | 3.2% | 2.9%(+0.269)#24 | 4.3%(-1.07)#12,065 |
| 25. | 19958 | 3.1% | 2.9%(+0.239)#25 | 4.3%(-1.10)#12,170 |
| 26. | 19939 | 3.0% | 2.9%(+0.138)#26 | 4.3%(-1.21)#12,558 |
| 27. | 19970 | 3.0% | 2.9%(+0.042)#27 | 4.3%(-1.30)#12,918 |
| 28. | 19803 | 2.9% | 2.9%(+0.018)#28 | 4.3%(-1.33)#12,995 |
| 29. | 19934 | 2.9% | 2.9%(-0.006)#29 | 4.3%(-1.35)#13,096 |
| 30. | 19701 | 2.9% | 2.9%(-0.007)#30 | 4.3%(-1.35)#13,098 |
| 31. | 19734 | 2.8% | 2.9%(-0.094)#31 | 4.3%(-1.44)#13,435 |
| 32. | 19966 | 2.8% | 2.9%(-0.133)#32 | 4.3%(-1.48)#13,590 |
| 33. | 19901 | 2.7% | 2.9%(-0.233)#33 | 4.3%(-1.58)#13,996 |
| 34. | 19930 | 2.6% | 2.9%(-0.291)#34 | 4.3%(-1.63)#14,191 |
| 35. | 19730 | 2.5% | 2.9%(-0.424)#35 | 4.3%(-1.77)#14,679 |
| 36. | 19808 | 2.5% | 2.9%(-0.438)#36 | 4.3%(-1.78)#14,720 |
| 37. | 19968 | 2.0% | 2.9%(-0.859)#37 | 4.3%(-2.20)#16,258 |
| 38. | 19720 | 2.0% | 2.9%(-0.889)#38 | 4.3%(-2.23)#16,389 |
| 39. | 19975 | 2.0% | 2.9%(-0.932)#39 | 4.3%(-2.28)#16,528 |
| 40. | 19707 | 2.0% | 2.9%(-0.941)#40 | 4.3%(-2.28)#16,557 |
| 41. | 19977 | 2.0% | 2.9%(-0.946)#41 | 4.3%(-2.29)#16,571 |
| 42. | 19801 | 1.9% | 2.9%(-0.984)#42 | 4.3%(-2.33)#16,703 |
| 43. | 19963 | 1.9% | 2.9%(-1.05)#43 | 4.3%(-2.39)#16,922 |
| 44. | 19904 | 1.8% | 2.9%(-1.14)#44 | 4.3%(-2.48)#17,239 |
| 45. | 19713 | 1.7% | 2.9%(-1.16)#45 | 4.3%(-2.51)#17,339 |
| 46. | 19933 | 1.6% | 2.9%(-1.33)#46 | 4.3%(-2.68)#17,921 |
| 47. | 19709 | 1.5% | 2.9%(-1.41)#47 | 4.3%(-2.76)#18,170 |
| 48. | 19941 | 1.4% | 2.9%(-1.53)#48 | 4.3%(-2.87)#18,527 |
| 49. | 19979 | 1.4% | 2.9%(-1.56)#49 | 4.3%(-2.90)#18,602 |
| 50. | 19702 | 1.0% | 2.9%(-1.88)#50 | 4.3%(-3.23)#19,601 |
| 51. | 19945 | 0.95% | 2.9%(-1.96)#51 | 4.3%(-3.30)#19,815 |
| 52. | 19944 | 0.59% | 2.9%(-2.32)#52 | 4.3%(-3.66)#20,581 |
| 53. | 19943 | 0.51% | 2.9%(-2.40)#53 | 4.3%(-3.74)#20,750 |
| 54. | 19952 | 0.40% | 2.9%(-2.51)#54 | 4.3%(-3.85)#20,957 |
| 55. | 19962 | 0.15% | 2.9%(-2.76)#55 | 4.3%(-4.10)#21,215 |
1
Common Questions
What are the Top 10 Zip Codes with the Highest Percentage of Population with a Degree in Visual and Performing Arts in Delaware?
Top 10 Zip Codes with the Highest Percentage of Population with a Degree in Visual and Performing Arts in Delaware are:
What zip code has the Highest Percentage of Population with a Degree in Visual and Performing Arts in Delaware?
19953 has the Highest Percentage of Population with a Degree in Visual and Performing Arts in Delaware with 36.1%.
What is the Percentage of Population with a Degree in Visual and Performing Arts in the State of Delaware?
Percentage of Population with a Degree in Visual and Performing Arts in Delaware is 2.9%.
What is the Percentage of Population with a Degree in Visual and Performing Arts in the United States?
Percentage of Population with a Degree in Visual and Performing Arts in the United States is 4.3%.