York County, VA Map & Demographics
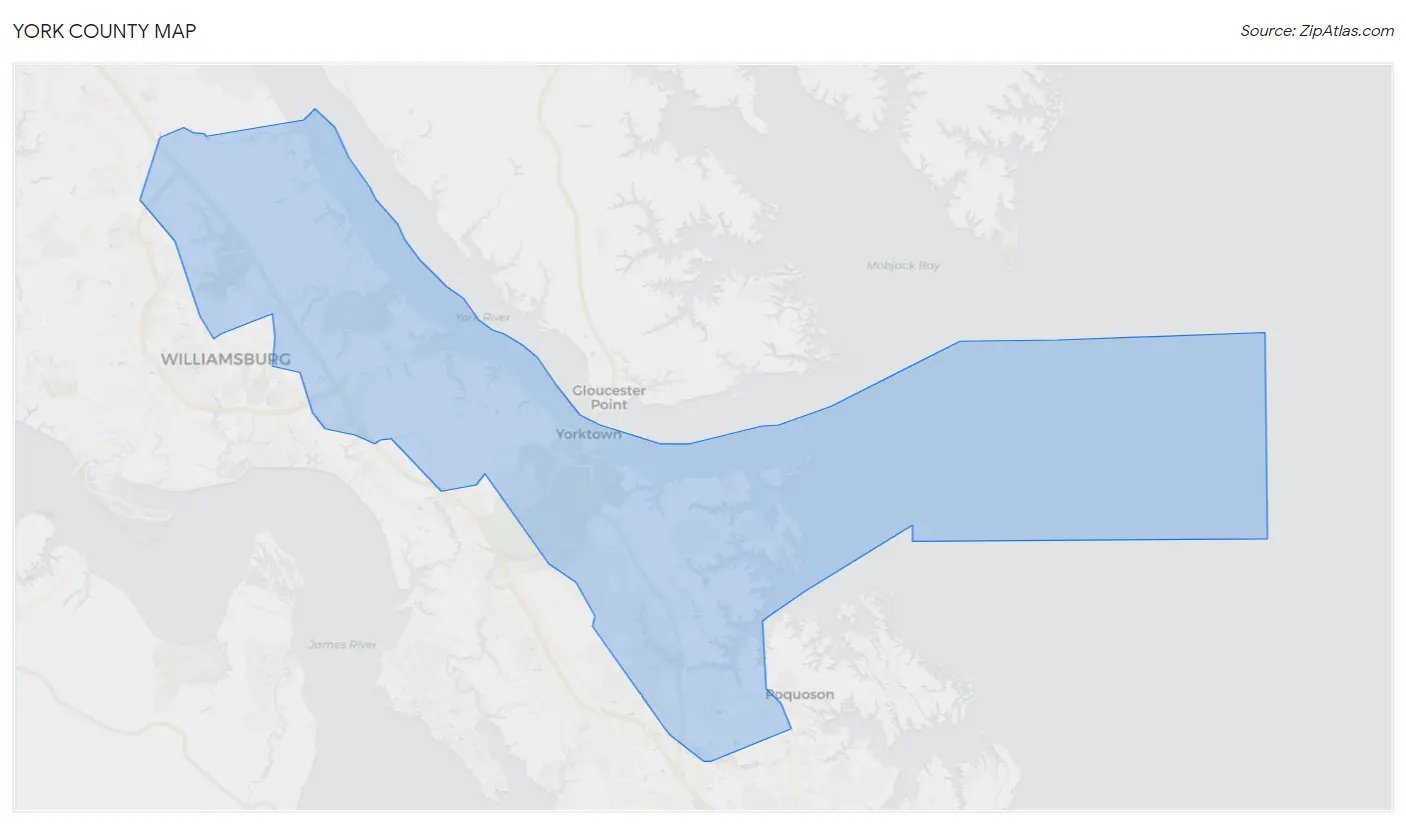
York County Map
York County Overview
$47,722
PER CAPITA INCOME
$123,510
AVG FAMILY INCOME
$105,154
AVG HOUSEHOLD INCOME
27.9%
WAGE / INCOME GAP [ % ]
72.1¢/ $1
WAGE / INCOME GAP [ $ ]
$9,671
FAMILY INCOME DEFICIT
0.38
INEQUALITY / GINI INDEX
70,238
TOTAL POPULATION
34,866
MALE POPULATION
35,372
FEMALE POPULATION
98.57
MALES / 100 FEMALES
101.45
FEMALES / 100 MALES
39.7
MEDIAN AGE
3.2
AVG FAMILY SIZE
2.7
AVG HOUSEHOLD SIZE
37,453
LABOR FORCE [ PEOPLE ]
67.0%
PERCENT IN LABOR FORCE
4.2%
UNEMPLOYMENT RATE
York County Area Codes
Income in York County
Income Overview in York County
Per Capita Income in York County is $47,722, while median incomes of families and households are $123,510 and $105,154 respectively.
| Characteristic | Number | Measure |
| Per Capita Income | 70,238 | $47,722 |
| Median Family Income | 18,805 | $123,510 |
| Mean Family Income | 18,805 | $144,018 |
| Median Household Income | 25,878 | $105,154 |
| Mean Household Income | 25,878 | $124,748 |
| Income Deficit | 18,805 | $9,671 |
| Wage / Income Gap (%) | 70,238 | 27.87% |
| Wage / Income Gap ($) | 70,238 | 72.13¢ per $1 |
| Gini / Inequality Index | 70,238 | 0.38 |
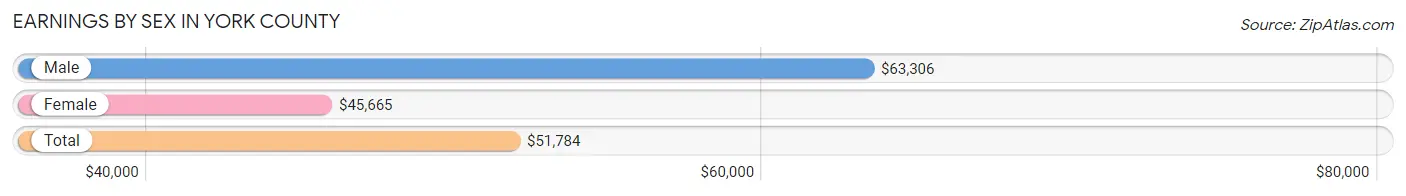
Earnings by Sex in York County
Average Earnings in York County are $51,784, $63,306 for men and $45,665 for women, a difference of 27.9%.
| Sex | Number | Average Earnings |
| Male | 21,183 (55.0%) | $63,306 |
| Female | 17,317 (45.0%) | $45,665 |
| Total | 38,500 (100.0%) | $51,784 |
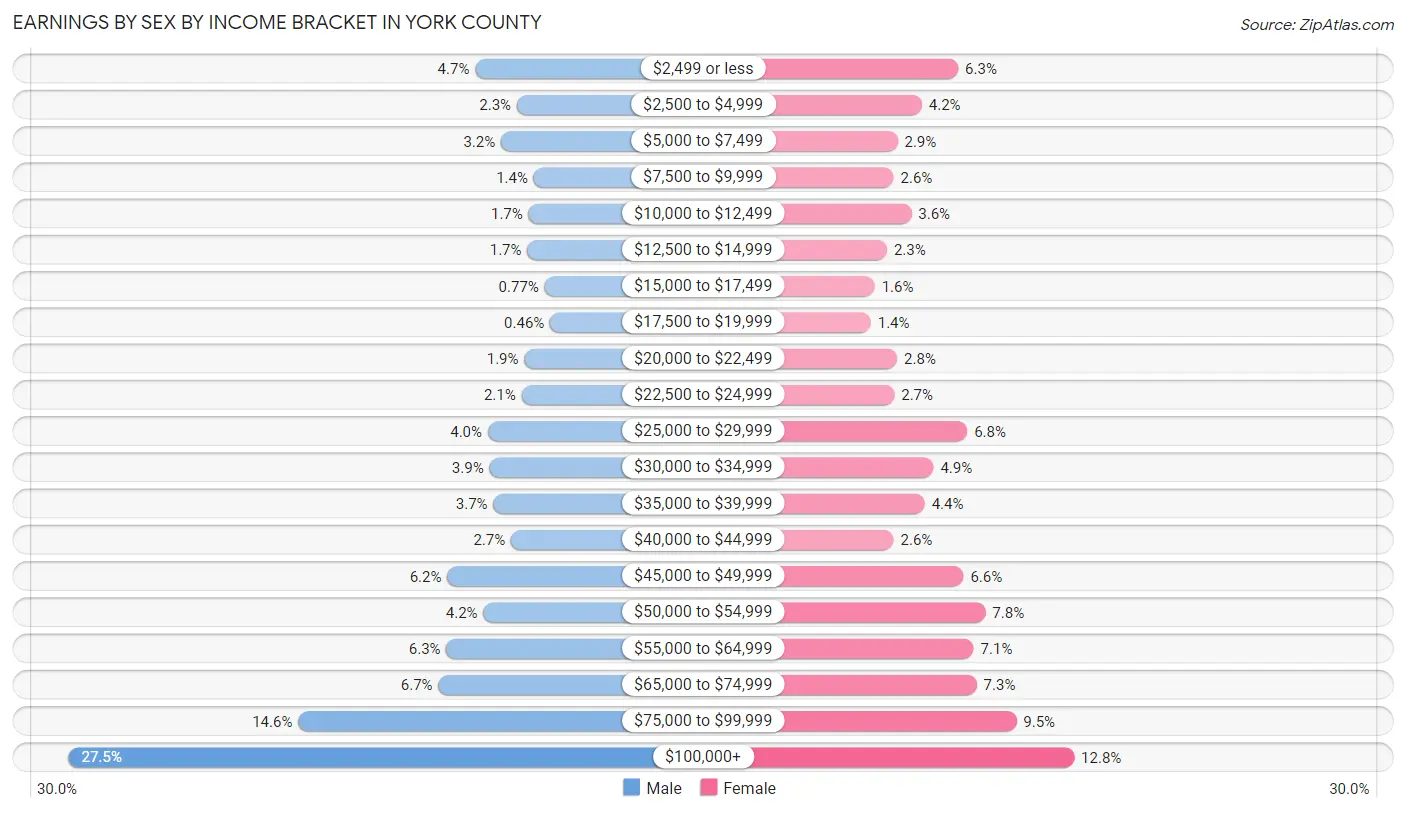
Earnings by Sex by Income Bracket in York County
The most common earnings brackets in York County are $100,000+ for men (5,831 | 27.5%) and $100,000+ for women (2,213 | 12.8%).
| Income | Male | Female |
| $2,499 or less | 990 (4.7%) | 1,084 (6.3%) |
| $2,500 to $4,999 | 494 (2.3%) | 730 (4.2%) |
| $5,000 to $7,499 | 682 (3.2%) | 493 (2.9%) |
| $7,500 to $9,999 | 293 (1.4%) | 455 (2.6%) |
| $10,000 to $12,499 | 354 (1.7%) | 629 (3.6%) |
| $12,500 to $14,999 | 369 (1.7%) | 391 (2.3%) |
| $15,000 to $17,499 | 164 (0.8%) | 272 (1.6%) |
| $17,500 to $19,999 | 97 (0.5%) | 233 (1.3%) |
| $20,000 to $22,499 | 405 (1.9%) | 490 (2.8%) |
| $22,500 to $24,999 | 438 (2.1%) | 462 (2.7%) |
| $25,000 to $29,999 | 839 (4.0%) | 1,172 (6.8%) |
| $30,000 to $34,999 | 819 (3.9%) | 843 (4.9%) |
| $35,000 to $39,999 | 773 (3.6%) | 759 (4.4%) |
| $40,000 to $44,999 | 564 (2.7%) | 456 (2.6%) |
| $45,000 to $49,999 | 1,322 (6.2%) | 1,136 (6.6%) |
| $50,000 to $54,999 | 892 (4.2%) | 1,349 (7.8%) |
| $55,000 to $64,999 | 1,333 (6.3%) | 1,234 (7.1%) |
| $65,000 to $74,999 | 1,427 (6.7%) | 1,265 (7.3%) |
| $75,000 to $99,999 | 3,097 (14.6%) | 1,651 (9.5%) |
| $100,000+ | 5,831 (27.5%) | 2,213 (12.8%) |
| Total | 21,183 (100.0%) | 17,317 (100.0%) |
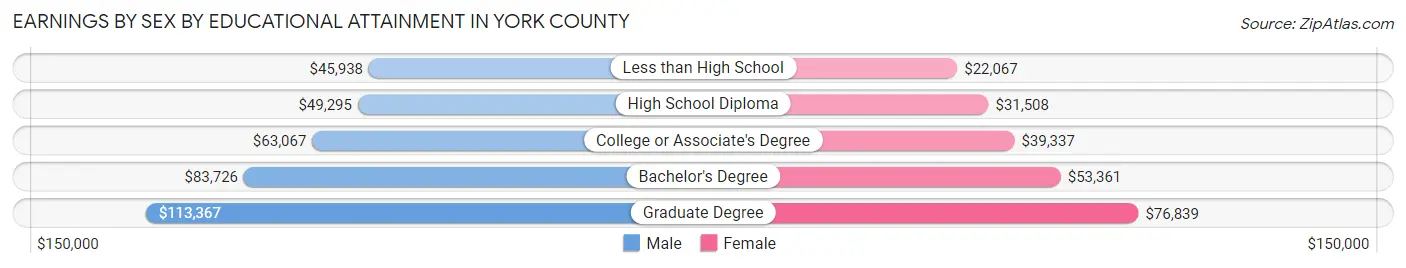
Earnings by Sex by Educational Attainment in York County
Average earnings in York County are $75,737 for men and $50,035 for women, a difference of 33.9%. Men with an educational attainment of graduate degree enjoy the highest average annual earnings of $113,367, while those with less than high school education earn the least with $45,938. Women with an educational attainment of graduate degree earn the most with the average annual earnings of $76,839, while those with less than high school education have the smallest earnings of $22,067.
| Educational Attainment | Male Income | Female Income |
| Less than High School | $45,938 | $22,067 |
| High School Diploma | $49,295 | $31,508 |
| College or Associate's Degree | $63,067 | $39,337 |
| Bachelor's Degree | $83,726 | $53,361 |
| Graduate Degree | $113,367 | $76,839 |
| Total | $75,737 | $50,035 |
Family Income in York County
Family Income Brackets in York County
According to the York County family income data, there are 5,284 families falling into the $100,000 to $149,999 income range, which is the most common income bracket and makes up 28.1% of all families. Conversely, the $10,000 to $14,999 income bracket is the least frequent group with only 75 families (0.4%) belonging to this category.
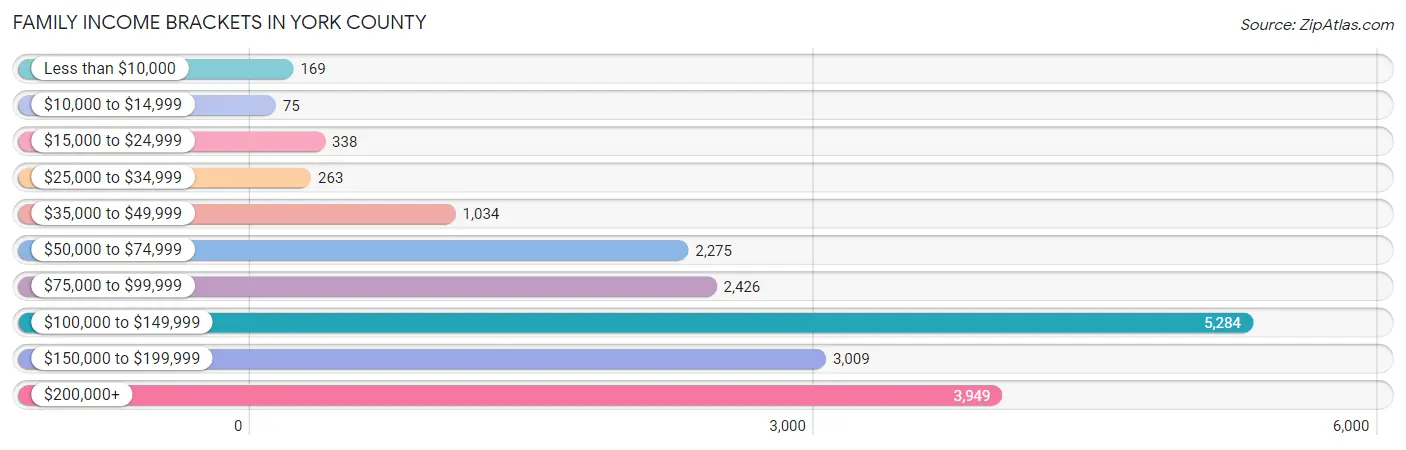
| Income Bracket | # Families | % Families |
| Less than $10,000 | 169 | 0.9% |
| $10,000 to $14,999 | 75 | 0.4% |
| $15,000 to $24,999 | 338 | 1.8% |
| $25,000 to $34,999 | 263 | 1.4% |
| $35,000 to $49,999 | 1,034 | 5.5% |
| $50,000 to $74,999 | 2,275 | 12.1% |
| $75,000 to $99,999 | 2,426 | 12.9% |
| $100,000 to $149,999 | 5,284 | 28.1% |
| $150,000 to $199,999 | 3,009 | 16.0% |
| $200,000+ | 3,949 | 21.0% |
Family Income by Famaliy Size in York County
7+ person families (228 | 1.2%) account for the highest median family income in York County with $156,163 per family, while 2-person families (8,105 | 43.1%) have the highest median income of $57,208 per family member.
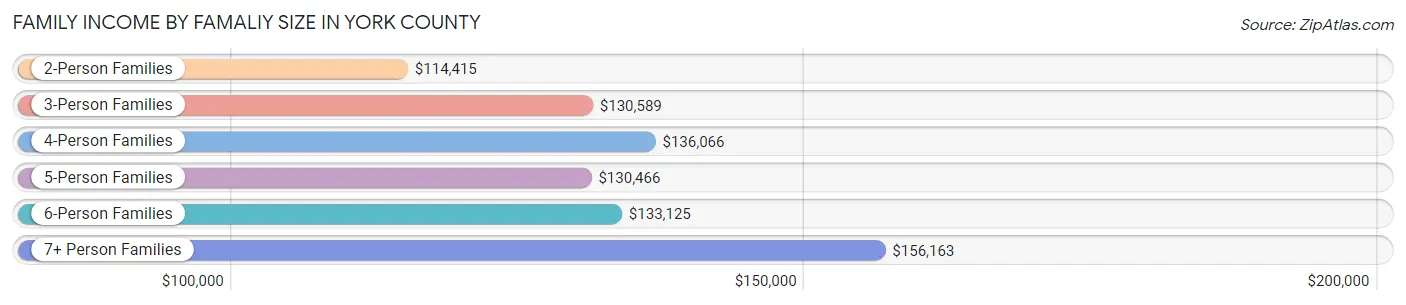
| Income Bracket | # Families | Median Income |
| 2-Person Families | 8,105 (43.1%) | $114,415 |
| 3-Person Families | 4,549 (24.2%) | $130,589 |
| 4-Person Families | 3,799 (20.2%) | $136,066 |
| 5-Person Families | 1,703 (9.1%) | $130,466 |
| 6-Person Families | 421 (2.2%) | $133,125 |
| 7+ Person Families | 228 (1.2%) | $156,163 |
| Total | 18,805 (100.0%) | $123,510 |
Family Income by Number of Earners in York County
The median family income in York County is $123,510, with families comprising 3+ earners (2,294) having the highest median family income of $166,921, while families with no earners (2,277) have the lowest median family income of $85,368, accounting for 12.2% and 12.1% of families, respectively.
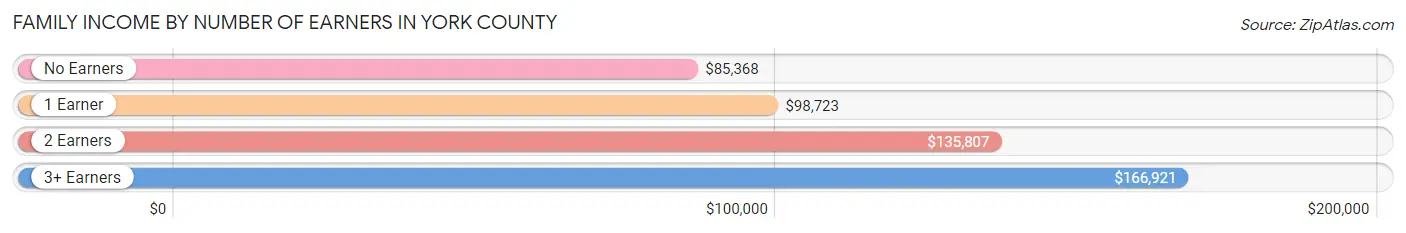
| Number of Earners | # Families | Median Income |
| No Earners | 2,277 (12.1%) | $85,368 |
| 1 Earner | 5,634 (30.0%) | $98,723 |
| 2 Earners | 8,600 (45.7%) | $135,807 |
| 3+ Earners | 2,294 (12.2%) | $166,921 |
| Total | 18,805 (100.0%) | $123,510 |
Household Income in York County
Household Income Brackets in York County
With 6,159 households falling in the category, the $100,000 to $149,999 income range is the most frequent in York County, accounting for 23.8% of all households. In contrast, only 233 households (0.9%) fall into the $10,000 to $14,999 income bracket, making it the least populous group.
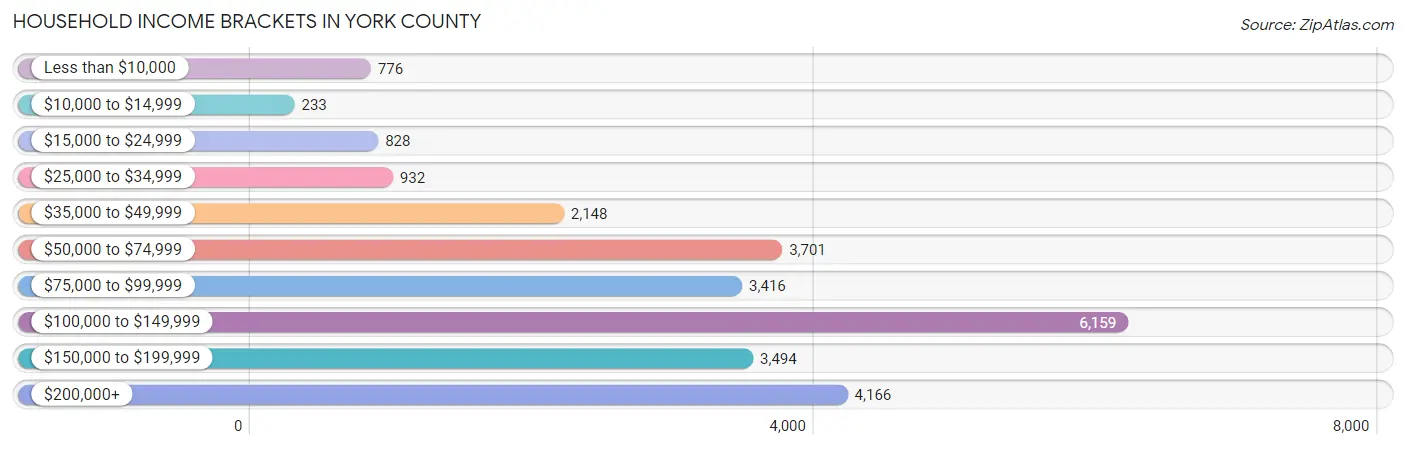
| Income Bracket | # Households | % Households |
| Less than $10,000 | 776 | 3.0% |
| $10,000 to $14,999 | 233 | 0.9% |
| $15,000 to $24,999 | 828 | 3.2% |
| $25,000 to $34,999 | 932 | 3.6% |
| $35,000 to $49,999 | 2,148 | 8.3% |
| $50,000 to $74,999 | 3,701 | 14.3% |
| $75,000 to $99,999 | 3,416 | 13.2% |
| $100,000 to $149,999 | 6,159 | 23.8% |
| $150,000 to $199,999 | 3,494 | 13.5% |
| $200,000+ | 4,166 | 16.1% |
Household Income by Householder Age in York County
The median household income in York County is $105,154, with the highest median household income of $139,620 found in the 45 to 64 years age bracket for the primary householder. A total of 9,678 households (37.4%) fall into this category. Meanwhile, the 15 to 24 years age bracket for the primary householder has the lowest median household income of $46,538, with 714 households (2.8%) in this group.
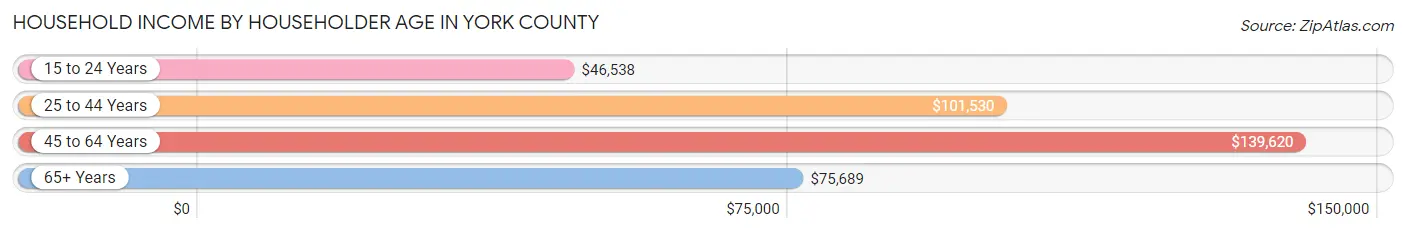
| Income Bracket | # Households | Median Income |
| 15 to 24 Years | 714 (2.8%) | $46,538 |
| 25 to 44 Years | 8,477 (32.8%) | $101,530 |
| 45 to 64 Years | 9,678 (37.4%) | $139,620 |
| 65+ Years | 7,009 (27.1%) | $75,689 |
| Total | 25,878 (100.0%) | $105,154 |
Poverty in York County
Income Below Poverty by Sex and Age in York County
With 4.2% poverty level for males and 5.3% for females among the residents of York County, 15 year old males and 75 year old and over females are the most vulnerable to poverty, with 45 males (11.2%) and 340 females (11.6%) in their respective age groups living below the poverty level.
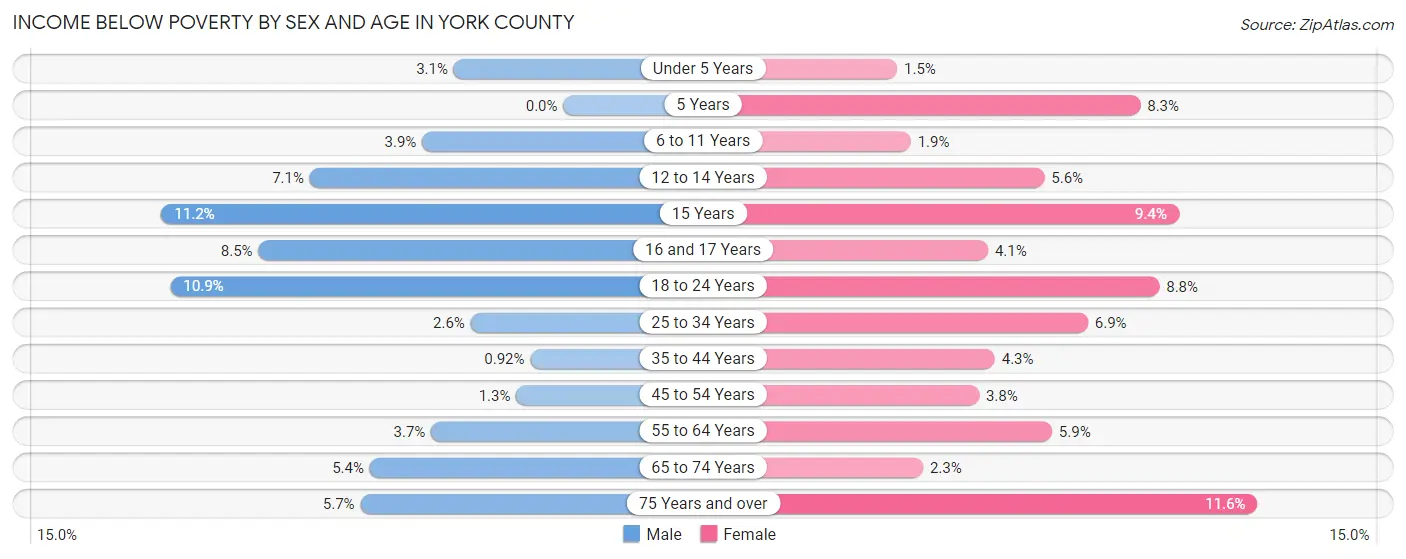
| Age Bracket | Male | Female |
| Under 5 Years | 58 (3.0%) | 28 (1.5%) |
| 5 Years | 0 (0.0%) | 33 (8.3%) |
| 6 to 11 Years | 112 (3.9%) | 53 (1.9%) |
| 12 to 14 Years | 120 (7.1%) | 76 (5.6%) |
| 15 Years | 45 (11.2%) | 56 (9.4%) |
| 16 and 17 Years | 95 (8.5%) | 38 (4.1%) |
| 18 to 24 Years | 320 (10.9%) | 224 (8.8%) |
| 25 to 34 Years | 93 (2.6%) | 274 (6.9%) |
| 35 to 44 Years | 47 (0.9%) | 208 (4.3%) |
| 45 to 54 Years | 54 (1.3%) | 163 (3.8%) |
| 55 to 64 Years | 167 (3.7%) | 283 (5.9%) |
| 65 to 74 Years | 172 (5.4%) | 80 (2.3%) |
| 75 Years and over | 123 (5.7%) | 340 (11.6%) |
| Total | 1,406 (4.2%) | 1,856 (5.3%) |
Income Above Poverty by Sex and Age in York County
According to the poverty statistics in York County, males aged 5 years and females aged under 5 years are the age groups that are most secure financially, with 100.0% of males and 98.5% of females in these age groups living above the poverty line.
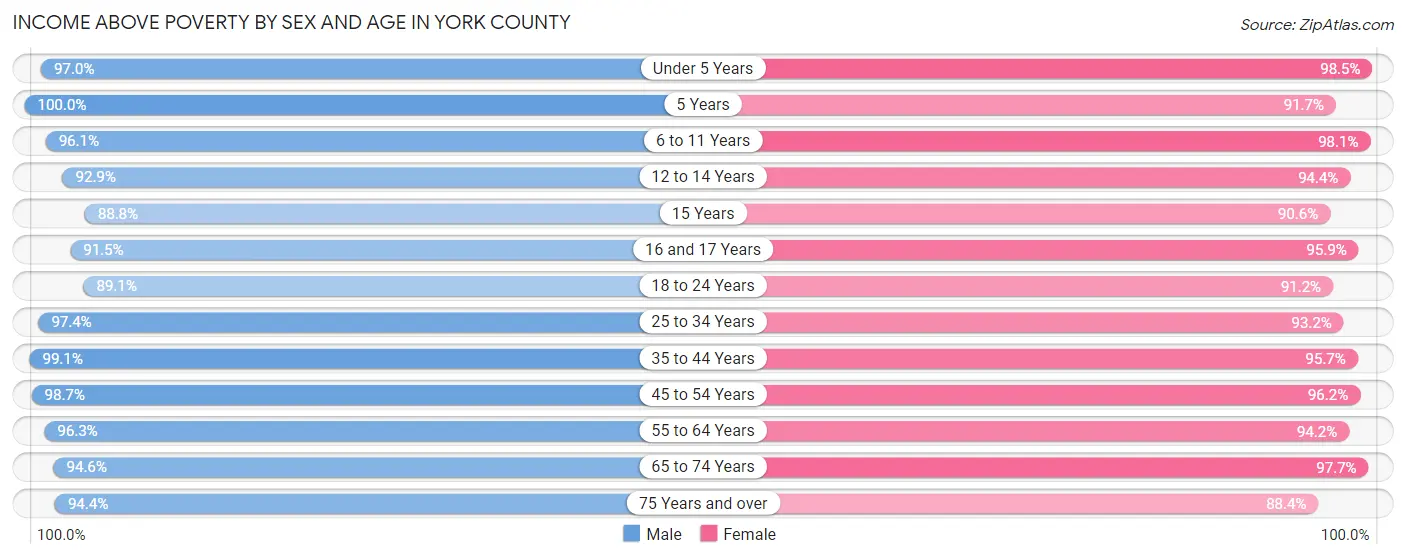
| Age Bracket | Male | Female |
| Under 5 Years | 1,846 (97.0%) | 1,788 (98.5%) |
| 5 Years | 260 (100.0%) | 364 (91.7%) |
| 6 to 11 Years | 2,737 (96.1%) | 2,705 (98.1%) |
| 12 to 14 Years | 1,580 (92.9%) | 1,271 (94.4%) |
| 15 Years | 357 (88.8%) | 541 (90.6%) |
| 16 and 17 Years | 1,024 (91.5%) | 895 (95.9%) |
| 18 to 24 Years | 2,605 (89.1%) | 2,309 (91.2%) |
| 25 to 34 Years | 3,508 (97.4%) | 3,725 (93.1%) |
| 35 to 44 Years | 5,077 (99.1%) | 4,670 (95.7%) |
| 45 to 54 Years | 4,063 (98.7%) | 4,104 (96.2%) |
| 55 to 64 Years | 4,368 (96.3%) | 4,558 (94.2%) |
| 65 to 74 Years | 3,022 (94.6%) | 3,456 (97.7%) |
| 75 Years and over | 2,054 (94.4%) | 2,599 (88.4%) |
| Total | 32,501 (95.9%) | 32,985 (94.7%) |
Income Below Poverty Among Married-Couple Families in York County
The poverty statistics for married-couple families in York County show that 1.8% or 284 of the total 15,702 families live below the poverty line. Families with 3 or 4 children have the highest poverty rate of 3.6%, comprising of 46 families. On the other hand, families with 5 or more children have the lowest poverty rate of 0.0%, which includes 0 families.
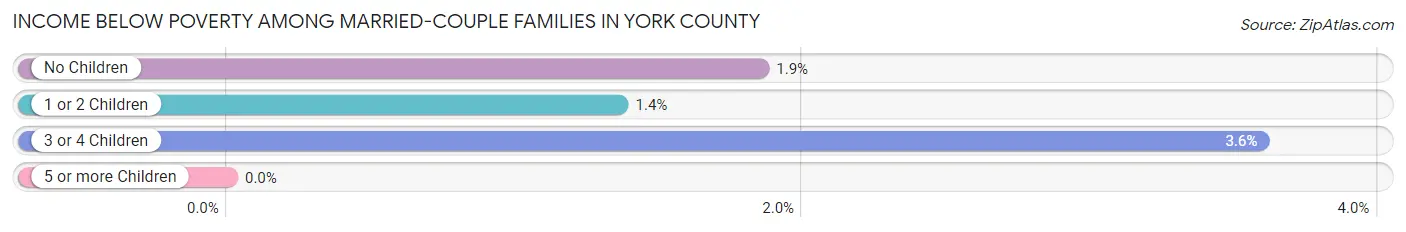
| Children | Above Poverty | Below Poverty |
| No Children | 8,709 (98.2%) | 164 (1.8%) |
| 1 or 2 Children | 5,383 (98.6%) | 74 (1.4%) |
| 3 or 4 Children | 1,235 (96.4%) | 46 (3.6%) |
| 5 or more Children | 91 (100.0%) | 0 (0.0%) |
| Total | 15,418 (98.2%) | 284 (1.8%) |
Income Below Poverty Among Single-Parent Households in York County
According to the poverty data in York County, 6.0% or 50 single-father households and 9.7% or 220 single-mother households are living below the poverty line. Among single-father households, those with no children have the highest poverty rate, with 22 households (8.0%) experiencing poverty. Likewise, among single-mother households, those with 3 or 4 children have the highest poverty rate, with 68 households (25.6%) falling below the poverty line.
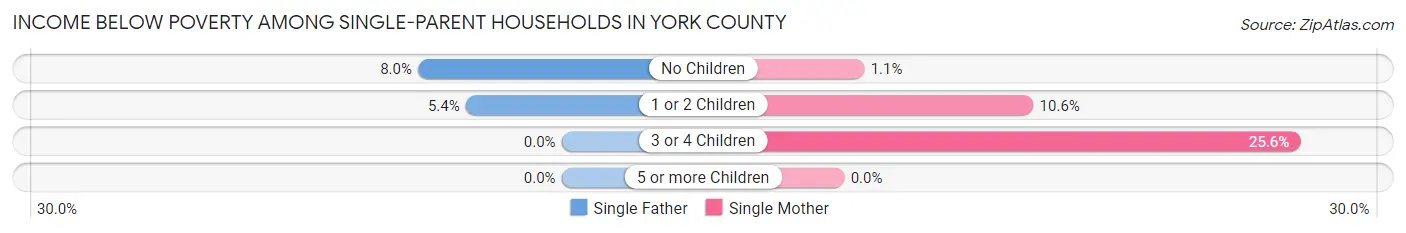
| Children | Single Father | Single Mother |
| No Children | 22 (8.0%) | 7 (1.1%) |
| 1 or 2 Children | 28 (5.4%) | 145 (10.6%) |
| 3 or 4 Children | 0 (0.0%) | 68 (25.6%) |
| 5 or more Children | 0 (0.0%) | 0 (0.0%) |
| Total | 50 (6.0%) | 220 (9.7%) |
Income Below Poverty Among Married-Couple vs Single-Parent Households in York County
The poverty data for York County shows that 284 of the married-couple family households (1.8%) and 270 of the single-parent households (8.7%) are living below the poverty level. Within the married-couple family households, those with 3 or 4 children have the highest poverty rate, with 46 households (3.6%) falling below the poverty line. Among the single-parent households, those with 3 or 4 children have the highest poverty rate, with 68 household (22.7%) living below poverty.
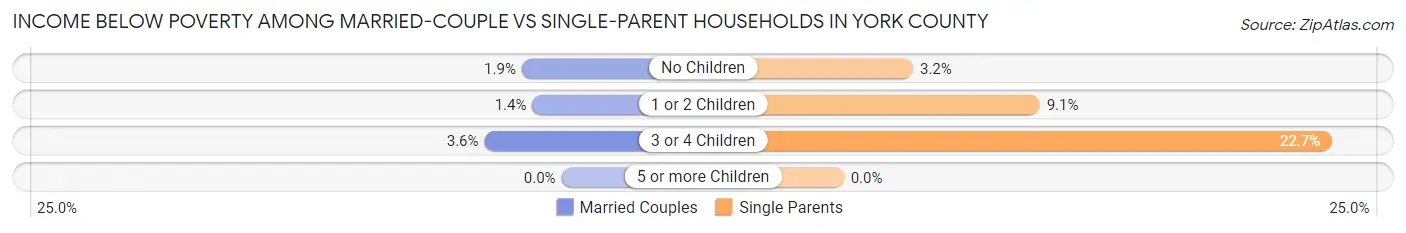
| Children | Married-Couple Families | Single-Parent Households |
| No Children | 164 (1.8%) | 29 (3.2%) |
| 1 or 2 Children | 74 (1.4%) | 173 (9.1%) |
| 3 or 4 Children | 46 (3.6%) | 68 (22.7%) |
| 5 or more Children | 0 (0.0%) | 0 (0.0%) |
| Total | 284 (1.8%) | 270 (8.7%) |
Race in York County
The most populous races in York County are White / Caucasian (49,774 | 70.9%), Black / African American (9,227 | 13.1%), and Two or more Races (6,155 | 8.8%).
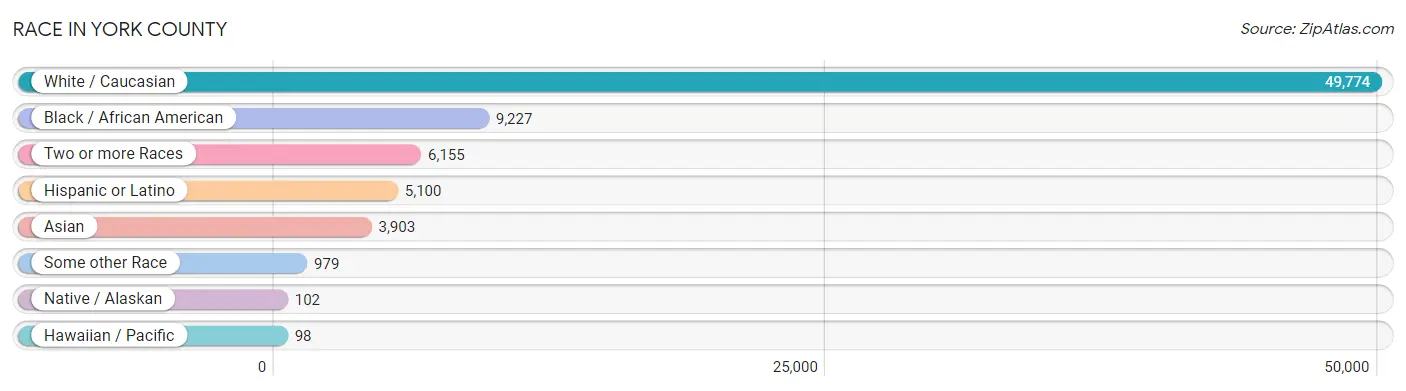
| Race | # Population | % Population |
| Asian | 3,903 | 5.6% |
| Black / African American | 9,227 | 13.1% |
| Hawaiian / Pacific | 98 | 0.1% |
| Hispanic or Latino | 5,100 | 7.3% |
| Native / Alaskan | 102 | 0.2% |
| White / Caucasian | 49,774 | 70.9% |
| Two or more Races | 6,155 | 8.8% |
| Some other Race | 979 | 1.4% |
| Total | 70,238 | 100.0% |
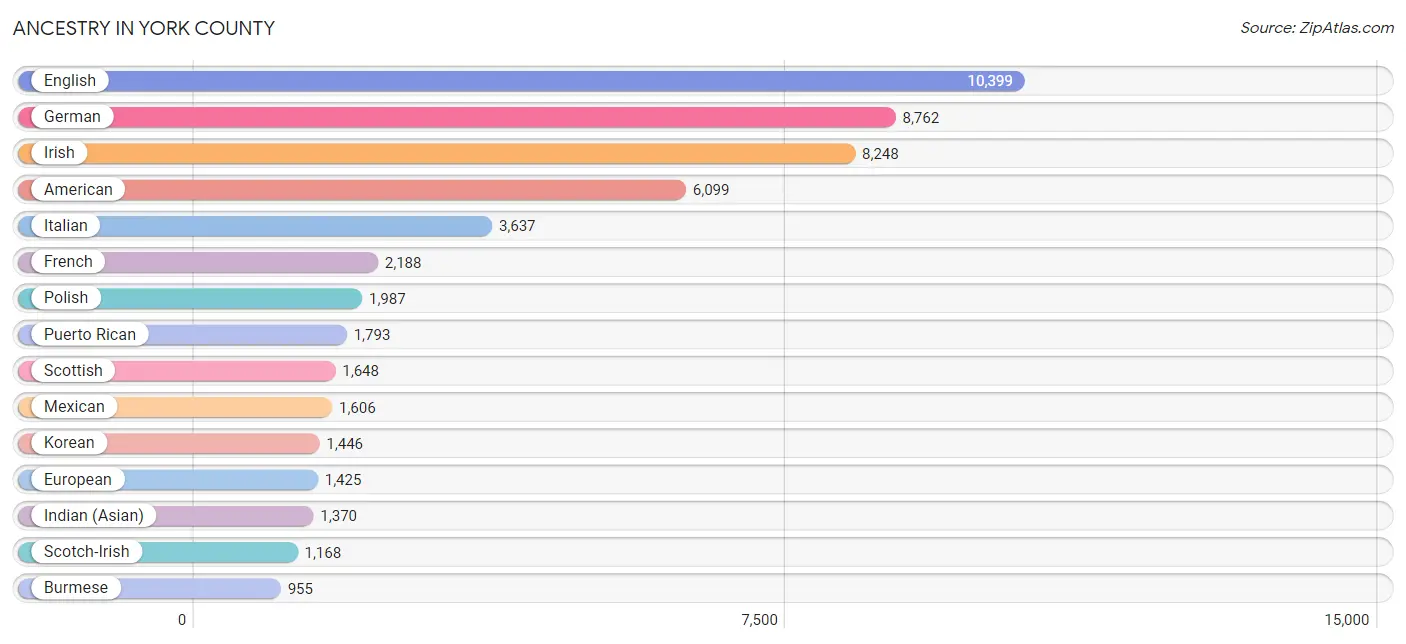
Ancestry in York County
The most populous ancestries reported in York County are English (10,399 | 14.8%), German (8,762 | 12.5%), Irish (8,248 | 11.7%), American (6,099 | 8.7%), and Italian (3,637 | 5.2%), together accounting for 52.9% of all York County residents.
| Ancestry | # Population | % Population |
| African | 322 | 0.5% |
| Alaskan Athabascan | 15 | 0.0% |
| American | 6,099 | 8.7% |
| Apache | 11 | 0.0% |
| Arab | 214 | 0.3% |
| Argentinean | 213 | 0.3% |
| Armenian | 80 | 0.1% |
| Australian | 74 | 0.1% |
| Austrian | 140 | 0.2% |
| Belgian | 55 | 0.1% |
| Bhutanese | 605 | 0.9% |
| Bolivian | 30 | 0.0% |
| Brazilian | 10 | 0.0% |
| British | 550 | 0.8% |
| Burmese | 955 | 1.4% |
| Cajun | 63 | 0.1% |
| Cambodian | 71 | 0.1% |
| Canadian | 136 | 0.2% |
| Celtic | 14 | 0.0% |
| Central American | 194 | 0.3% |
| Central American Indian | 7 | 0.0% |
| Cherokee | 134 | 0.2% |
| Chilean | 108 | 0.2% |
| Chippewa | 28 | 0.0% |
| Colombian | 171 | 0.2% |
| Croatian | 46 | 0.1% |
| Cuban | 482 | 0.7% |
| Czech | 197 | 0.3% |
| Czechoslovakian | 30 | 0.0% |
| Danish | 298 | 0.4% |
| Delaware | 13 | 0.0% |
| Dominican | 60 | 0.1% |
| Dutch | 396 | 0.6% |
| Eastern European | 82 | 0.1% |
| Ecuadorian | 134 | 0.2% |
| English | 10,399 | 14.8% |
| Ethiopian | 183 | 0.3% |
| European | 1,425 | 2.0% |
| Fijian | 88 | 0.1% |
| Filipino | 13 | 0.0% |
| Finnish | 95 | 0.1% |
| French | 2,188 | 3.1% |
| French Canadian | 469 | 0.7% |
| German | 8,762 | 12.5% |
| Greek | 203 | 0.3% |
| Guamanian / Chamorro | 133 | 0.2% |
| Haitian | 82 | 0.1% |
| Honduran | 26 | 0.0% |
| Hungarian | 449 | 0.6% |
| Indian (Asian) | 1,370 | 1.9% |
| Iranian | 169 | 0.2% |
| Irish | 8,248 | 11.7% |
| Italian | 3,637 | 5.2% |
| Jamaican | 61 | 0.1% |
| Korean | 1,446 | 2.1% |
| Latvian | 7 | 0.0% |
| Lebanese | 204 | 0.3% |
| Lithuanian | 87 | 0.1% |
| Lumbee | 11 | 0.0% |
| Macedonian | 59 | 0.1% |
| Mexican | 1,606 | 2.3% |
| Mexican American Indian | 24 | 0.0% |
| Native Hawaiian | 352 | 0.5% |
| Nicaraguan | 3 | 0.0% |
| Northern European | 37 | 0.1% |
| Norwegian | 625 | 0.9% |
| Pakistani | 106 | 0.2% |
| Panamanian | 62 | 0.1% |
| Pennsylvania German | 168 | 0.2% |
| Peruvian | 6 | 0.0% |
| Polish | 1,987 | 2.8% |
| Portuguese | 37 | 0.1% |
| Puerto Rican | 1,793 | 2.5% |
| Romanian | 55 | 0.1% |
| Russian | 276 | 0.4% |
| Salvadoran | 103 | 0.2% |
| Samoan | 4 | 0.0% |
| Scandinavian | 636 | 0.9% |
| Scotch-Irish | 1,168 | 1.7% |
| Scottish | 1,648 | 2.4% |
| Seminole | 12 | 0.0% |
| Serbian | 28 | 0.0% |
| Slavic | 8 | 0.0% |
| Slovak | 187 | 0.3% |
| South American | 662 | 0.9% |
| Spaniard | 177 | 0.3% |
| Spanish | 80 | 0.1% |
| Sri Lankan | 381 | 0.5% |
| Subsaharan African | 658 | 0.9% |
| Swedish | 697 | 1.0% |
| Swiss | 99 | 0.1% |
| Syrian | 10 | 0.0% |
| Thai | 613 | 0.9% |
| Trinidadian and Tobagonian | 130 | 0.2% |
| Turkish | 73 | 0.1% |
| Ukrainian | 144 | 0.2% |
| Vietnamese | 21 | 0.0% |
| Welsh | 473 | 0.7% |
| West Indian | 29 | 0.0% |
| Yugoslavian | 102 | 0.2% | View All 100 Rows |
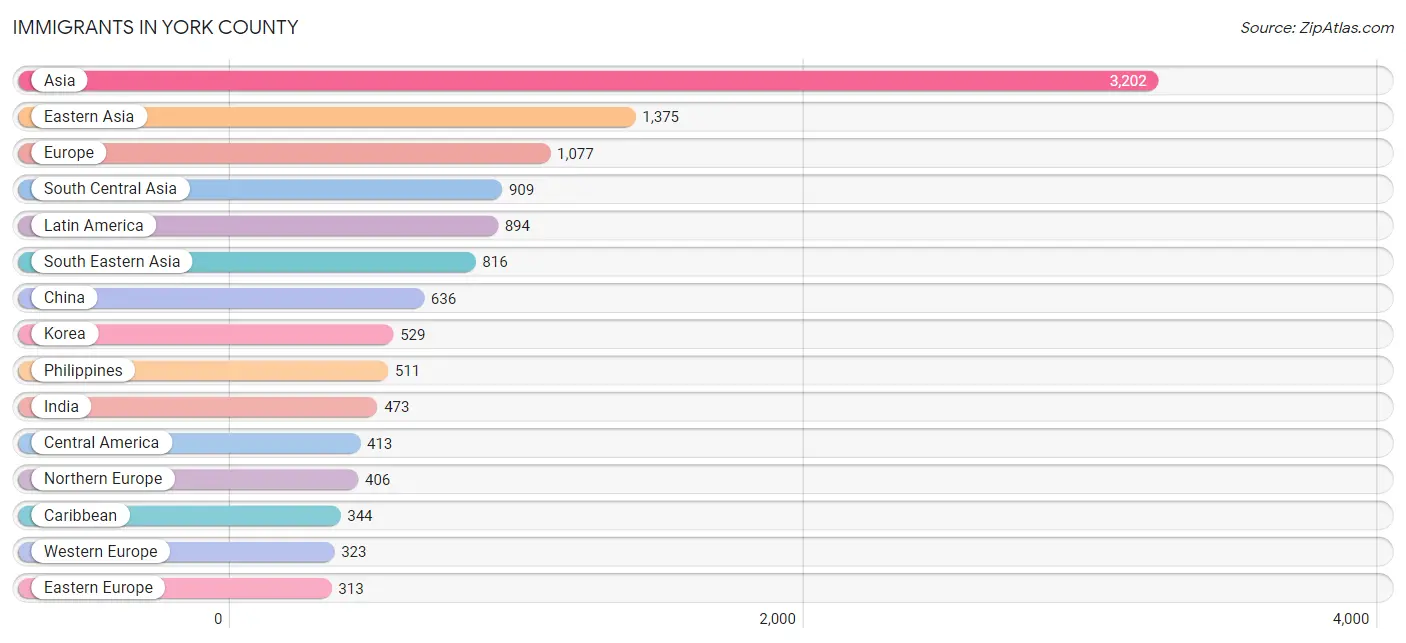
Immigrants in York County
The most numerous immigrant groups reported in York County came from Asia (3,202 | 4.6%), Eastern Asia (1,375 | 2.0%), Europe (1,077 | 1.5%), South Central Asia (909 | 1.3%), and Latin America (894 | 1.3%), together accounting for 10.6% of all York County residents.
| Immigration Origin | # Population | % Population |
| Afghanistan | 76 | 0.1% |
| Africa | 219 | 0.3% |
| Asia | 3,202 | 4.6% |
| Australia | 69 | 0.1% |
| Austria | 8 | 0.0% |
| Bangladesh | 21 | 0.0% |
| Belarus | 29 | 0.0% |
| Belgium | 14 | 0.0% |
| Bosnia and Herzegovina | 9 | 0.0% |
| Cabo Verde | 14 | 0.0% |
| Canada | 188 | 0.3% |
| Caribbean | 344 | 0.5% |
| Central America | 413 | 0.6% |
| Chile | 43 | 0.1% |
| China | 636 | 0.9% |
| Colombia | 57 | 0.1% |
| Cuba | 112 | 0.2% |
| Czechoslovakia | 7 | 0.0% |
| Denmark | 12 | 0.0% |
| Eastern Africa | 151 | 0.2% |
| Eastern Asia | 1,375 | 2.0% |
| Eastern Europe | 313 | 0.4% |
| Ecuador | 11 | 0.0% |
| El Salvador | 43 | 0.1% |
| England | 261 | 0.4% |
| Ethiopia | 129 | 0.2% |
| Europe | 1,077 | 1.5% |
| France | 23 | 0.0% |
| Germany | 270 | 0.4% |
| Ghana | 14 | 0.0% |
| Guatemala | 15 | 0.0% |
| Haiti | 10 | 0.0% |
| Honduras | 26 | 0.0% |
| Hong Kong | 21 | 0.0% |
| Hungary | 43 | 0.1% |
| India | 473 | 0.7% |
| Iran | 114 | 0.2% |
| Ireland | 10 | 0.0% |
| Italy | 4 | 0.0% |
| Jamaica | 73 | 0.1% |
| Japan | 154 | 0.2% |
| Kenya | 22 | 0.0% |
| Korea | 529 | 0.7% |
| Latin America | 894 | 1.3% |
| Lebanon | 43 | 0.1% |
| Lithuania | 15 | 0.0% |
| Malaysia | 4 | 0.0% |
| Mexico | 260 | 0.4% |
| Nepal | 35 | 0.1% |
| Netherlands | 8 | 0.0% |
| North Macedonia | 30 | 0.0% |
| Northern Europe | 406 | 0.6% |
| Oceania | 100 | 0.1% |
| Pakistan | 190 | 0.3% |
| Panama | 69 | 0.1% |
| Peru | 26 | 0.0% |
| Philippines | 511 | 0.7% |
| Poland | 89 | 0.1% |
| Romania | 12 | 0.0% |
| Russia | 49 | 0.1% |
| Scotland | 9 | 0.0% |
| South America | 137 | 0.2% |
| South Central Asia | 909 | 1.3% |
| South Eastern Asia | 816 | 1.2% |
| Southern Europe | 35 | 0.1% |
| Spain | 31 | 0.0% |
| St. Vincent and the Grenadines | 16 | 0.0% |
| Sweden | 15 | 0.0% |
| Taiwan | 38 | 0.1% |
| Thailand | 106 | 0.2% |
| Trinidad and Tobago | 133 | 0.2% |
| Turkey | 59 | 0.1% |
| Ukraine | 30 | 0.0% |
| Vietnam | 195 | 0.3% |
| Western Africa | 68 | 0.1% |
| Western Asia | 102 | 0.2% |
| Western Europe | 323 | 0.5% | View All 77 Rows |
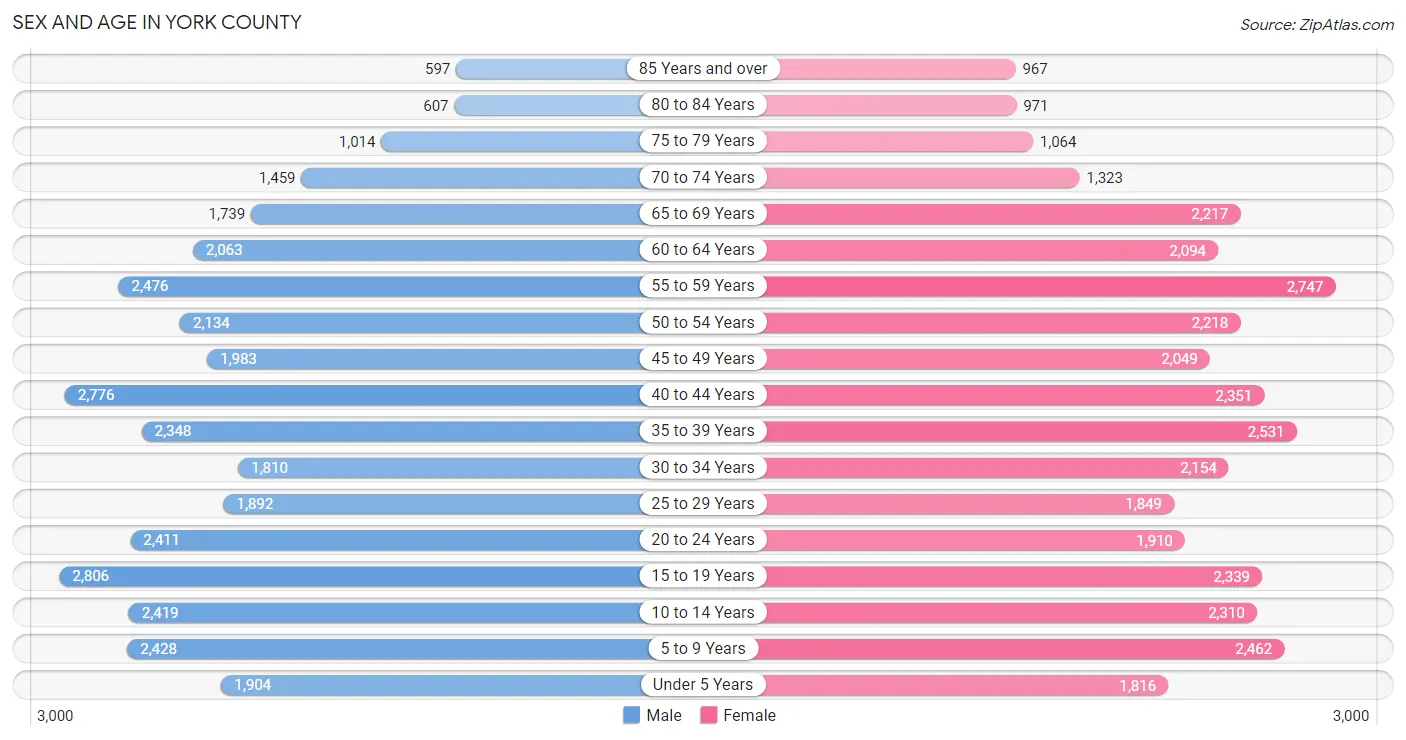
Sex and Age in York County
Sex and Age in York County
The most populous age groups in York County are 15 to 19 Years (2,806 | 8.1%) for men and 55 to 59 Years (2,747 | 7.8%) for women.
| Age Bracket | Male | Female |
| Under 5 Years | 1,904 (5.5%) | 1,816 (5.1%) |
| 5 to 9 Years | 2,428 (7.0%) | 2,462 (7.0%) |
| 10 to 14 Years | 2,419 (6.9%) | 2,310 (6.5%) |
| 15 to 19 Years | 2,806 (8.1%) | 2,339 (6.6%) |
| 20 to 24 Years | 2,411 (6.9%) | 1,910 (5.4%) |
| 25 to 29 Years | 1,892 (5.4%) | 1,849 (5.2%) |
| 30 to 34 Years | 1,810 (5.2%) | 2,154 (6.1%) |
| 35 to 39 Years | 2,348 (6.7%) | 2,531 (7.2%) |
| 40 to 44 Years | 2,776 (8.0%) | 2,351 (6.7%) |
| 45 to 49 Years | 1,983 (5.7%) | 2,049 (5.8%) |
| 50 to 54 Years | 2,134 (6.1%) | 2,218 (6.3%) |
| 55 to 59 Years | 2,476 (7.1%) | 2,747 (7.8%) |
| 60 to 64 Years | 2,063 (5.9%) | 2,094 (5.9%) |
| 65 to 69 Years | 1,739 (5.0%) | 2,217 (6.3%) |
| 70 to 74 Years | 1,459 (4.2%) | 1,323 (3.7%) |
| 75 to 79 Years | 1,014 (2.9%) | 1,064 (3.0%) |
| 80 to 84 Years | 607 (1.7%) | 971 (2.8%) |
| 85 Years and over | 597 (1.7%) | 967 (2.7%) |
| Total | 34,866 (100.0%) | 35,372 (100.0%) |
Families and Households in York County
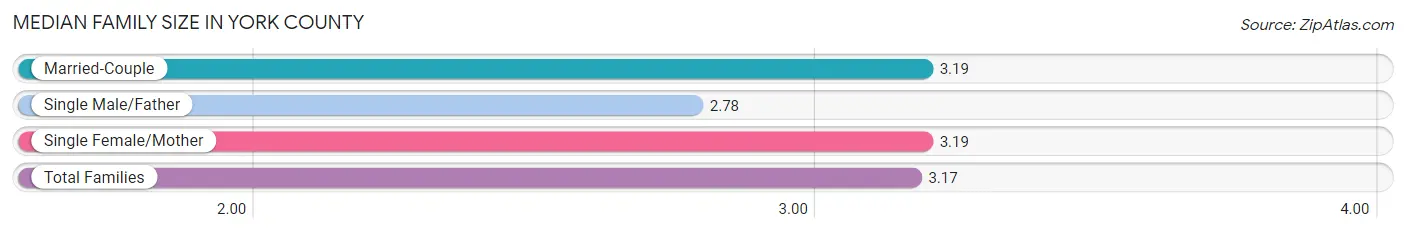
Median Family Size in York County
The median family size in York County is 3.17 persons per family, with married-couple families (15,702 | 83.5%) accounting for the largest median family size of 3.19 persons per family. On the other hand, single male/father families (829 | 4.4%) represent the smallest median family size with 2.78 persons per family.
| Family Type | # Families | Family Size |
| Married-Couple | 15,702 (83.5%) | 3.19 |
| Single Male/Father | 829 (4.4%) | 2.78 |
| Single Female/Mother | 2,274 (12.1%) | 3.19 |
| Total Families | 18,805 (100.0%) | 3.17 |
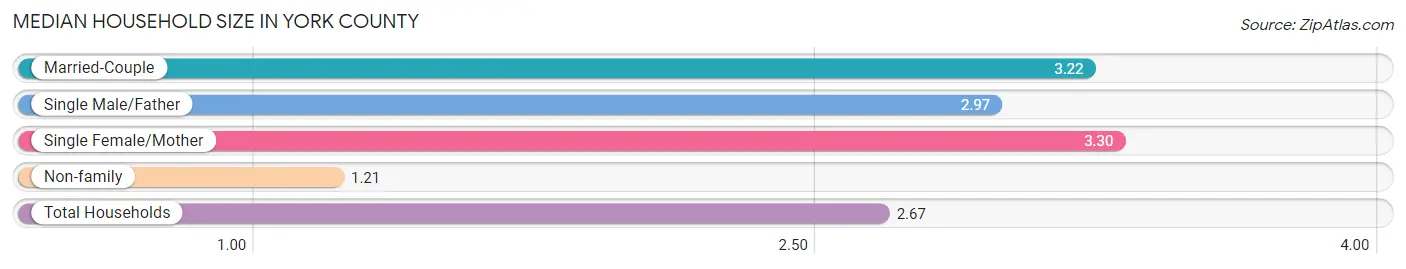
Median Household Size in York County
The median household size in York County is 2.67 persons per household, with single female/mother households (2,274 | 8.8%) accounting for the largest median household size of 3.3 persons per household. non-family households (7,073 | 27.3%) represent the smallest median household size with 1.21 persons per household.
| Household Type | # Households | Household Size |
| Married-Couple | 15,702 (60.7%) | 3.22 |
| Single Male/Father | 829 (3.2%) | 2.97 |
| Single Female/Mother | 2,274 (8.8%) | 3.30 |
| Non-family | 7,073 (27.3%) | 1.21 |
| Total Households | 25,878 (100.0%) | 2.67 |
Household Size by Marriage Status in York County
Out of a total of 25,878 households in York County, 18,805 (72.7%) are family households, while 7,073 (27.3%) are nonfamily households. The most numerous type of family households are 2-person households, comprising 7,673, and the most common type of nonfamily households are 1-person households, comprising 5,990.
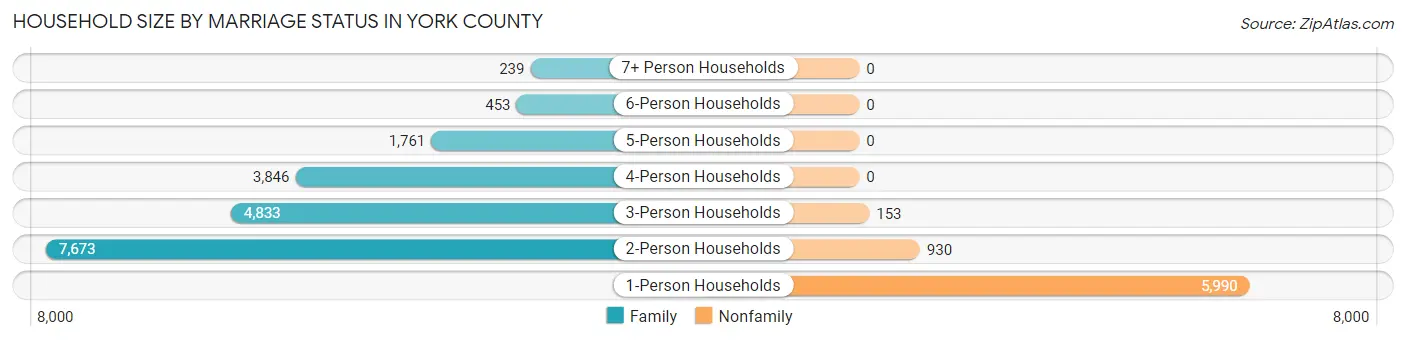
| Household Size | Family Households | Nonfamily Households |
| 1-Person Households | - | 5,990 (23.2%) |
| 2-Person Households | 7,673 (29.6%) | 930 (3.6%) |
| 3-Person Households | 4,833 (18.7%) | 153 (0.6%) |
| 4-Person Households | 3,846 (14.9%) | 0 (0.0%) |
| 5-Person Households | 1,761 (6.8%) | 0 (0.0%) |
| 6-Person Households | 453 (1.8%) | 0 (0.0%) |
| 7+ Person Households | 239 (0.9%) | 0 (0.0%) |
| Total | 18,805 (72.7%) | 7,073 (27.3%) |
Female Fertility in York County
Fertility by Age in York County
Average fertility rate in York County is 67.0 births per 1,000 women. Women in the age bracket of 20 to 34 years have the highest fertility rate with 122.0 births per 1,000 women. Women in the age bracket of 20 to 34 years acount for 69.0% of all women with births.
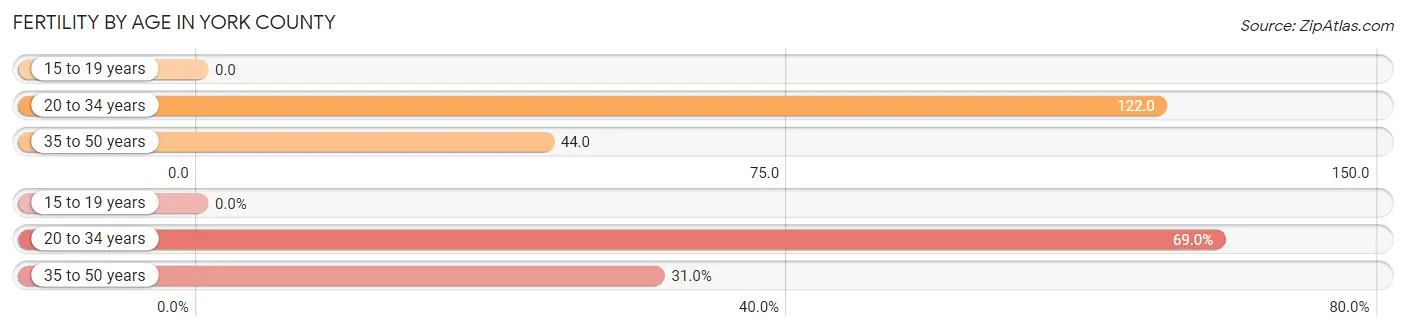
| Age Bracket | Women with Births | Births / 1,000 Women |
| 15 to 19 years | 0 (0.0%) | 0.0 |
| 20 to 34 years | 722 (69.0%) | 122.0 |
| 35 to 50 years | 324 (31.0%) | 44.0 |
| Total | 1,046 (100.0%) | 67.0 |
Fertility by Age by Marriage Status in York County
84.8% of women with births (1,046) in York County are married. The highest percentage of unmarried women with births falls into 20 to 34 years age bracket with 18.6% of them unmarried at the time of birth, while the lowest percentage of unmarried women with births belong to 35 to 50 years age bracket with 7.7% of them unmarried.
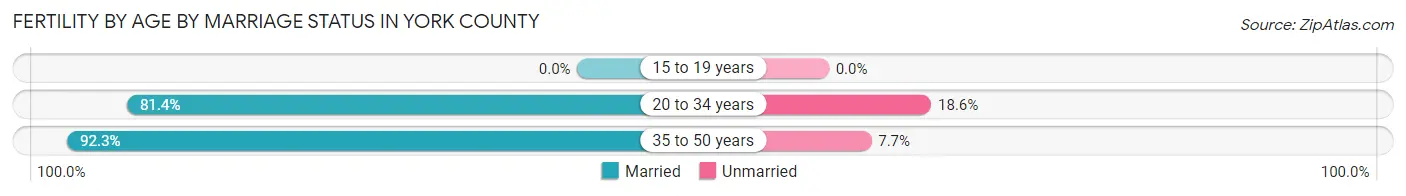
| Age Bracket | Married | Unmarried |
| 15 to 19 years | 0 (0.0%) | 0 (0.0%) |
| 20 to 34 years | 588 (81.4%) | 134 (18.6%) |
| 35 to 50 years | 299 (92.3%) | 25 (7.7%) |
| Total | 887 (84.8%) | 159 (15.2%) |
Fertility by Education in York County
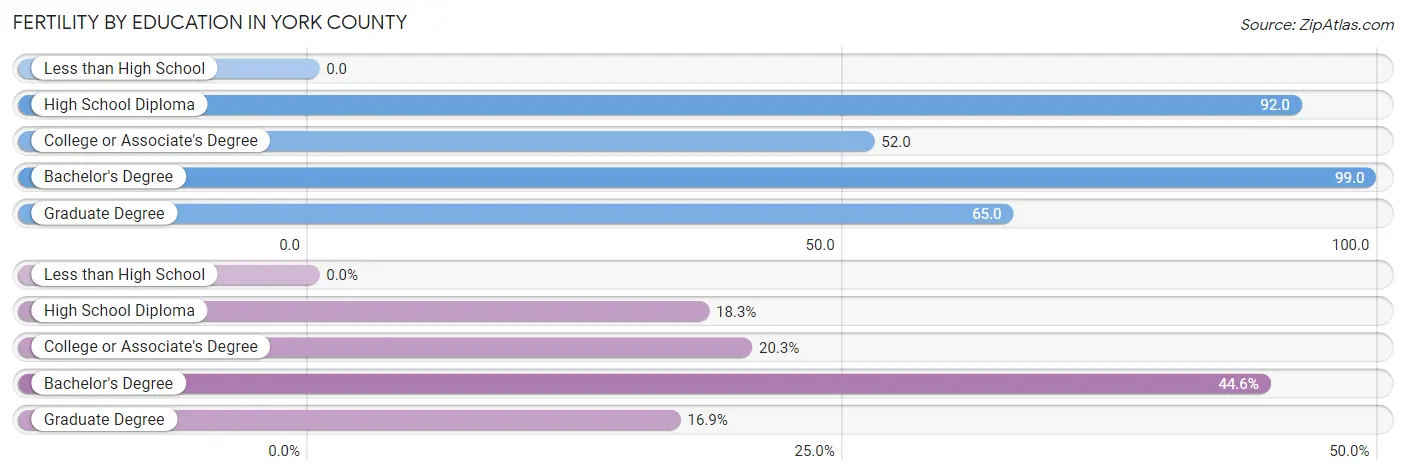
| Educational Attainment | Women with Births | Births / 1,000 Women |
| Less than High School | 0 (0.0%) | 0.0 |
| High School Diploma | 191 (18.3%) | 92.0 |
| College or Associate's Degree | 212 (20.3%) | 52.0 |
| Bachelor's Degree | 466 (44.6%) | 99.0 |
| Graduate Degree | 177 (16.9%) | 65.0 |
| Total | 1,046 (100.0%) | 67.0 |
Fertility by Education by Marriage Status in York County
15.2% of women with births in York County are unmarried. Women with the educational attainment of bachelor's degree are most likely to be married with 96.6% of them married at childbirth, while women with the educational attainment of high school diploma are least likely to be married with 34.5% of them unmarried at childbirth.
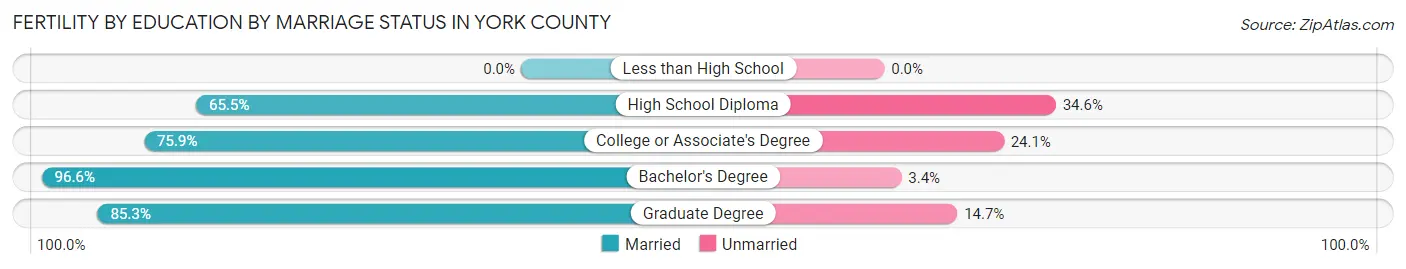
| Educational Attainment | Married | Unmarried |
| Less than High School | 0 (0.0%) | 0 (0.0%) |
| High School Diploma | 125 (65.4%) | 66 (34.5%) |
| College or Associate's Degree | 161 (75.9%) | 51 (24.1%) |
| Bachelor's Degree | 450 (96.6%) | 16 (3.4%) |
| Graduate Degree | 151 (85.3%) | 26 (14.7%) |
| Total | 887 (84.8%) | 159 (15.2%) |
Employment Characteristics in York County
Employment by Class of Employer in York County
Among the 35,523 employed individuals in York County, private company employees (17,876 | 50.3%), federal government employees (7,902 | 22.2%), and local government employees (3,083 | 8.7%) make up the most common classes of employment.
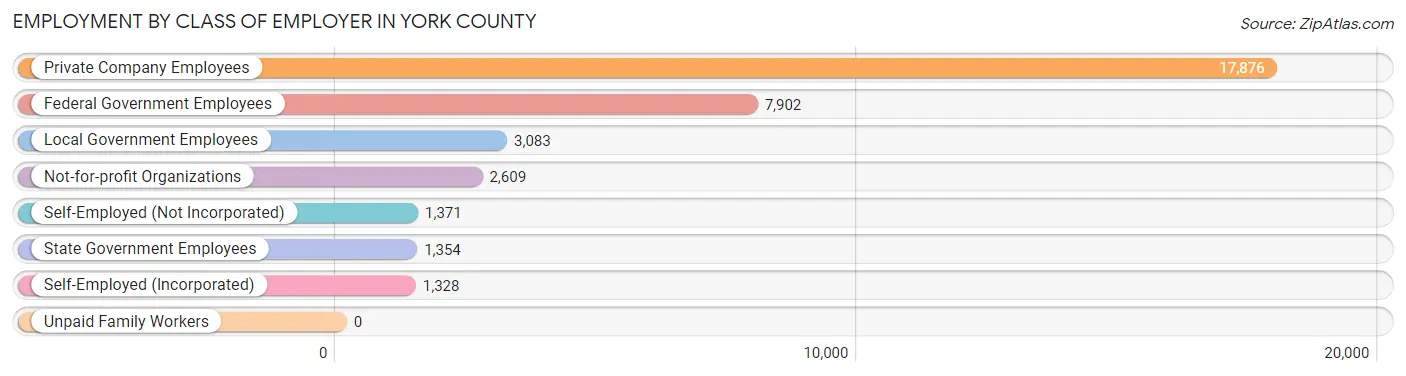
| Employer Class | # Employees | % Employees |
| Private Company Employees | 17,876 | 50.3% |
| Self-Employed (Incorporated) | 1,328 | 3.7% |
| Self-Employed (Not Incorporated) | 1,371 | 3.9% |
| Not-for-profit Organizations | 2,609 | 7.3% |
| Local Government Employees | 3,083 | 8.7% |
| State Government Employees | 1,354 | 3.8% |
| Federal Government Employees | 7,902 | 22.2% |
| Unpaid Family Workers | 0 | 0.0% |
| Total | 35,523 | 100.0% |
Employment Status by Age in York County
According to the labor force statistics for York County, out of the total population over 16 years of age (55,900), 67.0% or 37,453 individuals are in the labor force, with 4.2% or 1,573 of them unemployed. The age group with the highest labor force participation rate is 25 to 29 years, with 87.4% or 3,270 individuals in the labor force. Within the labor force, the 20 to 24 years age range has the highest percentage of unemployed individuals, with 12.6% or 446 of them being unemployed.
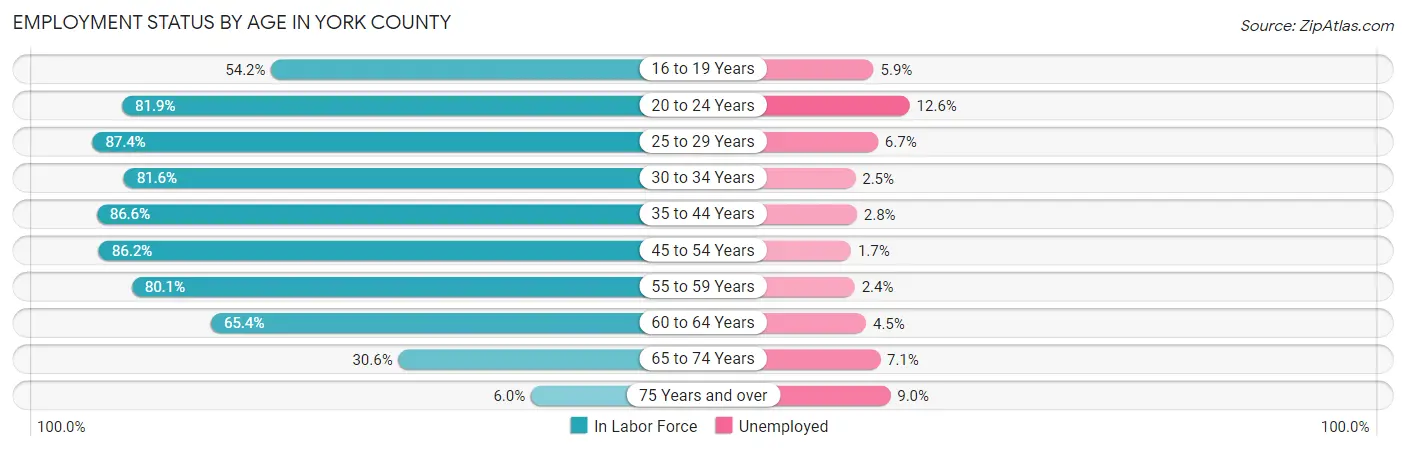
| Age Bracket | In Labor Force | Unemployed |
| 16 to 19 Years | 2,247 (54.2%) | 133 (5.9%) |
| 20 to 24 Years | 3,539 (81.9%) | 446 (12.6%) |
| 25 to 29 Years | 3,270 (87.4%) | 219 (6.7%) |
| 30 to 34 Years | 3,235 (81.6%) | 81 (2.5%) |
| 35 to 44 Years | 8,665 (86.6%) | 243 (2.8%) |
| 45 to 54 Years | 7,227 (86.2%) | 123 (1.7%) |
| 55 to 59 Years | 4,184 (80.1%) | 100 (2.4%) |
| 60 to 64 Years | 2,719 (65.4%) | 122 (4.5%) |
| 65 to 74 Years | 2,062 (30.6%) | 146 (7.1%) |
| 75 Years and over | 313 (6.0%) | 28 (9.0%) |
| Total | 37,453 (67.0%) | 1,573 (4.2%) |
Employment Status by Educational Attainment in York County
According to labor force statistics for York County, 82.6% of individuals (29,302) out of the total population between 25 and 64 years of age (35,475) are in the labor force, with 3.0% or 879 of them being unemployed. The group with the highest labor force participation rate are those with the educational attainment of bachelor's degree or higher, with 84.7% or 15,384 individuals in the labor force. Within the labor force, individuals with less than high school education have the highest percentage of unemployment, with 8.1% or 56 of them being unemployed.
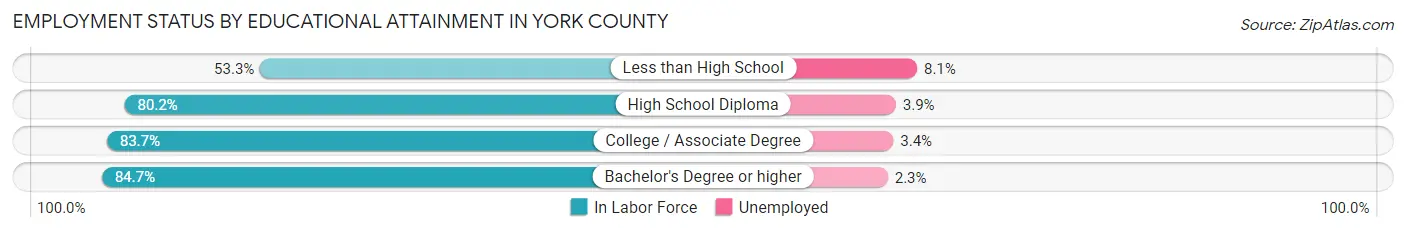
| Educational Attainment | In Labor Force | Unemployed |
| Less than High School | 689 (53.3%) | 105 (8.1%) |
| High School Diploma | 4,279 (80.2%) | 208 (3.9%) |
| College / Associate Degree | 8,942 (83.7%) | 363 (3.4%) |
| Bachelor's Degree or higher | 15,384 (84.7%) | 418 (2.3%) |
| Total | 29,302 (82.6%) | 1,064 (3.0%) |
Employment Occupations by Sex in York County
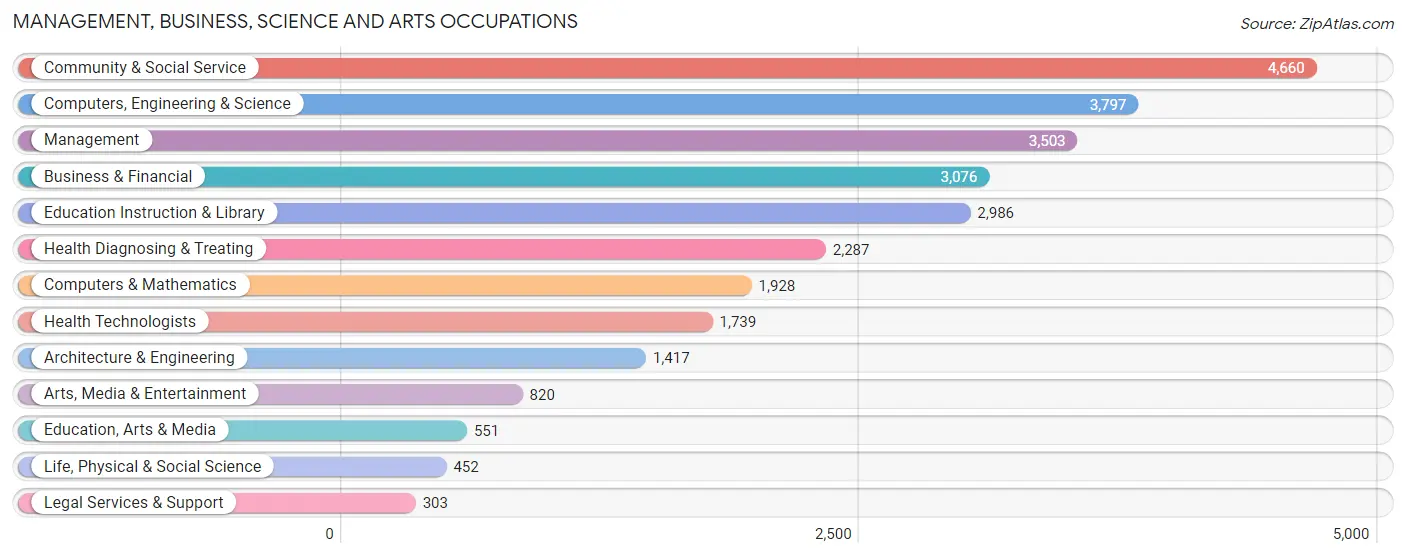
Management, Business, Science and Arts Occupations
The most common Management, Business, Science and Arts occupations in York County are Community & Social Service (4,660 | 14.6%), Computers, Engineering & Science (3,797 | 11.9%), Management (3,503 | 11.0%), Business & Financial (3,076 | 9.7%), and Education Instruction & Library (2,986 | 9.4%).
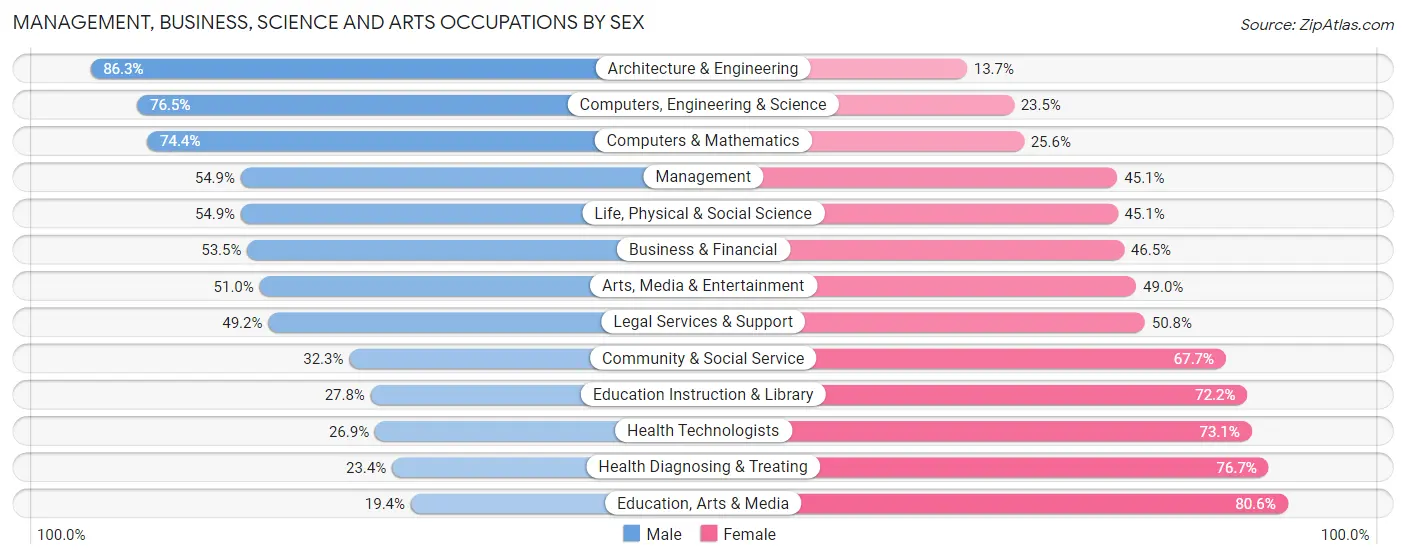
Management, Business, Science and Arts Occupations by Sex
Within the Management, Business, Science and Arts occupations in York County, the most male-oriented occupations are Architecture & Engineering (86.3%), Computers, Engineering & Science (76.5%), and Computers & Mathematics (74.4%), while the most female-oriented occupations are Education, Arts & Media (80.6%), Health Diagnosing & Treating (76.6%), and Health Technologists (73.1%).
| Occupation | Male | Female |
| Management | 1,923 (54.9%) | 1,580 (45.1%) |
| Business & Financial | 1,647 (53.5%) | 1,429 (46.5%) |
| Computers, Engineering & Science | 2,906 (76.5%) | 891 (23.5%) |
| Computers & Mathematics | 1,435 (74.4%) | 493 (25.6%) |
| Architecture & Engineering | 1,223 (86.3%) | 194 (13.7%) |
| Life, Physical & Social Science | 248 (54.9%) | 204 (45.1%) |
| Community & Social Service | 1,504 (32.3%) | 3,156 (67.7%) |
| Education, Arts & Media | 107 (19.4%) | 444 (80.6%) |
| Legal Services & Support | 149 (49.2%) | 154 (50.8%) |
| Education Instruction & Library | 830 (27.8%) | 2,156 (72.2%) |
| Arts, Media & Entertainment | 418 (51.0%) | 402 (49.0%) |
| Health Diagnosing & Treating | 534 (23.4%) | 1,753 (76.6%) |
| Health Technologists | 468 (26.9%) | 1,271 (73.1%) |
| Total (Category) | 8,514 (49.1%) | 8,809 (50.8%) |
| Total (Overall) | 16,895 (53.0%) | 14,950 (46.9%) |
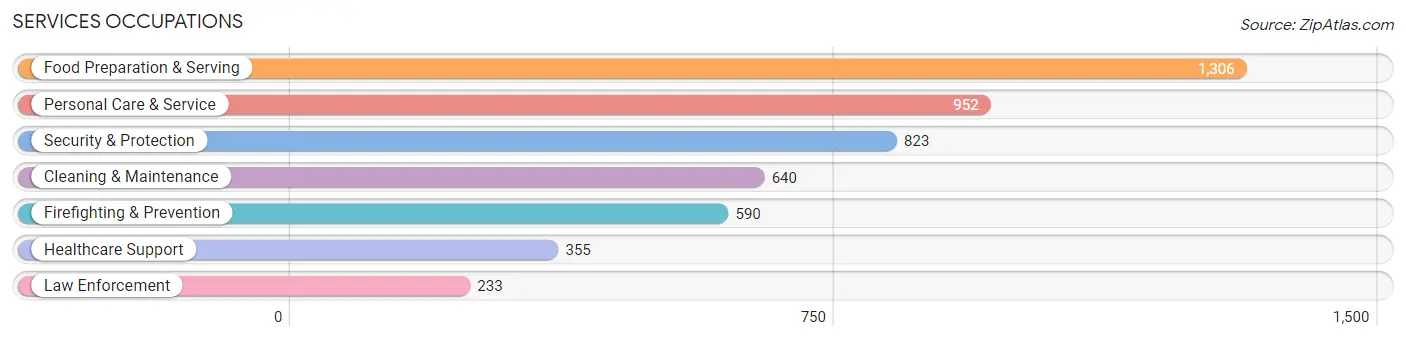
Services Occupations
The most common Services occupations in York County are Food Preparation & Serving (1,306 | 4.1%), Personal Care & Service (952 | 3.0%), Security & Protection (823 | 2.6%), Cleaning & Maintenance (640 | 2.0%), and Firefighting & Prevention (590 | 1.8%).
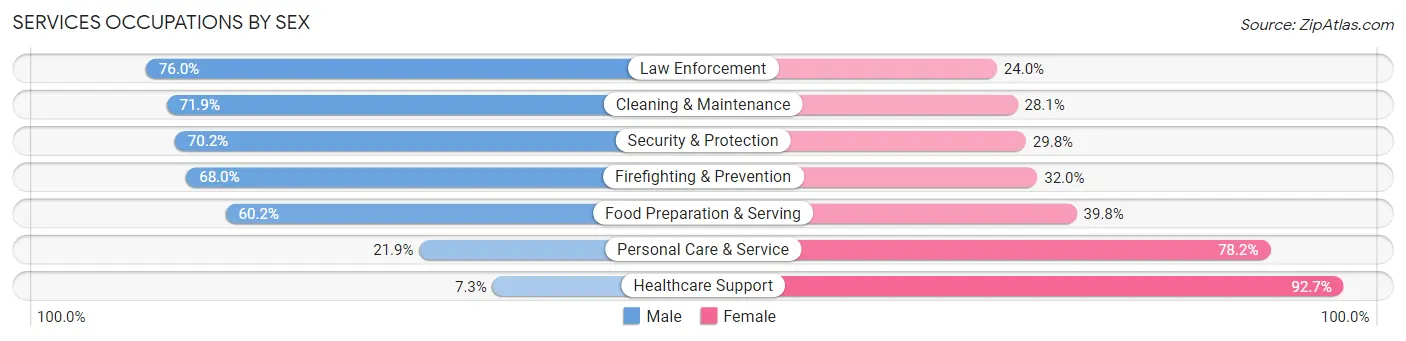
Services Occupations by Sex
Within the Services occupations in York County, the most male-oriented occupations are Law Enforcement (76.0%), Cleaning & Maintenance (71.9%), and Security & Protection (70.2%), while the most female-oriented occupations are Healthcare Support (92.7%), Personal Care & Service (78.1%), and Food Preparation & Serving (39.8%).
| Occupation | Male | Female |
| Healthcare Support | 26 (7.3%) | 329 (92.7%) |
| Security & Protection | 578 (70.2%) | 245 (29.8%) |
| Firefighting & Prevention | 401 (68.0%) | 189 (32.0%) |
| Law Enforcement | 177 (76.0%) | 56 (24.0%) |
| Food Preparation & Serving | 786 (60.2%) | 520 (39.8%) |
| Cleaning & Maintenance | 460 (71.9%) | 180 (28.1%) |
| Personal Care & Service | 208 (21.8%) | 744 (78.1%) |
| Total (Category) | 2,058 (50.5%) | 2,018 (49.5%) |
| Total (Overall) | 16,895 (53.0%) | 14,950 (46.9%) |
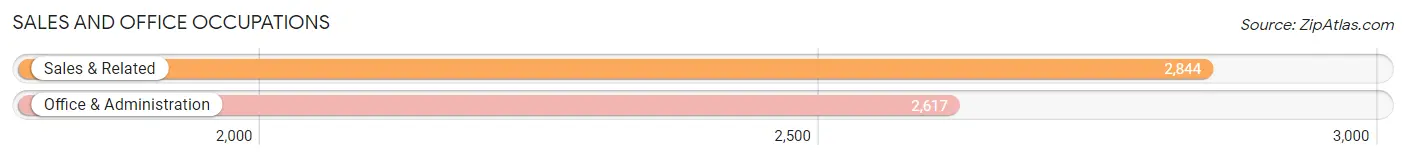
Sales and Office Occupations
The most common Sales and Office occupations in York County are Sales & Related (2,844 | 8.9%), and Office & Administration (2,617 | 8.2%).
Sales and Office Occupations by Sex
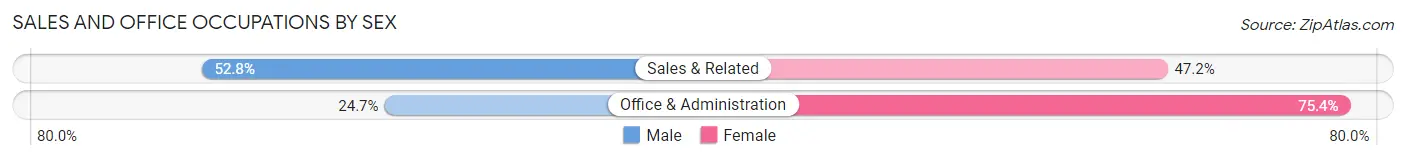
| Occupation | Male | Female |
| Sales & Related | 1,501 (52.8%) | 1,343 (47.2%) |
| Office & Administration | 645 (24.6%) | 1,972 (75.3%) |
| Total (Category) | 2,146 (39.3%) | 3,315 (60.7%) |
| Total (Overall) | 16,895 (53.0%) | 14,950 (46.9%) |
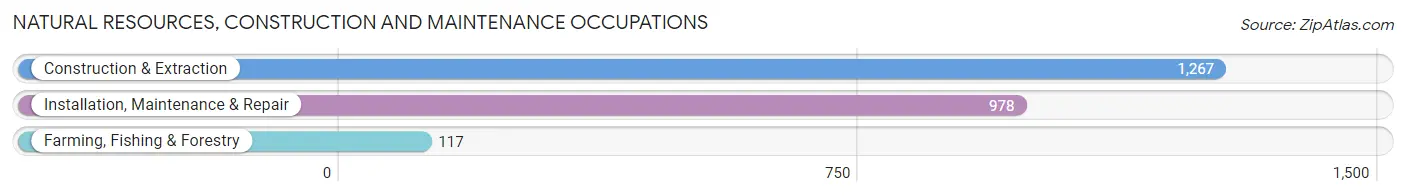
Natural Resources, Construction and Maintenance Occupations
The most common Natural Resources, Construction and Maintenance occupations in York County are Construction & Extraction (1,267 | 4.0%), Installation, Maintenance & Repair (978 | 3.1%), and Farming, Fishing & Forestry (117 | 0.4%).
Natural Resources, Construction and Maintenance Occupations by Sex
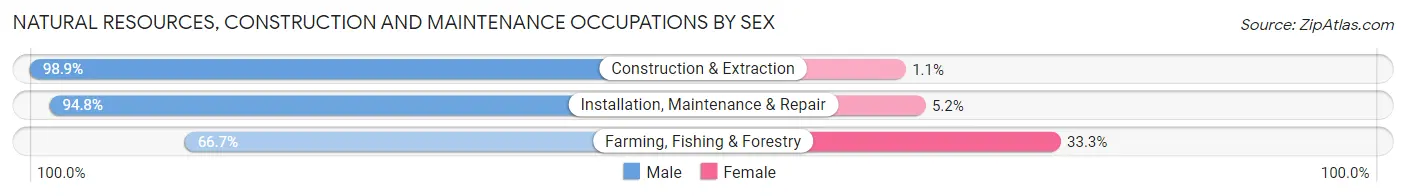
| Occupation | Male | Female |
| Farming, Fishing & Forestry | 78 (66.7%) | 39 (33.3%) |
| Construction & Extraction | 1,253 (98.9%) | 14 (1.1%) |
| Installation, Maintenance & Repair | 927 (94.8%) | 51 (5.2%) |
| Total (Category) | 2,258 (95.6%) | 104 (4.4%) |
| Total (Overall) | 16,895 (53.0%) | 14,950 (46.9%) |
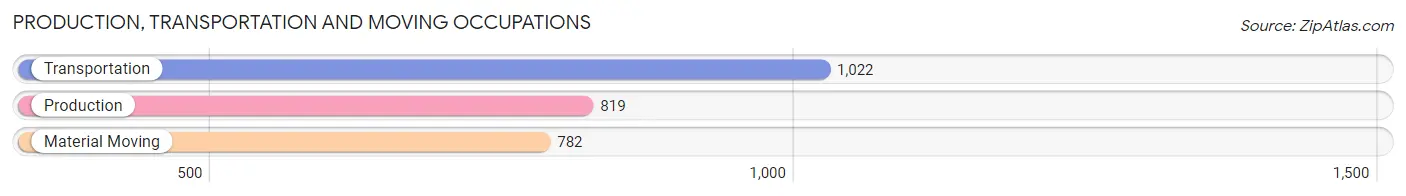
Production, Transportation and Moving Occupations
The most common Production, Transportation and Moving occupations in York County are Transportation (1,022 | 3.2%), Production (819 | 2.6%), and Material Moving (782 | 2.5%).
Production, Transportation and Moving Occupations by Sex
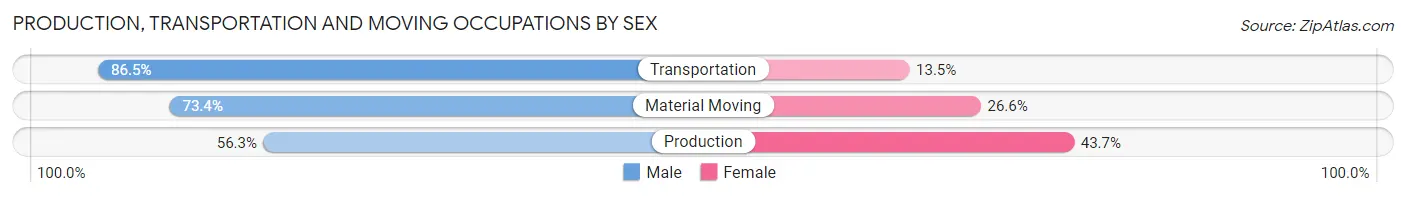
| Occupation | Male | Female |
| Production | 461 (56.3%) | 358 (43.7%) |
| Transportation | 884 (86.5%) | 138 (13.5%) |
| Material Moving | 574 (73.4%) | 208 (26.6%) |
| Total (Category) | 1,919 (73.2%) | 704 (26.8%) |
| Total (Overall) | 16,895 (53.0%) | 14,950 (46.9%) |
Employment Industries by Sex in York County
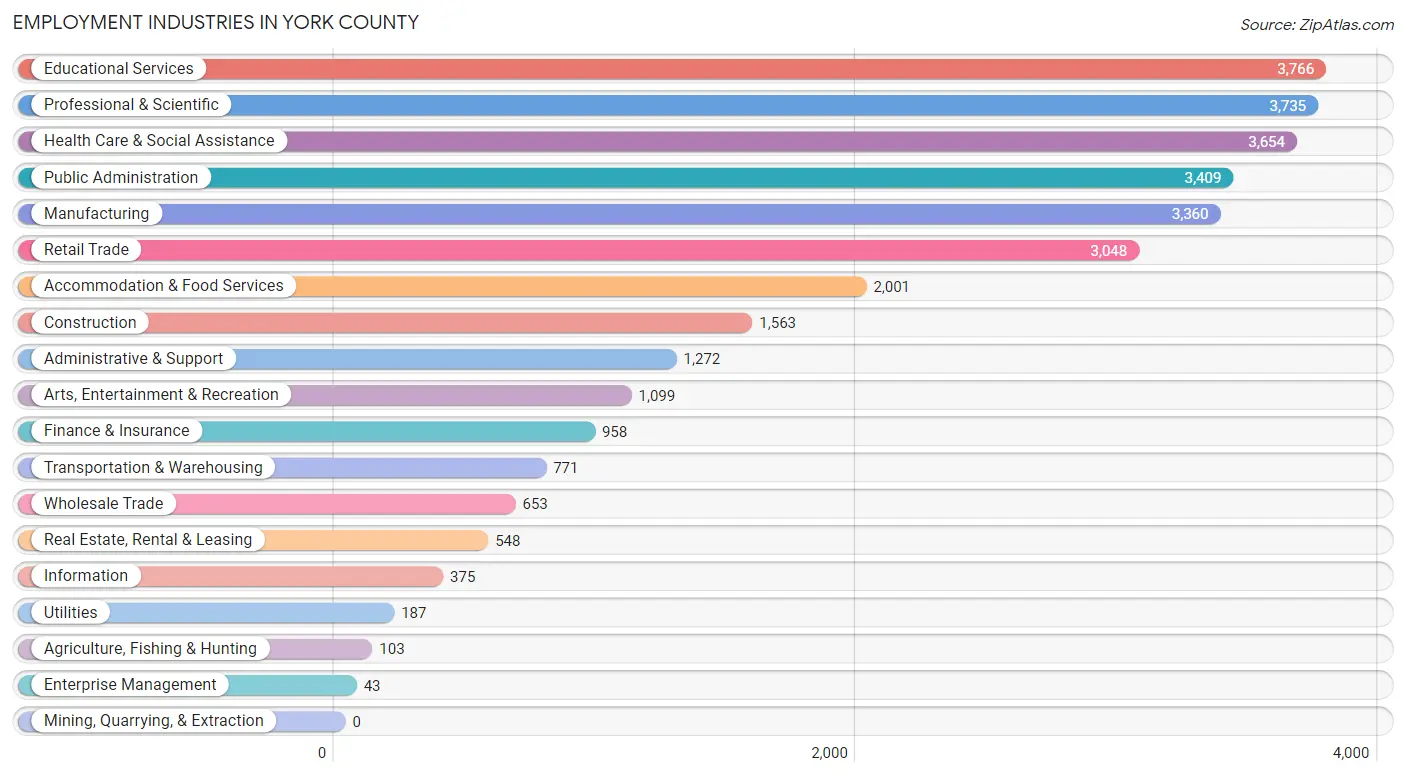
Employment Industries in York County
The major employment industries in York County include Educational Services (3,766 | 11.8%), Professional & Scientific (3,735 | 11.7%), Health Care & Social Assistance (3,654 | 11.5%), Public Administration (3,409 | 10.7%), and Manufacturing (3,360 | 10.5%).
Employment Industries by Sex in York County
The York County industries that see more men than women are Construction (89.1%), Utilities (85.6%), and Information (77.1%), whereas the industries that tend to have a higher number of women are Enterprise Management (100.0%), Health Care & Social Assistance (76.1%), and Educational Services (71.7%).
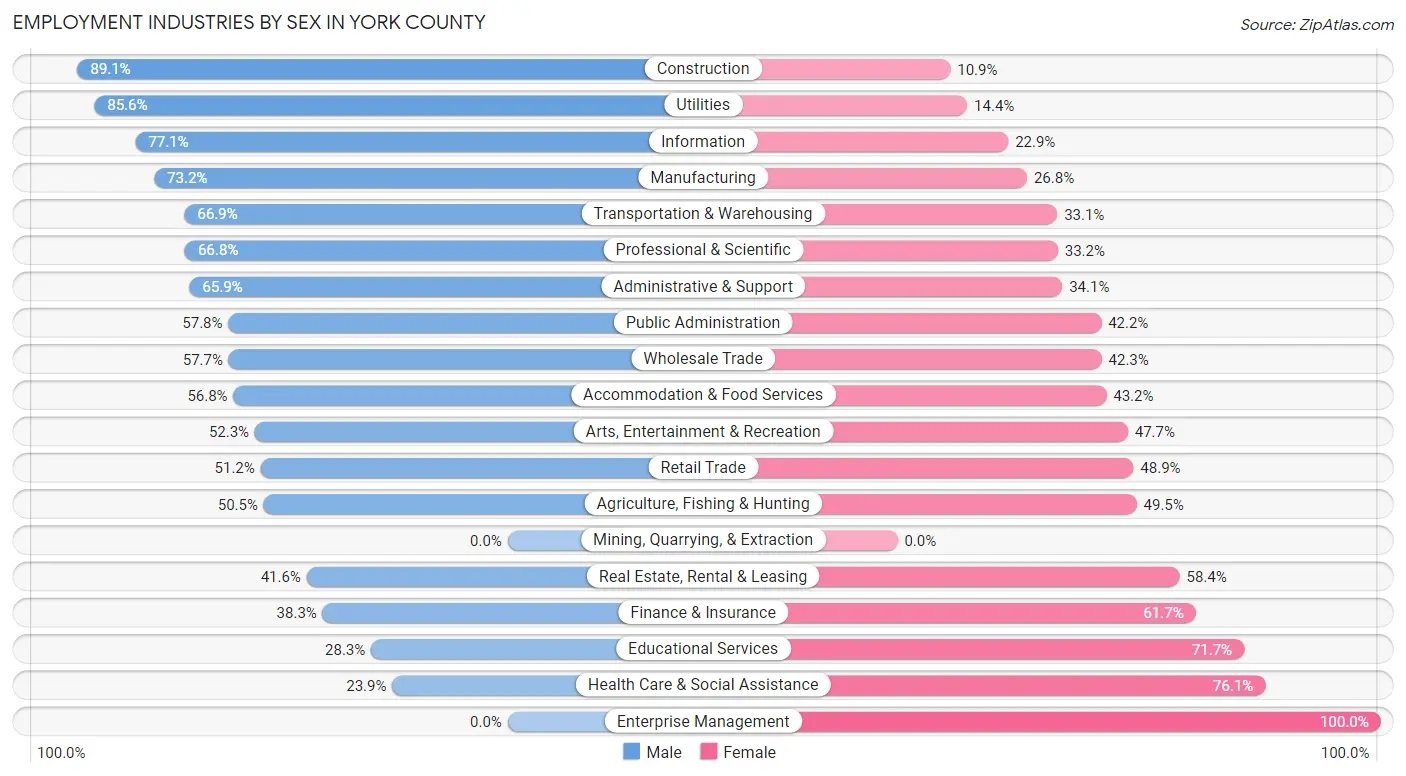
| Industry | Male | Female |
| Agriculture, Fishing & Hunting | 52 (50.5%) | 51 (49.5%) |
| Mining, Quarrying, & Extraction | 0 (0.0%) | 0 (0.0%) |
| Construction | 1,392 (89.1%) | 171 (10.9%) |
| Manufacturing | 2,459 (73.2%) | 901 (26.8%) |
| Wholesale Trade | 377 (57.7%) | 276 (42.3%) |
| Retail Trade | 1,559 (51.1%) | 1,489 (48.8%) |
| Transportation & Warehousing | 516 (66.9%) | 255 (33.1%) |
| Utilities | 160 (85.6%) | 27 (14.4%) |
| Information | 289 (77.1%) | 86 (22.9%) |
| Finance & Insurance | 367 (38.3%) | 591 (61.7%) |
| Real Estate, Rental & Leasing | 228 (41.6%) | 320 (58.4%) |
| Professional & Scientific | 2,495 (66.8%) | 1,240 (33.2%) |
| Enterprise Management | 0 (0.0%) | 43 (100.0%) |
| Administrative & Support | 838 (65.9%) | 434 (34.1%) |
| Educational Services | 1,065 (28.3%) | 2,701 (71.7%) |
| Health Care & Social Assistance | 873 (23.9%) | 2,781 (76.1%) |
| Arts, Entertainment & Recreation | 575 (52.3%) | 524 (47.7%) |
| Accommodation & Food Services | 1,136 (56.8%) | 865 (43.2%) |
| Public Administration | 1,971 (57.8%) | 1,438 (42.2%) |
| Total | 16,895 (53.0%) | 14,950 (46.9%) |
Education in York County
School Enrollment in York County
The most common levels of schooling among the 18,849 students in York County are elementary school (4,169 | 22.1%), high school (4,140 | 22.0%), and middle school (3,703 | 19.7%).
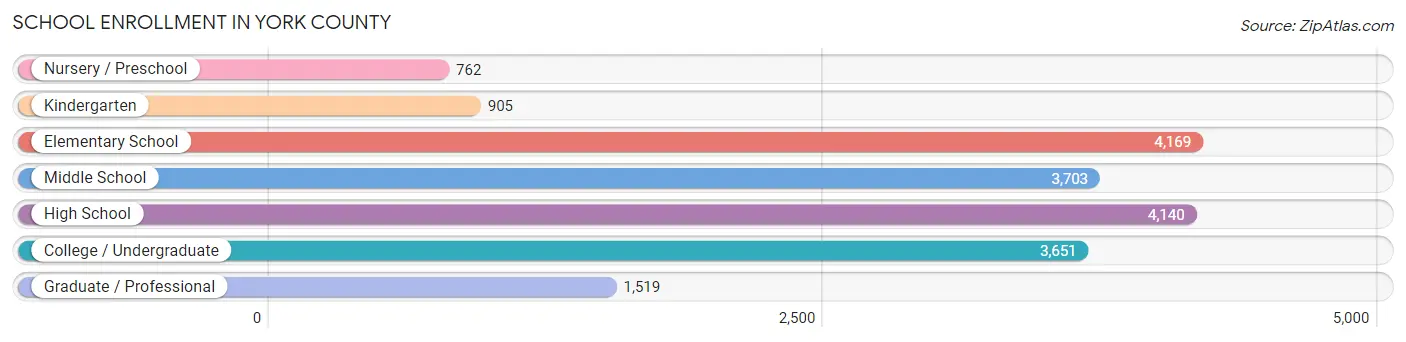
| School Level | # Students | % Students |
| Nursery / Preschool | 762 | 4.0% |
| Kindergarten | 905 | 4.8% |
| Elementary School | 4,169 | 22.1% |
| Middle School | 3,703 | 19.7% |
| High School | 4,140 | 22.0% |
| College / Undergraduate | 3,651 | 19.4% |
| Graduate / Professional | 1,519 | 8.1% |
| Total | 18,849 | 100.0% |
School Enrollment by Age by Funding Source in York County
Out of a total of 18,849 students who are enrolled in schools in York County, 3,016 (16.0%) attend a private institution, while the remaining 15,833 (84.0%) are enrolled in public schools. The age group of 3 to 4 year olds has the highest likelihood of being enrolled in private schools, with 442 (70.8% in the age bracket) enrolled. Conversely, the age group of 18 to 19 year olds has the lowest likelihood of being enrolled in a private school, with 1,113 (93.4% in the age bracket) attending a public institution.
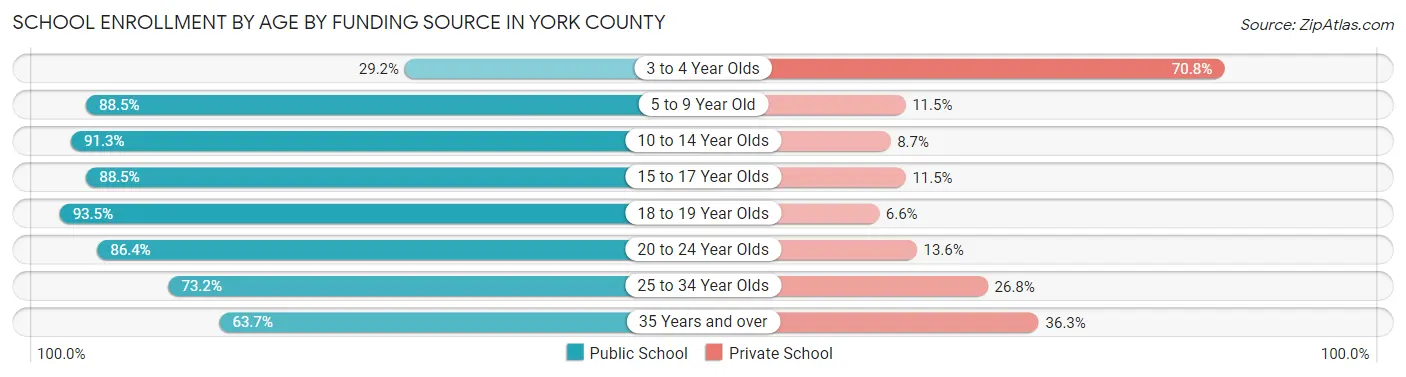
| Age Bracket | Public School | Private School |
| 3 to 4 Year Olds | 182 (29.2%) | 442 (70.8%) |
| 5 to 9 Year Old | 4,253 (88.5%) | 551 (11.5%) |
| 10 to 14 Year Olds | 4,319 (91.3%) | 410 (8.7%) |
| 15 to 17 Year Olds | 2,614 (88.5%) | 340 (11.5%) |
| 18 to 19 Year Olds | 1,113 (93.4%) | 78 (6.6%) |
| 20 to 24 Year Olds | 1,248 (86.4%) | 196 (13.6%) |
| 25 to 34 Year Olds | 983 (73.2%) | 360 (26.8%) |
| 35 Years and over | 1,121 (63.7%) | 639 (36.3%) |
| Total | 15,833 (84.0%) | 3,016 (16.0%) |
Educational Attainment by Field of Study in York County
Business (5,001 | 19.9%), education (3,047 | 12.1%), engineering (2,375 | 9.4%), science & technology (2,198 | 8.7%), and social sciences (1,793 | 7.1%) are the most common fields of study among 25,161 individuals in York County who have obtained a bachelor's degree or higher.
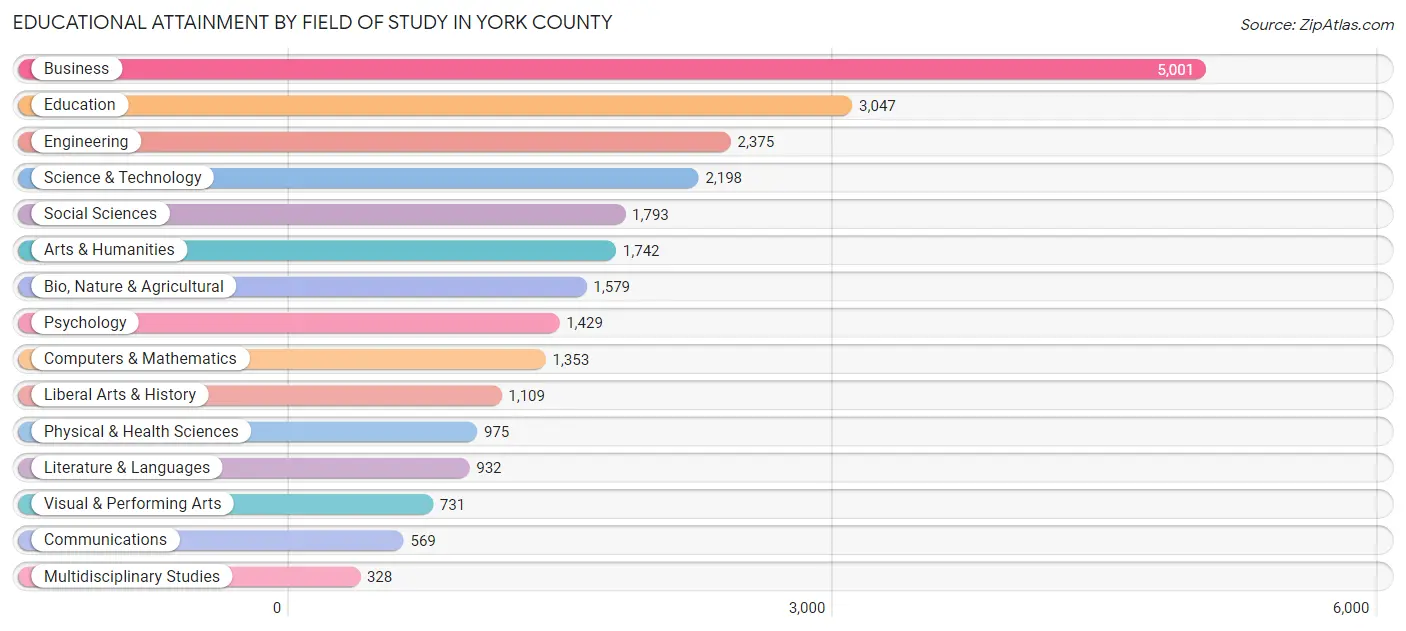
| Field of Study | # Graduates | % Graduates |
| Computers & Mathematics | 1,353 | 5.4% |
| Bio, Nature & Agricultural | 1,579 | 6.3% |
| Physical & Health Sciences | 975 | 3.9% |
| Psychology | 1,429 | 5.7% |
| Social Sciences | 1,793 | 7.1% |
| Engineering | 2,375 | 9.4% |
| Multidisciplinary Studies | 328 | 1.3% |
| Science & Technology | 2,198 | 8.7% |
| Business | 5,001 | 19.9% |
| Education | 3,047 | 12.1% |
| Literature & Languages | 932 | 3.7% |
| Liberal Arts & History | 1,109 | 4.4% |
| Visual & Performing Arts | 731 | 2.9% |
| Communications | 569 | 2.3% |
| Arts & Humanities | 1,742 | 6.9% |
| Total | 25,161 | 100.0% |
Transportation & Commute in York County
Vehicle Availability by Sex in York County
The most prevalent vehicle ownership categories in York County are males with 2 vehicles (7,993, accounting for 41.9%) and females with 2 vehicles (5,983, making up 51.9%).
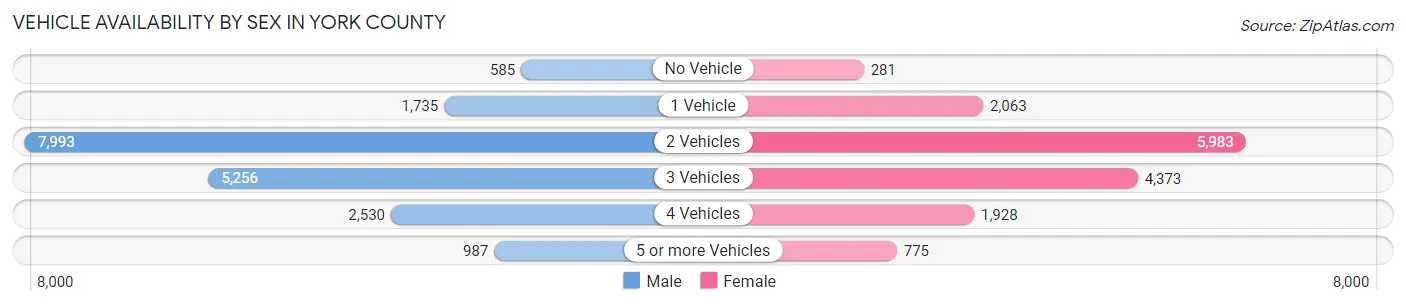
| Vehicles Available | Male | Female |
| No Vehicle | 585 (3.1%) | 281 (1.8%) |
| 1 Vehicle | 1,735 (9.1%) | 2,063 (13.4%) |
| 2 Vehicles | 7,993 (41.9%) | 5,983 (38.8%) |
| 3 Vehicles | 5,256 (27.5%) | 4,373 (28.4%) |
| 4 Vehicles | 2,530 (13.3%) | 1,928 (12.5%) |
| 5 or more Vehicles | 987 (5.2%) | 775 (5.0%) |
| Total | 19,086 (100.0%) | 15,403 (100.0%) |
Commute Time in York County
The most frequently occuring commute durations in York County are 15 to 19 minutes (6,443 commuters, 20.3%), 20 to 24 minutes (5,335 commuters, 16.8%), and 10 to 14 minutes (5,039 commuters, 15.9%).
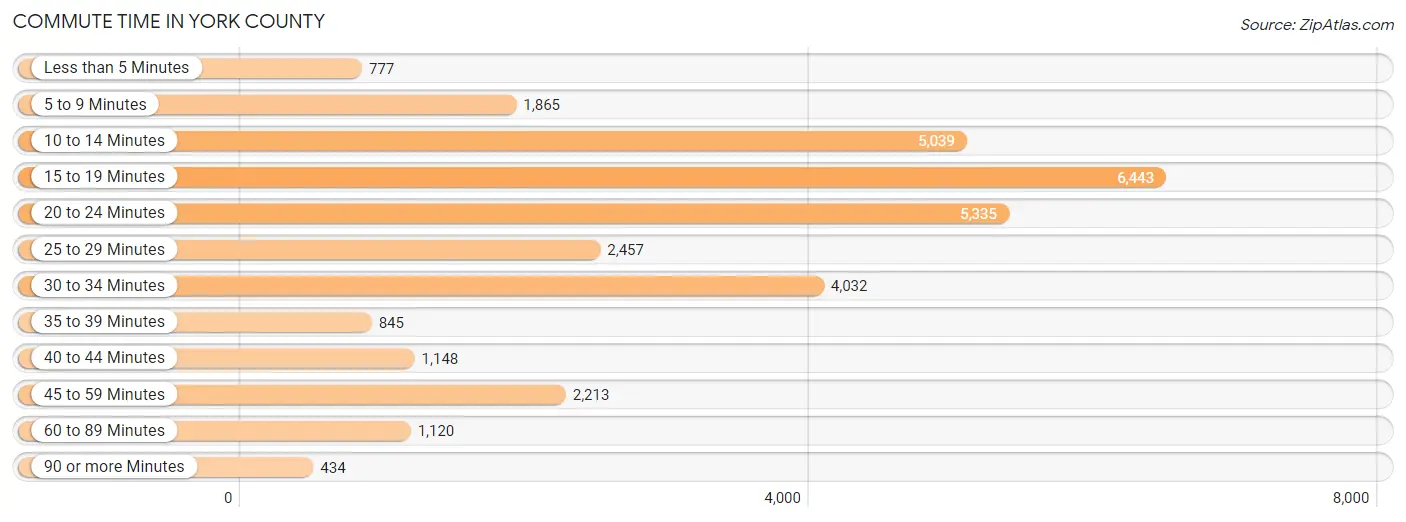
| Commute Time | # Commuters | % Commuters |
| Less than 5 Minutes | 777 | 2.5% |
| 5 to 9 Minutes | 1,865 | 5.9% |
| 10 to 14 Minutes | 5,039 | 15.9% |
| 15 to 19 Minutes | 6,443 | 20.3% |
| 20 to 24 Minutes | 5,335 | 16.8% |
| 25 to 29 Minutes | 2,457 | 7.7% |
| 30 to 34 Minutes | 4,032 | 12.7% |
| 35 to 39 Minutes | 845 | 2.7% |
| 40 to 44 Minutes | 1,148 | 3.6% |
| 45 to 59 Minutes | 2,213 | 7.0% |
| 60 to 89 Minutes | 1,120 | 3.5% |
| 90 or more Minutes | 434 | 1.4% |
Commute Time by Sex in York County
The most common commute times in York County are 15 to 19 minutes (3,643 commuters, 20.6%) for males and 15 to 19 minutes (2,800 commuters, 20.0%) for females.
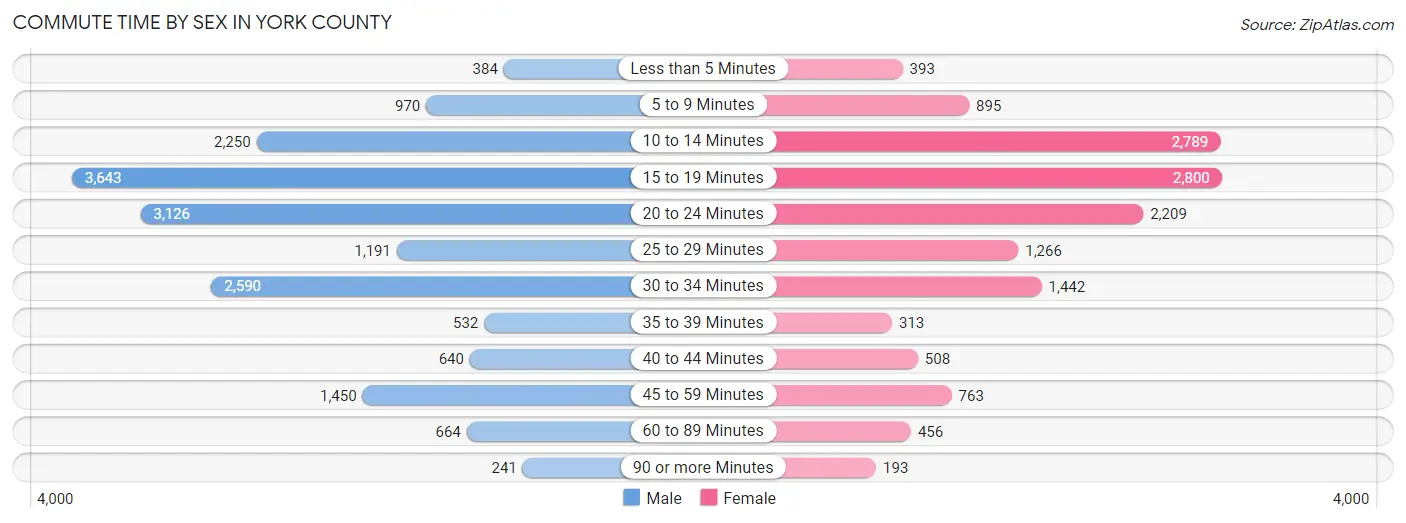
| Commute Time | Male | Female |
| Less than 5 Minutes | 384 (2.2%) | 393 (2.8%) |
| 5 to 9 Minutes | 970 (5.5%) | 895 (6.4%) |
| 10 to 14 Minutes | 2,250 (12.7%) | 2,789 (19.9%) |
| 15 to 19 Minutes | 3,643 (20.6%) | 2,800 (20.0%) |
| 20 to 24 Minutes | 3,126 (17.7%) | 2,209 (15.8%) |
| 25 to 29 Minutes | 1,191 (6.7%) | 1,266 (9.0%) |
| 30 to 34 Minutes | 2,590 (14.6%) | 1,442 (10.3%) |
| 35 to 39 Minutes | 532 (3.0%) | 313 (2.2%) |
| 40 to 44 Minutes | 640 (3.6%) | 508 (3.6%) |
| 45 to 59 Minutes | 1,450 (8.2%) | 763 (5.4%) |
| 60 to 89 Minutes | 664 (3.8%) | 456 (3.3%) |
| 90 or more Minutes | 241 (1.4%) | 193 (1.4%) |
Time of Departure to Work by Sex in York County
The most frequent times of departure to work in York County are 6:30 AM to 6:59 AM (2,618, 14.8%) for males and 7:30 AM to 7:59 AM (2,207, 15.7%) for females.
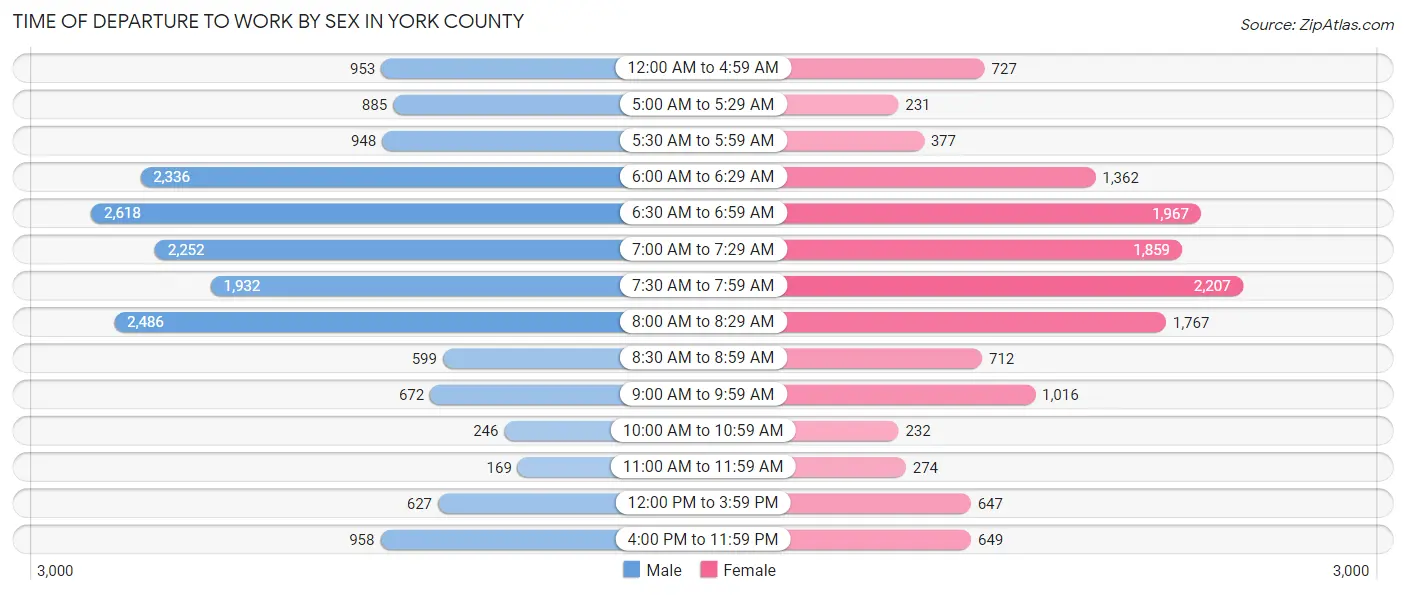
| Time of Departure | Male | Female |
| 12:00 AM to 4:59 AM | 953 (5.4%) | 727 (5.2%) |
| 5:00 AM to 5:29 AM | 885 (5.0%) | 231 (1.7%) |
| 5:30 AM to 5:59 AM | 948 (5.4%) | 377 (2.7%) |
| 6:00 AM to 6:29 AM | 2,336 (13.2%) | 1,362 (9.7%) |
| 6:30 AM to 6:59 AM | 2,618 (14.8%) | 1,967 (14.0%) |
| 7:00 AM to 7:29 AM | 2,252 (12.7%) | 1,859 (13.3%) |
| 7:30 AM to 7:59 AM | 1,932 (10.9%) | 2,207 (15.7%) |
| 8:00 AM to 8:29 AM | 2,486 (14.1%) | 1,767 (12.6%) |
| 8:30 AM to 8:59 AM | 599 (3.4%) | 712 (5.1%) |
| 9:00 AM to 9:59 AM | 672 (3.8%) | 1,016 (7.2%) |
| 10:00 AM to 10:59 AM | 246 (1.4%) | 232 (1.7%) |
| 11:00 AM to 11:59 AM | 169 (1.0%) | 274 (1.9%) |
| 12:00 PM to 3:59 PM | 627 (3.5%) | 647 (4.6%) |
| 4:00 PM to 11:59 PM | 958 (5.4%) | 649 (4.6%) |
| Total | 17,681 (100.0%) | 14,027 (100.0%) |
Housing Occupancy in York County
Occupancy by Ownership in York County
Of the total 25,878 dwellings in York County, owner-occupied units account for 18,671 (72.2%), while renter-occupied units make up 7,207 (27.9%).
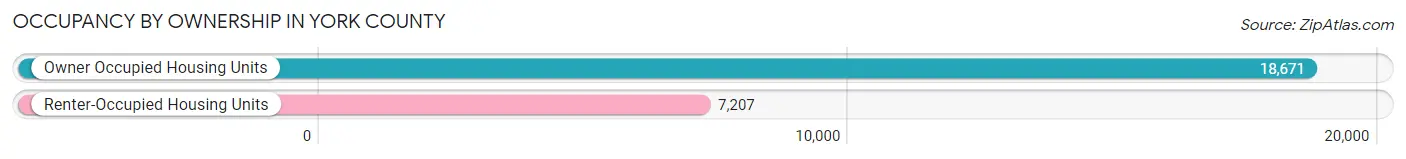
| Occupancy | # Housing Units | % Housing Units |
| Owner Occupied Housing Units | 18,671 | 72.2% |
| Renter-Occupied Housing Units | 7,207 | 27.9% |
| Total Occupied Housing Units | 25,878 | 100.0% |
Occupancy by Household Size in York County
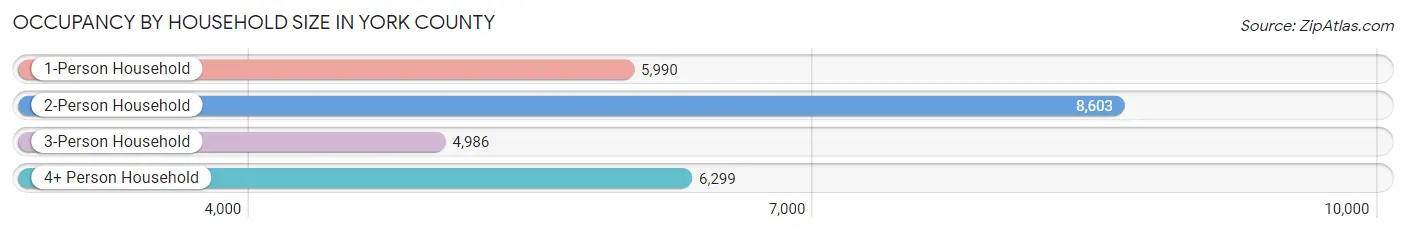
| Household Size | # Housing Units | % Housing Units |
| 1-Person Household | 5,990 | 23.2% |
| 2-Person Household | 8,603 | 33.2% |
| 3-Person Household | 4,986 | 19.3% |
| 4+ Person Household | 6,299 | 24.3% |
| Total Housing Units | 25,878 | 100.0% |
Occupancy by Ownership by Household Size in York County
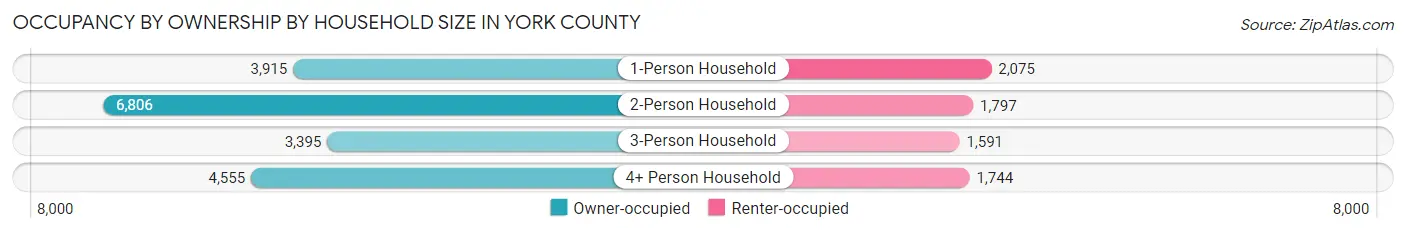
| Household Size | Owner-occupied | Renter-occupied |
| 1-Person Household | 3,915 (65.4%) | 2,075 (34.6%) |
| 2-Person Household | 6,806 (79.1%) | 1,797 (20.9%) |
| 3-Person Household | 3,395 (68.1%) | 1,591 (31.9%) |
| 4+ Person Household | 4,555 (72.3%) | 1,744 (27.7%) |
| Total Housing Units | 18,671 (72.2%) | 7,207 (27.9%) |
Occupancy by Educational Attainment in York County
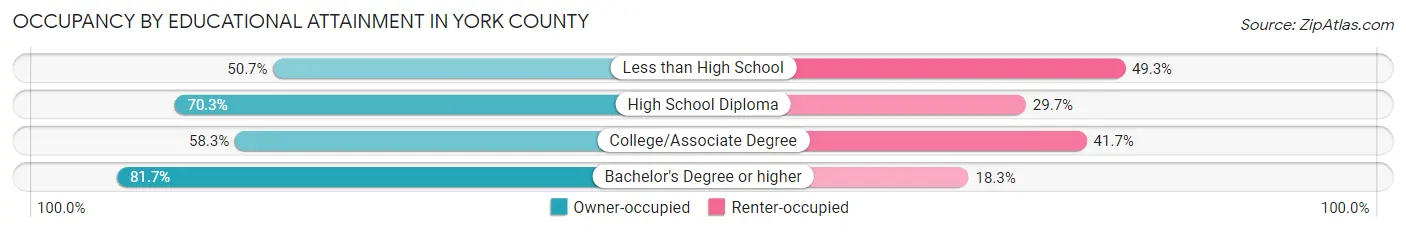
| Household Size | Owner-occupied | Renter-occupied |
| Less than High School | 408 (50.7%) | 397 (49.3%) |
| High School Diploma | 2,520 (70.3%) | 1,064 (29.7%) |
| College/Associate Degree | 4,504 (58.3%) | 3,225 (41.7%) |
| Bachelor's Degree or higher | 11,239 (81.7%) | 2,521 (18.3%) |
Occupancy by Age of Householder in York County
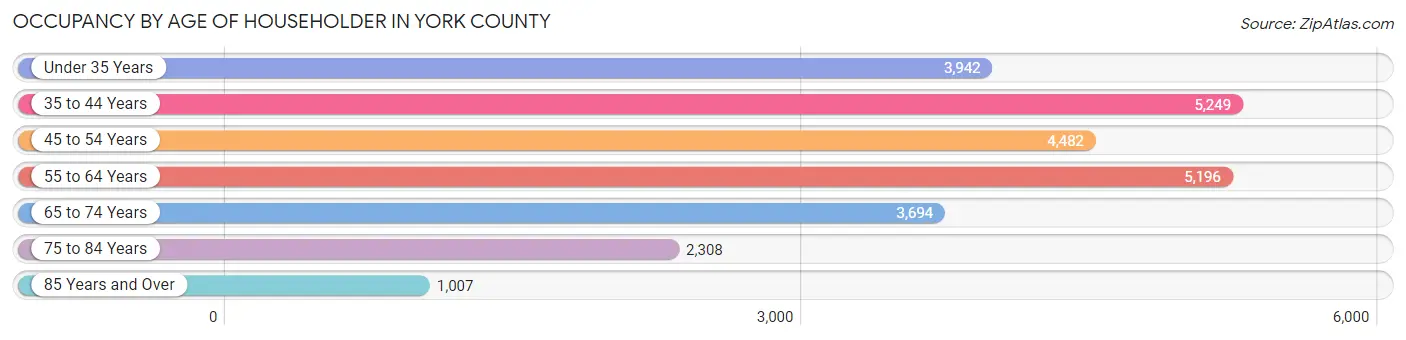
| Age Bracket | # Households | % Households |
| Under 35 Years | 3,942 | 15.2% |
| 35 to 44 Years | 5,249 | 20.3% |
| 45 to 54 Years | 4,482 | 17.3% |
| 55 to 64 Years | 5,196 | 20.1% |
| 65 to 74 Years | 3,694 | 14.3% |
| 75 to 84 Years | 2,308 | 8.9% |
| 85 Years and Over | 1,007 | 3.9% |
| Total | 25,878 | 100.0% |
Housing Finances in York County
Median Income by Occupancy in York County
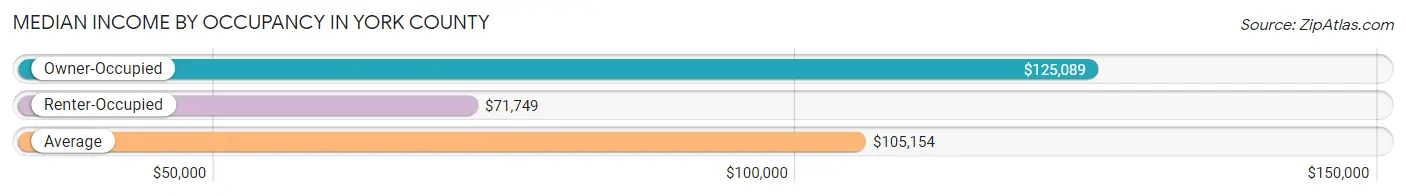
| Occupancy Type | # Households | Median Income |
| Owner-Occupied | 18,671 (72.2%) | $125,089 |
| Renter-Occupied | 7,207 (27.9%) | $71,749 |
| Average | 25,878 (100.0%) | $105,154 |
Occupancy by Householder Income Bracket in York County
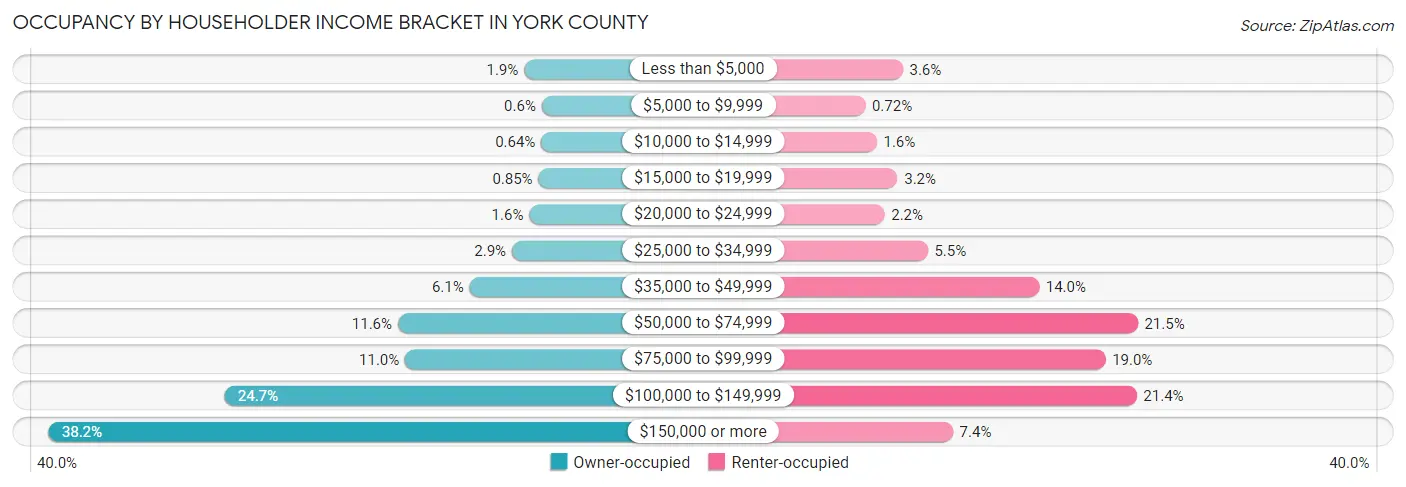
| Income Bracket | Owner-occupied | Renter-occupied |
| Less than $5,000 | 362 (1.9%) | 258 (3.6%) |
| $5,000 to $9,999 | 112 (0.6%) | 52 (0.7%) |
| $10,000 to $14,999 | 120 (0.6%) | 115 (1.6%) |
| $15,000 to $19,999 | 159 (0.9%) | 229 (3.2%) |
| $20,000 to $24,999 | 289 (1.5%) | 158 (2.2%) |
| $25,000 to $34,999 | 535 (2.9%) | 395 (5.5%) |
| $35,000 to $49,999 | 1,138 (6.1%) | 1,006 (14.0%) |
| $50,000 to $74,999 | 2,158 (11.6%) | 1,548 (21.5%) |
| $75,000 to $99,999 | 2,055 (11.0%) | 1,371 (19.0%) |
| $100,000 to $149,999 | 4,620 (24.7%) | 1,542 (21.4%) |
| $150,000 or more | 7,123 (38.2%) | 533 (7.4%) |
| Total | 18,671 (100.0%) | 7,207 (100.0%) |
Monthly Housing Cost Tiers in York County
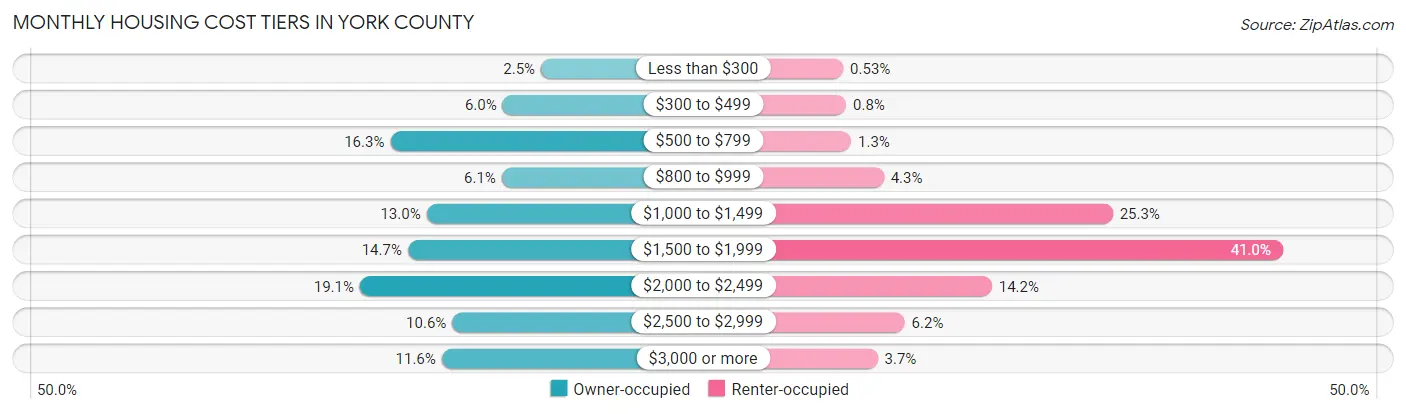
| Monthly Cost | Owner-occupied | Renter-occupied |
| Less than $300 | 461 (2.5%) | 38 (0.5%) |
| $300 to $499 | 1,120 (6.0%) | 58 (0.8%) |
| $500 to $799 | 3,050 (16.3%) | 91 (1.3%) |
| $800 to $999 | 1,135 (6.1%) | 307 (4.3%) |
| $1,000 to $1,499 | 2,428 (13.0%) | 1,826 (25.3%) |
| $1,500 to $1,999 | 2,751 (14.7%) | 2,955 (41.0%) |
| $2,000 to $2,499 | 3,573 (19.1%) | 1,024 (14.2%) |
| $2,500 to $2,999 | 1,986 (10.6%) | 446 (6.2%) |
| $3,000 or more | 2,167 (11.6%) | 267 (3.7%) |
| Total | 18,671 (100.0%) | 7,207 (100.0%) |
Physical Housing Characteristics in York County
Housing Structures in York County
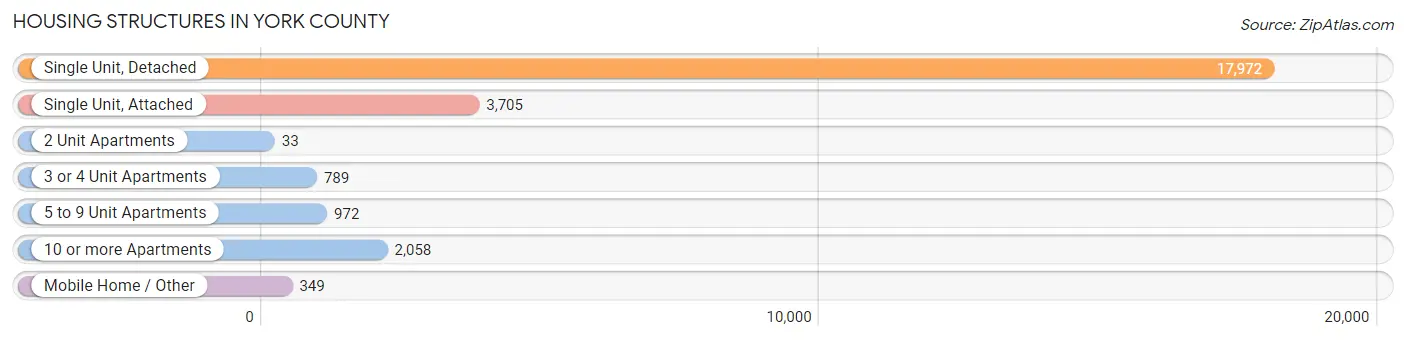
| Structure Type | # Housing Units | % Housing Units |
| Single Unit, Detached | 17,972 | 69.5% |
| Single Unit, Attached | 3,705 | 14.3% |
| 2 Unit Apartments | 33 | 0.1% |
| 3 or 4 Unit Apartments | 789 | 3.0% |
| 5 to 9 Unit Apartments | 972 | 3.8% |
| 10 or more Apartments | 2,058 | 8.0% |
| Mobile Home / Other | 349 | 1.3% |
| Total | 25,878 | 100.0% |
Housing Structures by Occupancy in York County
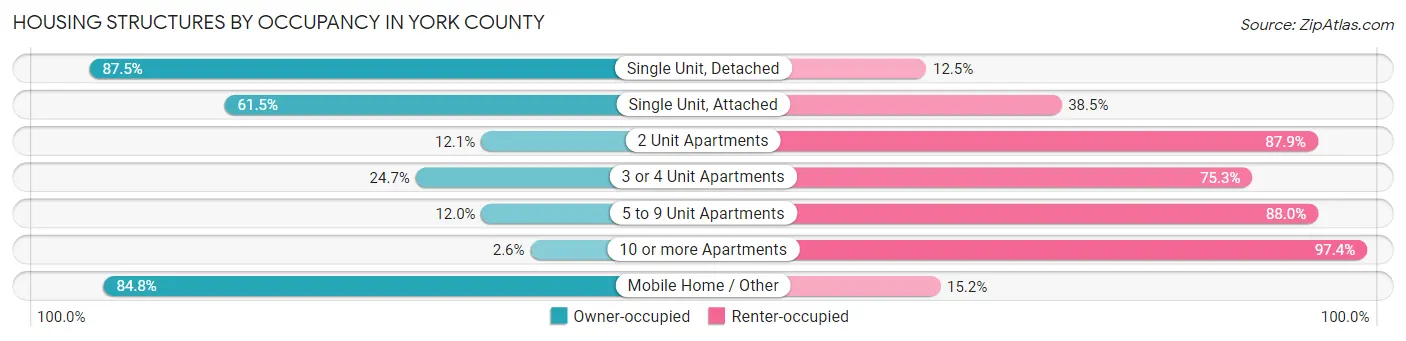
| Structure Type | Owner-occupied | Renter-occupied |
| Single Unit, Detached | 15,727 (87.5%) | 2,245 (12.5%) |
| Single Unit, Attached | 2,278 (61.5%) | 1,427 (38.5%) |
| 2 Unit Apartments | 4 (12.1%) | 29 (87.9%) |
| 3 or 4 Unit Apartments | 195 (24.7%) | 594 (75.3%) |
| 5 to 9 Unit Apartments | 117 (12.0%) | 855 (88.0%) |
| 10 or more Apartments | 54 (2.6%) | 2,004 (97.4%) |
| Mobile Home / Other | 296 (84.8%) | 53 (15.2%) |
| Total | 18,671 (72.2%) | 7,207 (27.9%) |
Housing Structures by Number of Rooms in York County
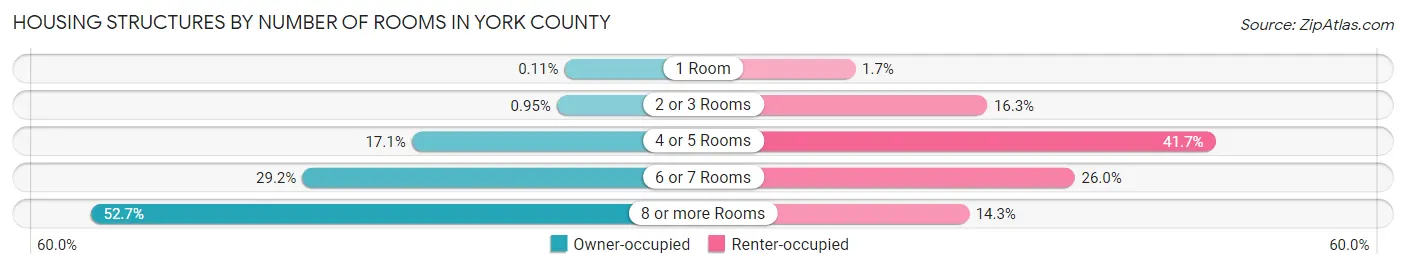
| Number of Rooms | Owner-occupied | Renter-occupied |
| 1 Room | 21 (0.1%) | 121 (1.7%) |
| 2 or 3 Rooms | 178 (0.9%) | 1,176 (16.3%) |
| 4 or 5 Rooms | 3,185 (17.1%) | 3,003 (41.7%) |
| 6 or 7 Rooms | 5,452 (29.2%) | 1,877 (26.0%) |
| 8 or more Rooms | 9,835 (52.7%) | 1,030 (14.3%) |
| Total | 18,671 (100.0%) | 7,207 (100.0%) |
Housing Structure by Heating Type in York County
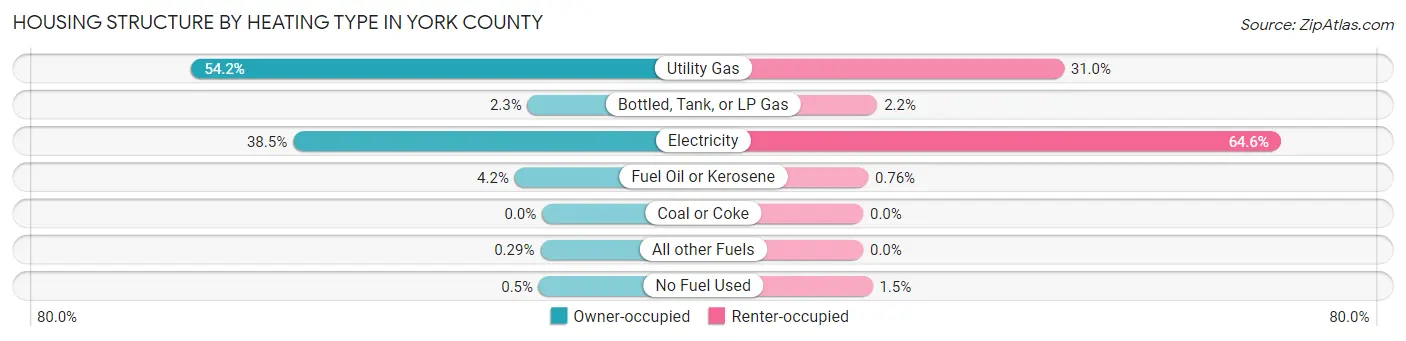
| Heating Type | Owner-occupied | Renter-occupied |
| Utility Gas | 10,122 (54.2%) | 2,236 (31.0%) |
| Bottled, Tank, or LP Gas | 420 (2.2%) | 158 (2.2%) |
| Electricity | 7,191 (38.5%) | 4,653 (64.6%) |
| Fuel Oil or Kerosene | 789 (4.2%) | 55 (0.8%) |
| Coal or Coke | 0 (0.0%) | 0 (0.0%) |
| All other Fuels | 55 (0.3%) | 0 (0.0%) |
| No Fuel Used | 94 (0.5%) | 105 (1.5%) |
| Total | 18,671 (100.0%) | 7,207 (100.0%) |
Household Vehicle Usage in York County
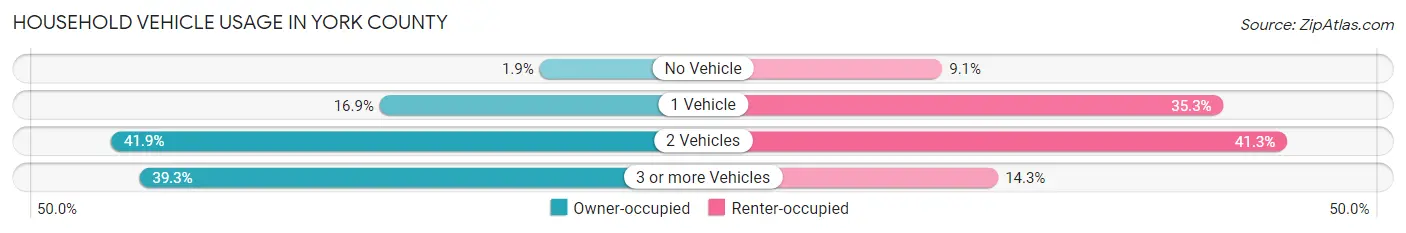
| Vehicles per Household | Owner-occupied | Renter-occupied |
| No Vehicle | 361 (1.9%) | 655 (9.1%) |
| 1 Vehicle | 3,146 (16.9%) | 2,546 (35.3%) |
| 2 Vehicles | 7,828 (41.9%) | 2,975 (41.3%) |
| 3 or more Vehicles | 7,336 (39.3%) | 1,031 (14.3%) |
| Total | 18,671 (100.0%) | 7,207 (100.0%) |
Real Estate & Mortgages in York County
Real Estate and Mortgage Overview in York County
| Characteristic | Without Mortgage | With Mortgage |
| Housing Units | 5,321 | 13,350 |
| Median Property Value | $382,100 | $388,800 |
| Median Household Income | $84,023 | $5,828 |
| Monthly Housing Costs | $660 | $2,166 |
| Real Estate Taxes | $2,683 | $167 |
Property Value by Mortgage Status in York County
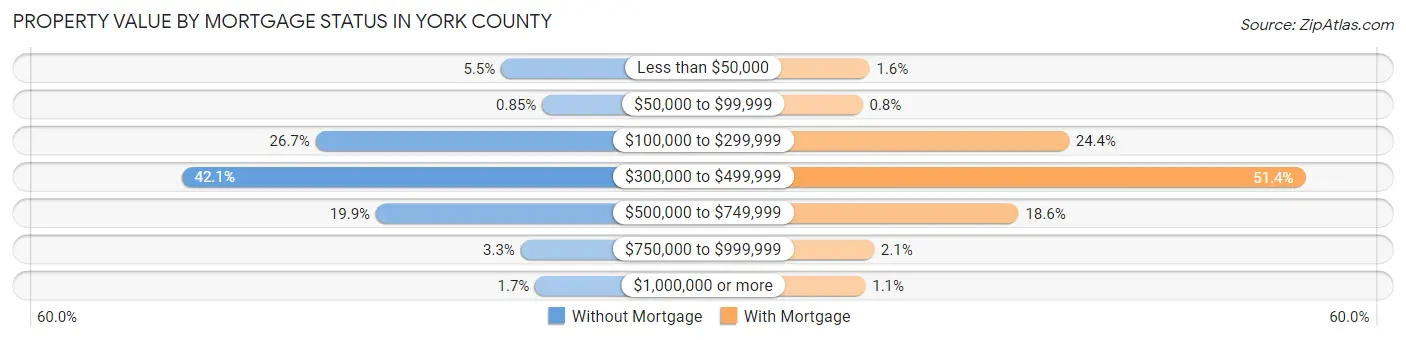
| Property Value | Without Mortgage | With Mortgage |
| Less than $50,000 | 295 (5.5%) | 213 (1.6%) |
| $50,000 to $99,999 | 45 (0.9%) | 107 (0.8%) |
| $100,000 to $299,999 | 1,423 (26.7%) | 3,253 (24.4%) |
| $300,000 to $499,999 | 2,238 (42.1%) | 6,863 (51.4%) |
| $500,000 to $749,999 | 1,056 (19.9%) | 2,486 (18.6%) |
| $750,000 to $999,999 | 176 (3.3%) | 280 (2.1%) |
| $1,000,000 or more | 88 (1.7%) | 148 (1.1%) |
| Total | 5,321 (100.0%) | 13,350 (100.0%) |
Household Income by Mortgage Status in York County
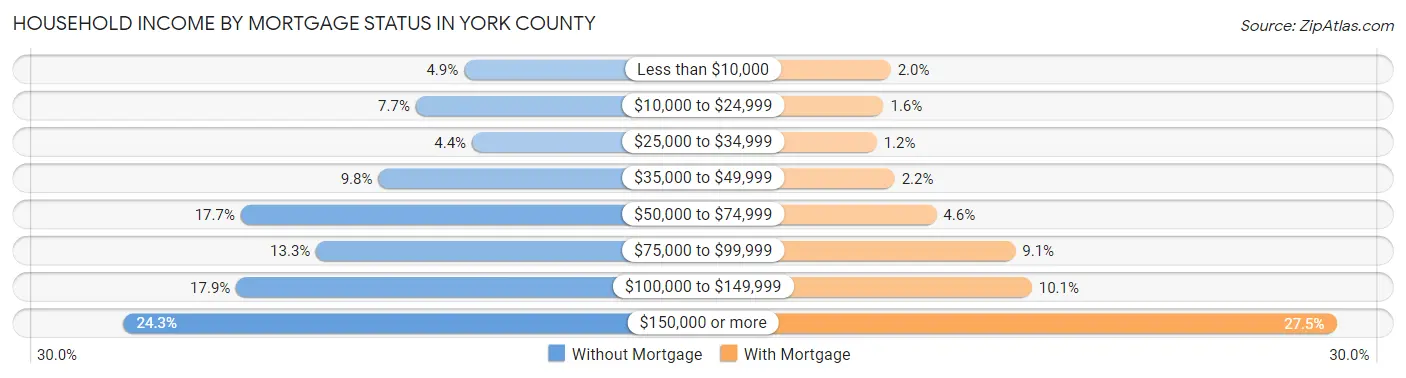
| Household Income | Without Mortgage | With Mortgage |
| Less than $10,000 | 260 (4.9%) | 268 (2.0%) |
| $10,000 to $24,999 | 407 (7.6%) | 214 (1.6%) |
| $25,000 to $34,999 | 236 (4.4%) | 161 (1.2%) |
| $35,000 to $49,999 | 521 (9.8%) | 299 (2.2%) |
| $50,000 to $74,999 | 939 (17.6%) | 617 (4.6%) |
| $75,000 to $99,999 | 710 (13.3%) | 1,219 (9.1%) |
| $100,000 to $149,999 | 953 (17.9%) | 1,345 (10.1%) |
| $150,000 or more | 1,295 (24.3%) | 3,667 (27.5%) |
| Total | 5,321 (100.0%) | 13,350 (100.0%) |
Property Value to Household Income Ratio in York County
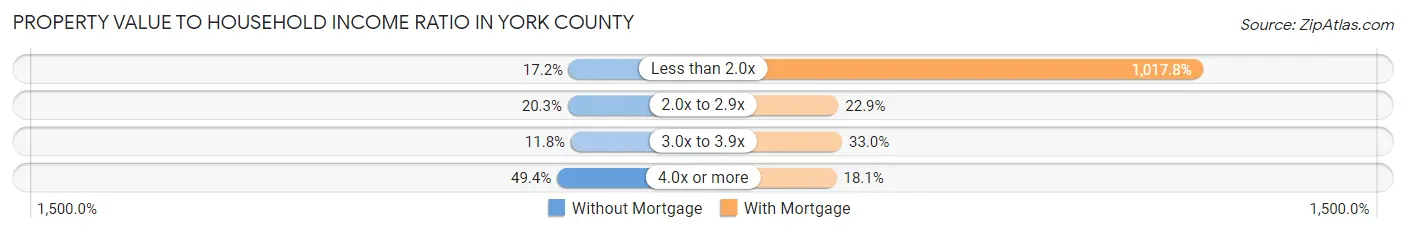
| Value-to-Income Ratio | Without Mortgage | With Mortgage |
| Less than 2.0x | 916 (17.2%) | 135,878 (1,017.8%) |
| 2.0x to 2.9x | 1,078 (20.3%) | 3,063 (22.9%) |
| 3.0x to 3.9x | 628 (11.8%) | 4,400 (33.0%) |
| 4.0x or more | 2,630 (49.4%) | 2,415 (18.1%) |
| Total | 5,321 (100.0%) | 13,350 (100.0%) |
Real Estate Taxes by Mortgage Status in York County
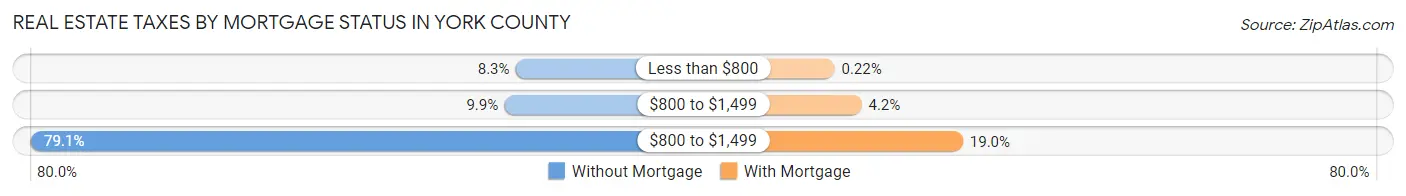
| Property Taxes | Without Mortgage | With Mortgage |
| Less than $800 | 441 (8.3%) | 29 (0.2%) |
| $800 to $1,499 | 529 (9.9%) | 556 (4.2%) |
| $800 to $1,499 | 4,206 (79.0%) | 2,532 (19.0%) |
| Total | 5,321 (100.0%) | 13,350 (100.0%) |
Health & Disability in York County
Health Insurance Coverage by Age in York County
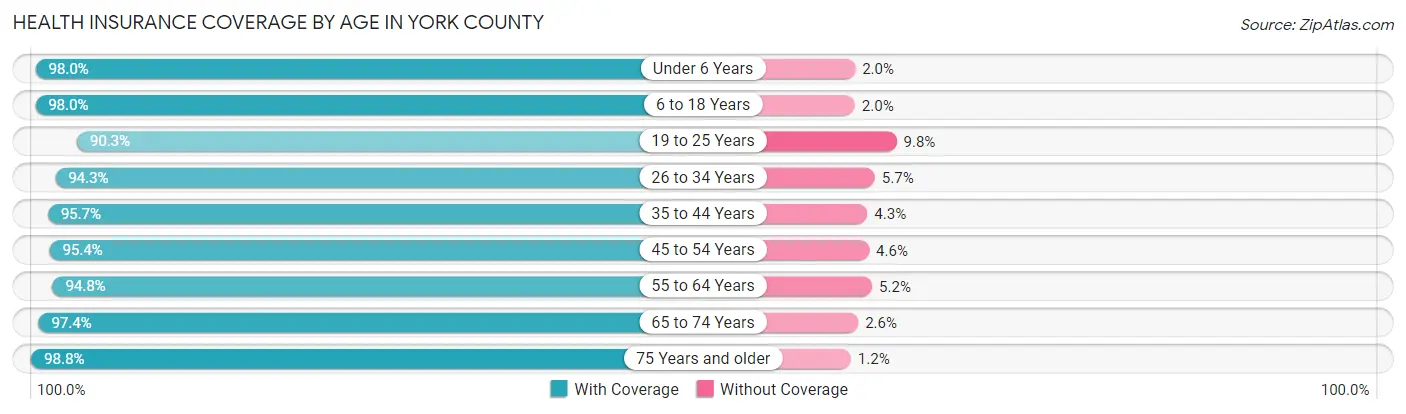
| Age Bracket | With Coverage | Without Coverage |
| Under 6 Years | 4,288 (98.0%) | 89 (2.0%) |
| 6 to 18 Years | 12,734 (98.0%) | 257 (2.0%) |
| 19 to 25 Years | 4,229 (90.2%) | 457 (9.8%) |
| 26 to 34 Years | 5,715 (94.3%) | 346 (5.7%) |
| 35 to 44 Years | 8,065 (95.7%) | 363 (4.3%) |
| 45 to 54 Years | 7,773 (95.4%) | 378 (4.6%) |
| 55 to 64 Years | 8,884 (94.8%) | 487 (5.2%) |
| 65 to 74 Years | 6,556 (97.4%) | 174 (2.6%) |
| 75 Years and older | 5,053 (98.8%) | 63 (1.2%) |
| Total | 63,297 (96.0%) | 2,614 (4.0%) |
Health Insurance Coverage by Citizenship Status in York County
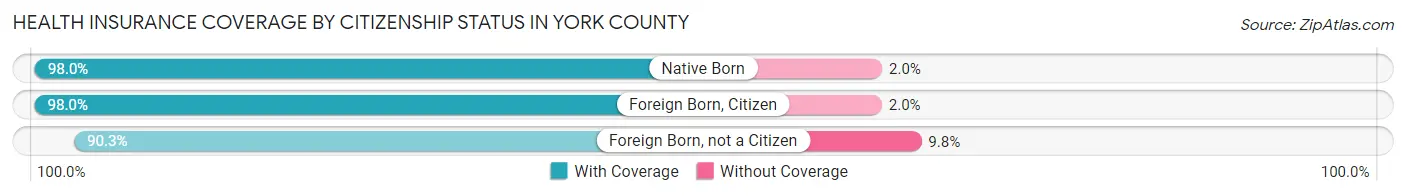
| Citizenship Status | With Coverage | Without Coverage |
| Native Born | 4,288 (98.0%) | 89 (2.0%) |
| Foreign Born, Citizen | 12,734 (98.0%) | 257 (2.0%) |
| Foreign Born, not a Citizen | 4,229 (90.2%) | 457 (9.8%) |
Health Insurance Coverage by Household Income in York County
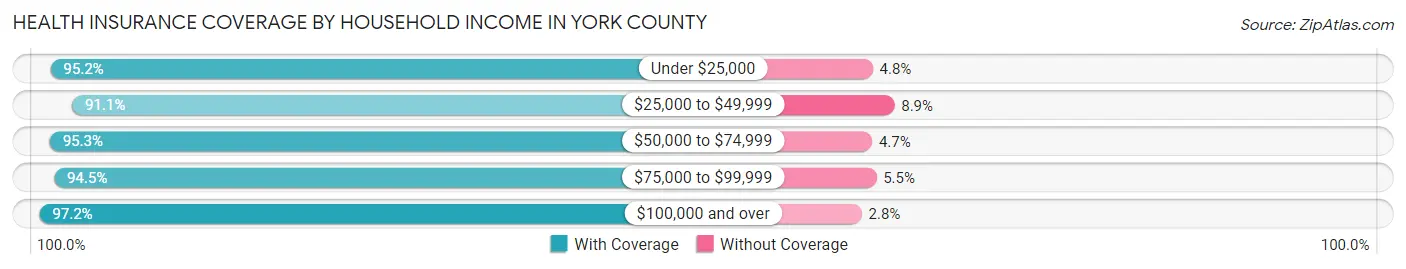
| Household Income | With Coverage | Without Coverage |
| Under $25,000 | 2,753 (95.2%) | 140 (4.8%) |
| $25,000 to $49,999 | 5,168 (91.1%) | 505 (8.9%) |
| $50,000 to $74,999 | 6,976 (95.3%) | 345 (4.7%) |
| $75,000 to $99,999 | 8,123 (94.5%) | 474 (5.5%) |
| $100,000 and over | 40,267 (97.2%) | 1,150 (2.8%) |
Public vs Private Health Insurance Coverage by Age in York County
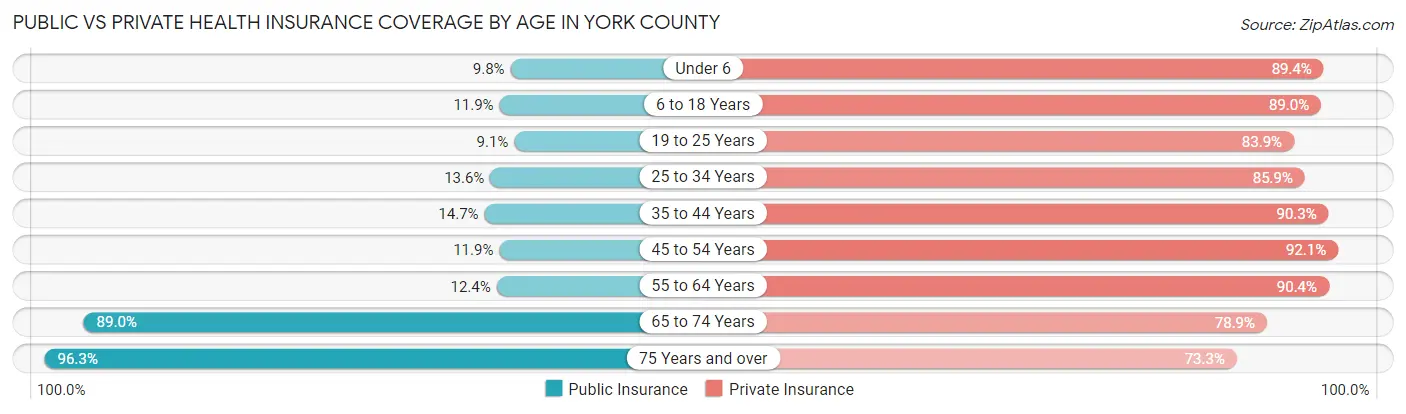
| Age Bracket | Public Insurance | Private Insurance |
| Under 6 | 430 (9.8%) | 3,915 (89.4%) |
| 6 to 18 Years | 1,541 (11.9%) | 11,555 (88.9%) |
| 19 to 25 Years | 428 (9.1%) | 3,932 (83.9%) |
| 25 to 34 Years | 823 (13.6%) | 5,208 (85.9%) |
| 35 to 44 Years | 1,235 (14.6%) | 7,614 (90.3%) |
| 45 to 54 Years | 970 (11.9%) | 7,507 (92.1%) |
| 55 to 64 Years | 1,162 (12.4%) | 8,471 (90.4%) |
| 65 to 74 Years | 5,992 (89.0%) | 5,309 (78.9%) |
| 75 Years and over | 4,926 (96.3%) | 3,750 (73.3%) |
| Total | 17,507 (26.6%) | 57,261 (86.9%) |
Disability Status by Sex by Age in York County
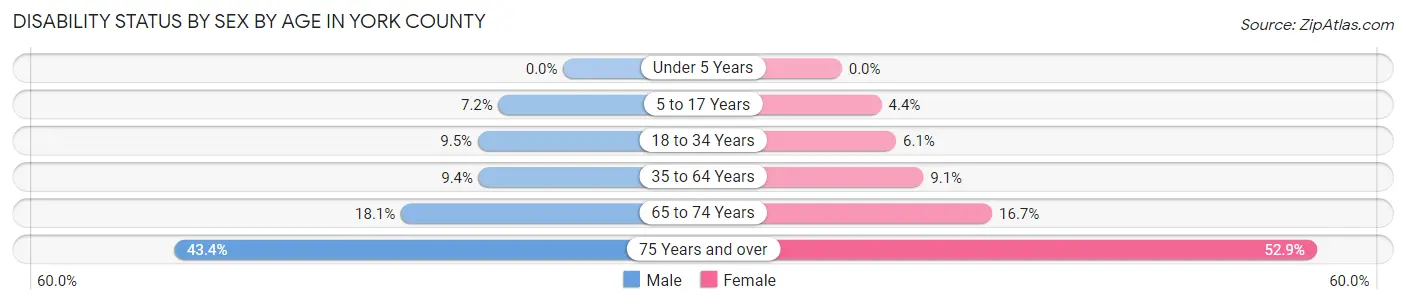
| Age Bracket | Male | Female |
| Under 5 Years | 0 (0.0%) | 0 (0.0%) |
| 5 to 17 Years | 459 (7.2%) | 279 (4.4%) |
| 18 to 34 Years | 532 (9.5%) | 371 (6.0%) |
| 35 to 64 Years | 1,154 (9.4%) | 1,243 (9.1%) |
| 65 to 74 Years | 577 (18.1%) | 592 (16.7%) |
| 75 Years and over | 944 (43.4%) | 1,554 (52.9%) |
Disability Class by Sex by Age in York County
Disability Class: Hearing Difficulty
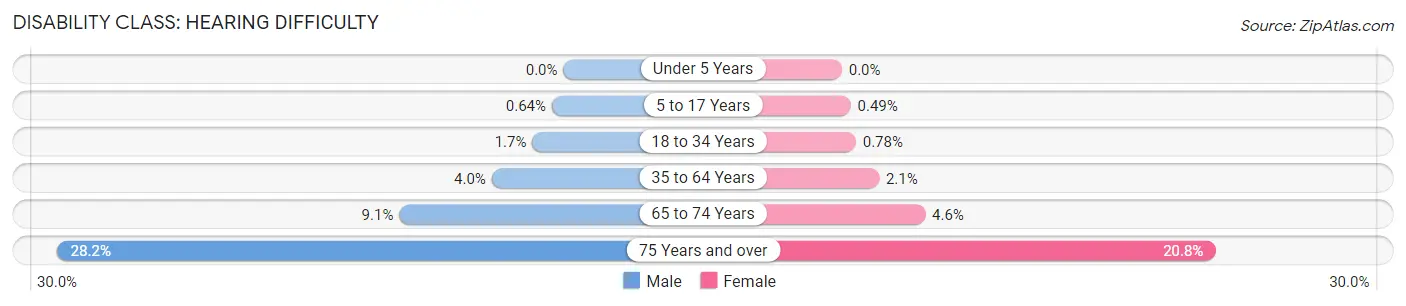
| Age Bracket | Male | Female |
| Under 5 Years | 0 (0.0%) | 0 (0.0%) |
| 5 to 17 Years | 41 (0.6%) | 31 (0.5%) |
| 18 to 34 Years | 97 (1.7%) | 48 (0.8%) |
| 35 to 64 Years | 489 (4.0%) | 283 (2.1%) |
| 65 to 74 Years | 292 (9.1%) | 164 (4.6%) |
| 75 Years and over | 613 (28.2%) | 611 (20.8%) |
Disability Class: Vision Difficulty
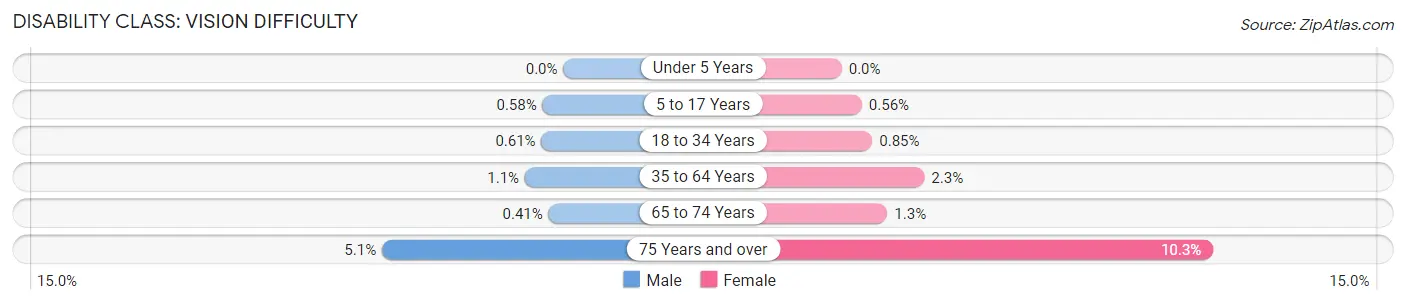
| Age Bracket | Male | Female |
| Under 5 Years | 0 (0.0%) | 0 (0.0%) |
| 5 to 17 Years | 37 (0.6%) | 35 (0.6%) |
| 18 to 34 Years | 34 (0.6%) | 52 (0.9%) |
| 35 to 64 Years | 131 (1.1%) | 315 (2.3%) |
| 65 to 74 Years | 13 (0.4%) | 45 (1.3%) |
| 75 Years and over | 110 (5.1%) | 304 (10.3%) |
Disability Class: Cognitive Difficulty
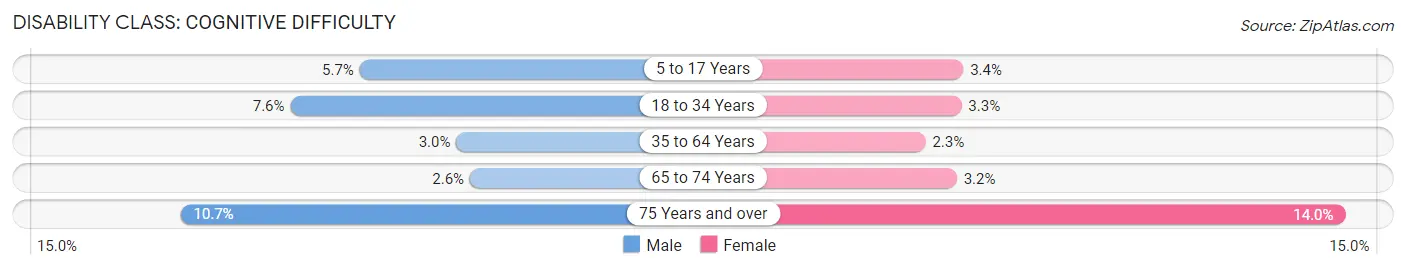
| Age Bracket | Male | Female |
| 5 to 17 Years | 361 (5.7%) | 213 (3.4%) |
| 18 to 34 Years | 425 (7.6%) | 204 (3.3%) |
| 35 to 64 Years | 366 (3.0%) | 319 (2.3%) |
| 65 to 74 Years | 83 (2.6%) | 113 (3.2%) |
| 75 Years and over | 232 (10.7%) | 412 (14.0%) |
Disability Class: Ambulatory Difficulty
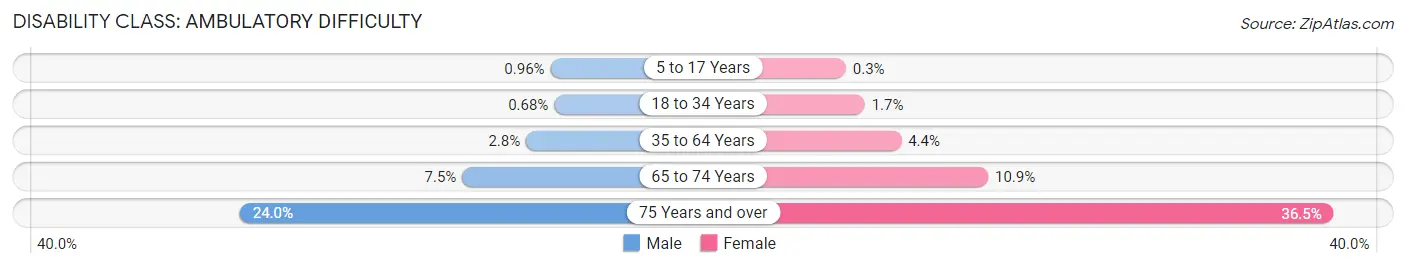
| Age Bracket | Male | Female |
| 5 to 17 Years | 61 (1.0%) | 19 (0.3%) |
| 18 to 34 Years | 38 (0.7%) | 104 (1.7%) |
| 35 to 64 Years | 340 (2.8%) | 603 (4.4%) |
| 65 to 74 Years | 240 (7.5%) | 384 (10.9%) |
| 75 Years and over | 523 (24.0%) | 1,073 (36.5%) |
Disability Class: Self-Care Difficulty
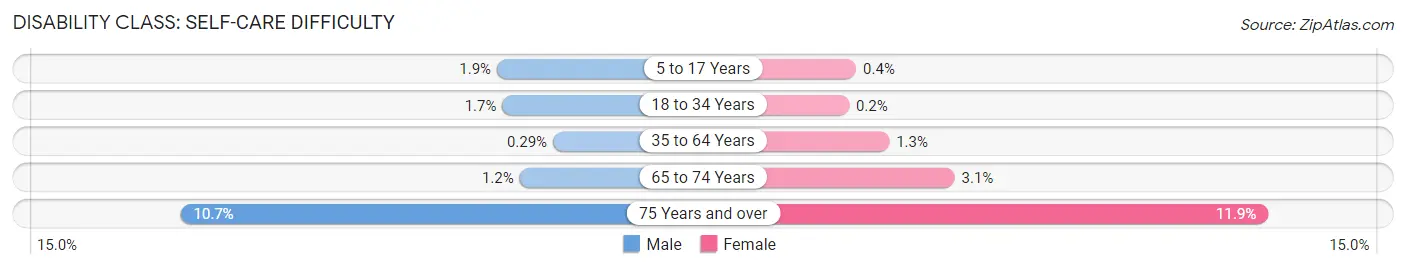
| Age Bracket | Male | Female |
| 5 to 17 Years | 118 (1.8%) | 25 (0.4%) |
| 18 to 34 Years | 95 (1.7%) | 12 (0.2%) |
| 35 to 64 Years | 36 (0.3%) | 181 (1.3%) |
| 65 to 74 Years | 39 (1.2%) | 111 (3.1%) |
| 75 Years and over | 232 (10.7%) | 349 (11.9%) |
Technology Access in York County
Computing Device Access in York County
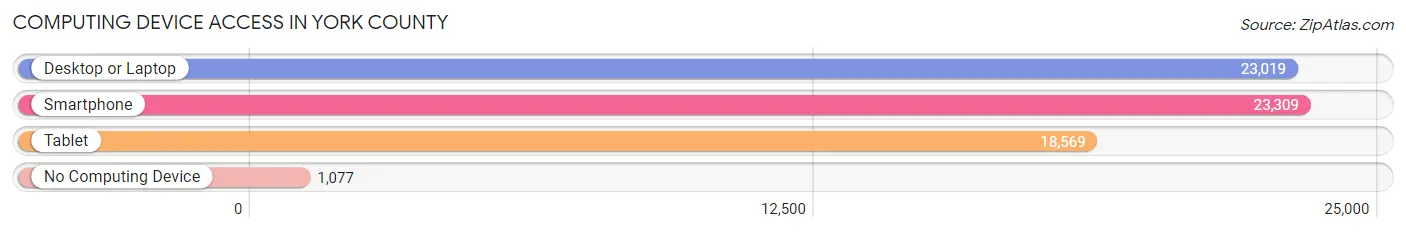
| Device Type | # Households | % Households |
| Desktop or Laptop | 23,019 | 88.9% |
| Smartphone | 23,309 | 90.1% |
| Tablet | 18,569 | 71.8% |
| No Computing Device | 1,077 | 4.2% |
| Total | 25,878 | 100.0% |
Internet Access in York County
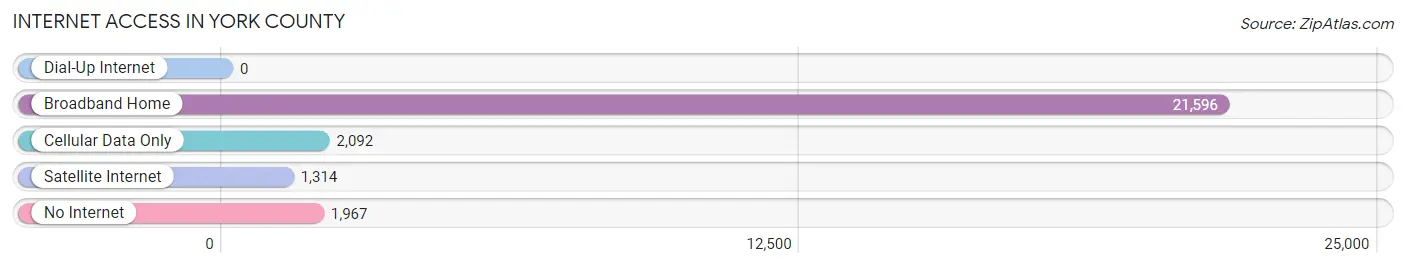
| Internet Type | # Households | % Households |
| Dial-Up Internet | 0 | 0.0% |
| Broadband Home | 21,596 | 83.5% |
| Cellular Data Only | 2,092 | 8.1% |
| Satellite Internet | 1,314 | 5.1% |
| No Internet | 1,967 | 7.6% |
| Total | 25,878 | 100.0% |
York County Summary
York County, Virginia is located in the Hampton Roads region of the Commonwealth of Virginia. It is bordered by James City County to the north, Newport News to the east, and the James River to the south. The county seat is the city of Yorktown, which is located on the York River. York County is part of the Virginia Beach-Norfolk-Newport News, VA-NC Metropolitan Statistical Area.
History
York County was established in 1634 as one of the eight original shires of the Virginia Colony. It was named for James I, the King of England at the time. The county was originally part of the larger Elizabeth City Shire, which was divided into York and Elizabeth City counties in 1643.
During the American Revolution, Yorktown was the site of the decisive battle between the British and American forces. The British surrendered at Yorktown in 1781, effectively ending the war.
In the 19th century, York County was home to a number of prominent figures, including Thomas Nelson, Jr., a signer of the Declaration of Independence, and John Tyler, the 10th President of the United States.
Geography
York County is located in the southeastern corner of Virginia, on the Virginia Peninsula. It is bordered by James City County to the north, Newport News to the east, and the James River to the south. The county has a total area of 151 square miles, of which 146 square miles is land and 5 square miles is water.
The terrain of York County is mostly flat, with some rolling hills in the northern part of the county. The York River forms the southern border of the county, and the James River forms the eastern border.
Economy
York County has a diverse economy, with a mix of manufacturing, retail, and service industries. The county is home to several large employers, including Newport News Shipbuilding, the largest employer in the region. Other major employers include the Yorktown Naval Weapons Station, the Yorktown Refinery, and the Yorktown Power Plant.
The county also has a thriving tourism industry, with attractions such as the Yorktown Battlefield, the Yorktown Victory Center, and the Colonial National Historical Park.
Demographics
As of the 2010 census, York County had a population of 65,464. The population was spread out, with 24.3% under the age of 18, 8.2% from 18 to 24, 28.2% from 25 to 44, 25.2% from 45 to 64, and 14.1% who were 65 years of age or older. The median age was 38.3 years.
The racial makeup of the county was 79.2% White, 14.3% African American, 0.5% Native American, 2.2% Asian, 0.1% Pacific Islander, 1.7% from other races, and 2.0% from two or more races. Hispanic or Latino of any race were 4.2% of the population.
The median income for a household in the county was $60,945, and the median income for a family was $71,845. The per capita income for the county was $30,945. About 5.2% of families and 7.2% of the population were below the poverty line, including 9.2% of those under age 18 and 5.2% of those age 65 or over.
Common Questions
What is Per Capita Income in York County?
Per Capita income in York County is $47,722.
What is the Median Family Income in York County?
Median Family Income in York County is $123,510.
What is the Median Household income in York County?
Median Household Income in York County is $105,154.
What is Income or Wage Gap in York County?
Income or Wage Gap in York County is 27.9%.
Women in York County earn 72.1 cents for every dollar earned by a man.
What is Family Income Deficit in York County?
Family Income Deficit in York County is $9,671.
Families that are below poverty line in York County earn $9,671 less on average than the poverty threshold level.
What is Inequality or Gini Index in York County?
Inequality or Gini Index in York County is 0.38.
What is the Total Population of York County?
Total Population of York County is 70,238.
What is the Total Male Population of York County?
Total Male Population of York County is 34,866.
What is the Total Female Population of York County?
Total Female Population of York County is 35,372.
What is the Ratio of Males per 100 Females in York County?
There are 98.57 Males per 100 Females in York County.
What is the Ratio of Females per 100 Males in York County?
There are 101.45 Females per 100 Males in York County.
What is the Median Population Age in York County?
Median Population Age in York County is 39.7 Years.
What is the Average Family Size in York County
Average Family Size in York County is 3.2 People.
What is the Average Household Size in York County
Average Household Size in York County is 2.7 People.
How Large is the Labor Force in York County?
There are 37,453 People in the Labor Forcein in York County.
What is the Percentage of People in the Labor Force in York County?
67.0% of People are in the Labor Force in York County.
What is the Unemployment Rate in York County?
Unemployment Rate in York County is 4.2%.