Wythe County, VA Map & Demographics
Wythe County Map
Wythe County Overview
$31,810
PER CAPITA INCOME
$72,828
AVG FAMILY INCOME
$53,921
AVG HOUSEHOLD INCOME
29.4%
WAGE / INCOME GAP [ % ]
70.6¢/ $1
WAGE / INCOME GAP [ $ ]
$12,746
FAMILY INCOME DEFICIT
0.47
INEQUALITY / GINI INDEX
28,275
TOTAL POPULATION
13,968
MALE POPULATION
14,307
FEMALE POPULATION
97.63
MALES / 100 FEMALES
102.43
FEMALES / 100 MALES
45.6
MEDIAN AGE
2.8
AVG FAMILY SIZE
2.3
AVG HOUSEHOLD SIZE
13,317
LABOR FORCE [ PEOPLE ]
56.3%
PERCENT IN LABOR FORCE
5.2%
UNEMPLOYMENT RATE
Wythe County Area Codes
Income in Wythe County
Income Overview in Wythe County
Per Capita Income in Wythe County is $31,810, while median incomes of families and households are $72,828 and $53,921 respectively.
| Characteristic | Number | Measure |
| Per Capita Income | 28,275 | $31,810 |
| Median Family Income | 7,760 | $72,828 |
| Mean Family Income | 7,760 | $88,266 |
| Median Household Income | 12,424 | $53,921 |
| Mean Household Income | 12,424 | $71,117 |
| Income Deficit | 7,760 | $12,746 |
| Wage / Income Gap (%) | 28,275 | 29.40% |
| Wage / Income Gap ($) | 28,275 | 70.60¢ per $1 |
| Gini / Inequality Index | 28,275 | 0.47 |
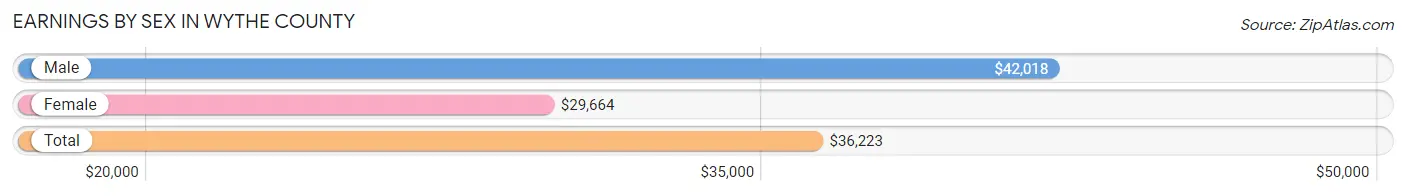
Earnings by Sex in Wythe County
Average Earnings in Wythe County are $36,223, $42,018 for men and $29,664 for women, a difference of 29.4%.
| Sex | Number | Average Earnings |
| Male | 7,187 (52.6%) | $42,018 |
| Female | 6,483 (47.4%) | $29,664 |
| Total | 13,670 (100.0%) | $36,223 |
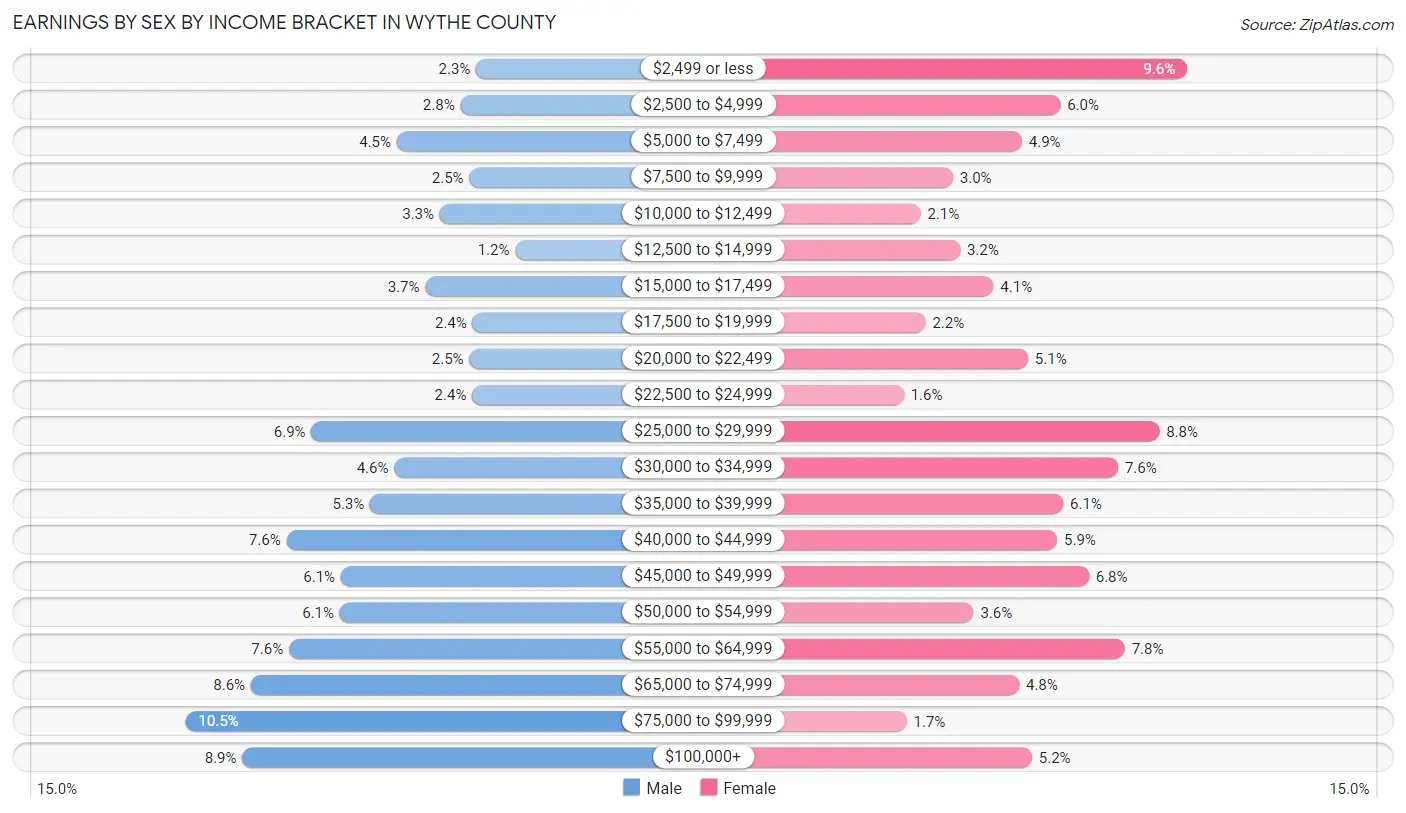
Earnings by Sex by Income Bracket in Wythe County
The most common earnings brackets in Wythe County are $75,000 to $99,999 for men (753 | 10.5%) and $2,499 or less for women (620 | 9.6%).
| Income | Male | Female |
| $2,499 or less | 166 (2.3%) | 620 (9.6%) |
| $2,500 to $4,999 | 198 (2.8%) | 389 (6.0%) |
| $5,000 to $7,499 | 326 (4.5%) | 319 (4.9%) |
| $7,500 to $9,999 | 180 (2.5%) | 193 (3.0%) |
| $10,000 to $12,499 | 239 (3.3%) | 134 (2.1%) |
| $12,500 to $14,999 | 87 (1.2%) | 206 (3.2%) |
| $15,000 to $17,499 | 269 (3.7%) | 267 (4.1%) |
| $17,500 to $19,999 | 173 (2.4%) | 143 (2.2%) |
| $20,000 to $22,499 | 180 (2.5%) | 330 (5.1%) |
| $22,500 to $24,999 | 174 (2.4%) | 104 (1.6%) |
| $25,000 to $29,999 | 499 (6.9%) | 569 (8.8%) |
| $30,000 to $34,999 | 331 (4.6%) | 494 (7.6%) |
| $35,000 to $39,999 | 380 (5.3%) | 394 (6.1%) |
| $40,000 to $44,999 | 549 (7.6%) | 383 (5.9%) |
| $45,000 to $49,999 | 439 (6.1%) | 441 (6.8%) |
| $50,000 to $54,999 | 441 (6.1%) | 231 (3.6%) |
| $55,000 to $64,999 | 544 (7.6%) | 506 (7.8%) |
| $65,000 to $74,999 | 621 (8.6%) | 314 (4.8%) |
| $75,000 to $99,999 | 753 (10.5%) | 109 (1.7%) |
| $100,000+ | 638 (8.9%) | 337 (5.2%) |
| Total | 7,187 (100.0%) | 6,483 (100.0%) |
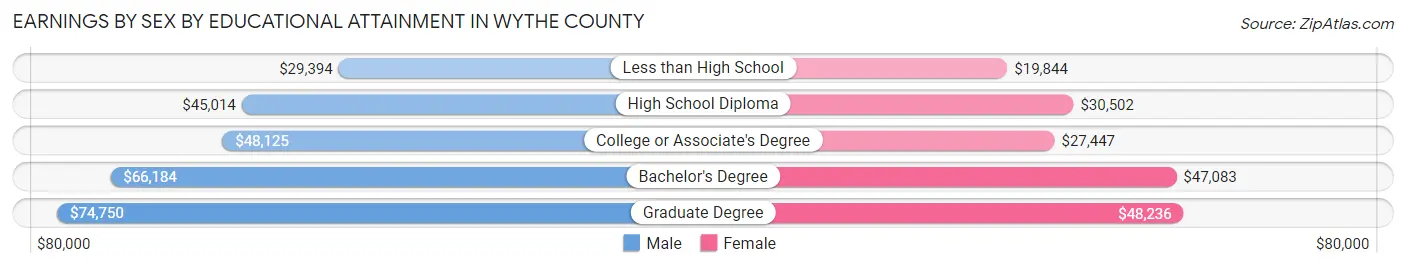
Earnings by Sex by Educational Attainment in Wythe County
Average earnings in Wythe County are $47,866 for men and $33,042 for women, a difference of 31.0%. Men with an educational attainment of graduate degree enjoy the highest average annual earnings of $74,750, while those with less than high school education earn the least with $29,394. Women with an educational attainment of graduate degree earn the most with the average annual earnings of $48,236, while those with less than high school education have the smallest earnings of $19,844.
| Educational Attainment | Male Income | Female Income |
| Less than High School | $29,394 | $19,844 |
| High School Diploma | $45,014 | $30,502 |
| College or Associate's Degree | $48,125 | $27,447 |
| Bachelor's Degree | $66,184 | $47,083 |
| Graduate Degree | $74,750 | $48,236 |
| Total | $47,866 | $33,042 |
Family Income in Wythe County
Family Income Brackets in Wythe County
According to the Wythe County family income data, there are 1,785 families falling into the $75,000 to $99,999 income range, which is the most common income bracket and makes up 23.0% of all families. Conversely, the $10,000 to $14,999 income bracket is the least frequent group with only 210 families (2.7%) belonging to this category.
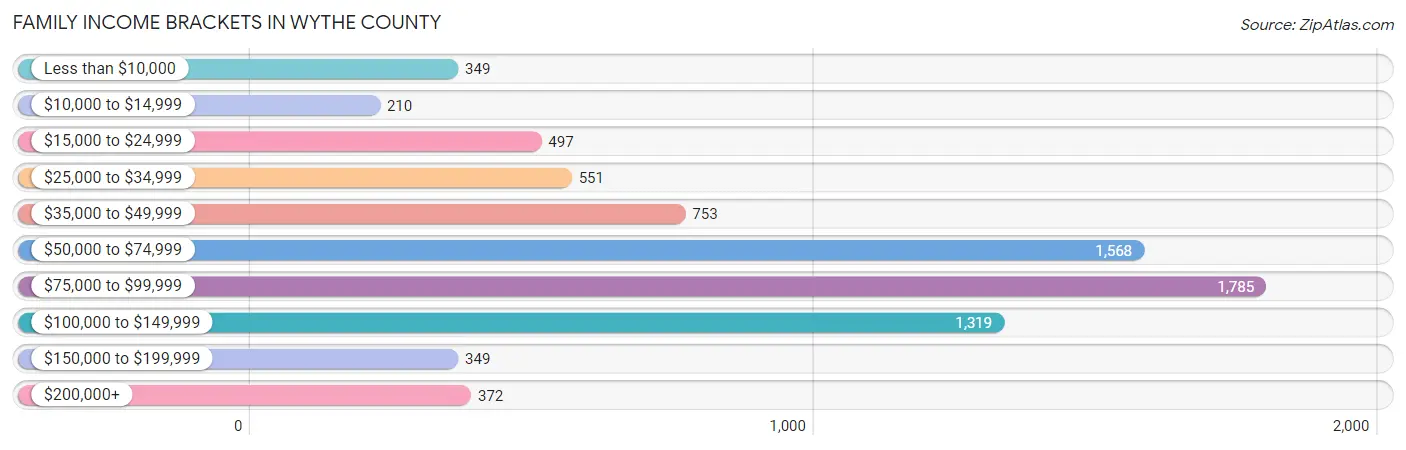
| Income Bracket | # Families | % Families |
| Less than $10,000 | 349 | 4.5% |
| $10,000 to $14,999 | 210 | 2.7% |
| $15,000 to $24,999 | 497 | 6.4% |
| $25,000 to $34,999 | 551 | 7.1% |
| $35,000 to $49,999 | 753 | 9.7% |
| $50,000 to $74,999 | 1,568 | 20.2% |
| $75,000 to $99,999 | 1,785 | 23.0% |
| $100,000 to $149,999 | 1,319 | 17.0% |
| $150,000 to $199,999 | 349 | 4.5% |
| $200,000+ | 372 | 4.8% |
Family Income by Famaliy Size in Wythe County
4-person families (1,462 | 18.8%) account for the highest median family income in Wythe County with $92,115 per family, while 2-person families (4,162 | 53.6%) have the highest median income of $34,844 per family member.
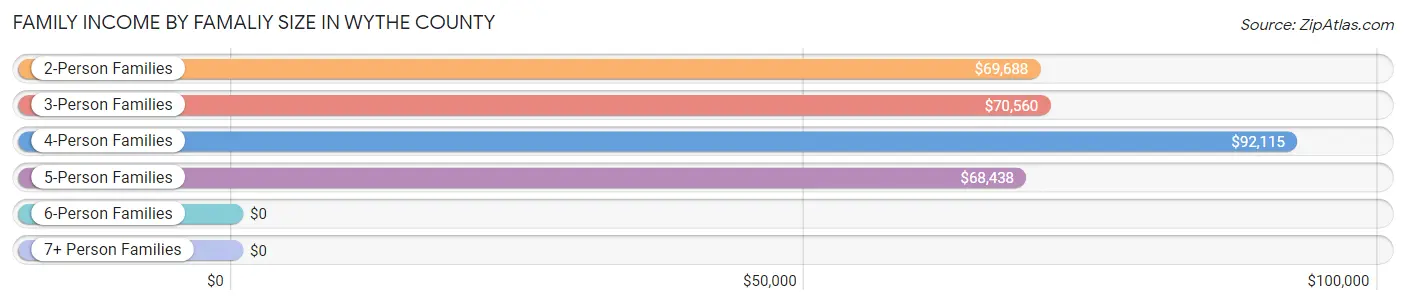
| Income Bracket | # Families | Median Income |
| 2-Person Families | 4,162 (53.6%) | $69,688 |
| 3-Person Families | 1,446 (18.6%) | $70,560 |
| 4-Person Families | 1,462 (18.8%) | $92,115 |
| 5-Person Families | 499 (6.4%) | $68,438 |
| 6-Person Families | 158 (2.0%) | $0 |
| 7+ Person Families | 33 (0.4%) | $0 |
| Total | 7,760 (100.0%) | $72,828 |
Family Income by Number of Earners in Wythe County
The median family income in Wythe County is $72,828, with families comprising 3+ earners (590) having the highest median family income of $99,524, while families with no earners (1,760) have the lowest median family income of $37,311, accounting for 7.6% and 22.7% of families, respectively.
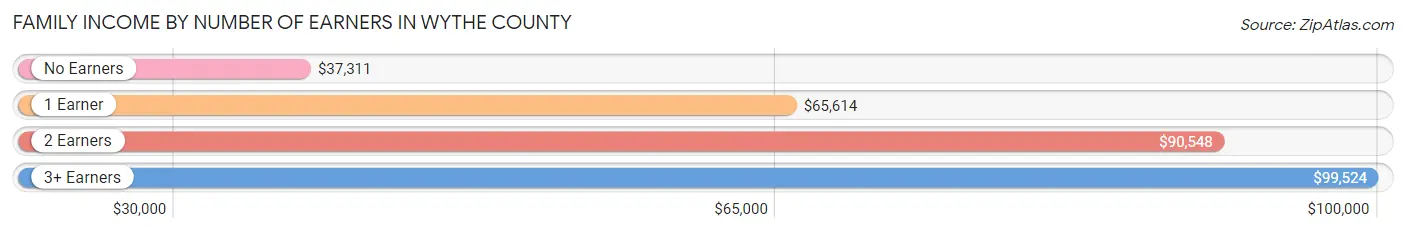
| Number of Earners | # Families | Median Income |
| No Earners | 1,760 (22.7%) | $37,311 |
| 1 Earner | 2,468 (31.8%) | $65,614 |
| 2 Earners | 2,942 (37.9%) | $90,548 |
| 3+ Earners | 590 (7.6%) | $99,524 |
| Total | 7,760 (100.0%) | $72,828 |
Household Income in Wythe County
Household Income Brackets in Wythe County
With 2,199 households falling in the category, the $50,000 to $74,999 income range is the most frequent in Wythe County, accounting for 17.7% of all households. In contrast, only 385 households (3.1%) fall into the $200,000+ income bracket, making it the least populous group.
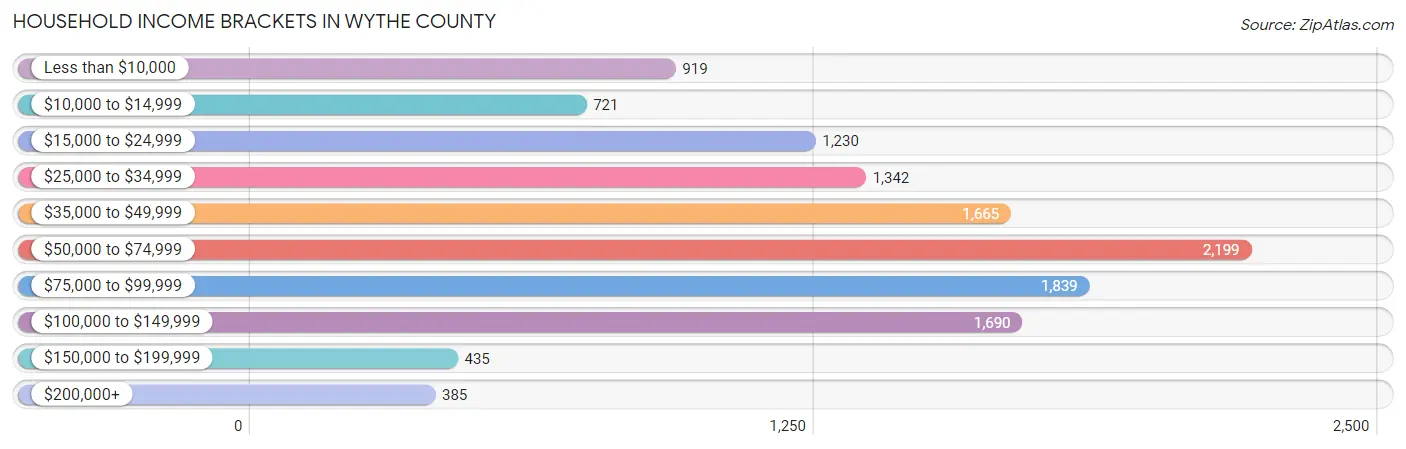
| Income Bracket | # Households | % Households |
| Less than $10,000 | 919 | 7.4% |
| $10,000 to $14,999 | 721 | 5.8% |
| $15,000 to $24,999 | 1,230 | 9.9% |
| $25,000 to $34,999 | 1,342 | 10.8% |
| $35,000 to $49,999 | 1,665 | 13.4% |
| $50,000 to $74,999 | 2,199 | 17.7% |
| $75,000 to $99,999 | 1,839 | 14.8% |
| $100,000 to $149,999 | 1,690 | 13.6% |
| $150,000 to $199,999 | 435 | 3.5% |
| $200,000+ | 385 | 3.1% |
Household Income by Householder Age in Wythe County
The median household income in Wythe County is $53,921, with the highest median household income of $67,986 found in the 45 to 64 years age bracket for the primary householder. A total of 5,089 households (41.0%) fall into this category. Meanwhile, the 65+ years age bracket for the primary householder has the lowest median household income of $42,802, with 3,863 households (31.1%) in this group.
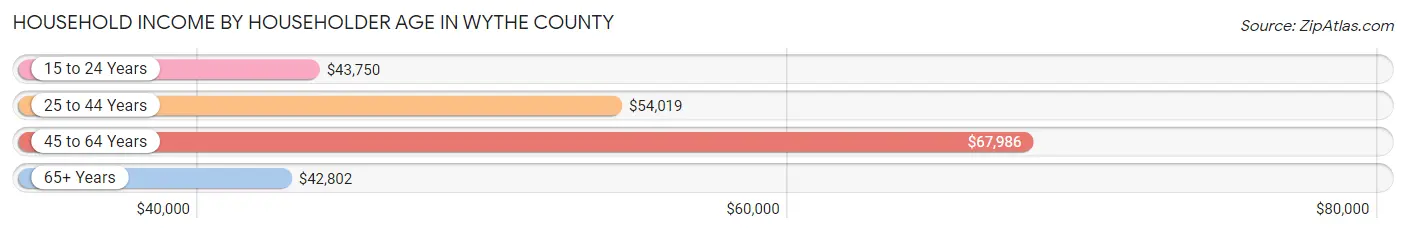
| Income Bracket | # Households | Median Income |
| 15 to 24 Years | 456 (3.7%) | $43,750 |
| 25 to 44 Years | 3,016 (24.3%) | $54,019 |
| 45 to 64 Years | 5,089 (41.0%) | $67,986 |
| 65+ Years | 3,863 (31.1%) | $42,802 |
| Total | 12,424 (100.0%) | $53,921 |
Poverty in Wythe County
Income Below Poverty by Sex and Age in Wythe County
With 16.8% poverty level for males and 17.6% for females among the residents of Wythe County, 5 year old males and 5 year old females are the most vulnerable to poverty, with 97 males (39.1%) and 55 females (45.8%) in their respective age groups living below the poverty level.
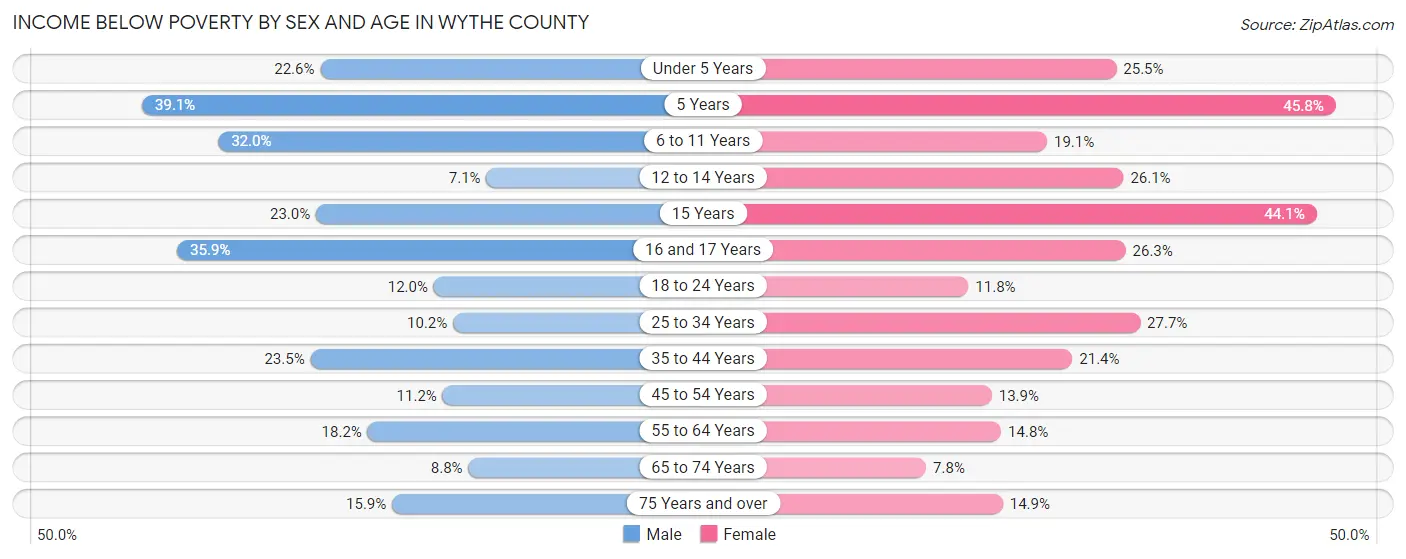
| Age Bracket | Male | Female |
| Under 5 Years | 150 (22.6%) | 174 (25.5%) |
| 5 Years | 97 (39.1%) | 55 (45.8%) |
| 6 to 11 Years | 262 (32.0%) | 164 (19.1%) |
| 12 to 14 Years | 28 (7.1%) | 109 (26.1%) |
| 15 Years | 42 (23.0%) | 37 (44.1%) |
| 16 and 17 Years | 166 (35.8%) | 103 (26.3%) |
| 18 to 24 Years | 127 (12.0%) | 111 (11.7%) |
| 25 to 34 Years | 155 (10.2%) | 419 (27.7%) |
| 35 to 44 Years | 377 (23.5%) | 355 (21.4%) |
| 45 to 54 Years | 233 (11.2%) | 280 (13.9%) |
| 55 to 64 Years | 374 (18.2%) | 324 (14.8%) |
| 65 to 74 Years | 149 (8.8%) | 146 (7.8%) |
| 75 Years and over | 166 (15.9%) | 208 (14.9%) |
| Total | 2,326 (16.8%) | 2,485 (17.6%) |
Income Above Poverty by Sex and Age in Wythe County
According to the poverty statistics in Wythe County, males aged 12 to 14 years and females aged 65 to 74 years are the age groups that are most secure financially, with 92.9% of males and 92.2% of females in these age groups living above the poverty line.
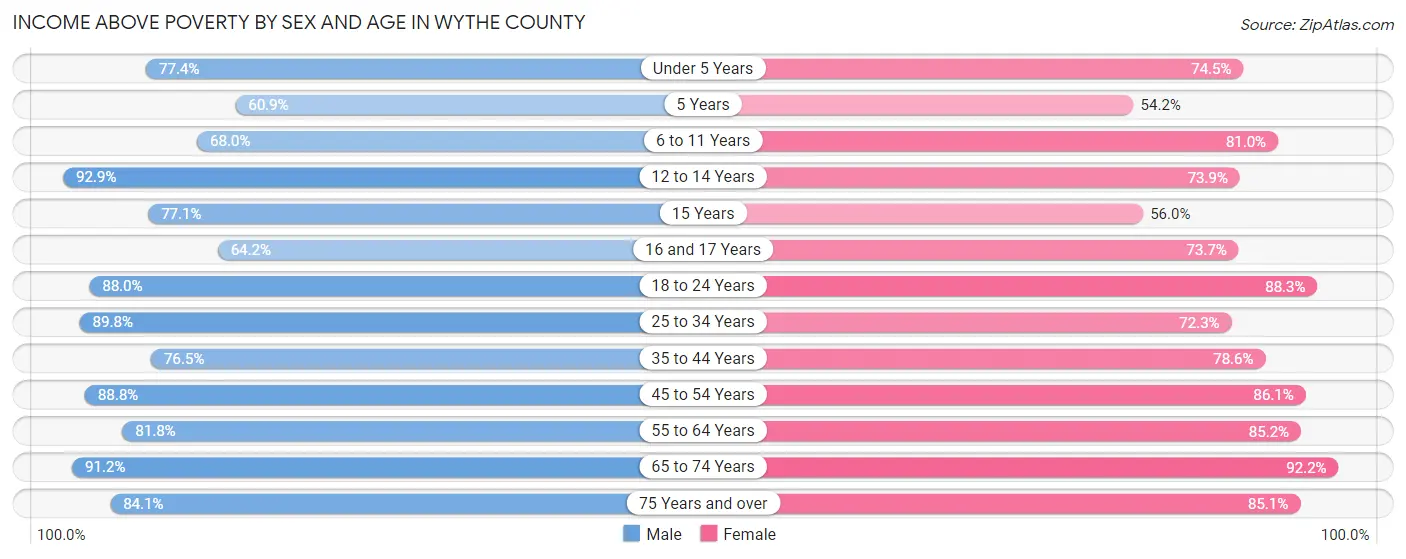
| Age Bracket | Male | Female |
| Under 5 Years | 515 (77.4%) | 509 (74.5%) |
| 5 Years | 151 (60.9%) | 65 (54.2%) |
| 6 to 11 Years | 556 (68.0%) | 697 (80.9%) |
| 12 to 14 Years | 364 (92.9%) | 308 (73.9%) |
| 15 Years | 141 (77.0%) | 47 (55.9%) |
| 16 and 17 Years | 297 (64.1%) | 288 (73.7%) |
| 18 to 24 Years | 930 (88.0%) | 834 (88.2%) |
| 25 to 34 Years | 1,360 (89.8%) | 1,094 (72.3%) |
| 35 to 44 Years | 1,229 (76.5%) | 1,304 (78.6%) |
| 45 to 54 Years | 1,847 (88.8%) | 1,732 (86.1%) |
| 55 to 64 Years | 1,686 (81.8%) | 1,867 (85.2%) |
| 65 to 74 Years | 1,543 (91.2%) | 1,718 (92.2%) |
| 75 Years and over | 879 (84.1%) | 1,184 (85.1%) |
| Total | 11,498 (83.2%) | 11,647 (82.4%) |
Income Below Poverty Among Married-Couple Families in Wythe County
The poverty statistics for married-couple families in Wythe County show that 8.0% or 481 of the total 6,012 families live below the poverty line. Families with 3 or 4 children have the highest poverty rate of 31.7%, comprising of 126 families. On the other hand, families with no children have the lowest poverty rate of 3.2%, which includes 123 families.
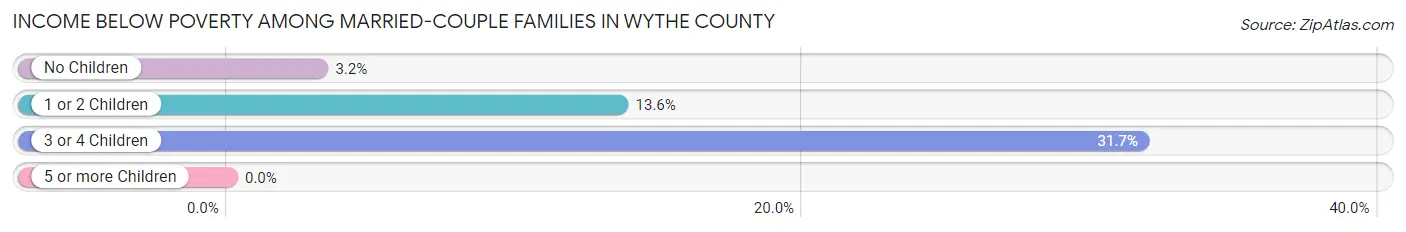
| Children | Above Poverty | Below Poverty |
| No Children | 3,786 (96.9%) | 123 (3.2%) |
| 1 or 2 Children | 1,474 (86.4%) | 232 (13.6%) |
| 3 or 4 Children | 271 (68.3%) | 126 (31.7%) |
| 5 or more Children | 0 (0.0%) | 0 (0.0%) |
| Total | 5,531 (92.0%) | 481 (8.0%) |
Income Below Poverty Among Single-Parent Households in Wythe County
According to the poverty data in Wythe County, 29.0% or 235 single-father households and 26.6% or 249 single-mother households are living below the poverty line. Among single-father households, those with no children have the highest poverty rate, with 120 households (39.2%) experiencing poverty. Likewise, among single-mother households, those with 3 or 4 children have the highest poverty rate, with 99 households (71.2%) falling below the poverty line.
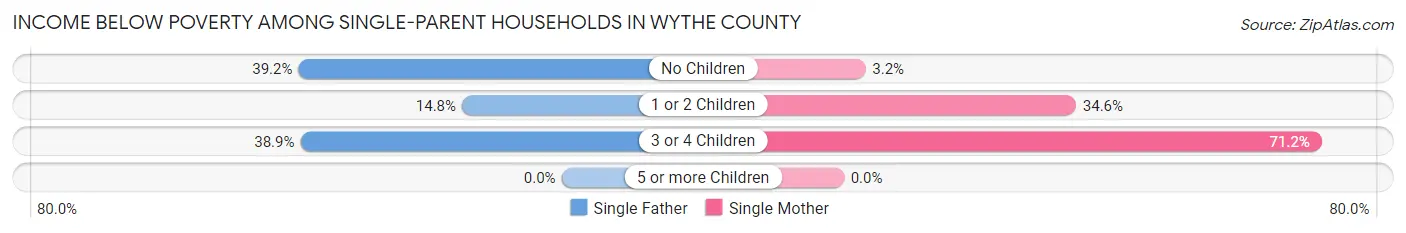
| Children | Single Father | Single Mother |
| No Children | 120 (39.2%) | 13 (3.2%) |
| 1 or 2 Children | 50 (14.8%) | 137 (34.6%) |
| 3 or 4 Children | 65 (38.9%) | 99 (71.2%) |
| 5 or more Children | 0 (0.0%) | 0 (0.0%) |
| Total | 235 (29.0%) | 249 (26.6%) |
Income Below Poverty Among Married-Couple vs Single-Parent Households in Wythe County
The poverty data for Wythe County shows that 481 of the married-couple family households (8.0%) and 484 of the single-parent households (27.7%) are living below the poverty level. Within the married-couple family households, those with 3 or 4 children have the highest poverty rate, with 126 households (31.7%) falling below the poverty line. Among the single-parent households, those with 3 or 4 children have the highest poverty rate, with 164 household (53.6%) living below poverty.
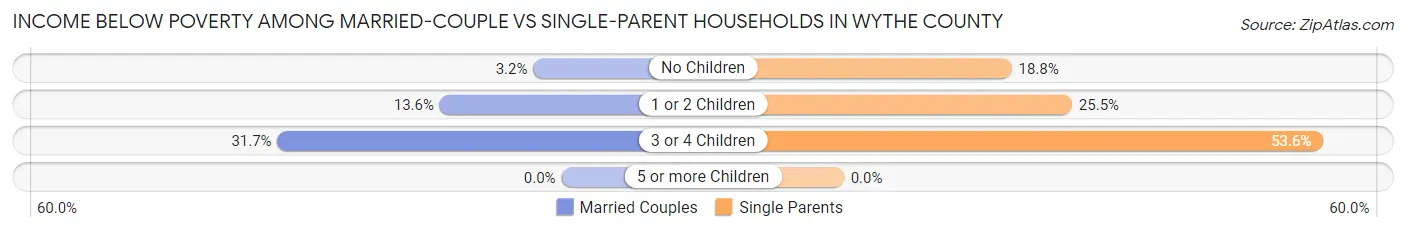
| Children | Married-Couple Families | Single-Parent Households |
| No Children | 123 (3.2%) | 133 (18.8%) |
| 1 or 2 Children | 232 (13.6%) | 187 (25.5%) |
| 3 or 4 Children | 126 (31.7%) | 164 (53.6%) |
| 5 or more Children | 0 (0.0%) | 0 (0.0%) |
| Total | 481 (8.0%) | 484 (27.7%) |
Race in Wythe County
The most populous races in Wythe County are White / Caucasian (26,557 | 93.9%), Two or more Races (772 | 2.7%), and Black / African American (609 | 2.1%).
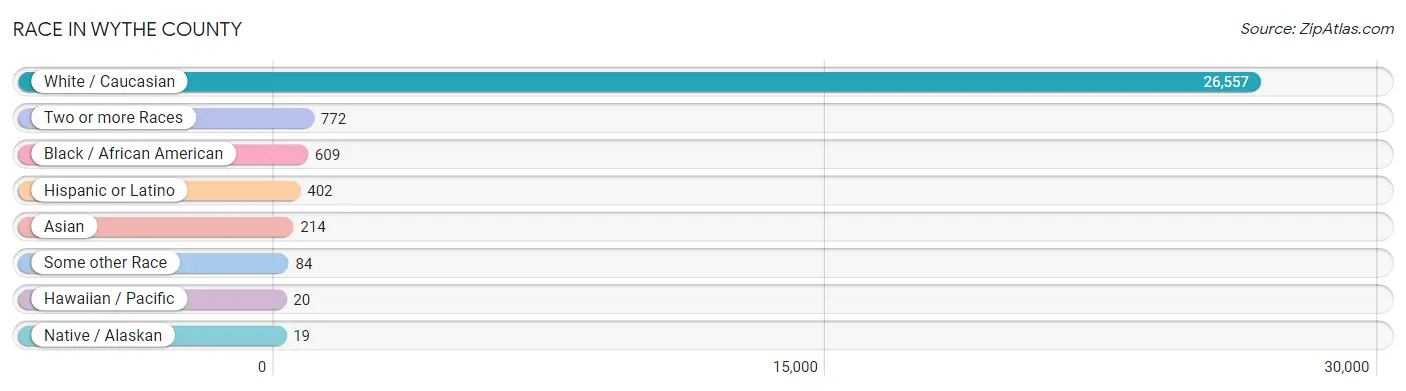
| Race | # Population | % Population |
| Asian | 214 | 0.8% |
| Black / African American | 609 | 2.1% |
| Hawaiian / Pacific | 20 | 0.1% |
| Hispanic or Latino | 402 | 1.4% |
| Native / Alaskan | 19 | 0.1% |
| White / Caucasian | 26,557 | 93.9% |
| Two or more Races | 772 | 2.7% |
| Some other Race | 84 | 0.3% |
| Total | 28,275 | 100.0% |
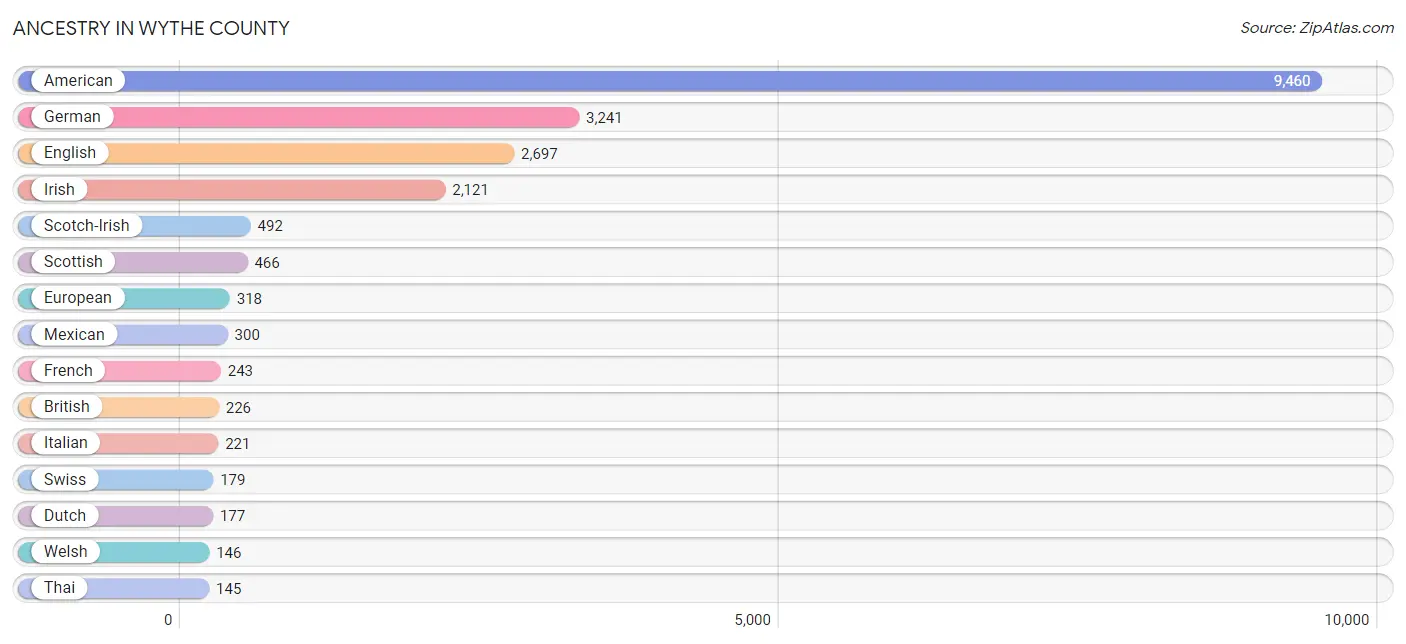
Ancestry in Wythe County
The most populous ancestries reported in Wythe County are American (9,460 | 33.5%), German (3,241 | 11.5%), English (2,697 | 9.5%), Irish (2,121 | 7.5%), and Scotch-Irish (492 | 1.7%), together accounting for 63.7% of all Wythe County residents.
| Ancestry | # Population | % Population |
| African | 58 | 0.2% |
| American | 9,460 | 33.5% |
| Arab | 20 | 0.1% |
| Bhutanese | 15 | 0.1% |
| British | 226 | 0.8% |
| Burmese | 2 | 0.0% |
| Canadian | 29 | 0.1% |
| Celtic | 10 | 0.0% |
| Central American | 1 | 0.0% |
| Cherokee | 80 | 0.3% |
| Choctaw | 9 | 0.0% |
| Cuban | 14 | 0.1% |
| Czech | 32 | 0.1% |
| Danish | 39 | 0.1% |
| Delaware | 9 | 0.0% |
| Dutch | 177 | 0.6% |
| Egyptian | 20 | 0.1% |
| English | 2,697 | 9.5% |
| Ethiopian | 1 | 0.0% |
| European | 318 | 1.1% |
| French | 243 | 0.9% |
| French Canadian | 132 | 0.5% |
| German | 3,241 | 11.5% |
| Greek | 8 | 0.0% |
| Honduran | 1 | 0.0% |
| Hungarian | 115 | 0.4% |
| Indian (Asian) | 41 | 0.2% |
| Irish | 2,121 | 7.5% |
| Italian | 221 | 0.8% |
| Lithuanian | 14 | 0.1% |
| Lumbee | 1 | 0.0% |
| Mexican | 300 | 1.1% |
| Native Hawaiian | 4 | 0.0% |
| Nigerian | 17 | 0.1% |
| Northern European | 77 | 0.3% |
| Norwegian | 82 | 0.3% |
| Polish | 123 | 0.4% |
| Portuguese | 27 | 0.1% |
| Puerto Rican | 6 | 0.0% |
| Russian | 23 | 0.1% |
| Scandinavian | 15 | 0.1% |
| Scotch-Irish | 492 | 1.7% |
| Scottish | 466 | 1.7% |
| Slovak | 6 | 0.0% |
| Spaniard | 76 | 0.3% |
| Sri Lankan | 13 | 0.1% |
| Subsaharan African | 76 | 0.3% |
| Swedish | 97 | 0.3% |
| Swiss | 179 | 0.6% |
| Thai | 145 | 0.5% |
| Ukrainian | 17 | 0.1% |
| Welsh | 146 | 0.5% | View All 52 Rows |
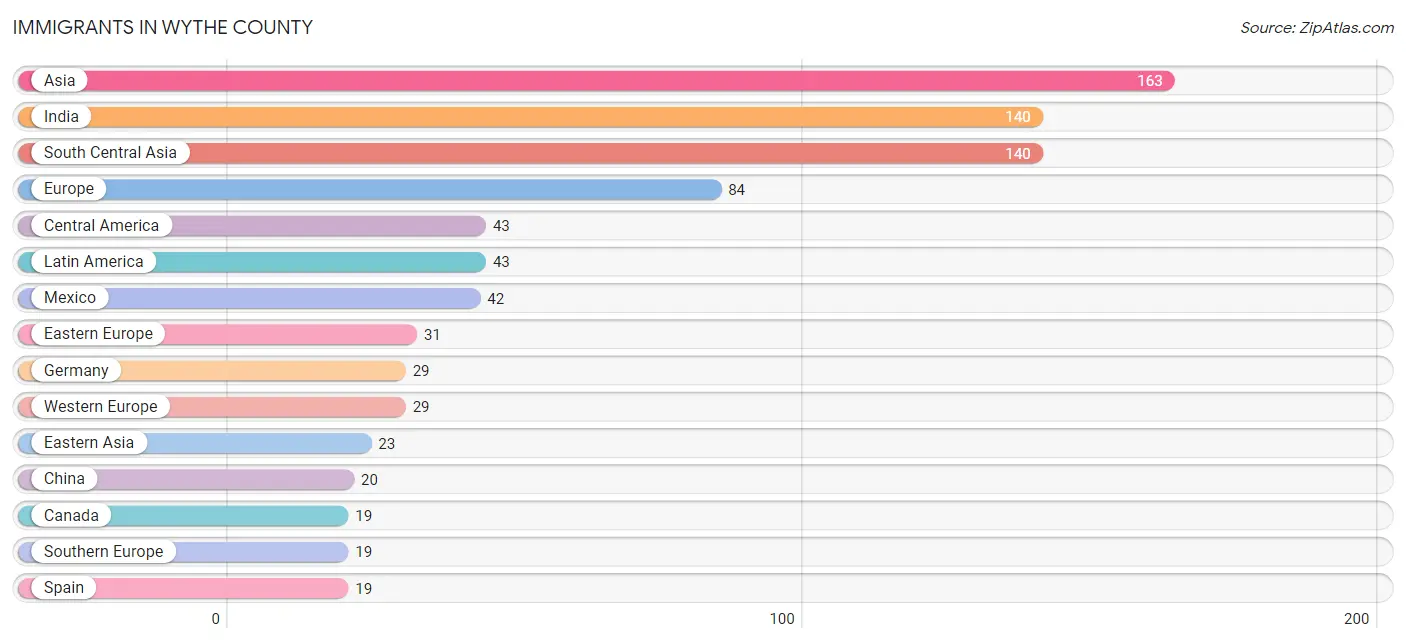
Immigrants in Wythe County
The most numerous immigrant groups reported in Wythe County came from Asia (163 | 0.6%), India (140 | 0.5%), South Central Asia (140 | 0.5%), Europe (84 | 0.3%), and Central America (43 | 0.2%), together accounting for 2.0% of all Wythe County residents.
| Immigration Origin | # Population | % Population |
| Africa | 8 | 0.0% |
| Asia | 163 | 0.6% |
| Canada | 19 | 0.1% |
| Central America | 43 | 0.2% |
| China | 20 | 0.1% |
| Eastern Africa | 8 | 0.0% |
| Eastern Asia | 23 | 0.1% |
| Eastern Europe | 31 | 0.1% |
| Ethiopia | 8 | 0.0% |
| Europe | 84 | 0.3% |
| Germany | 29 | 0.1% |
| Honduras | 1 | 0.0% |
| India | 140 | 0.5% |
| Japan | 3 | 0.0% |
| Latin America | 43 | 0.2% |
| Mexico | 42 | 0.2% |
| Moldova | 10 | 0.0% |
| Northern Europe | 5 | 0.0% |
| Russia | 10 | 0.0% |
| South Central Asia | 140 | 0.5% |
| Southern Europe | 19 | 0.1% |
| Spain | 19 | 0.1% |
| Ukraine | 11 | 0.0% |
| Western Europe | 29 | 0.1% | View All 24 Rows |
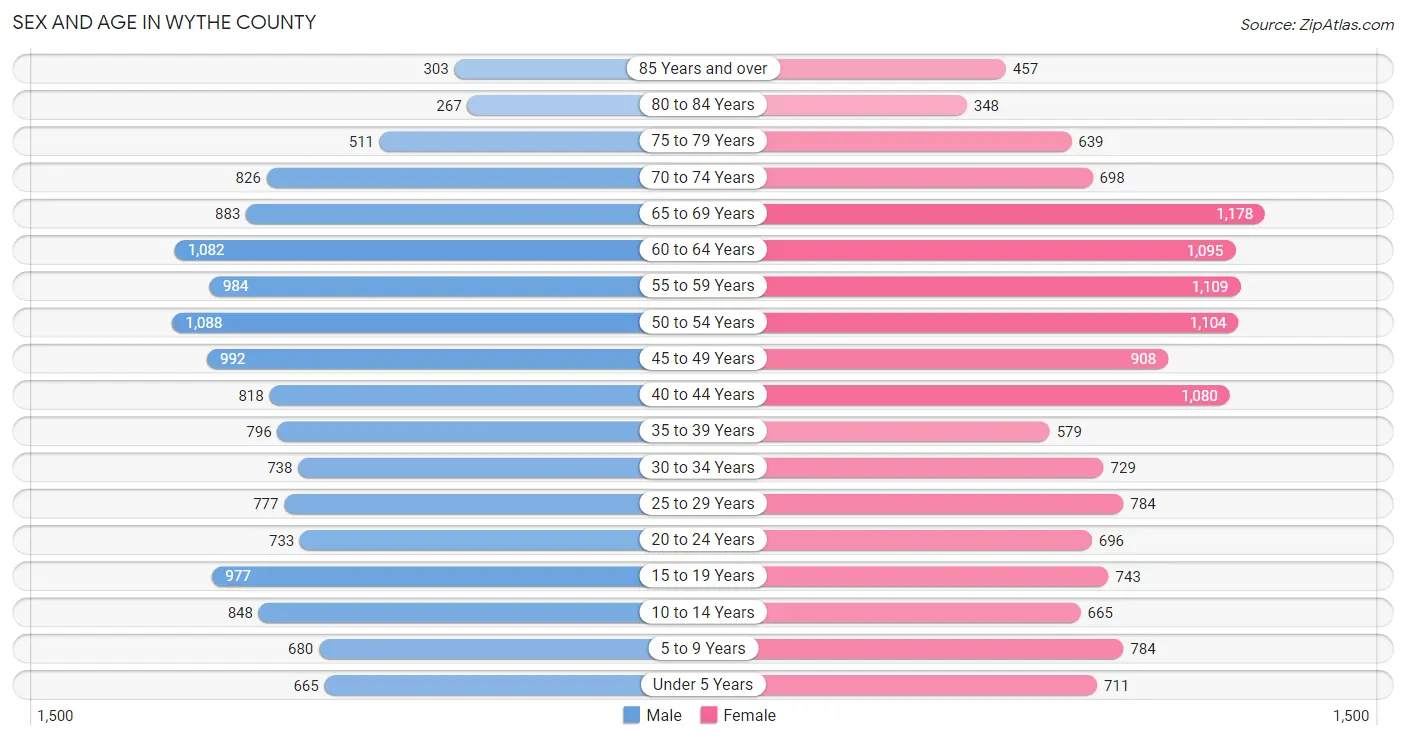
Sex and Age in Wythe County
Sex and Age in Wythe County
The most populous age groups in Wythe County are 50 to 54 Years (1,088 | 7.8%) for men and 65 to 69 Years (1,178 | 8.2%) for women.
| Age Bracket | Male | Female |
| Under 5 Years | 665 (4.8%) | 711 (5.0%) |
| 5 to 9 Years | 680 (4.9%) | 784 (5.5%) |
| 10 to 14 Years | 848 (6.1%) | 665 (4.6%) |
| 15 to 19 Years | 977 (7.0%) | 743 (5.2%) |
| 20 to 24 Years | 733 (5.2%) | 696 (4.9%) |
| 25 to 29 Years | 777 (5.6%) | 784 (5.5%) |
| 30 to 34 Years | 738 (5.3%) | 729 (5.1%) |
| 35 to 39 Years | 796 (5.7%) | 579 (4.1%) |
| 40 to 44 Years | 818 (5.9%) | 1,080 (7.5%) |
| 45 to 49 Years | 992 (7.1%) | 908 (6.4%) |
| 50 to 54 Years | 1,088 (7.8%) | 1,104 (7.7%) |
| 55 to 59 Years | 984 (7.0%) | 1,109 (7.7%) |
| 60 to 64 Years | 1,082 (7.7%) | 1,095 (7.6%) |
| 65 to 69 Years | 883 (6.3%) | 1,178 (8.2%) |
| 70 to 74 Years | 826 (5.9%) | 698 (4.9%) |
| 75 to 79 Years | 511 (3.7%) | 639 (4.5%) |
| 80 to 84 Years | 267 (1.9%) | 348 (2.4%) |
| 85 Years and over | 303 (2.2%) | 457 (3.2%) |
| Total | 13,968 (100.0%) | 14,307 (100.0%) |
Families and Households in Wythe County
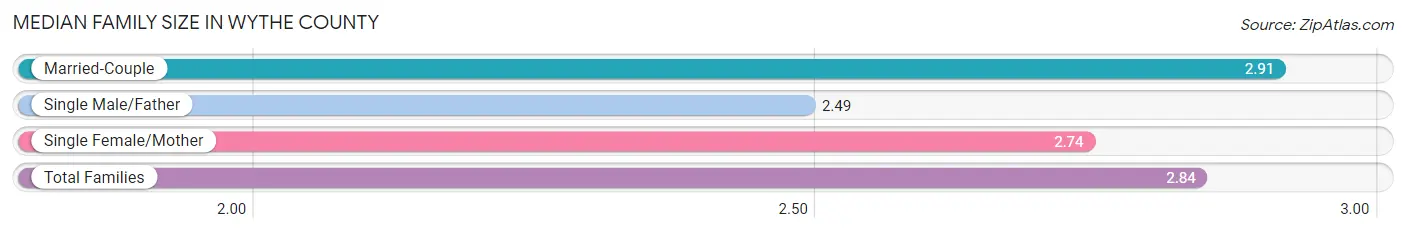
Median Family Size in Wythe County
The median family size in Wythe County is 2.84 persons per family, with married-couple families (6,012 | 77.5%) accounting for the largest median family size of 2.91 persons per family. On the other hand, single male/father families (810 | 10.4%) represent the smallest median family size with 2.49 persons per family.
| Family Type | # Families | Family Size |
| Married-Couple | 6,012 (77.5%) | 2.91 |
| Single Male/Father | 810 (10.4%) | 2.49 |
| Single Female/Mother | 938 (12.1%) | 2.74 |
| Total Families | 7,760 (100.0%) | 2.84 |
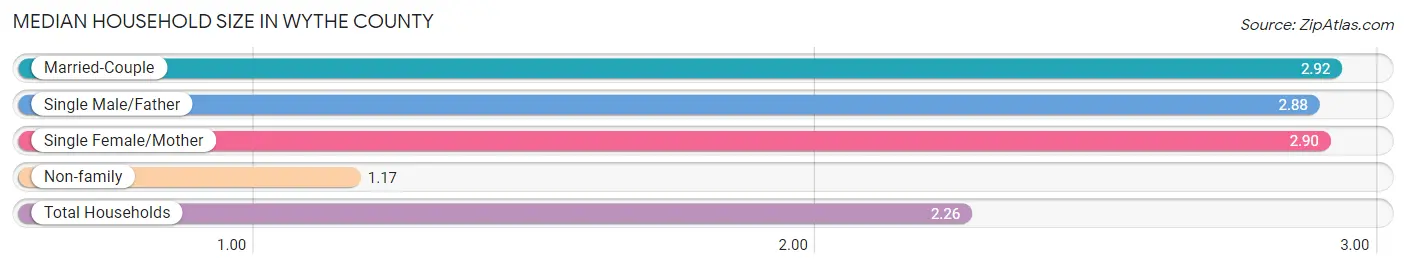
Median Household Size in Wythe County
The median household size in Wythe County is 2.26 persons per household, with married-couple households (6,012 | 48.4%) accounting for the largest median household size of 2.92 persons per household. non-family households (4,664 | 37.5%) represent the smallest median household size with 1.17 persons per household.
| Household Type | # Households | Household Size |
| Married-Couple | 6,012 (48.4%) | 2.92 |
| Single Male/Father | 810 (6.5%) | 2.88 |
| Single Female/Mother | 938 (7.5%) | 2.90 |
| Non-family | 4,664 (37.5%) | 1.17 |
| Total Households | 12,424 (100.0%) | 2.26 |
Household Size by Marriage Status in Wythe County
Out of a total of 12,424 households in Wythe County, 7,760 (62.5%) are family households, while 4,664 (37.5%) are nonfamily households. The most numerous type of family households are 2-person households, comprising 3,996, and the most common type of nonfamily households are 1-person households, comprising 4,011.
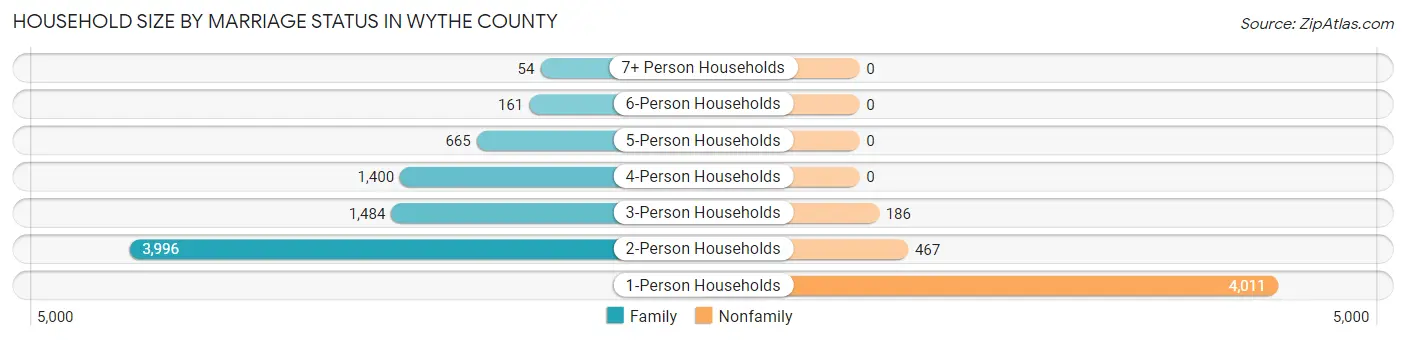
| Household Size | Family Households | Nonfamily Households |
| 1-Person Households | - | 4,011 (32.3%) |
| 2-Person Households | 3,996 (32.2%) | 467 (3.8%) |
| 3-Person Households | 1,484 (11.9%) | 186 (1.5%) |
| 4-Person Households | 1,400 (11.3%) | 0 (0.0%) |
| 5-Person Households | 665 (5.3%) | 0 (0.0%) |
| 6-Person Households | 161 (1.3%) | 0 (0.0%) |
| 7+ Person Households | 54 (0.4%) | 0 (0.0%) |
| Total | 7,760 (62.5%) | 4,664 (37.5%) |
Female Fertility in Wythe County
Fertility by Age in Wythe County
Average fertility rate in Wythe County is 49.0 births per 1,000 women. Women in the age bracket of 20 to 34 years have the highest fertility rate with 115.0 births per 1,000 women. Women in the age bracket of 20 to 34 years acount for 90.1% of all women with births.
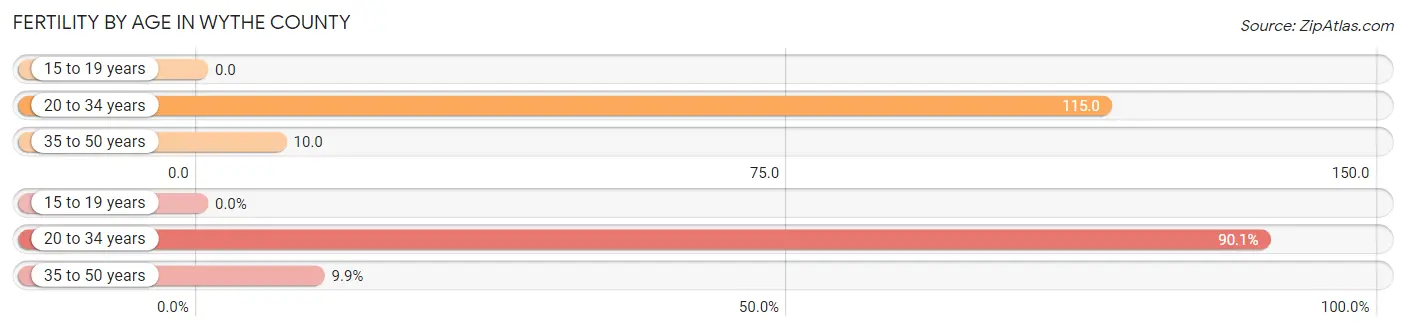
| Age Bracket | Women with Births | Births / 1,000 Women |
| 15 to 19 years | 0 (0.0%) | 0.0 |
| 20 to 34 years | 255 (90.1%) | 115.0 |
| 35 to 50 years | 28 (9.9%) | 10.0 |
| Total | 283 (100.0%) | 49.0 |
Fertility by Age by Marriage Status in Wythe County
62.9% of women with births (283) in Wythe County are married. The highest percentage of unmarried women with births falls into 20 to 34 years age bracket with 41.2% of them unmarried at the time of birth, while the lowest percentage of unmarried women with births belong to 35 to 50 years age bracket with 0.0% of them unmarried.
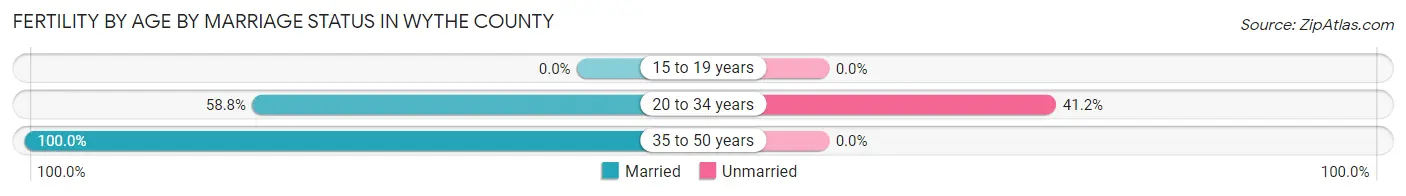
| Age Bracket | Married | Unmarried |
| 15 to 19 years | 0 (0.0%) | 0 (0.0%) |
| 20 to 34 years | 150 (58.8%) | 105 (41.2%) |
| 35 to 50 years | 28 (100.0%) | 0 (0.0%) |
| Total | 178 (62.9%) | 105 (37.1%) |
Fertility by Education in Wythe County
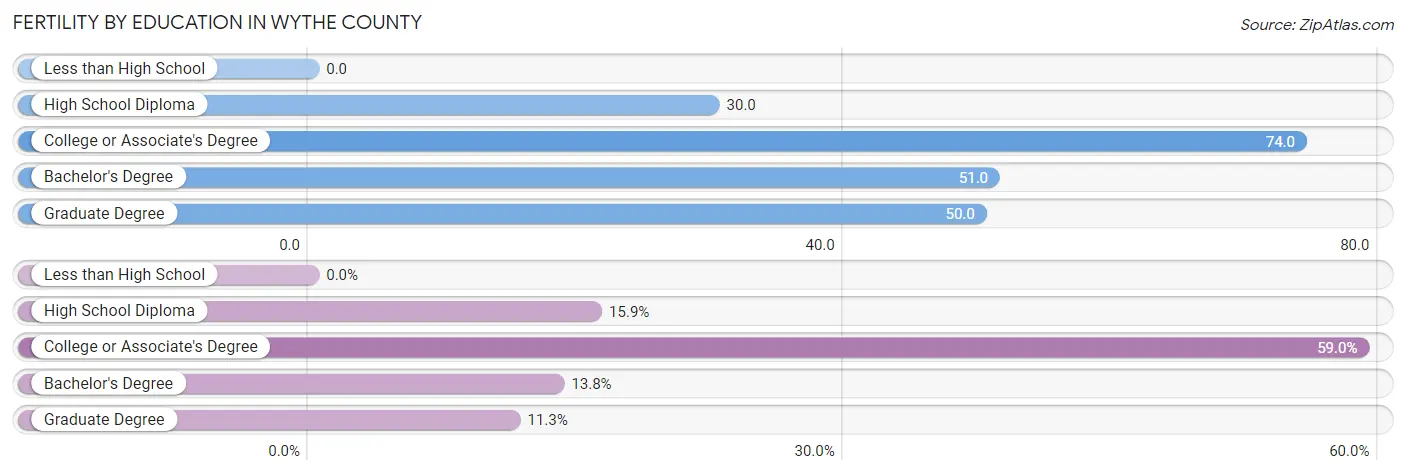
| Educational Attainment | Women with Births | Births / 1,000 Women |
| Less than High School | 0 (0.0%) | 0.0 |
| High School Diploma | 45 (15.9%) | 30.0 |
| College or Associate's Degree | 167 (59.0%) | 74.0 |
| Bachelor's Degree | 39 (13.8%) | 51.0 |
| Graduate Degree | 32 (11.3%) | 50.0 |
| Total | 283 (100.0%) | 49.0 |
Fertility by Education by Marriage Status in Wythe County
37.1% of women with births in Wythe County are unmarried. Women with the educational attainment of bachelor's degree are most likely to be married with 100.0% of them married at childbirth, while women with the educational attainment of high school diploma are least likely to be married with 55.6% of them unmarried at childbirth.
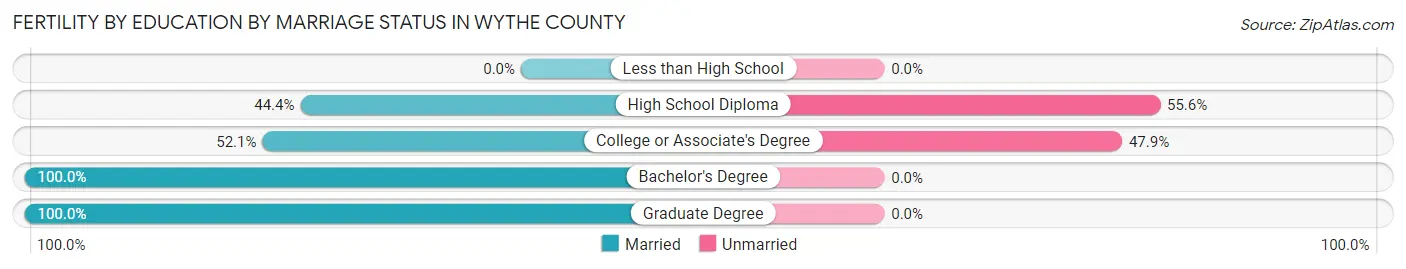
| Educational Attainment | Married | Unmarried |
| Less than High School | 0 (0.0%) | 0 (0.0%) |
| High School Diploma | 20 (44.4%) | 25 (55.6%) |
| College or Associate's Degree | 87 (52.1%) | 80 (47.9%) |
| Bachelor's Degree | 39 (100.0%) | 0 (0.0%) |
| Graduate Degree | 32 (100.0%) | 0 (0.0%) |
| Total | 178 (62.9%) | 105 (37.1%) |
Employment Characteristics in Wythe County
Employment by Class of Employer in Wythe County
Among the 12,341 employed individuals in Wythe County, private company employees (8,470 | 68.6%), local government employees (1,190 | 9.6%), and state government employees (903 | 7.3%) make up the most common classes of employment.
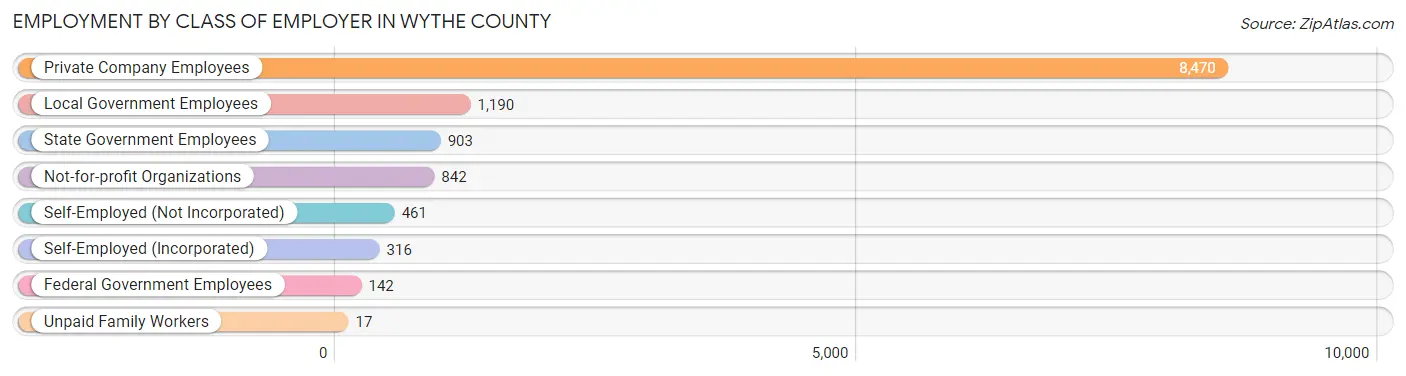
| Employer Class | # Employees | % Employees |
| Private Company Employees | 8,470 | 68.6% |
| Self-Employed (Incorporated) | 316 | 2.6% |
| Self-Employed (Not Incorporated) | 461 | 3.7% |
| Not-for-profit Organizations | 842 | 6.8% |
| Local Government Employees | 1,190 | 9.6% |
| State Government Employees | 903 | 7.3% |
| Federal Government Employees | 142 | 1.1% |
| Unpaid Family Workers | 17 | 0.1% |
| Total | 12,341 | 100.0% |
Employment Status by Age in Wythe County
According to the labor force statistics for Wythe County, out of the total population over 16 years of age (23,654), 56.3% or 13,317 individuals are in the labor force, with 5.2% or 692 of them unemployed. The age group with the highest labor force participation rate is 20 to 24 years, with 86.7% or 1,239 individuals in the labor force. Within the labor force, the 16 to 19 years age range has the highest percentage of unemployed individuals, with 12.8% or 73 of them being unemployed.
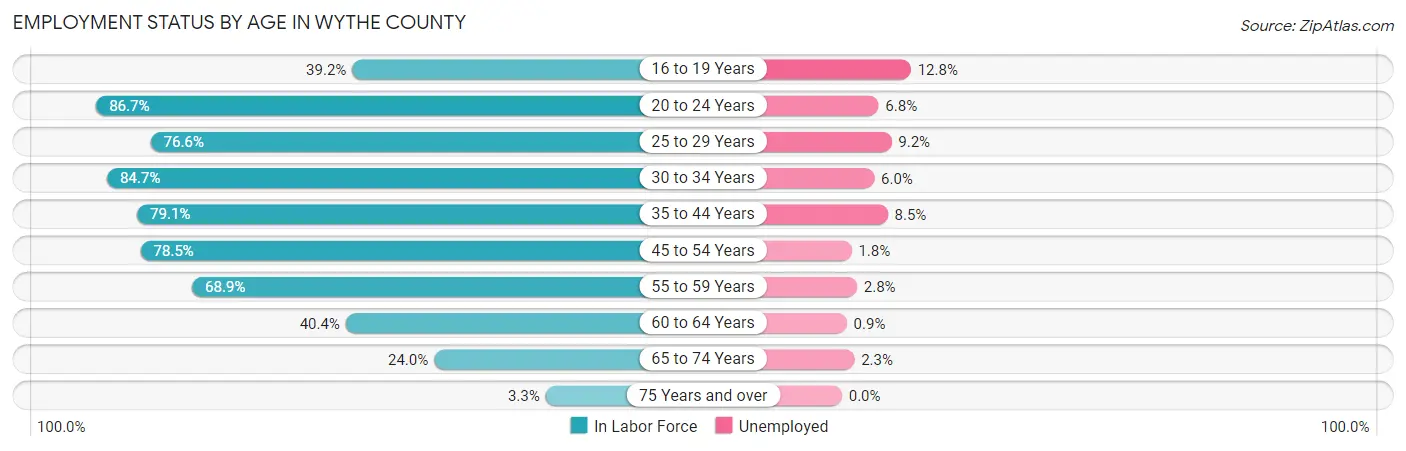
| Age Bracket | In Labor Force | Unemployed |
| 16 to 19 Years | 569 (39.2%) | 73 (12.8%) |
| 20 to 24 Years | 1,239 (86.7%) | 84 (6.8%) |
| 25 to 29 Years | 1,196 (76.6%) | 110 (9.2%) |
| 30 to 34 Years | 1,243 (84.7%) | 75 (6.0%) |
| 35 to 44 Years | 2,589 (79.1%) | 220 (8.5%) |
| 45 to 54 Years | 3,212 (78.5%) | 58 (1.8%) |
| 55 to 59 Years | 1,442 (68.9%) | 40 (2.8%) |
| 60 to 64 Years | 880 (40.4%) | 8 (0.9%) |
| 65 to 74 Years | 860 (24.0%) | 20 (2.3%) |
| 75 Years and over | 83 (3.3%) | 0 (0.0%) |
| Total | 13,317 (56.3%) | 692 (5.2%) |
Employment Status by Educational Attainment in Wythe County
According to labor force statistics for Wythe County, 72.0% of individuals (10,557) out of the total population between 25 and 64 years of age (14,663) are in the labor force, with 4.8% or 507 of them being unemployed. The group with the highest labor force participation rate are those with the educational attainment of bachelor's degree or higher, with 81.2% or 2,386 individuals in the labor force. Within the labor force, individuals with college / associate degree education have the highest percentage of unemployment, with 8.9% or 350 of them being unemployed.
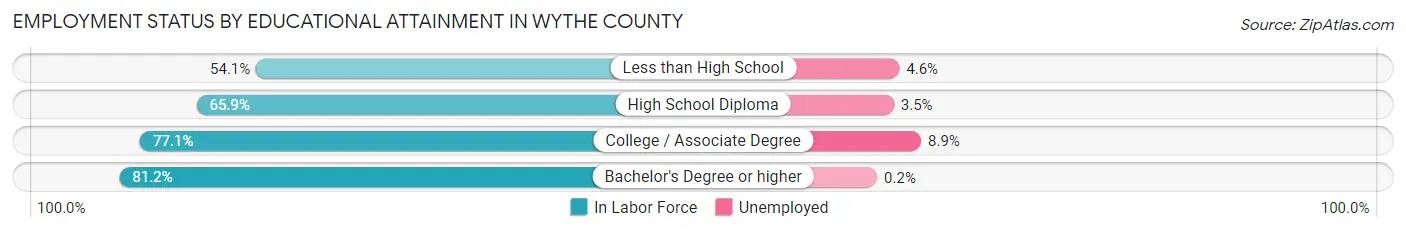
| Educational Attainment | In Labor Force | Unemployed |
| Less than High School | 589 (54.1%) | 50 (4.6%) |
| High School Diploma | 3,648 (65.9%) | 194 (3.5%) |
| College / Associate Degree | 3,933 (77.1%) | 454 (8.9%) |
| Bachelor's Degree or higher | 2,386 (81.2%) | 6 (0.2%) |
| Total | 10,557 (72.0%) | 704 (4.8%) |
Employment Occupations by Sex in Wythe County
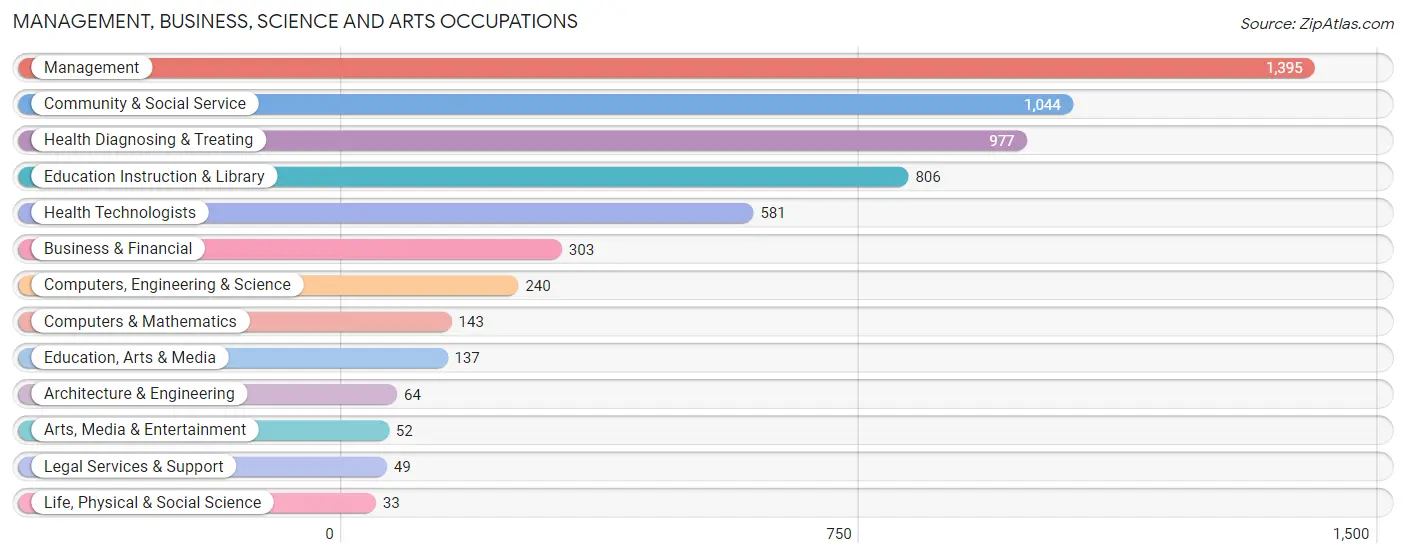
Management, Business, Science and Arts Occupations
The most common Management, Business, Science and Arts occupations in Wythe County are Management (1,395 | 11.1%), Community & Social Service (1,044 | 8.3%), Health Diagnosing & Treating (977 | 7.7%), Education Instruction & Library (806 | 6.4%), and Health Technologists (581 | 4.6%).
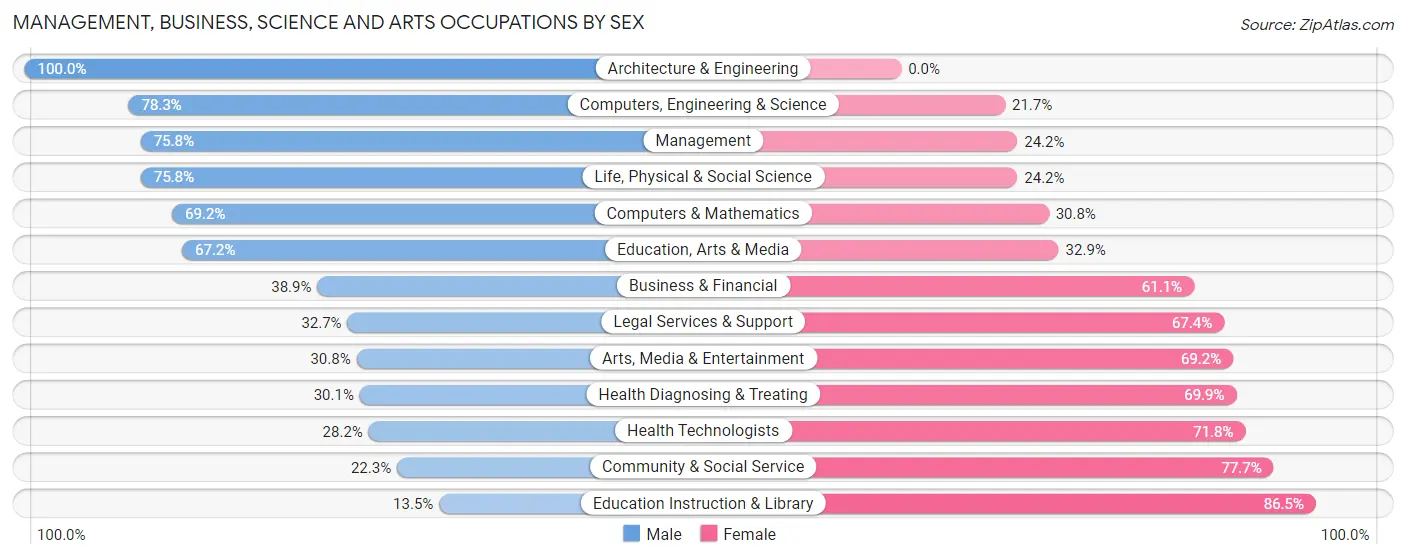
Management, Business, Science and Arts Occupations by Sex
Within the Management, Business, Science and Arts occupations in Wythe County, the most male-oriented occupations are Architecture & Engineering (100.0%), Computers, Engineering & Science (78.3%), and Management (75.8%), while the most female-oriented occupations are Education Instruction & Library (86.5%), Community & Social Service (77.7%), and Health Technologists (71.8%).
| Occupation | Male | Female |
| Management | 1,057 (75.8%) | 338 (24.2%) |
| Business & Financial | 118 (38.9%) | 185 (61.1%) |
| Computers, Engineering & Science | 188 (78.3%) | 52 (21.7%) |
| Computers & Mathematics | 99 (69.2%) | 44 (30.8%) |
| Architecture & Engineering | 64 (100.0%) | 0 (0.0%) |
| Life, Physical & Social Science | 25 (75.8%) | 8 (24.2%) |
| Community & Social Service | 233 (22.3%) | 811 (77.7%) |
| Education, Arts & Media | 92 (67.1%) | 45 (32.9%) |
| Legal Services & Support | 16 (32.7%) | 33 (67.3%) |
| Education Instruction & Library | 109 (13.5%) | 697 (86.5%) |
| Arts, Media & Entertainment | 16 (30.8%) | 36 (69.2%) |
| Health Diagnosing & Treating | 294 (30.1%) | 683 (69.9%) |
| Health Technologists | 164 (28.2%) | 417 (71.8%) |
| Total (Category) | 1,890 (47.7%) | 2,069 (52.3%) |
| Total (Overall) | 6,847 (54.2%) | 5,776 (45.8%) |
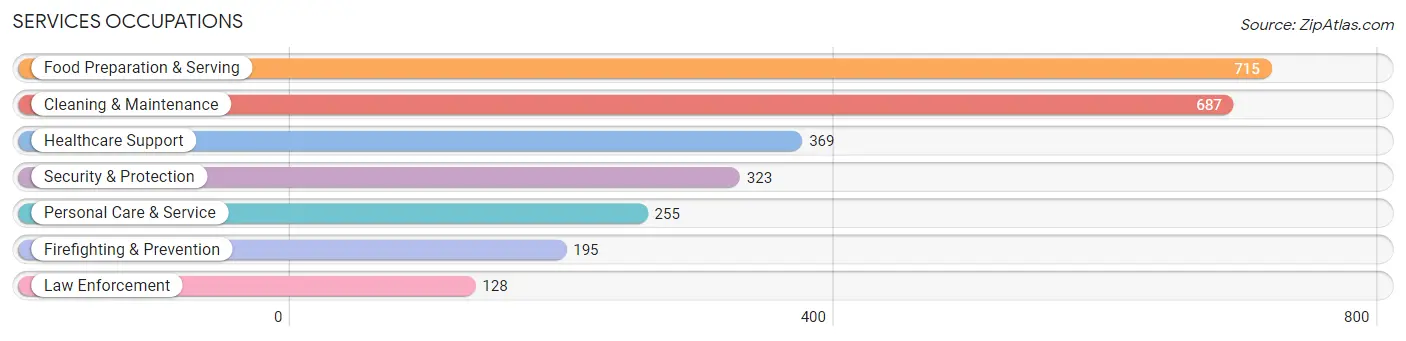
Services Occupations
The most common Services occupations in Wythe County are Food Preparation & Serving (715 | 5.7%), Cleaning & Maintenance (687 | 5.4%), Healthcare Support (369 | 2.9%), Security & Protection (323 | 2.6%), and Personal Care & Service (255 | 2.0%).
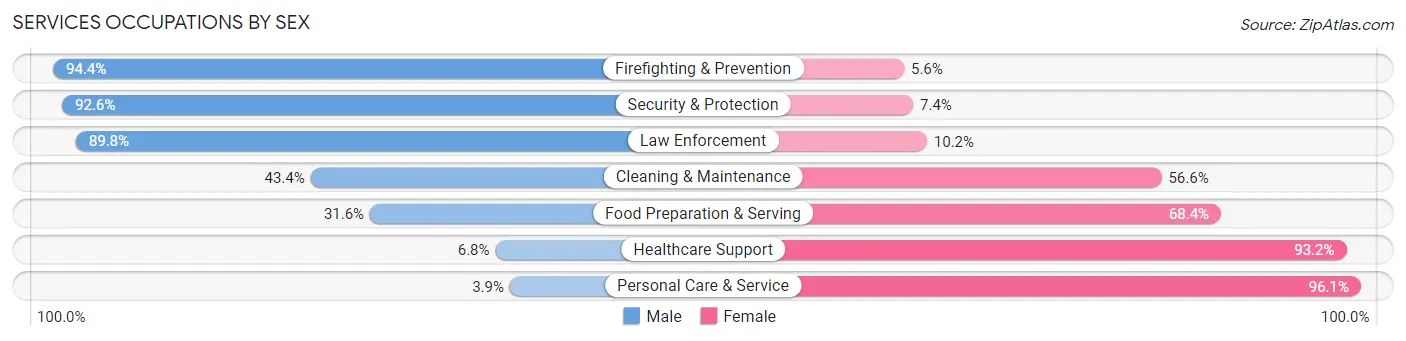
Services Occupations by Sex
Within the Services occupations in Wythe County, the most male-oriented occupations are Firefighting & Prevention (94.4%), Security & Protection (92.6%), and Law Enforcement (89.8%), while the most female-oriented occupations are Personal Care & Service (96.1%), Healthcare Support (93.2%), and Food Preparation & Serving (68.4%).
| Occupation | Male | Female |
| Healthcare Support | 25 (6.8%) | 344 (93.2%) |
| Security & Protection | 299 (92.6%) | 24 (7.4%) |
| Firefighting & Prevention | 184 (94.4%) | 11 (5.6%) |
| Law Enforcement | 115 (89.8%) | 13 (10.2%) |
| Food Preparation & Serving | 226 (31.6%) | 489 (68.4%) |
| Cleaning & Maintenance | 298 (43.4%) | 389 (56.6%) |
| Personal Care & Service | 10 (3.9%) | 245 (96.1%) |
| Total (Category) | 858 (36.5%) | 1,491 (63.5%) |
| Total (Overall) | 6,847 (54.2%) | 5,776 (45.8%) |
Sales and Office Occupations
The most common Sales and Office occupations in Wythe County are Sales & Related (1,318 | 10.4%), and Office & Administration (1,129 | 8.9%).

Sales and Office Occupations by Sex

| Occupation | Male | Female |
| Sales & Related | 731 (55.5%) | 587 (44.5%) |
| Office & Administration | 198 (17.5%) | 931 (82.5%) |
| Total (Category) | 929 (38.0%) | 1,518 (62.0%) |
| Total (Overall) | 6,847 (54.2%) | 5,776 (45.8%) |
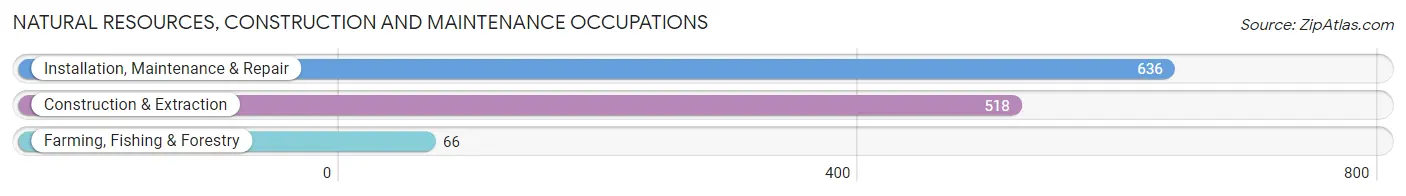
Natural Resources, Construction and Maintenance Occupations
The most common Natural Resources, Construction and Maintenance occupations in Wythe County are Installation, Maintenance & Repair (636 | 5.0%), Construction & Extraction (518 | 4.1%), and Farming, Fishing & Forestry (66 | 0.5%).
Natural Resources, Construction and Maintenance Occupations by Sex
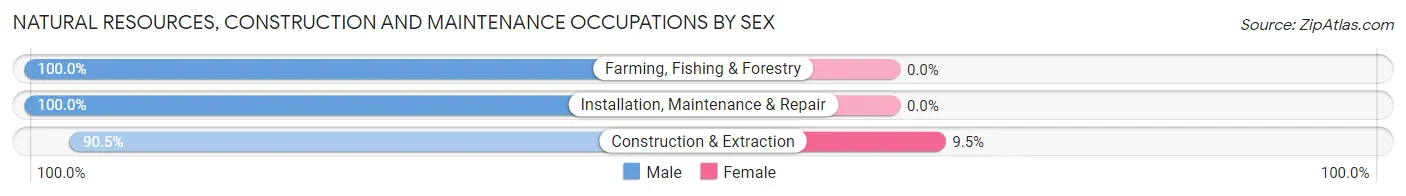
| Occupation | Male | Female |
| Farming, Fishing & Forestry | 66 (100.0%) | 0 (0.0%) |
| Construction & Extraction | 469 (90.5%) | 49 (9.5%) |
| Installation, Maintenance & Repair | 636 (100.0%) | 0 (0.0%) |
| Total (Category) | 1,171 (96.0%) | 49 (4.0%) |
| Total (Overall) | 6,847 (54.2%) | 5,776 (45.8%) |
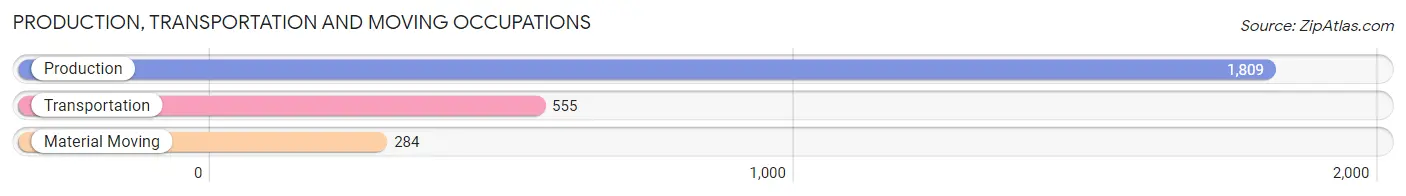
Production, Transportation and Moving Occupations
The most common Production, Transportation and Moving occupations in Wythe County are Production (1,809 | 14.3%), Transportation (555 | 4.4%), and Material Moving (284 | 2.2%).
Production, Transportation and Moving Occupations by Sex
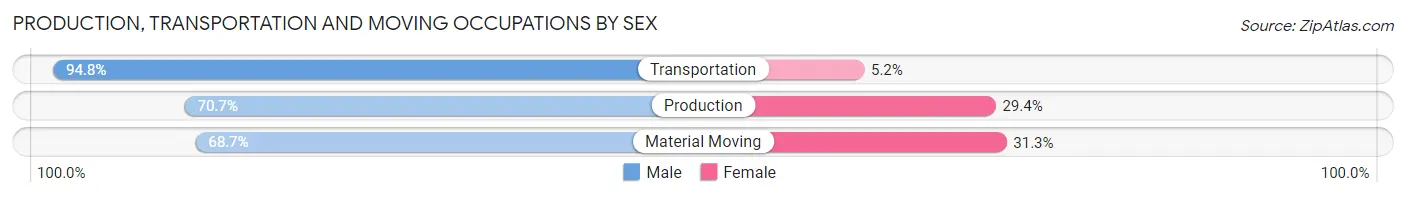
| Occupation | Male | Female |
| Production | 1,278 (70.7%) | 531 (29.3%) |
| Transportation | 526 (94.8%) | 29 (5.2%) |
| Material Moving | 195 (68.7%) | 89 (31.3%) |
| Total (Category) | 1,999 (75.5%) | 649 (24.5%) |
| Total (Overall) | 6,847 (54.2%) | 5,776 (45.8%) |
Employment Industries by Sex in Wythe County
Employment Industries in Wythe County
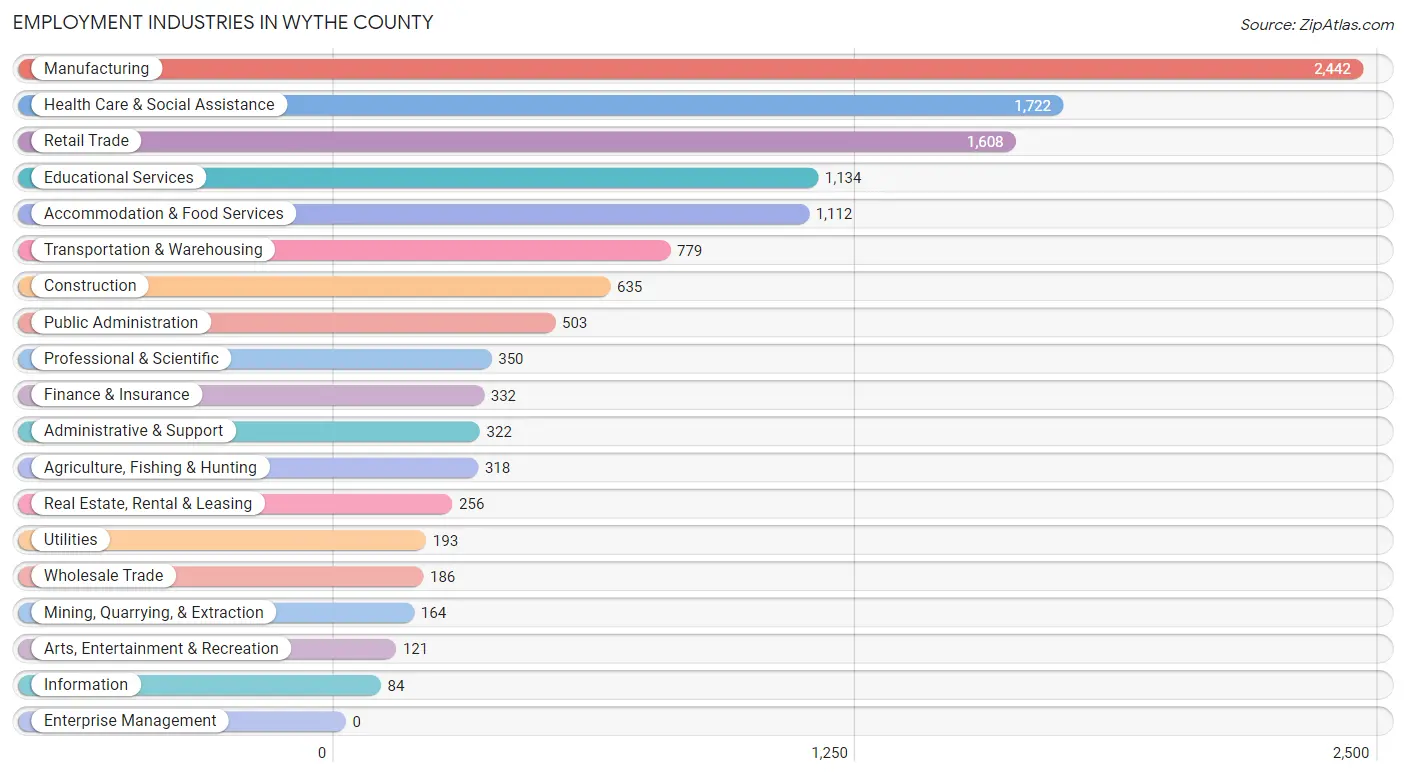
The major employment industries in Wythe County include Manufacturing (2,442 | 19.4%), Health Care & Social Assistance (1,722 | 13.6%), Retail Trade (1,608 | 12.7%), Educational Services (1,134 | 9.0%), and Accommodation & Food Services (1,112 | 8.8%).
Employment Industries by Sex in Wythe County
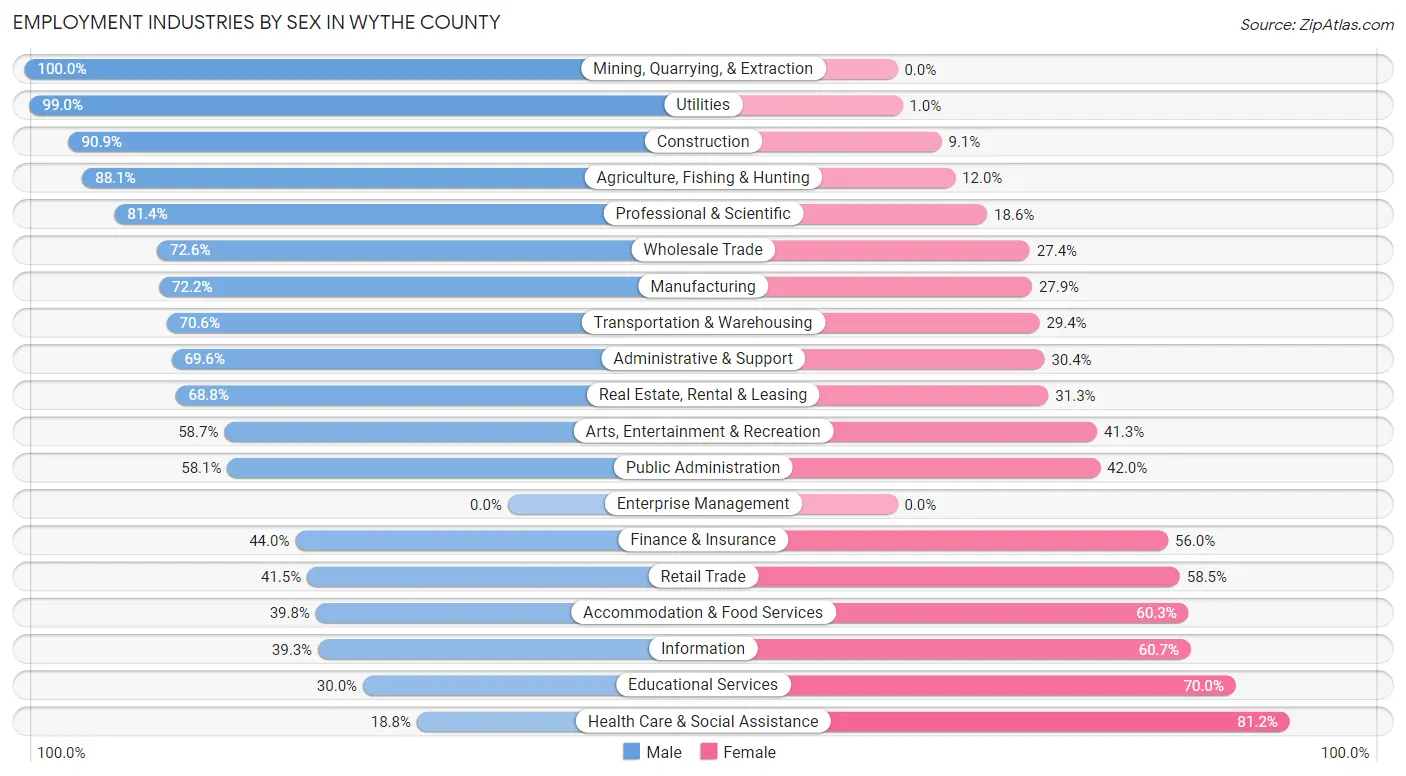
The Wythe County industries that see more men than women are Mining, Quarrying, & Extraction (100.0%), Utilities (99.0%), and Construction (90.9%), whereas the industries that tend to have a higher number of women are Health Care & Social Assistance (81.2%), Educational Services (70.0%), and Information (60.7%).
| Industry | Male | Female |
| Agriculture, Fishing & Hunting | 280 (88.0%) | 38 (11.9%) |
| Mining, Quarrying, & Extraction | 164 (100.0%) | 0 (0.0%) |
| Construction | 577 (90.9%) | 58 (9.1%) |
| Manufacturing | 1,762 (72.2%) | 680 (27.9%) |
| Wholesale Trade | 135 (72.6%) | 51 (27.4%) |
| Retail Trade | 668 (41.5%) | 940 (58.5%) |
| Transportation & Warehousing | 550 (70.6%) | 229 (29.4%) |
| Utilities | 191 (99.0%) | 2 (1.0%) |
| Information | 33 (39.3%) | 51 (60.7%) |
| Finance & Insurance | 146 (44.0%) | 186 (56.0%) |
| Real Estate, Rental & Leasing | 176 (68.8%) | 80 (31.2%) |
| Professional & Scientific | 285 (81.4%) | 65 (18.6%) |
| Enterprise Management | 0 (0.0%) | 0 (0.0%) |
| Administrative & Support | 224 (69.6%) | 98 (30.4%) |
| Educational Services | 340 (30.0%) | 794 (70.0%) |
| Health Care & Social Assistance | 324 (18.8%) | 1,398 (81.2%) |
| Arts, Entertainment & Recreation | 71 (58.7%) | 50 (41.3%) |
| Accommodation & Food Services | 442 (39.8%) | 670 (60.3%) |
| Public Administration | 292 (58.1%) | 211 (41.9%) |
| Total | 6,847 (54.2%) | 5,776 (45.8%) |
Education in Wythe County
School Enrollment in Wythe County
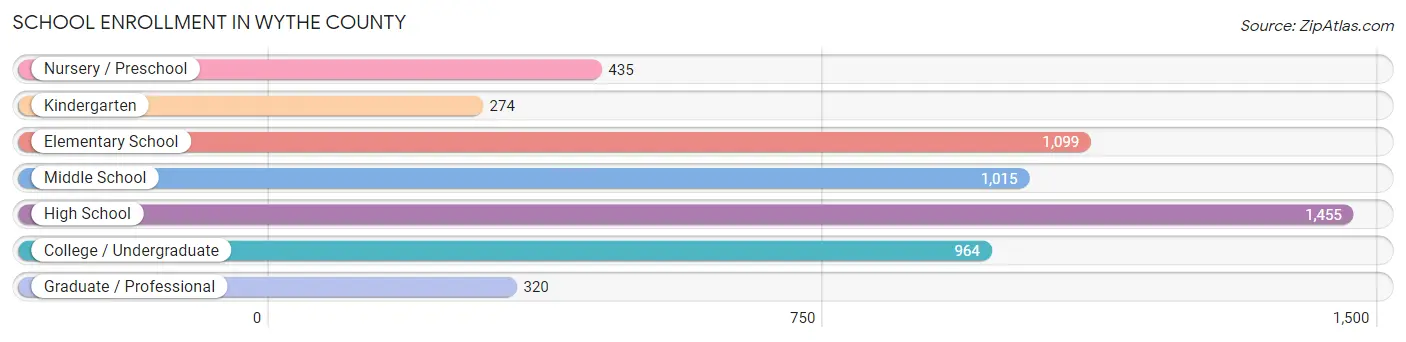
The most common levels of schooling among the 5,562 students in Wythe County are high school (1,455 | 26.2%), elementary school (1,099 | 19.8%), and middle school (1,015 | 18.2%).
| School Level | # Students | % Students |
| Nursery / Preschool | 435 | 7.8% |
| Kindergarten | 274 | 4.9% |
| Elementary School | 1,099 | 19.8% |
| Middle School | 1,015 | 18.2% |
| High School | 1,455 | 26.2% |
| College / Undergraduate | 964 | 17.3% |
| Graduate / Professional | 320 | 5.8% |
| Total | 5,562 | 100.0% |
School Enrollment by Age by Funding Source in Wythe County
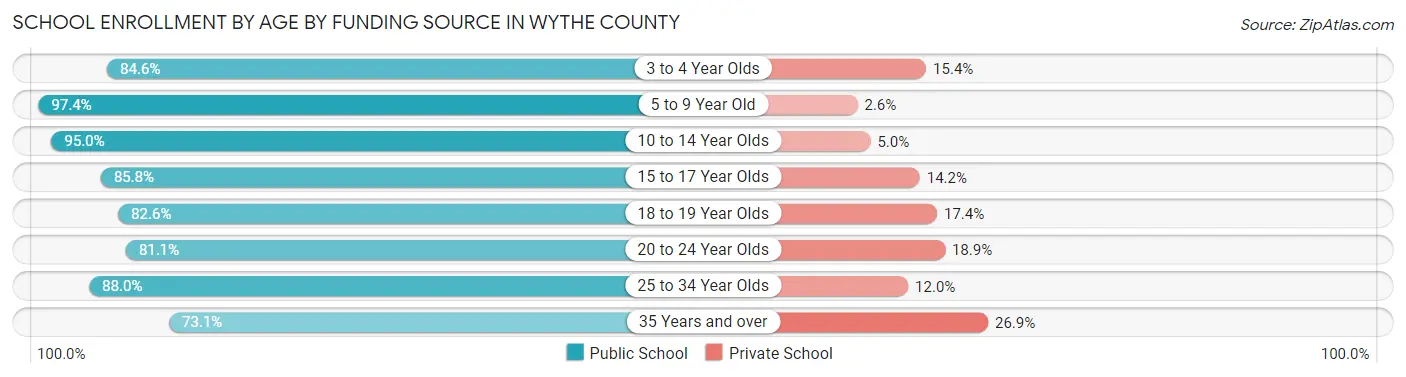
Out of a total of 5,562 students who are enrolled in schools in Wythe County, 562 (10.1%) attend a private institution, while the remaining 5,000 (89.9%) are enrolled in public schools. The age group of 35 years and over has the highest likelihood of being enrolled in private schools, with 89 (26.9% in the age bracket) enrolled. Conversely, the age group of 5 to 9 year old has the lowest likelihood of being enrolled in a private school, with 1,361 (97.4% in the age bracket) attending a public institution.
| Age Bracket | Public School | Private School |
| 3 to 4 Year Olds | 226 (84.6%) | 41 (15.4%) |
| 5 to 9 Year Old | 1,361 (97.4%) | 36 (2.6%) |
| 10 to 14 Year Olds | 1,371 (95.0%) | 72 (5.0%) |
| 15 to 17 Year Olds | 890 (85.8%) | 147 (14.2%) |
| 18 to 19 Year Olds | 337 (82.6%) | 71 (17.4%) |
| 20 to 24 Year Olds | 301 (81.1%) | 70 (18.9%) |
| 25 to 34 Year Olds | 271 (88.0%) | 37 (12.0%) |
| 35 Years and over | 242 (73.1%) | 89 (26.9%) |
| Total | 5,000 (89.9%) | 562 (10.1%) |
Educational Attainment by Field of Study in Wythe County
Business (958 | 20.8%), education (940 | 20.4%), science & technology (527 | 11.5%), social sciences (327 | 7.1%), and bio, nature & agricultural (300 | 6.5%) are the most common fields of study among 4,602 individuals in Wythe County who have obtained a bachelor's degree or higher.
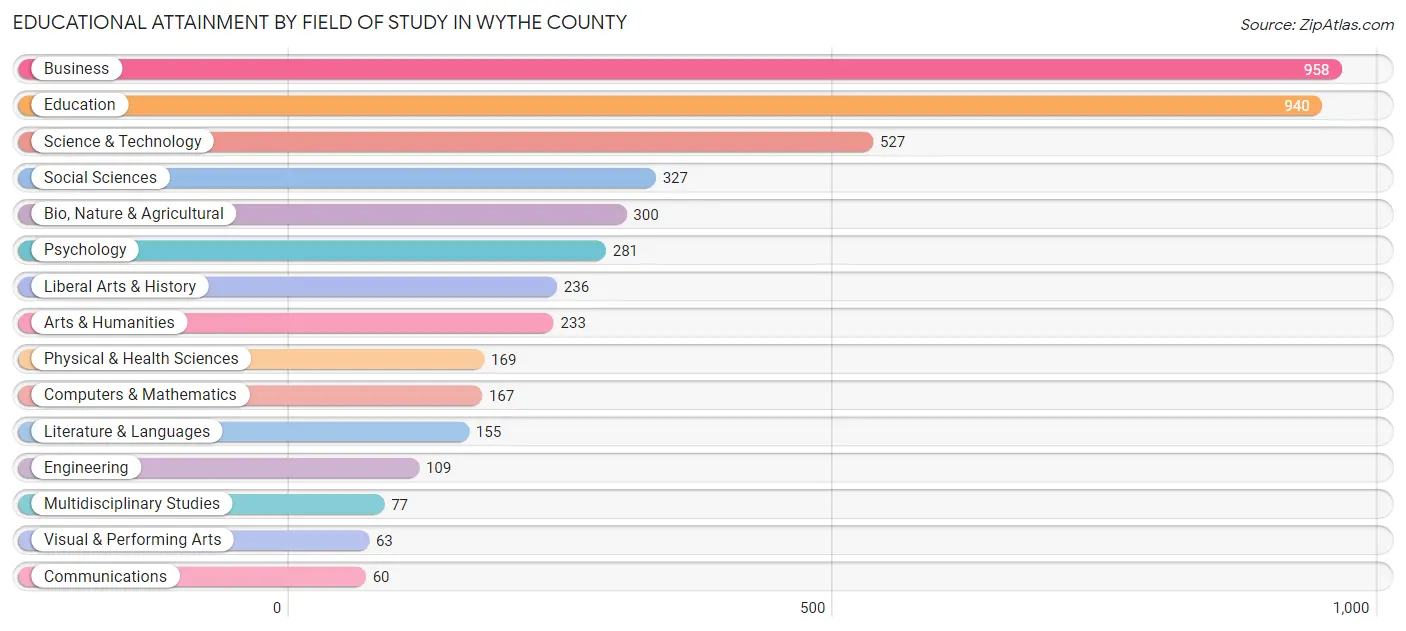
| Field of Study | # Graduates | % Graduates |
| Computers & Mathematics | 167 | 3.6% |
| Bio, Nature & Agricultural | 300 | 6.5% |
| Physical & Health Sciences | 169 | 3.7% |
| Psychology | 281 | 6.1% |
| Social Sciences | 327 | 7.1% |
| Engineering | 109 | 2.4% |
| Multidisciplinary Studies | 77 | 1.7% |
| Science & Technology | 527 | 11.5% |
| Business | 958 | 20.8% |
| Education | 940 | 20.4% |
| Literature & Languages | 155 | 3.4% |
| Liberal Arts & History | 236 | 5.1% |
| Visual & Performing Arts | 63 | 1.4% |
| Communications | 60 | 1.3% |
| Arts & Humanities | 233 | 5.1% |
| Total | 4,602 | 100.0% |
Transportation & Commute in Wythe County
Vehicle Availability by Sex in Wythe County
The most prevalent vehicle ownership categories in Wythe County are males with 3 vehicles (2,072, accounting for 31.2%) and females with 3 vehicles (1,599, making up 36.4%).
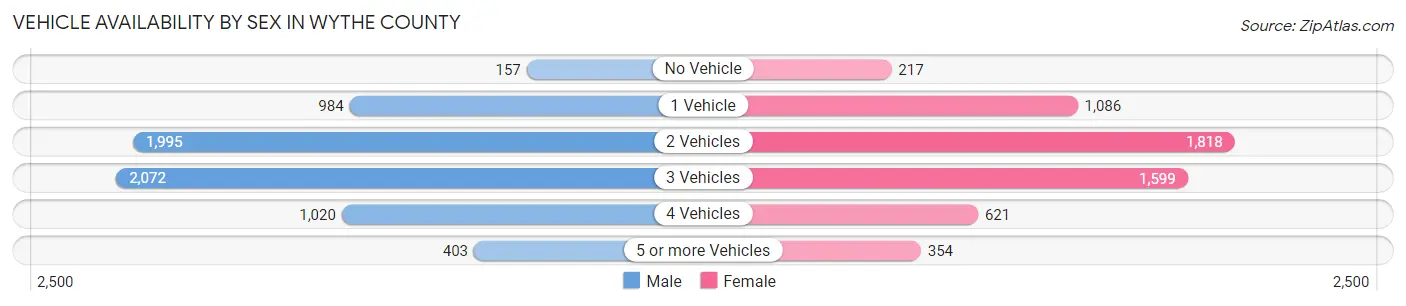
| Vehicles Available | Male | Female |
| No Vehicle | 157 (2.4%) | 217 (3.8%) |
| 1 Vehicle | 984 (14.8%) | 1,086 (19.1%) |
| 2 Vehicles | 1,995 (30.1%) | 1,818 (31.9%) |
| 3 Vehicles | 2,072 (31.2%) | 1,599 (28.1%) |
| 4 Vehicles | 1,020 (15.4%) | 621 (10.9%) |
| 5 or more Vehicles | 403 (6.1%) | 354 (6.2%) |
| Total | 6,631 (100.0%) | 5,695 (100.0%) |
Commute Time in Wythe County
The most frequently occuring commute durations in Wythe County are 15 to 19 minutes (2,128 commuters, 18.1%), 10 to 14 minutes (1,444 commuters, 12.3%), and 25 to 29 minutes (1,400 commuters, 11.9%).
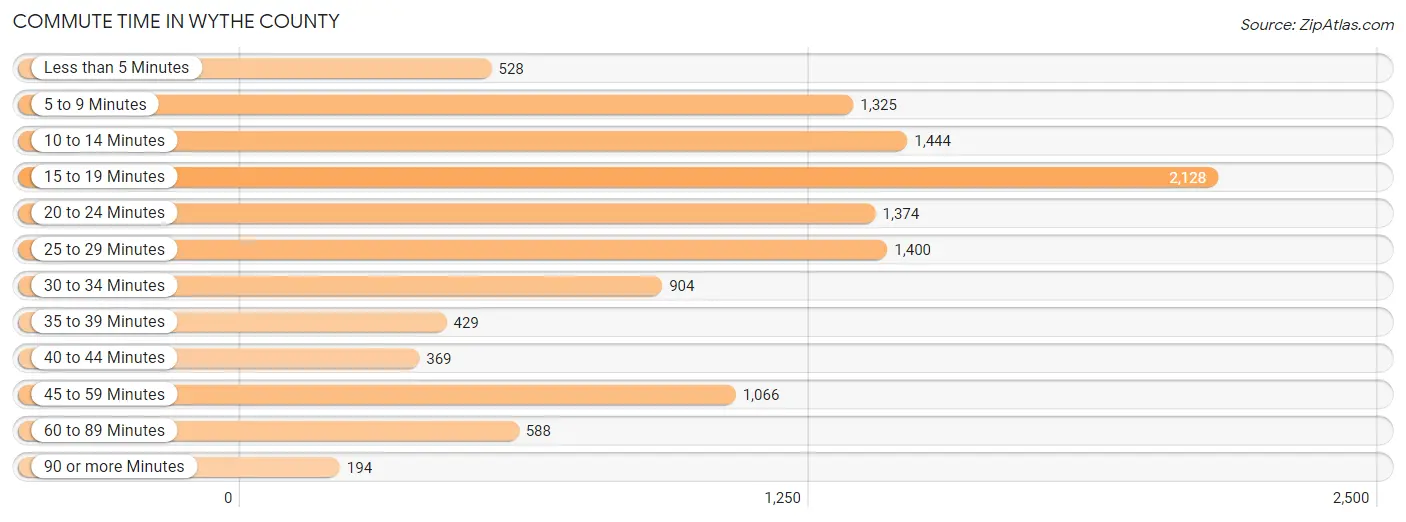
| Commute Time | # Commuters | % Commuters |
| Less than 5 Minutes | 528 | 4.5% |
| 5 to 9 Minutes | 1,325 | 11.3% |
| 10 to 14 Minutes | 1,444 | 12.3% |
| 15 to 19 Minutes | 2,128 | 18.1% |
| 20 to 24 Minutes | 1,374 | 11.7% |
| 25 to 29 Minutes | 1,400 | 11.9% |
| 30 to 34 Minutes | 904 | 7.7% |
| 35 to 39 Minutes | 429 | 3.6% |
| 40 to 44 Minutes | 369 | 3.1% |
| 45 to 59 Minutes | 1,066 | 9.1% |
| 60 to 89 Minutes | 588 | 5.0% |
| 90 or more Minutes | 194 | 1.7% |
Commute Time by Sex in Wythe County
The most common commute times in Wythe County are 15 to 19 minutes (1,110 commuters, 17.5%) for males and 15 to 19 minutes (1,018 commuters, 18.8%) for females.
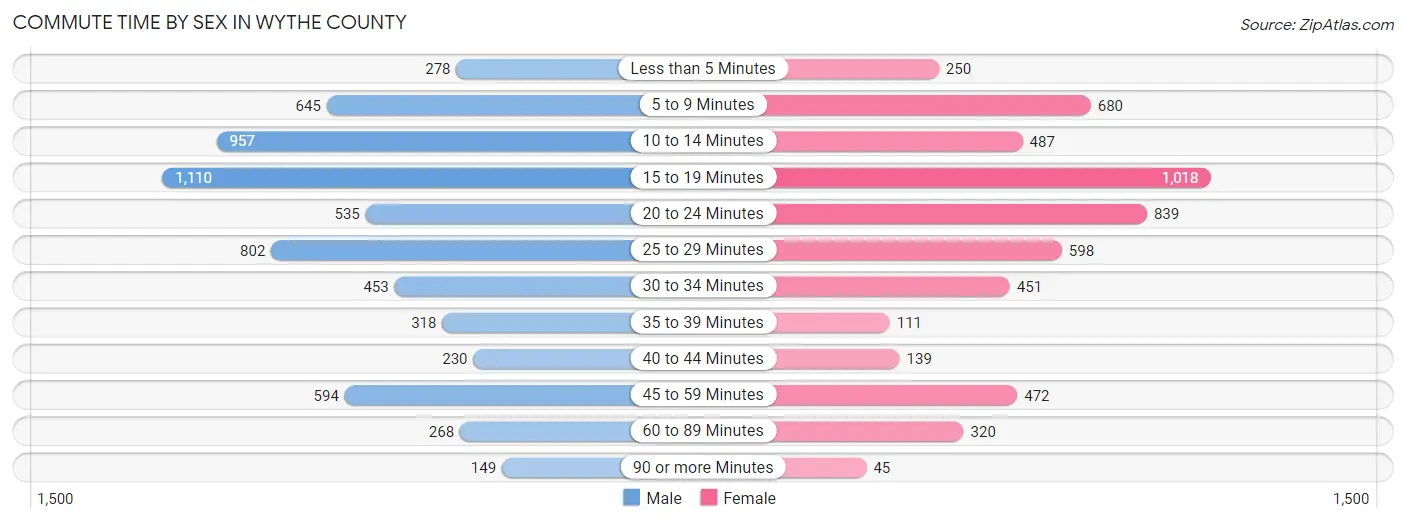
| Commute Time | Male | Female |
| Less than 5 Minutes | 278 (4.4%) | 250 (4.6%) |
| 5 to 9 Minutes | 645 (10.2%) | 680 (12.6%) |
| 10 to 14 Minutes | 957 (15.1%) | 487 (9.0%) |
| 15 to 19 Minutes | 1,110 (17.5%) | 1,018 (18.8%) |
| 20 to 24 Minutes | 535 (8.4%) | 839 (15.5%) |
| 25 to 29 Minutes | 802 (12.7%) | 598 (11.1%) |
| 30 to 34 Minutes | 453 (7.1%) | 451 (8.3%) |
| 35 to 39 Minutes | 318 (5.0%) | 111 (2.1%) |
| 40 to 44 Minutes | 230 (3.6%) | 139 (2.6%) |
| 45 to 59 Minutes | 594 (9.4%) | 472 (8.7%) |
| 60 to 89 Minutes | 268 (4.2%) | 320 (5.9%) |
| 90 or more Minutes | 149 (2.4%) | 45 (0.8%) |
Time of Departure to Work by Sex in Wythe County
The most frequent times of departure to work in Wythe County are 6:30 AM to 6:59 AM (854, 13.5%) for males and 7:30 AM to 7:59 AM (1,332, 24.6%) for females.
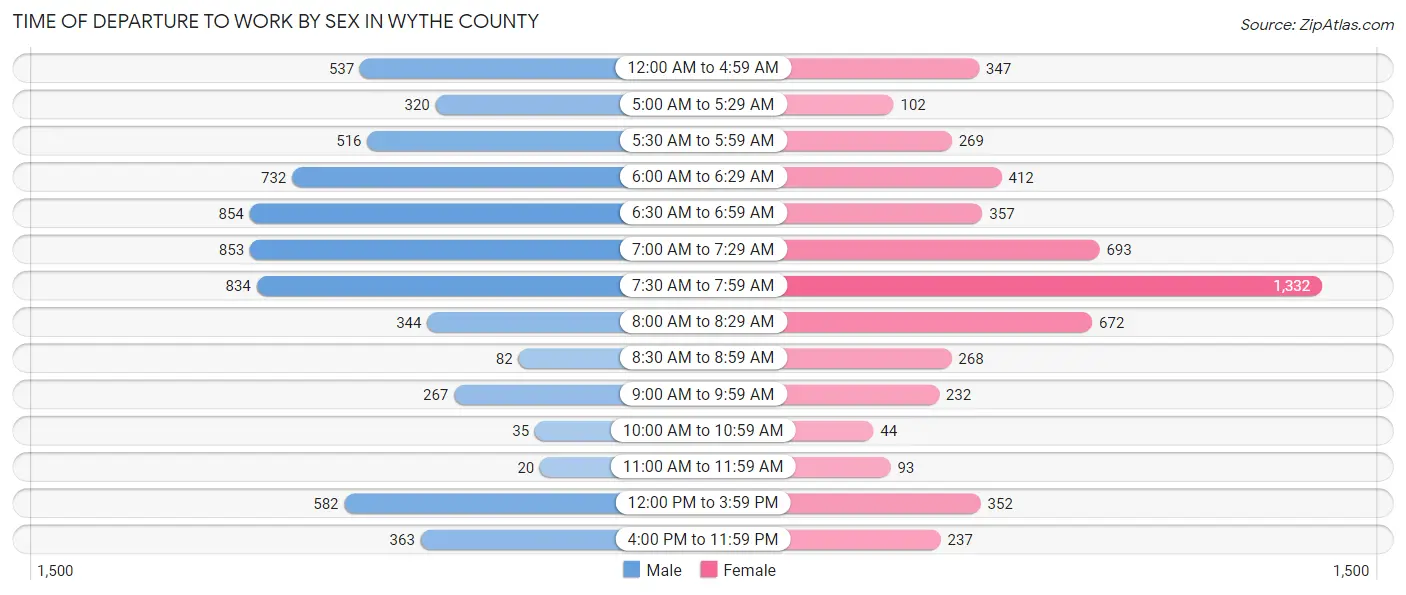
| Time of Departure | Male | Female |
| 12:00 AM to 4:59 AM | 537 (8.5%) | 347 (6.4%) |
| 5:00 AM to 5:29 AM | 320 (5.1%) | 102 (1.9%) |
| 5:30 AM to 5:59 AM | 516 (8.1%) | 269 (5.0%) |
| 6:00 AM to 6:29 AM | 732 (11.6%) | 412 (7.6%) |
| 6:30 AM to 6:59 AM | 854 (13.5%) | 357 (6.6%) |
| 7:00 AM to 7:29 AM | 853 (13.5%) | 693 (12.8%) |
| 7:30 AM to 7:59 AM | 834 (13.2%) | 1,332 (24.6%) |
| 8:00 AM to 8:29 AM | 344 (5.4%) | 672 (12.4%) |
| 8:30 AM to 8:59 AM | 82 (1.3%) | 268 (5.0%) |
| 9:00 AM to 9:59 AM | 267 (4.2%) | 232 (4.3%) |
| 10:00 AM to 10:59 AM | 35 (0.5%) | 44 (0.8%) |
| 11:00 AM to 11:59 AM | 20 (0.3%) | 93 (1.7%) |
| 12:00 PM to 3:59 PM | 582 (9.2%) | 352 (6.5%) |
| 4:00 PM to 11:59 PM | 363 (5.7%) | 237 (4.4%) |
| Total | 6,339 (100.0%) | 5,410 (100.0%) |
Housing Occupancy in Wythe County
Occupancy by Ownership in Wythe County
Of the total 12,424 dwellings in Wythe County, owner-occupied units account for 9,354 (75.3%), while renter-occupied units make up 3,070 (24.7%).
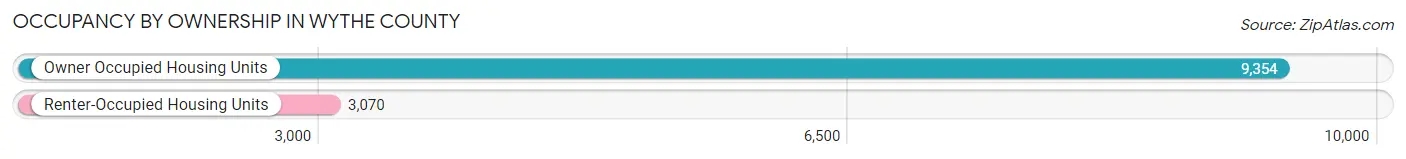
| Occupancy | # Housing Units | % Housing Units |
| Owner Occupied Housing Units | 9,354 | 75.3% |
| Renter-Occupied Housing Units | 3,070 | 24.7% |
| Total Occupied Housing Units | 12,424 | 100.0% |
Occupancy by Household Size in Wythe County
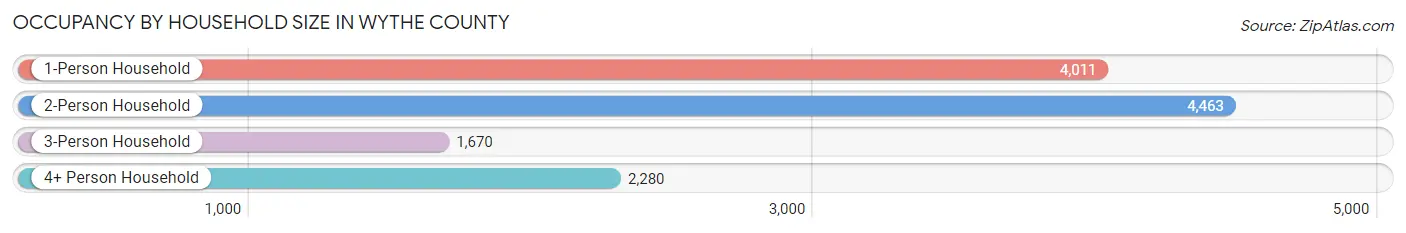
| Household Size | # Housing Units | % Housing Units |
| 1-Person Household | 4,011 | 32.3% |
| 2-Person Household | 4,463 | 35.9% |
| 3-Person Household | 1,670 | 13.4% |
| 4+ Person Household | 2,280 | 18.3% |
| Total Housing Units | 12,424 | 100.0% |
Occupancy by Ownership by Household Size in Wythe County
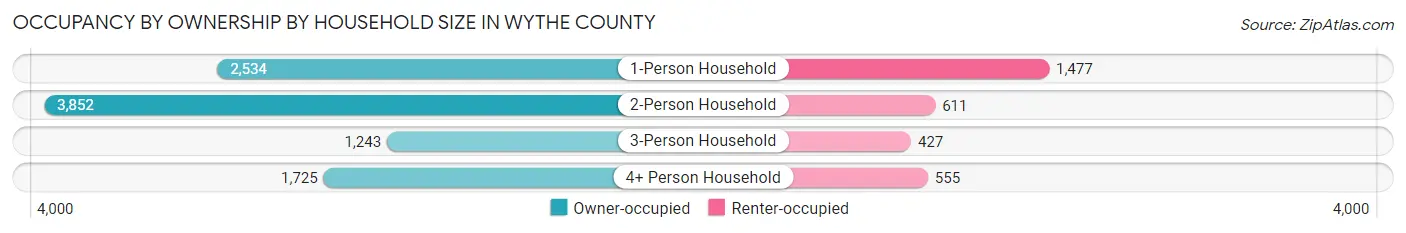
| Household Size | Owner-occupied | Renter-occupied |
| 1-Person Household | 2,534 (63.2%) | 1,477 (36.8%) |
| 2-Person Household | 3,852 (86.3%) | 611 (13.7%) |
| 3-Person Household | 1,243 (74.4%) | 427 (25.6%) |
| 4+ Person Household | 1,725 (75.7%) | 555 (24.3%) |
| Total Housing Units | 9,354 (75.3%) | 3,070 (24.7%) |
Occupancy by Educational Attainment in Wythe County
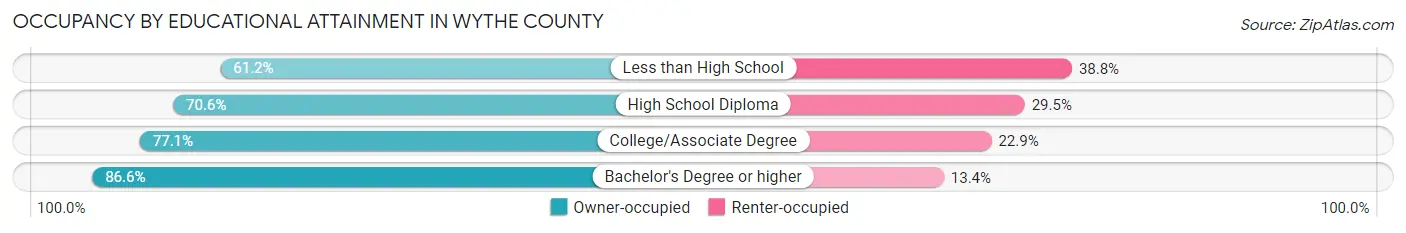
| Household Size | Owner-occupied | Renter-occupied |
| Less than High School | 755 (61.2%) | 479 (38.8%) |
| High School Diploma | 2,910 (70.6%) | 1,215 (29.4%) |
| College/Associate Degree | 3,496 (77.1%) | 1,036 (22.9%) |
| Bachelor's Degree or higher | 2,193 (86.6%) | 340 (13.4%) |
Occupancy by Age of Householder in Wythe County
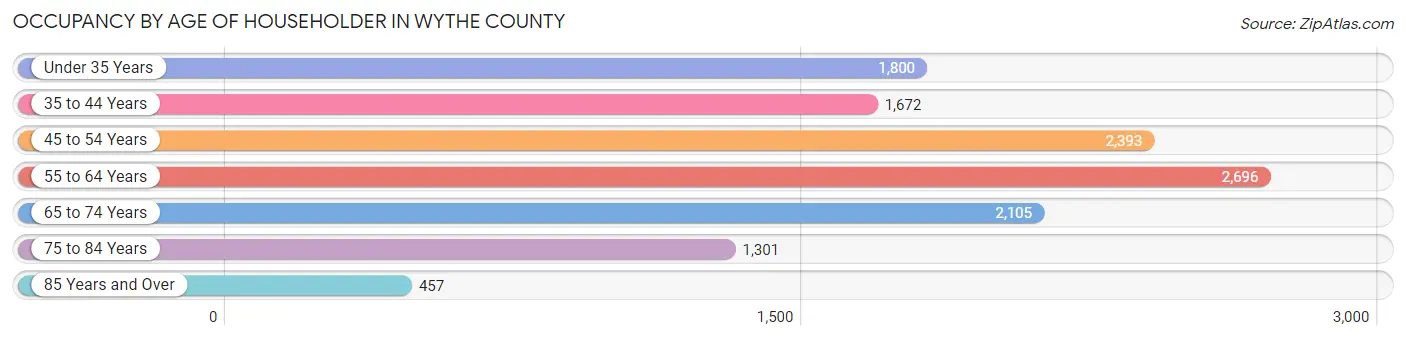
| Age Bracket | # Households | % Households |
| Under 35 Years | 1,800 | 14.5% |
| 35 to 44 Years | 1,672 | 13.5% |
| 45 to 54 Years | 2,393 | 19.3% |
| 55 to 64 Years | 2,696 | 21.7% |
| 65 to 74 Years | 2,105 | 16.9% |
| 75 to 84 Years | 1,301 | 10.5% |
| 85 Years and Over | 457 | 3.7% |
| Total | 12,424 | 100.0% |
Housing Finances in Wythe County
Median Income by Occupancy in Wythe County
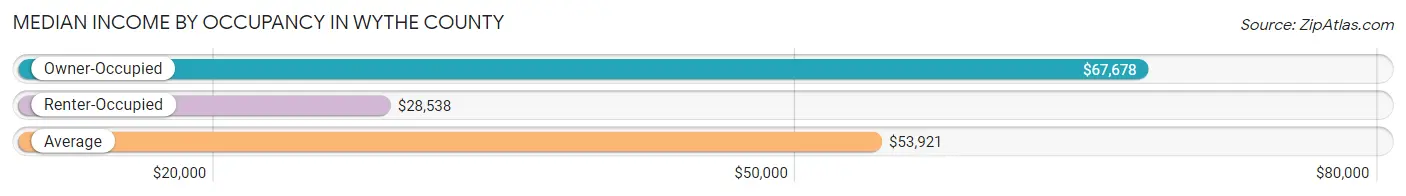
| Occupancy Type | # Households | Median Income |
| Owner-Occupied | 9,354 (75.3%) | $67,678 |
| Renter-Occupied | 3,070 (24.7%) | $28,538 |
| Average | 12,424 (100.0%) | $53,921 |
Occupancy by Householder Income Bracket in Wythe County
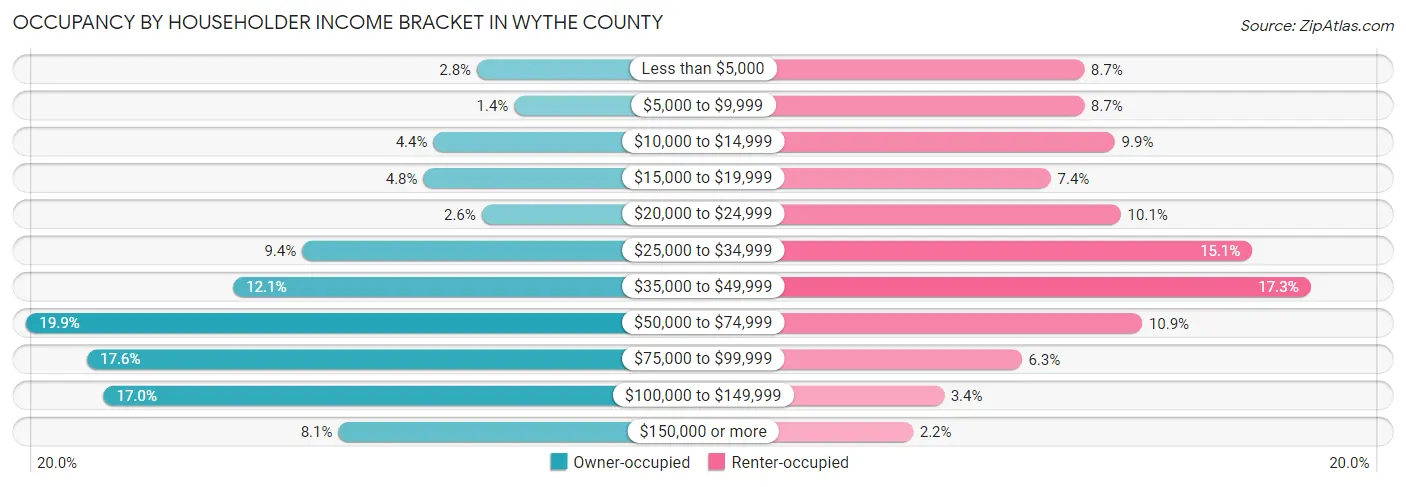
| Income Bracket | Owner-occupied | Renter-occupied |
| Less than $5,000 | 259 (2.8%) | 267 (8.7%) |
| $5,000 to $9,999 | 126 (1.3%) | 267 (8.7%) |
| $10,000 to $14,999 | 414 (4.4%) | 303 (9.9%) |
| $15,000 to $19,999 | 450 (4.8%) | 228 (7.4%) |
| $20,000 to $24,999 | 242 (2.6%) | 310 (10.1%) |
| $25,000 to $34,999 | 882 (9.4%) | 464 (15.1%) |
| $35,000 to $49,999 | 1,127 (12.0%) | 532 (17.3%) |
| $50,000 to $74,999 | 1,864 (19.9%) | 335 (10.9%) |
| $75,000 to $99,999 | 1,648 (17.6%) | 194 (6.3%) |
| $100,000 to $149,999 | 1,589 (17.0%) | 103 (3.4%) |
| $150,000 or more | 753 (8.1%) | 67 (2.2%) |
| Total | 9,354 (100.0%) | 3,070 (100.0%) |
Monthly Housing Cost Tiers in Wythe County
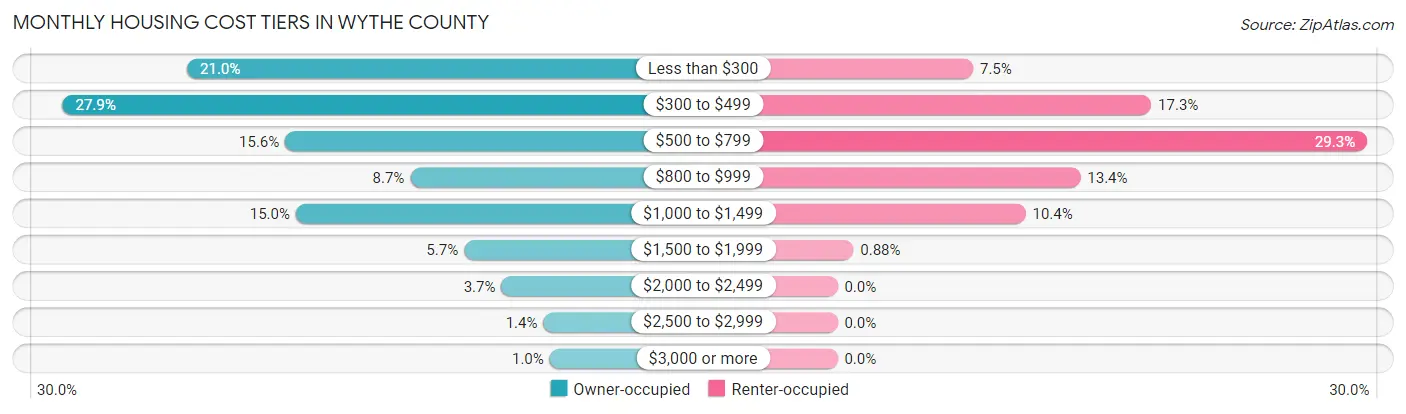
| Monthly Cost | Owner-occupied | Renter-occupied |
| Less than $300 | 1,966 (21.0%) | 230 (7.5%) |
| $300 to $499 | 2,610 (27.9%) | 532 (17.3%) |
| $500 to $799 | 1,460 (15.6%) | 898 (29.2%) |
| $800 to $999 | 814 (8.7%) | 412 (13.4%) |
| $1,000 to $1,499 | 1,405 (15.0%) | 319 (10.4%) |
| $1,500 to $1,999 | 536 (5.7%) | 27 (0.9%) |
| $2,000 to $2,499 | 343 (3.7%) | 0 (0.0%) |
| $2,500 to $2,999 | 126 (1.3%) | 0 (0.0%) |
| $3,000 or more | 94 (1.0%) | 0 (0.0%) |
| Total | 9,354 (100.0%) | 3,070 (100.0%) |
Physical Housing Characteristics in Wythe County
Housing Structures in Wythe County
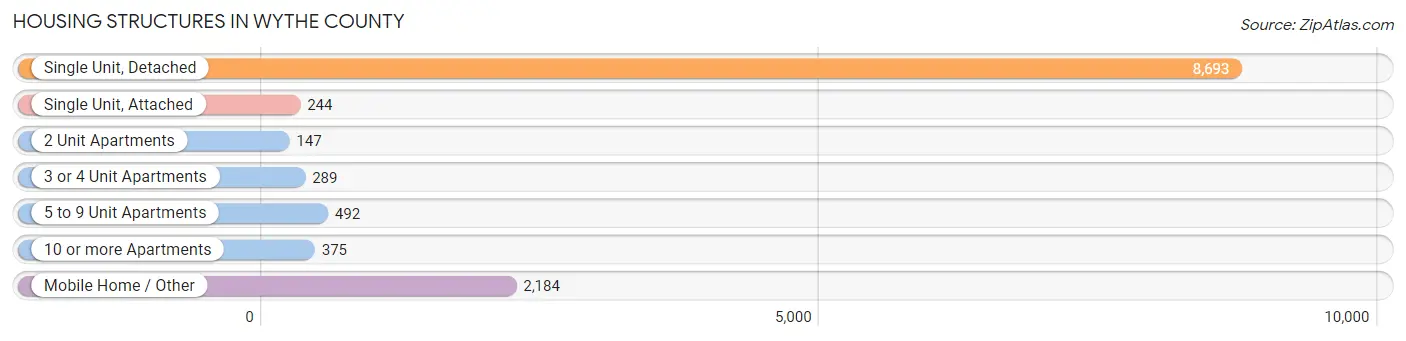
| Structure Type | # Housing Units | % Housing Units |
| Single Unit, Detached | 8,693 | 70.0% |
| Single Unit, Attached | 244 | 2.0% |
| 2 Unit Apartments | 147 | 1.2% |
| 3 or 4 Unit Apartments | 289 | 2.3% |
| 5 to 9 Unit Apartments | 492 | 4.0% |
| 10 or more Apartments | 375 | 3.0% |
| Mobile Home / Other | 2,184 | 17.6% |
| Total | 12,424 | 100.0% |
Housing Structures by Occupancy in Wythe County
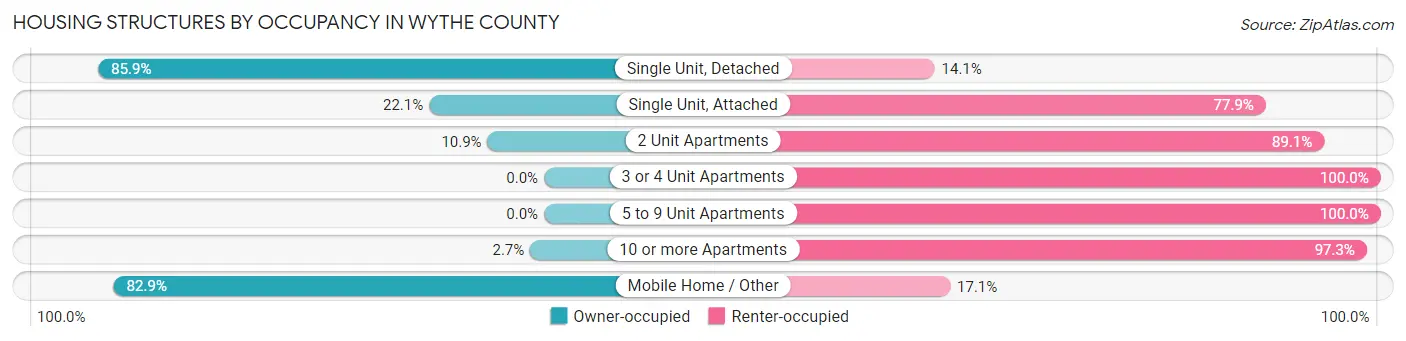
| Structure Type | Owner-occupied | Renter-occupied |
| Single Unit, Detached | 7,464 (85.9%) | 1,229 (14.1%) |
| Single Unit, Attached | 54 (22.1%) | 190 (77.9%) |
| 2 Unit Apartments | 16 (10.9%) | 131 (89.1%) |
| 3 or 4 Unit Apartments | 0 (0.0%) | 289 (100.0%) |
| 5 to 9 Unit Apartments | 0 (0.0%) | 492 (100.0%) |
| 10 or more Apartments | 10 (2.7%) | 365 (97.3%) |
| Mobile Home / Other | 1,810 (82.9%) | 374 (17.1%) |
| Total | 9,354 (75.3%) | 3,070 (24.7%) |
Housing Structures by Number of Rooms in Wythe County
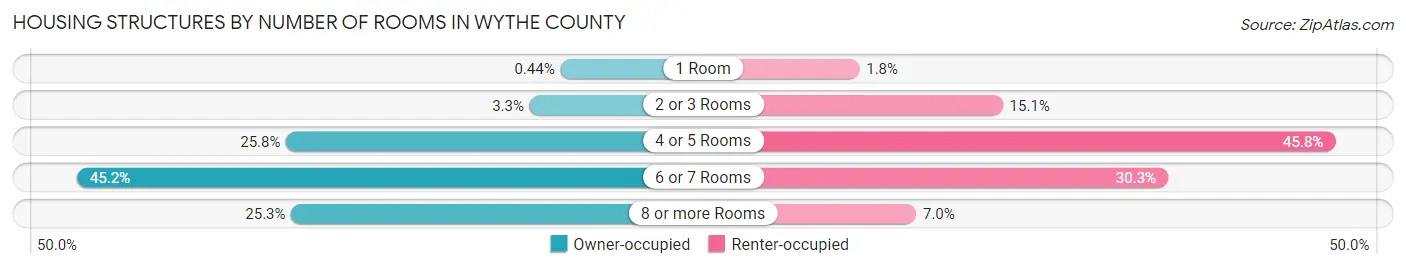
| Number of Rooms | Owner-occupied | Renter-occupied |
| 1 Room | 41 (0.4%) | 55 (1.8%) |
| 2 or 3 Rooms | 307 (3.3%) | 462 (15.0%) |
| 4 or 5 Rooms | 2,413 (25.8%) | 1,406 (45.8%) |
| 6 or 7 Rooms | 4,224 (45.2%) | 931 (30.3%) |
| 8 or more Rooms | 2,369 (25.3%) | 216 (7.0%) |
| Total | 9,354 (100.0%) | 3,070 (100.0%) |
Housing Structure by Heating Type in Wythe County
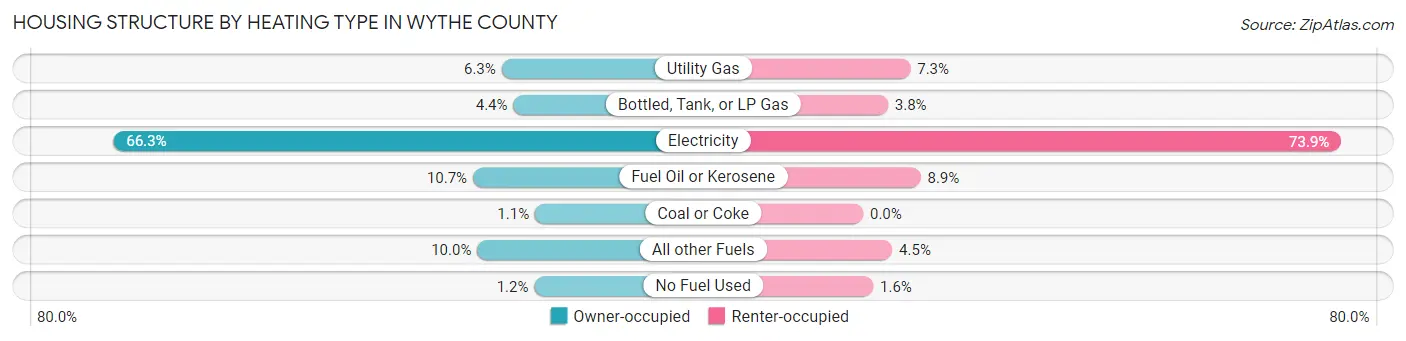
| Heating Type | Owner-occupied | Renter-occupied |
| Utility Gas | 586 (6.3%) | 224 (7.3%) |
| Bottled, Tank, or LP Gas | 415 (4.4%) | 118 (3.8%) |
| Electricity | 6,200 (66.3%) | 2,269 (73.9%) |
| Fuel Oil or Kerosene | 1,000 (10.7%) | 273 (8.9%) |
| Coal or Coke | 103 (1.1%) | 0 (0.0%) |
| All other Fuels | 938 (10.0%) | 138 (4.5%) |
| No Fuel Used | 112 (1.2%) | 48 (1.6%) |
| Total | 9,354 (100.0%) | 3,070 (100.0%) |
Household Vehicle Usage in Wythe County
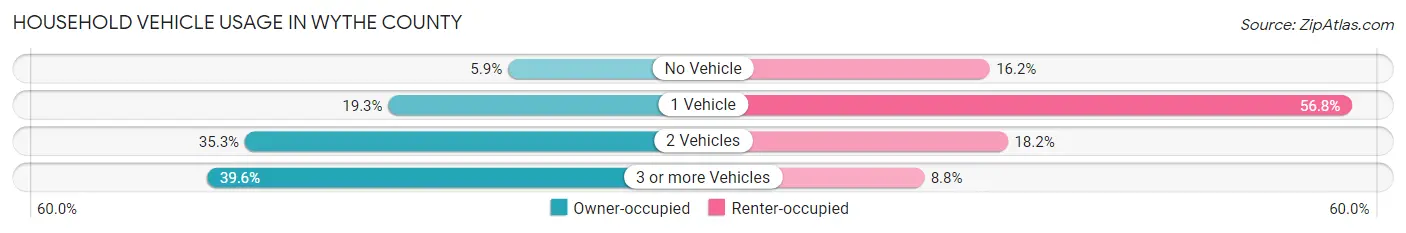
| Vehicles per Household | Owner-occupied | Renter-occupied |
| No Vehicle | 547 (5.9%) | 496 (16.2%) |
| 1 Vehicle | 1,801 (19.3%) | 1,744 (56.8%) |
| 2 Vehicles | 3,304 (35.3%) | 559 (18.2%) |
| 3 or more Vehicles | 3,702 (39.6%) | 271 (8.8%) |
| Total | 9,354 (100.0%) | 3,070 (100.0%) |
Real Estate & Mortgages in Wythe County
Real Estate and Mortgage Overview in Wythe County
| Characteristic | Without Mortgage | With Mortgage |
| Housing Units | 5,364 | 3,990 |
| Median Property Value | $135,900 | $172,700 |
| Median Household Income | $56,022 | $536 |
| Monthly Housing Costs | $342 | $66 |
| Real Estate Taxes | $720 | $37 |
Property Value by Mortgage Status in Wythe County
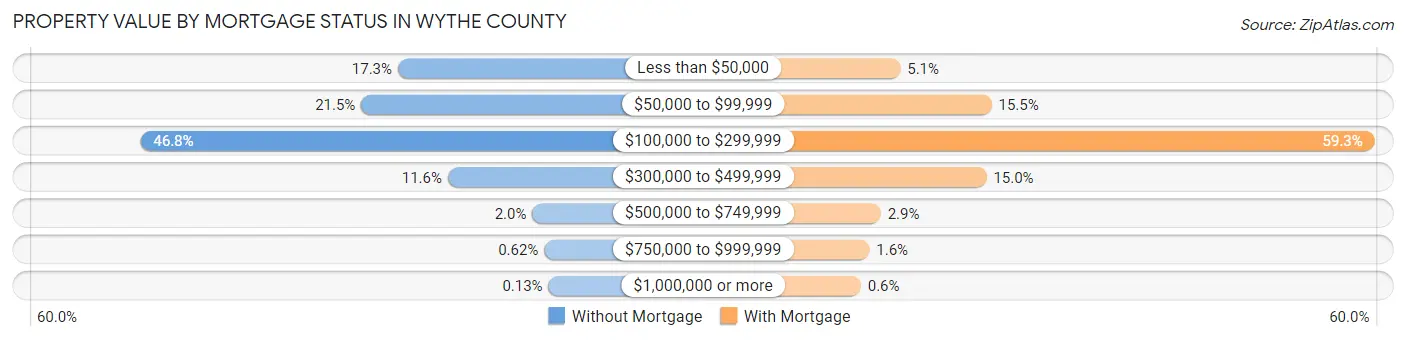
| Property Value | Without Mortgage | With Mortgage |
| Less than $50,000 | 930 (17.3%) | 204 (5.1%) |
| $50,000 to $99,999 | 1,155 (21.5%) | 620 (15.5%) |
| $100,000 to $299,999 | 2,509 (46.8%) | 2,367 (59.3%) |
| $300,000 to $499,999 | 624 (11.6%) | 597 (15.0%) |
| $500,000 to $749,999 | 106 (2.0%) | 115 (2.9%) |
| $750,000 to $999,999 | 33 (0.6%) | 63 (1.6%) |
| $1,000,000 or more | 7 (0.1%) | 24 (0.6%) |
| Total | 5,364 (100.0%) | 3,990 (100.0%) |
Household Income by Mortgage Status in Wythe County
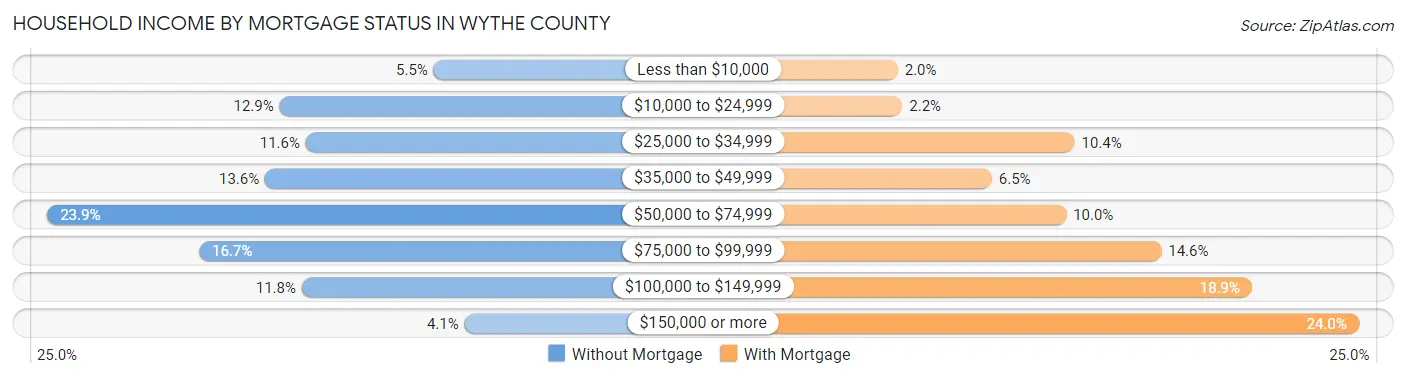
| Household Income | Without Mortgage | With Mortgage |
| Less than $10,000 | 296 (5.5%) | 80 (2.0%) |
| $10,000 to $24,999 | 690 (12.9%) | 89 (2.2%) |
| $25,000 to $34,999 | 623 (11.6%) | 416 (10.4%) |
| $35,000 to $49,999 | 727 (13.6%) | 259 (6.5%) |
| $50,000 to $74,999 | 1,283 (23.9%) | 400 (10.0%) |
| $75,000 to $99,999 | 895 (16.7%) | 581 (14.6%) |
| $100,000 to $149,999 | 633 (11.8%) | 753 (18.9%) |
| $150,000 or more | 217 (4.1%) | 956 (24.0%) |
| Total | 5,364 (100.0%) | 3,990 (100.0%) |
Property Value to Household Income Ratio in Wythe County
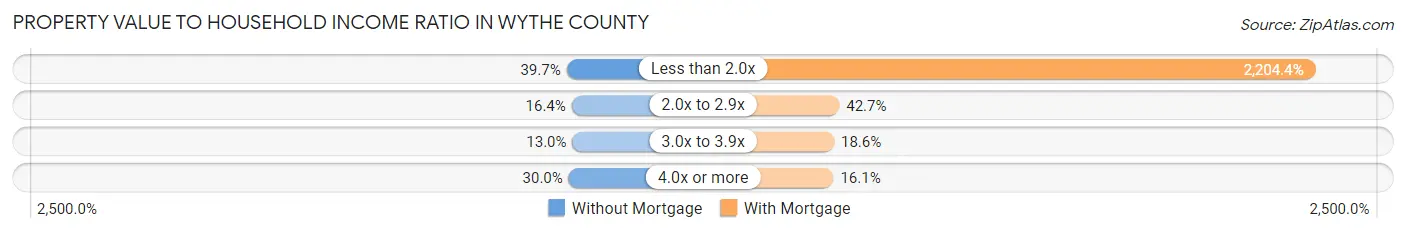
| Value-to-Income Ratio | Without Mortgage | With Mortgage |
| Less than 2.0x | 2,129 (39.7%) | 87,955 (2,204.4%) |
| 2.0x to 2.9x | 880 (16.4%) | 1,702 (42.7%) |
| 3.0x to 3.9x | 699 (13.0%) | 740 (18.5%) |
| 4.0x or more | 1,610 (30.0%) | 641 (16.1%) |
| Total | 5,364 (100.0%) | 3,990 (100.0%) |
Real Estate Taxes by Mortgage Status in Wythe County
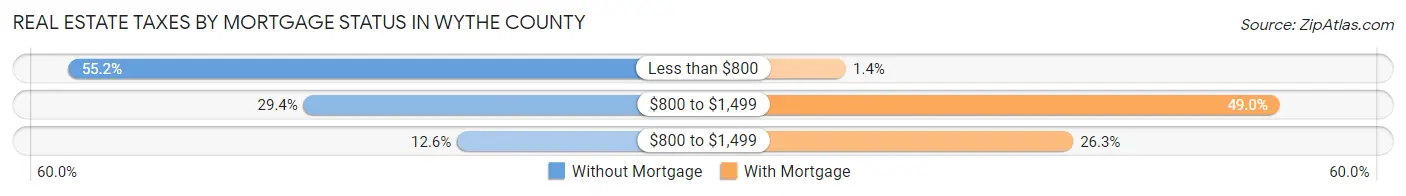
| Property Taxes | Without Mortgage | With Mortgage |
| Less than $800 | 2,959 (55.2%) | 57 (1.4%) |
| $800 to $1,499 | 1,578 (29.4%) | 1,953 (48.9%) |
| $800 to $1,499 | 676 (12.6%) | 1,050 (26.3%) |
| Total | 5,364 (100.0%) | 3,990 (100.0%) |
Health & Disability in Wythe County
Health Insurance Coverage by Age in Wythe County
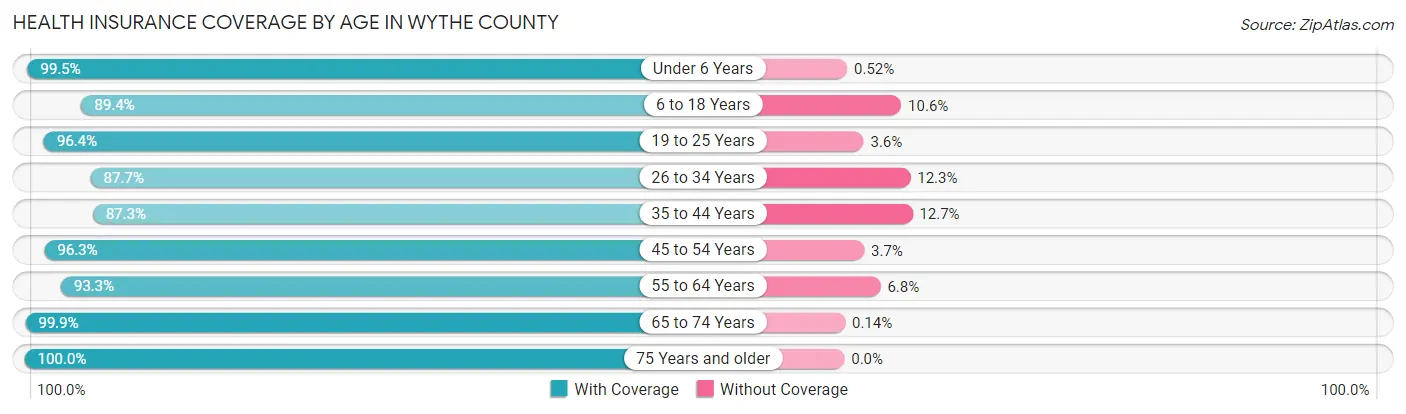
| Age Bracket | With Coverage | Without Coverage |
| Under 6 Years | 1,735 (99.5%) | 9 (0.5%) |
| 6 to 18 Years | 3,611 (89.4%) | 428 (10.6%) |
| 19 to 25 Years | 2,017 (96.4%) | 75 (3.6%) |
| 26 to 34 Years | 2,304 (87.7%) | 323 (12.3%) |
| 35 to 44 Years | 2,850 (87.3%) | 415 (12.7%) |
| 45 to 54 Years | 3,941 (96.3%) | 151 (3.7%) |
| 55 to 64 Years | 3,964 (93.2%) | 287 (6.8%) |
| 65 to 74 Years | 3,551 (99.9%) | 5 (0.1%) |
| 75 Years and older | 2,437 (100.0%) | 0 (0.0%) |
| Total | 26,410 (94.0%) | 1,693 (6.0%) |
Health Insurance Coverage by Citizenship Status in Wythe County
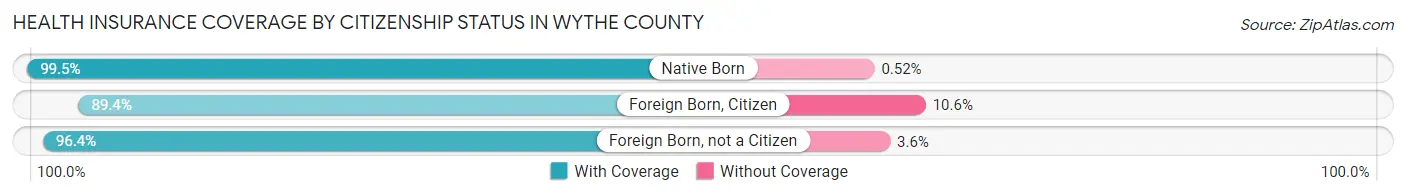
| Citizenship Status | With Coverage | Without Coverage |
| Native Born | 1,735 (99.5%) | 9 (0.5%) |
| Foreign Born, Citizen | 3,611 (89.4%) | 428 (10.6%) |
| Foreign Born, not a Citizen | 2,017 (96.4%) | 75 (3.6%) |
Health Insurance Coverage by Household Income in Wythe County
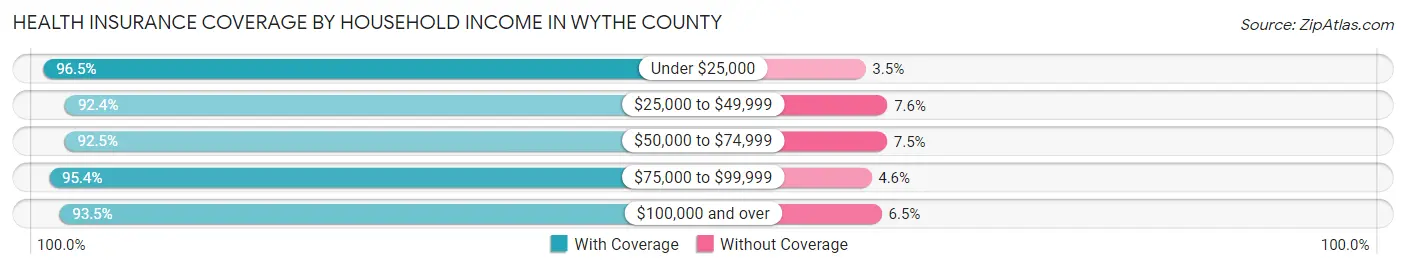
| Household Income | With Coverage | Without Coverage |
| Under $25,000 | 4,842 (96.5%) | 175 (3.5%) |
| $25,000 to $49,999 | 4,924 (92.4%) | 403 (7.6%) |
| $50,000 to $74,999 | 4,660 (92.5%) | 378 (7.5%) |
| $75,000 to $99,999 | 5,295 (95.4%) | 255 (4.6%) |
| $100,000 and over | 6,656 (93.5%) | 464 (6.5%) |
Public vs Private Health Insurance Coverage by Age in Wythe County
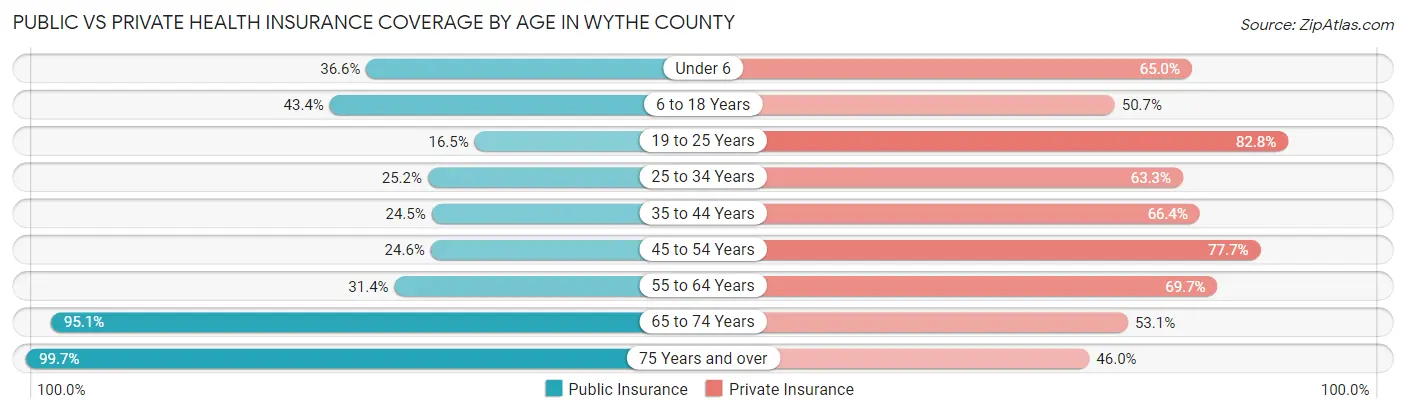
| Age Bracket | Public Insurance | Private Insurance |
| Under 6 | 638 (36.6%) | 1,133 (65.0%) |
| 6 to 18 Years | 1,752 (43.4%) | 2,047 (50.7%) |
| 19 to 25 Years | 345 (16.5%) | 1,733 (82.8%) |
| 25 to 34 Years | 661 (25.2%) | 1,663 (63.3%) |
| 35 to 44 Years | 799 (24.5%) | 2,169 (66.4%) |
| 45 to 54 Years | 1,008 (24.6%) | 3,179 (77.7%) |
| 55 to 64 Years | 1,333 (31.4%) | 2,964 (69.7%) |
| 65 to 74 Years | 3,382 (95.1%) | 1,889 (53.1%) |
| 75 Years and over | 2,430 (99.7%) | 1,120 (46.0%) |
| Total | 12,348 (43.9%) | 17,897 (63.7%) |
Disability Status by Sex by Age in Wythe County
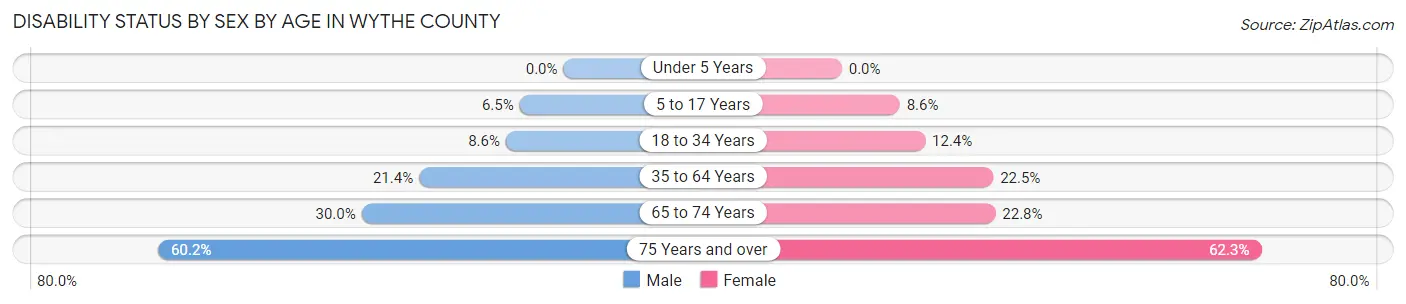
| Age Bracket | Male | Female |
| Under 5 Years | 0 (0.0%) | 0 (0.0%) |
| 5 to 17 Years | 141 (6.5%) | 165 (8.6%) |
| 18 to 34 Years | 220 (8.6%) | 305 (12.4%) |
| 35 to 64 Years | 1,232 (21.4%) | 1,318 (22.5%) |
| 65 to 74 Years | 507 (30.0%) | 425 (22.8%) |
| 75 Years and over | 629 (60.2%) | 867 (62.3%) |
Disability Class by Sex by Age in Wythe County
Disability Class: Hearing Difficulty
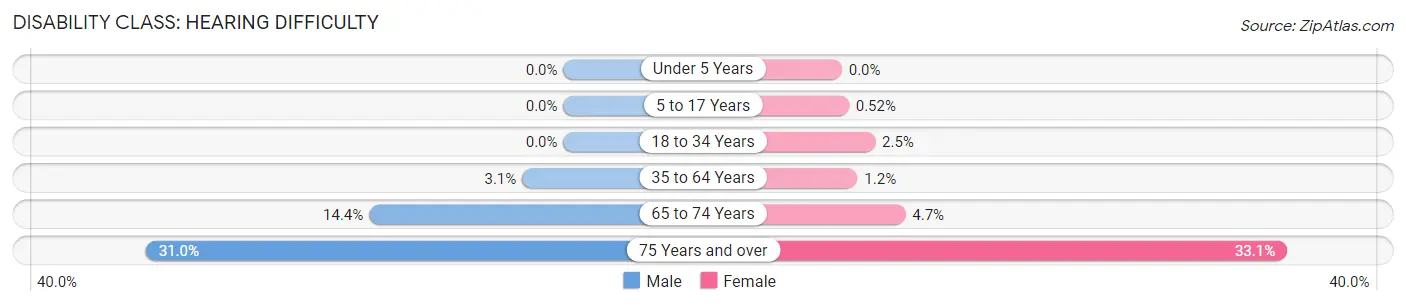
| Age Bracket | Male | Female |
| Under 5 Years | 0 (0.0%) | 0 (0.0%) |
| 5 to 17 Years | 0 (0.0%) | 10 (0.5%) |
| 18 to 34 Years | 0 (0.0%) | 61 (2.5%) |
| 35 to 64 Years | 176 (3.1%) | 68 (1.2%) |
| 65 to 74 Years | 244 (14.4%) | 88 (4.7%) |
| 75 Years and over | 324 (31.0%) | 460 (33.1%) |
Disability Class: Vision Difficulty
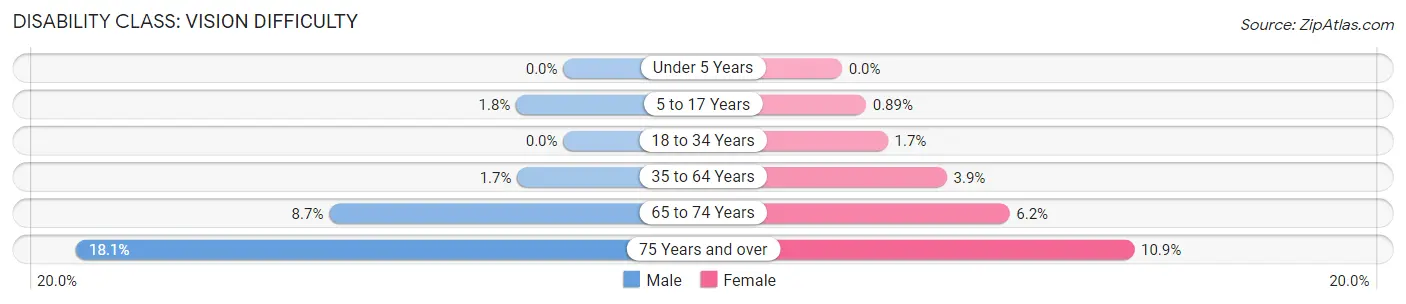
| Age Bracket | Male | Female |
| Under 5 Years | 0 (0.0%) | 0 (0.0%) |
| 5 to 17 Years | 38 (1.8%) | 17 (0.9%) |
| 18 to 34 Years | 0 (0.0%) | 42 (1.7%) |
| 35 to 64 Years | 98 (1.7%) | 228 (3.9%) |
| 65 to 74 Years | 147 (8.7%) | 116 (6.2%) |
| 75 Years and over | 189 (18.1%) | 151 (10.8%) |
Disability Class: Cognitive Difficulty
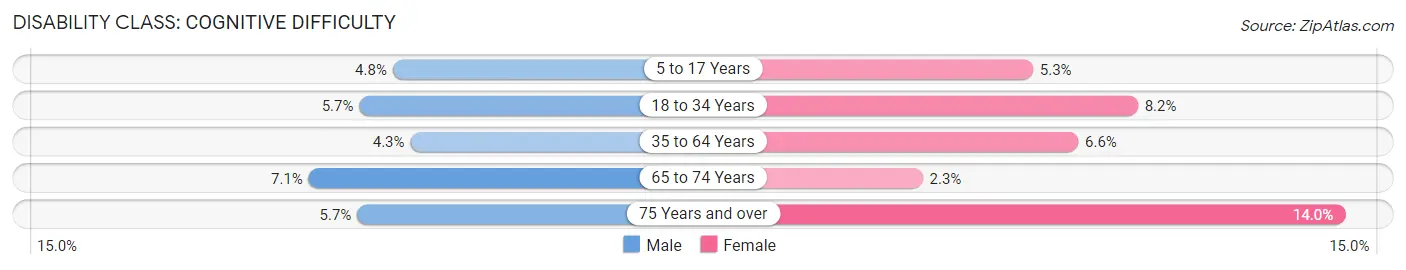
| Age Bracket | Male | Female |
| 5 to 17 Years | 103 (4.8%) | 102 (5.3%) |
| 18 to 34 Years | 146 (5.7%) | 203 (8.2%) |
| 35 to 64 Years | 245 (4.3%) | 386 (6.6%) |
| 65 to 74 Years | 120 (7.1%) | 42 (2.2%) |
| 75 Years and over | 60 (5.7%) | 195 (14.0%) |
Disability Class: Ambulatory Difficulty
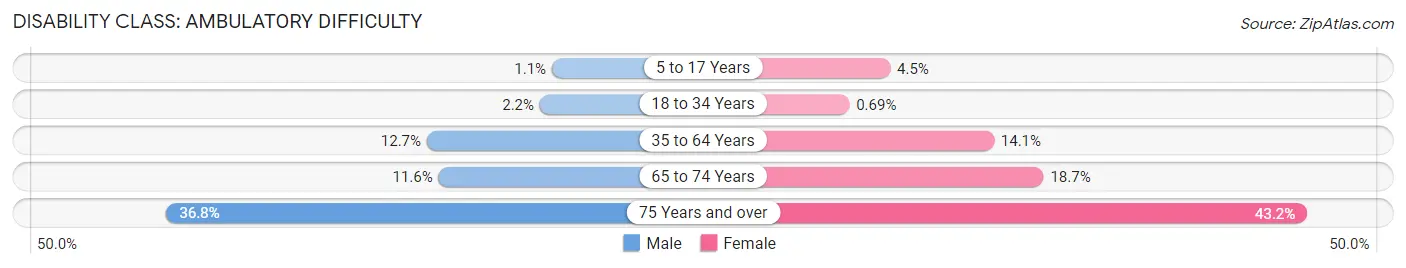
| Age Bracket | Male | Female |
| 5 to 17 Years | 23 (1.1%) | 86 (4.5%) |
| 18 to 34 Years | 56 (2.2%) | 17 (0.7%) |
| 35 to 64 Years | 728 (12.7%) | 827 (14.1%) |
| 65 to 74 Years | 196 (11.6%) | 349 (18.7%) |
| 75 Years and over | 385 (36.8%) | 601 (43.2%) |
Disability Class: Self-Care Difficulty
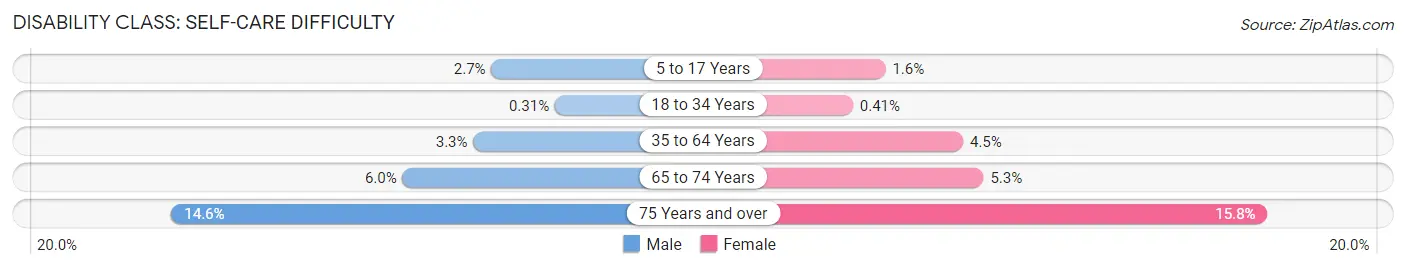
| Age Bracket | Male | Female |
| 5 to 17 Years | 58 (2.7%) | 31 (1.6%) |
| 18 to 34 Years | 8 (0.3%) | 10 (0.4%) |
| 35 to 64 Years | 192 (3.3%) | 264 (4.5%) |
| 65 to 74 Years | 101 (6.0%) | 98 (5.3%) |
| 75 Years and over | 152 (14.5%) | 220 (15.8%) |
Technology Access in Wythe County
Computing Device Access in Wythe County
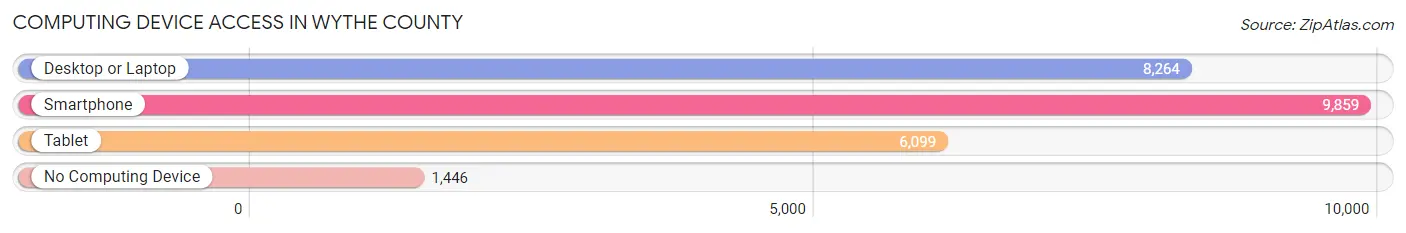
| Device Type | # Households | % Households |
| Desktop or Laptop | 8,264 | 66.5% |
| Smartphone | 9,859 | 79.3% |
| Tablet | 6,099 | 49.1% |
| No Computing Device | 1,446 | 11.6% |
| Total | 12,424 | 100.0% |
Internet Access in Wythe County
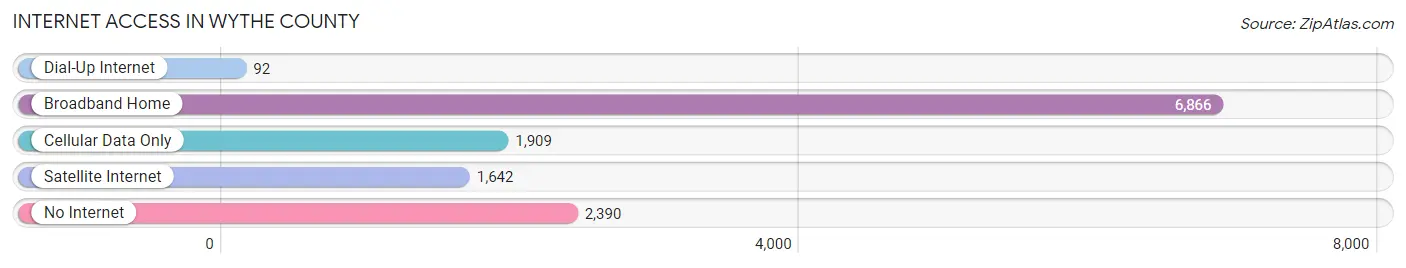
| Internet Type | # Households | % Households |
| Dial-Up Internet | 92 | 0.7% |
| Broadband Home | 6,866 | 55.3% |
| Cellular Data Only | 1,909 | 15.4% |
| Satellite Internet | 1,642 | 13.2% |
| No Internet | 2,390 | 19.2% |
| Total | 12,424 | 100.0% |
Wythe County Summary
Wythe County is located in the southwestern part of the Commonwealth of Virginia. It is bordered by Bland, Carroll, Grayson, Smyth, and Pulaski counties in Virginia, and by Tazewell County in West Virginia. Wythe County is part of the Blue Ridge Mountains region of Virginia and is home to the Appalachian Trail.
History
Wythe County was formed in 1790 from Montgomery County. It was named for George Wythe, a signer of the Declaration of Independence and a professor of law at the College of William and Mary. Wythe County was the birthplace of Thomas J. Jackson, a Confederate general during the Civil War.
The county was home to several Native American tribes, including the Monacan, Shawnee, and Cherokee. The first European settlers arrived in the area in the late 1700s. The county was largely agricultural until the late 1800s, when the railroad arrived and the county began to industrialize.
Geography
Wythe County covers an area of 441 square miles and is located in the Blue Ridge Mountains region of Virginia. The county is home to several mountain peaks, including Brushy Mountain (3,890 feet), Big Walker Mountain (3,845 feet), and Little Walker Mountain (3,735 feet). The county is also home to several rivers, including the New River, the Little River, and the Big Walker River.
The county has a humid subtropical climate, with hot, humid summers and mild winters. The average annual temperature is 57°F, and the average annual precipitation is 43 inches.
Economy
Wythe County has a diverse economy, with industries such as manufacturing, agriculture, and tourism. The county is home to several large employers, including Wytheville Community College, Wythe County Public Schools, and Wythe County Hospital.
The county is also home to several tourist attractions, including the Wytheville Historic District, the Wytheville Motor Speedway, and the Wytheville Arts and Crafts Center.
Demographics
As of the 2010 census, Wythe County had a population of 29,235. The racial makeup of the county was 92.3% White, 4.3% Black or African American, 0.4% Native American, 0.7% Asian, 0.1% Pacific Islander, 1.2% from other races, and 1.1% from two or more races. Hispanic or Latino of any race were 2.7% of the population.
The median household income in Wythe County was $37,945, and the median family income was $45,945. The per capita income was $20,845. About 14.3% of the population was below the poverty line.
Common Questions
What is Per Capita Income in Wythe County?
Per Capita income in Wythe County is $31,810.
What is the Median Family Income in Wythe County?
Median Family Income in Wythe County is $72,828.
What is the Median Household income in Wythe County?
Median Household Income in Wythe County is $53,921.
What is Income or Wage Gap in Wythe County?
Income or Wage Gap in Wythe County is 29.4%.
Women in Wythe County earn 70.6 cents for every dollar earned by a man.
What is Family Income Deficit in Wythe County?
Family Income Deficit in Wythe County is $12,746.
Families that are below poverty line in Wythe County earn $12,746 less on average than the poverty threshold level.
What is Inequality or Gini Index in Wythe County?
Inequality or Gini Index in Wythe County is 0.47.
What is the Total Population of Wythe County?
Total Population of Wythe County is 28,275.
What is the Total Male Population of Wythe County?
Total Male Population of Wythe County is 13,968.
What is the Total Female Population of Wythe County?
Total Female Population of Wythe County is 14,307.
What is the Ratio of Males per 100 Females in Wythe County?
There are 97.63 Males per 100 Females in Wythe County.
What is the Ratio of Females per 100 Males in Wythe County?
There are 102.43 Females per 100 Males in Wythe County.
What is the Median Population Age in Wythe County?
Median Population Age in Wythe County is 45.6 Years.
What is the Average Family Size in Wythe County
Average Family Size in Wythe County is 2.8 People.
What is the Average Household Size in Wythe County
Average Household Size in Wythe County is 2.3 People.
How Large is the Labor Force in Wythe County?
There are 13,317 People in the Labor Forcein in Wythe County.
What is the Percentage of People in the Labor Force in Wythe County?
56.3% of People are in the Labor Force in Wythe County.
What is the Unemployment Rate in Wythe County?
Unemployment Rate in Wythe County is 5.2%.