Wise County, VA Map & Demographics
Wise County Map
Wise County Overview
$23,702
PER CAPITA INCOME
$57,953
AVG FAMILY INCOME
$47,541
AVG HOUSEHOLD INCOME
29.8%
WAGE / INCOME GAP [ % ]
70.2¢/ $1
WAGE / INCOME GAP [ $ ]
$9,964
FAMILY INCOME DEFICIT
0.43
INEQUALITY / GINI INDEX
36,105
TOTAL POPULATION
18,850
MALE POPULATION
17,255
FEMALE POPULATION
109.24
MALES / 100 FEMALES
91.54
FEMALES / 100 MALES
42.0
MEDIAN AGE
2.9
AVG FAMILY SIZE
2.4
AVG HOUSEHOLD SIZE
13,946
LABOR FORCE [ PEOPLE ]
46.4%
PERCENT IN LABOR FORCE
9.1%
UNEMPLOYMENT RATE
Wise County Area Codes
Income in Wise County
Income Overview in Wise County
Per Capita Income in Wise County is $23,702, while median incomes of families and households are $57,953 and $47,541 respectively.
| Characteristic | Number | Measure |
| Per Capita Income | 36,105 | $23,702 |
| Median Family Income | 9,488 | $57,953 |
| Mean Family Income | 9,488 | $69,231 |
| Median Household Income | 14,052 | $47,541 |
| Mean Household Income | 14,052 | $58,817 |
| Income Deficit | 9,488 | $9,964 |
| Wage / Income Gap (%) | 36,105 | 29.78% |
| Wage / Income Gap ($) | 36,105 | 70.22¢ per $1 |
| Gini / Inequality Index | 36,105 | 0.43 |
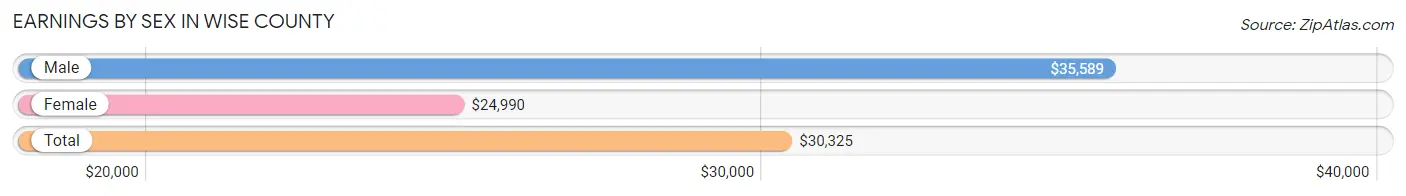
Earnings by Sex in Wise County
Average Earnings in Wise County are $30,325, $35,589 for men and $24,990 for women, a difference of 29.8%.
| Sex | Number | Average Earnings |
| Male | 8,584 (54.8%) | $35,589 |
| Female | 7,090 (45.2%) | $24,990 |
| Total | 15,674 (100.0%) | $30,325 |
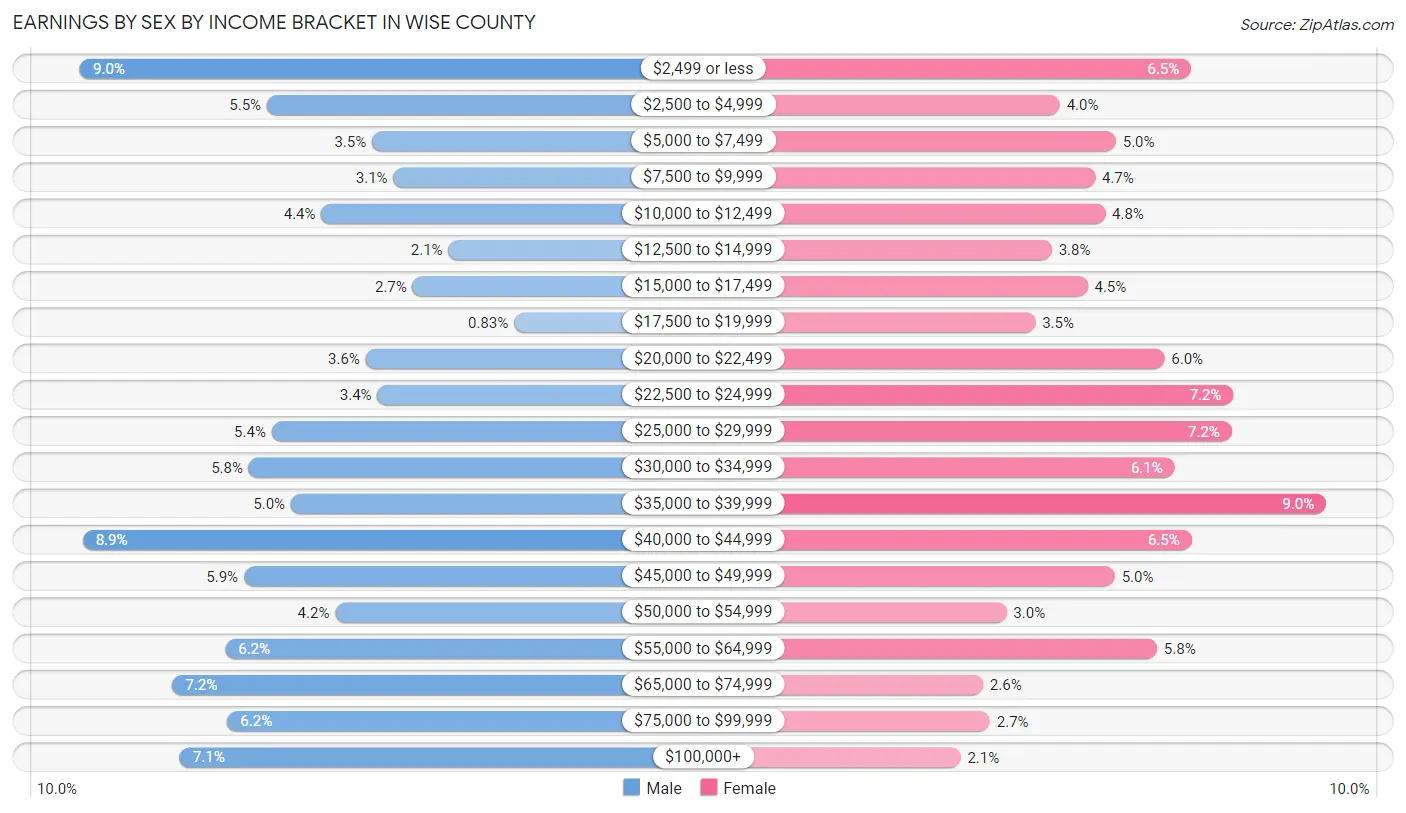
Earnings by Sex by Income Bracket in Wise County
The most common earnings brackets in Wise County are $2,499 or less for men (769 | 9.0%) and $35,000 to $39,999 for women (637 | 9.0%).
| Income | Male | Female |
| $2,499 or less | 769 (9.0%) | 457 (6.5%) |
| $2,500 to $4,999 | 469 (5.5%) | 283 (4.0%) |
| $5,000 to $7,499 | 300 (3.5%) | 357 (5.0%) |
| $7,500 to $9,999 | 265 (3.1%) | 330 (4.6%) |
| $10,000 to $12,499 | 381 (4.4%) | 343 (4.8%) |
| $12,500 to $14,999 | 177 (2.1%) | 272 (3.8%) |
| $15,000 to $17,499 | 234 (2.7%) | 320 (4.5%) |
| $17,500 to $19,999 | 71 (0.8%) | 250 (3.5%) |
| $20,000 to $22,499 | 310 (3.6%) | 422 (5.9%) |
| $22,500 to $24,999 | 291 (3.4%) | 513 (7.2%) |
| $25,000 to $29,999 | 461 (5.4%) | 511 (7.2%) |
| $30,000 to $34,999 | 498 (5.8%) | 435 (6.1%) |
| $35,000 to $39,999 | 430 (5.0%) | 637 (9.0%) |
| $40,000 to $44,999 | 765 (8.9%) | 458 (6.5%) |
| $45,000 to $49,999 | 506 (5.9%) | 356 (5.0%) |
| $50,000 to $54,999 | 359 (4.2%) | 212 (3.0%) |
| $55,000 to $64,999 | 536 (6.2%) | 412 (5.8%) |
| $65,000 to $74,999 | 621 (7.2%) | 181 (2.5%) |
| $75,000 to $99,999 | 532 (6.2%) | 190 (2.7%) |
| $100,000+ | 609 (7.1%) | 151 (2.1%) |
| Total | 8,584 (100.0%) | 7,090 (100.0%) |
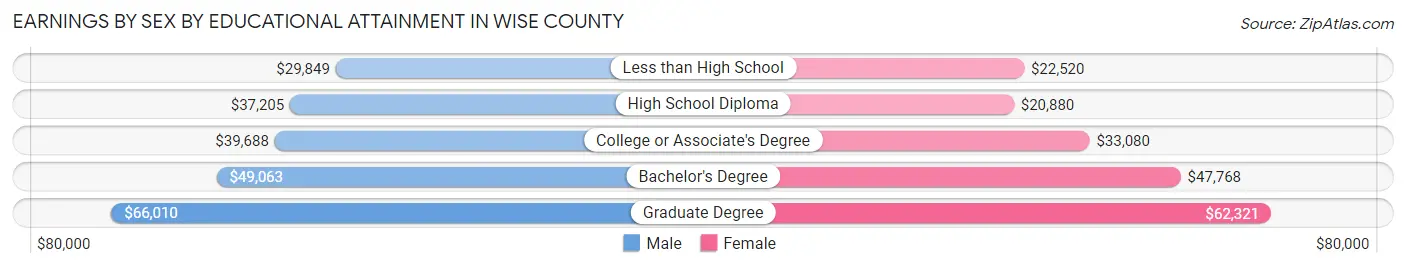
Earnings by Sex by Educational Attainment in Wise County
Average earnings in Wise County are $41,948 for men and $32,324 for women, a difference of 22.9%. Men with an educational attainment of graduate degree enjoy the highest average annual earnings of $66,010, while those with less than high school education earn the least with $29,849. Women with an educational attainment of graduate degree earn the most with the average annual earnings of $62,321, while those with high school diploma education have the smallest earnings of $20,880.
| Educational Attainment | Male Income | Female Income |
| Less than High School | $29,849 | $22,520 |
| High School Diploma | $37,205 | $20,880 |
| College or Associate's Degree | $39,688 | $33,080 |
| Bachelor's Degree | $49,063 | $47,768 |
| Graduate Degree | $66,010 | $62,321 |
| Total | $41,948 | $32,324 |
Family Income in Wise County
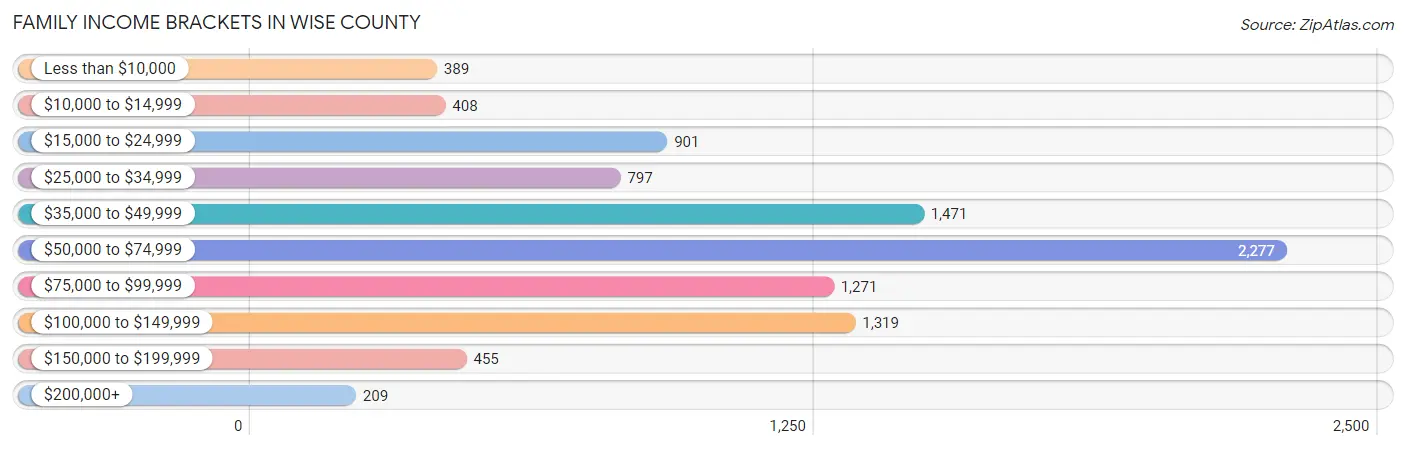
Family Income Brackets in Wise County
According to the Wise County family income data, there are 2,277 families falling into the $50,000 to $74,999 income range, which is the most common income bracket and makes up 24.0% of all families. Conversely, the $200,000+ income bracket is the least frequent group with only 209 families (2.2%) belonging to this category.
| Income Bracket | # Families | % Families |
| Less than $10,000 | 389 | 4.1% |
| $10,000 to $14,999 | 408 | 4.3% |
| $15,000 to $24,999 | 901 | 9.5% |
| $25,000 to $34,999 | 797 | 8.4% |
| $35,000 to $49,999 | 1,471 | 15.5% |
| $50,000 to $74,999 | 2,277 | 24.0% |
| $75,000 to $99,999 | 1,271 | 13.4% |
| $100,000 to $149,999 | 1,319 | 13.9% |
| $150,000 to $199,999 | 455 | 4.8% |
| $200,000+ | 209 | 2.2% |
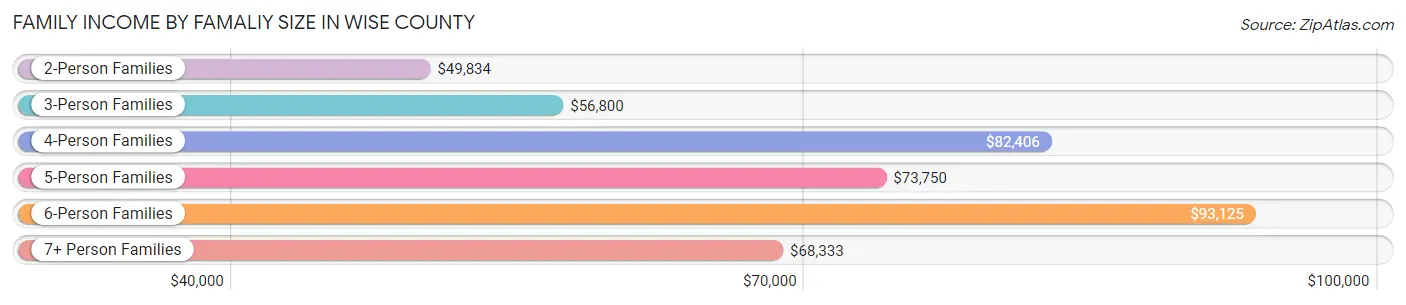
Family Income by Famaliy Size in Wise County
6-person families (191 | 2.0%) account for the highest median family income in Wise County with $93,125 per family, while 2-person families (4,791 | 50.5%) have the highest median income of $24,917 per family member.
| Income Bracket | # Families | Median Income |
| 2-Person Families | 4,791 (50.5%) | $49,834 |
| 3-Person Families | 2,386 (25.2%) | $56,800 |
| 4-Person Families | 1,546 (16.3%) | $82,406 |
| 5-Person Families | 500 (5.3%) | $73,750 |
| 6-Person Families | 191 (2.0%) | $93,125 |
| 7+ Person Families | 74 (0.8%) | $68,333 |
| Total | 9,488 (100.0%) | $57,953 |
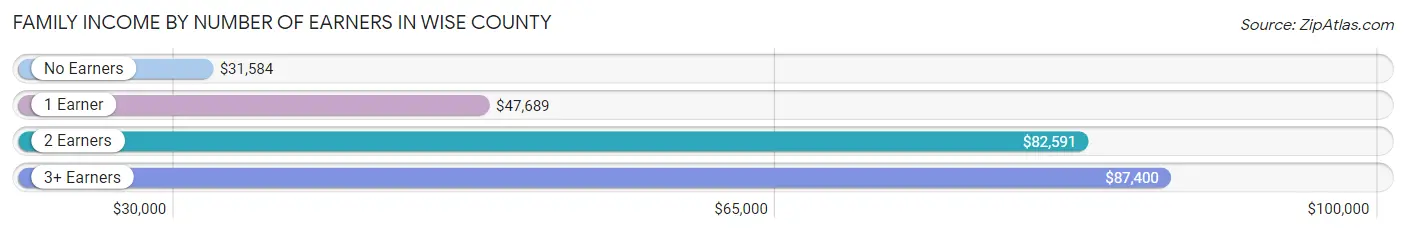
Family Income by Number of Earners in Wise County
The median family income in Wise County is $57,953, with families comprising 3+ earners (757) having the highest median family income of $87,400, while families with no earners (2,655) have the lowest median family income of $31,584, accounting for 8.0% and 28.0% of families, respectively.
| Number of Earners | # Families | Median Income |
| No Earners | 2,655 (28.0%) | $31,584 |
| 1 Earner | 2,927 (30.8%) | $47,689 |
| 2 Earners | 3,149 (33.2%) | $82,591 |
| 3+ Earners | 757 (8.0%) | $87,400 |
| Total | 9,488 (100.0%) | $57,953 |
Household Income in Wise County
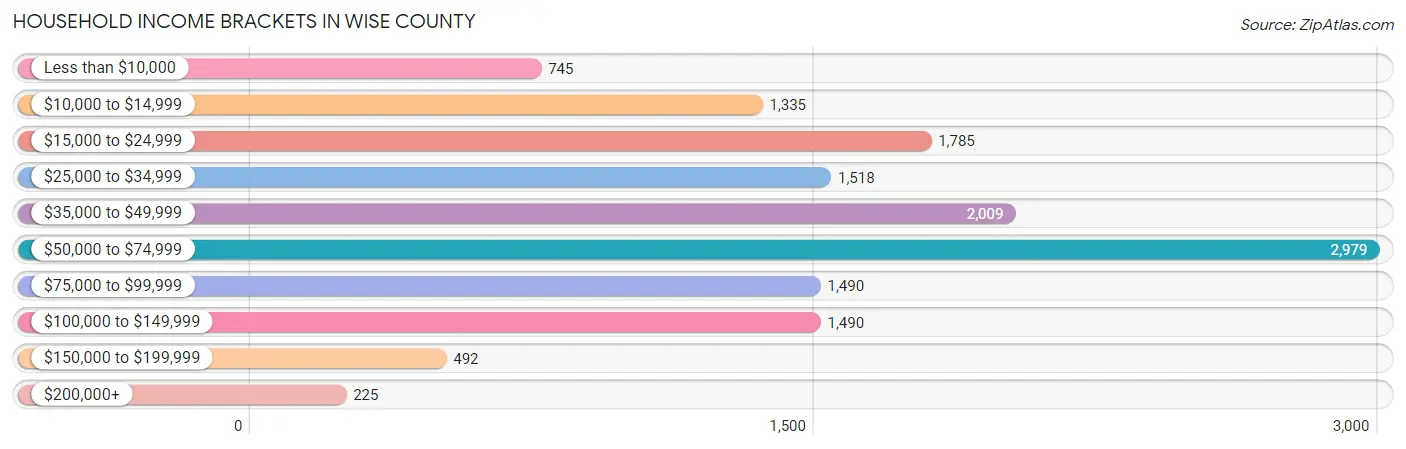
Household Income Brackets in Wise County
With 2,979 households falling in the category, the $50,000 to $74,999 income range is the most frequent in Wise County, accounting for 21.2% of all households. In contrast, only 225 households (1.6%) fall into the $200,000+ income bracket, making it the least populous group.
| Income Bracket | # Households | % Households |
| Less than $10,000 | 745 | 5.3% |
| $10,000 to $14,999 | 1,335 | 9.5% |
| $15,000 to $24,999 | 1,785 | 12.7% |
| $25,000 to $34,999 | 1,518 | 10.8% |
| $35,000 to $49,999 | 2,009 | 14.3% |
| $50,000 to $74,999 | 2,979 | 21.2% |
| $75,000 to $99,999 | 1,490 | 10.6% |
| $100,000 to $149,999 | 1,490 | 10.6% |
| $150,000 to $199,999 | 492 | 3.5% |
| $200,000+ | 225 | 1.6% |
Household Income by Householder Age in Wise County
The median household income in Wise County is $47,541, with the highest median household income of $59,201 found in the 25 to 44 years age bracket for the primary householder. A total of 3,671 households (26.1%) fall into this category. Meanwhile, the 65+ years age bracket for the primary householder has the lowest median household income of $33,947, with 4,339 households (30.9%) in this group.
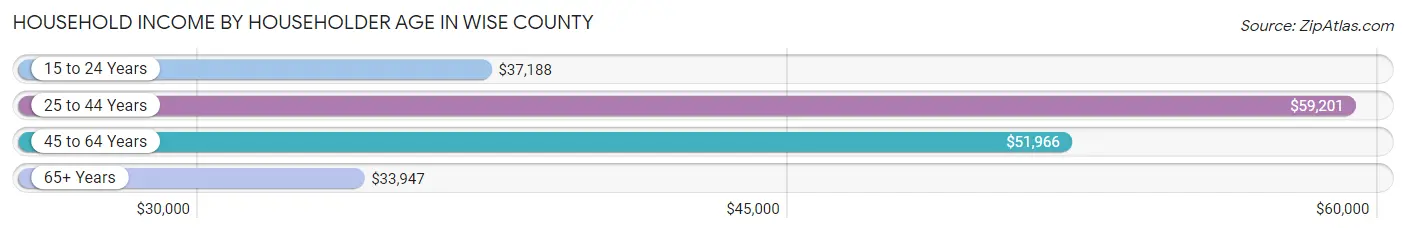
| Income Bracket | # Households | Median Income |
| 15 to 24 Years | 614 (4.4%) | $37,188 |
| 25 to 44 Years | 3,671 (26.1%) | $59,201 |
| 45 to 64 Years | 5,428 (38.6%) | $51,966 |
| 65+ Years | 4,339 (30.9%) | $33,947 |
| Total | 14,052 (100.0%) | $47,541 |
Poverty in Wise County
Income Below Poverty by Sex and Age in Wise County
With 17.9% poverty level for males and 21.9% for females among the residents of Wise County, under 5 year old males and 15 year old females are the most vulnerable to poverty, with 262 males (31.6%) and 99 females (51.6%) in their respective age groups living below the poverty level.
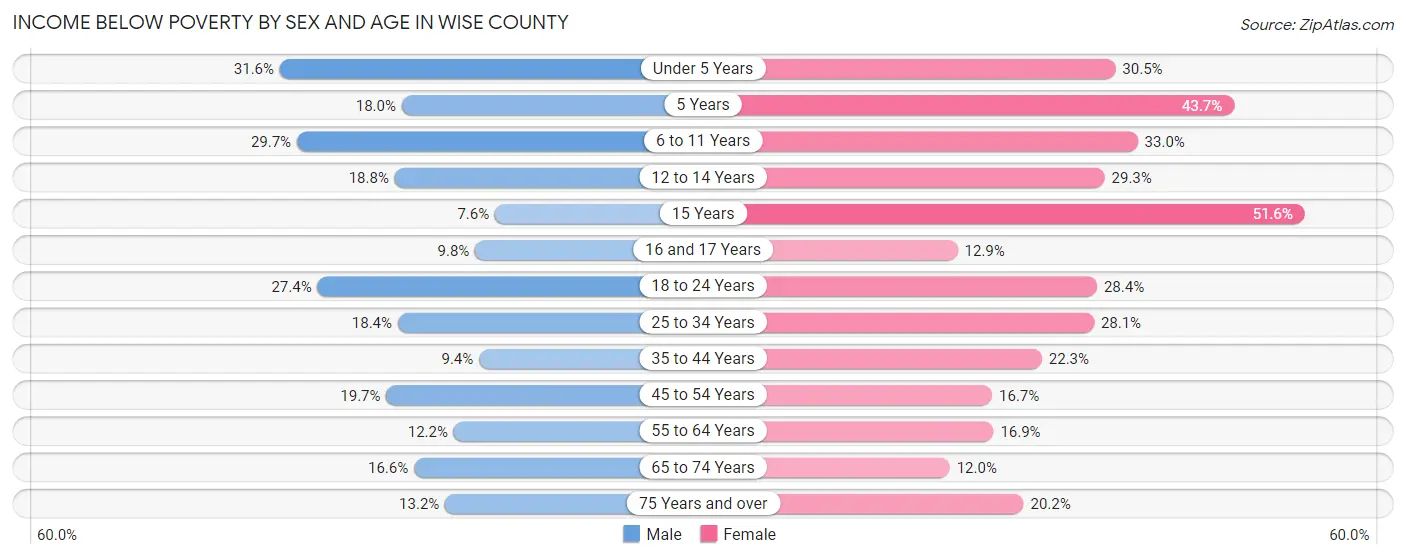
| Age Bracket | Male | Female |
| Under 5 Years | 262 (31.6%) | 234 (30.5%) |
| 5 Years | 52 (18.0%) | 45 (43.7%) |
| 6 to 11 Years | 300 (29.7%) | 377 (33.0%) |
| 12 to 14 Years | 120 (18.8%) | 197 (29.3%) |
| 15 Years | 21 (7.6%) | 99 (51.6%) |
| 16 and 17 Years | 33 (9.8%) | 61 (12.9%) |
| 18 to 24 Years | 402 (27.4%) | 339 (28.4%) |
| 25 to 34 Years | 352 (18.4%) | 536 (28.1%) |
| 35 to 44 Years | 185 (9.4%) | 457 (22.3%) |
| 45 to 54 Years | 449 (19.7%) | 382 (16.7%) |
| 55 to 64 Years | 286 (12.2%) | 411 (16.9%) |
| 65 to 74 Years | 341 (16.6%) | 264 (12.0%) |
| 75 Years and over | 139 (13.2%) | 268 (20.2%) |
| Total | 2,942 (17.9%) | 3,670 (21.9%) |
Income Above Poverty by Sex and Age in Wise County
According to the poverty statistics in Wise County, males aged 15 years and females aged 65 to 74 years are the age groups that are most secure financially, with 92.4% of males and 88.0% of females in these age groups living above the poverty line.
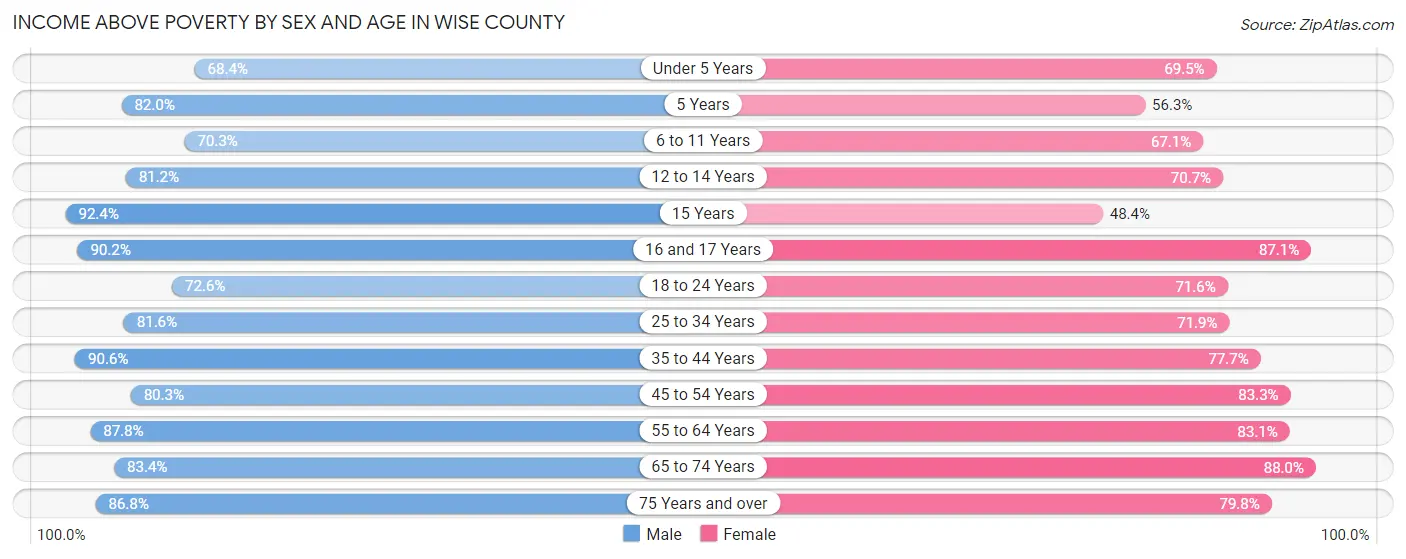
| Age Bracket | Male | Female |
| Under 5 Years | 568 (68.4%) | 534 (69.5%) |
| 5 Years | 237 (82.0%) | 58 (56.3%) |
| 6 to 11 Years | 711 (70.3%) | 767 (67.0%) |
| 12 to 14 Years | 519 (81.2%) | 476 (70.7%) |
| 15 Years | 255 (92.4%) | 93 (48.4%) |
| 16 and 17 Years | 303 (90.2%) | 412 (87.1%) |
| 18 to 24 Years | 1,066 (72.6%) | 854 (71.6%) |
| 25 to 34 Years | 1,558 (81.6%) | 1,373 (71.9%) |
| 35 to 44 Years | 1,787 (90.6%) | 1,594 (77.7%) |
| 45 to 54 Years | 1,829 (80.3%) | 1,900 (83.3%) |
| 55 to 64 Years | 2,059 (87.8%) | 2,023 (83.1%) |
| 65 to 74 Years | 1,709 (83.4%) | 1,933 (88.0%) |
| 75 Years and over | 917 (86.8%) | 1,056 (79.8%) |
| Total | 13,518 (82.1%) | 13,073 (78.1%) |
Income Below Poverty Among Married-Couple Families in Wise County
The poverty statistics for married-couple families in Wise County show that 8.0% or 570 of the total 7,103 families live below the poverty line. Families with 3 or 4 children have the highest poverty rate of 10.2%, comprising of 45 families. On the other hand, families with 5 or more children have the lowest poverty rate of 0.0%, which includes 0 families.
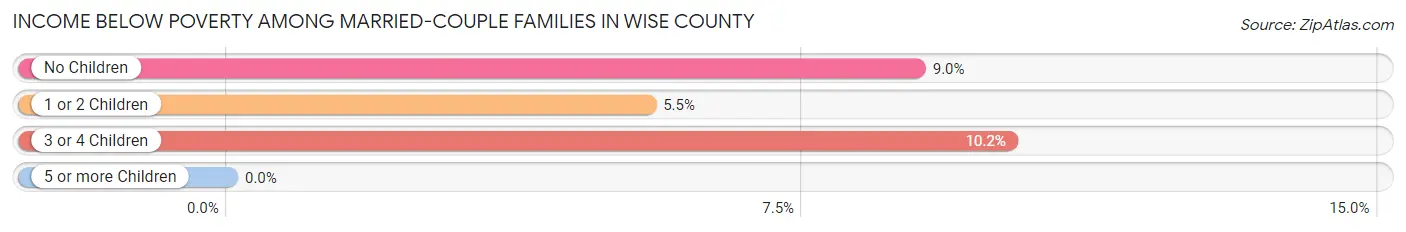
| Children | Above Poverty | Below Poverty |
| No Children | 4,226 (91.0%) | 417 (9.0%) |
| 1 or 2 Children | 1,870 (94.5%) | 108 (5.5%) |
| 3 or 4 Children | 397 (89.8%) | 45 (10.2%) |
| 5 or more Children | 40 (100.0%) | 0 (0.0%) |
| Total | 6,533 (92.0%) | 570 (8.0%) |
Income Below Poverty Among Single-Parent Households in Wise County
According to the poverty data in Wise County, 28.1% or 200 single-father households and 37.0% or 618 single-mother households are living below the poverty line. Among single-father households, those with 3 or 4 children have the highest poverty rate, with 83 households (100.0%) experiencing poverty. Likewise, among single-mother households, those with 5 or more children have the highest poverty rate, with 10 households (100.0%) falling below the poverty line.
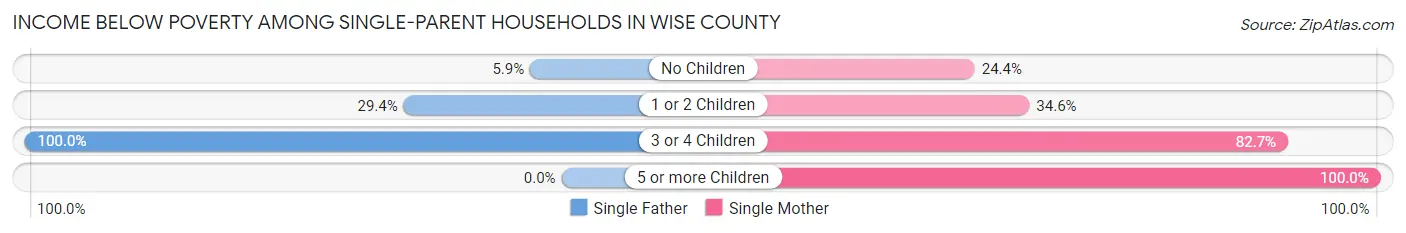
| Children | Single Father | Single Mother |
| No Children | 17 (5.9%) | 115 (24.4%) |
| 1 or 2 Children | 100 (29.4%) | 354 (34.6%) |
| 3 or 4 Children | 83 (100.0%) | 139 (82.7%) |
| 5 or more Children | 0 (0.0%) | 10 (100.0%) |
| Total | 200 (28.1%) | 618 (37.0%) |
Income Below Poverty Among Married-Couple vs Single-Parent Households in Wise County
The poverty data for Wise County shows that 570 of the married-couple family households (8.0%) and 818 of the single-parent households (34.3%) are living below the poverty level. Within the married-couple family households, those with 3 or 4 children have the highest poverty rate, with 45 households (10.2%) falling below the poverty line. Among the single-parent households, those with 5 or more children have the highest poverty rate, with 10 household (100.0%) living below poverty.
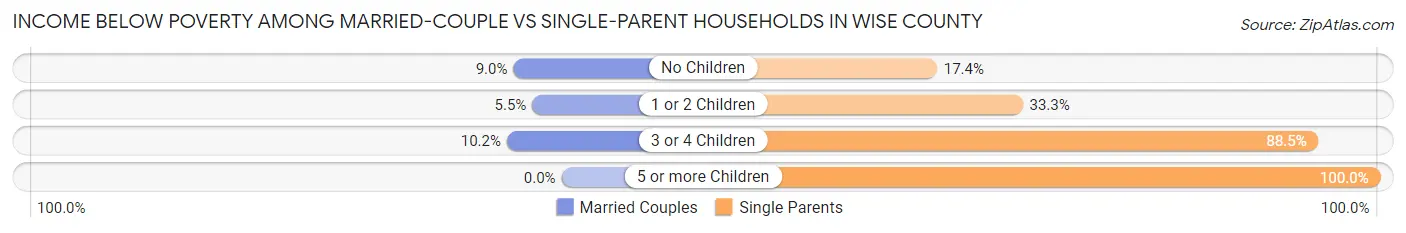
| Children | Married-Couple Families | Single-Parent Households |
| No Children | 417 (9.0%) | 132 (17.3%) |
| 1 or 2 Children | 108 (5.5%) | 454 (33.3%) |
| 3 or 4 Children | 45 (10.2%) | 222 (88.4%) |
| 5 or more Children | 0 (0.0%) | 10 (100.0%) |
| Total | 570 (8.0%) | 818 (34.3%) |
Race in Wise County
The most populous races in Wise County are White / Caucasian (32,896 | 91.1%), Black / African American (1,698 | 4.7%), and Two or more Races (905 | 2.5%).
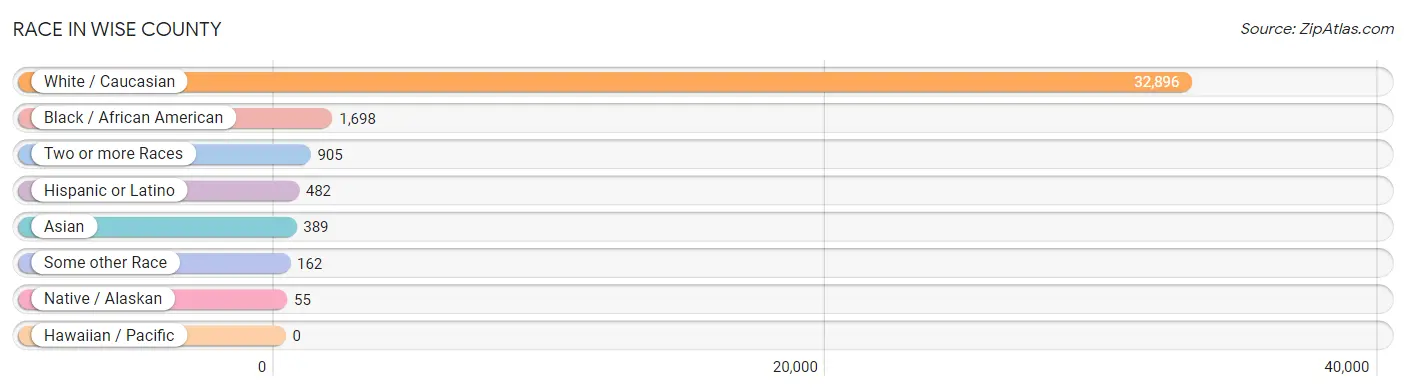
| Race | # Population | % Population |
| Asian | 389 | 1.1% |
| Black / African American | 1,698 | 4.7% |
| Hawaiian / Pacific | 0 | 0.0% |
| Hispanic or Latino | 482 | 1.3% |
| Native / Alaskan | 55 | 0.2% |
| White / Caucasian | 32,896 | 91.1% |
| Two or more Races | 905 | 2.5% |
| Some other Race | 162 | 0.4% |
| Total | 36,105 | 100.0% |
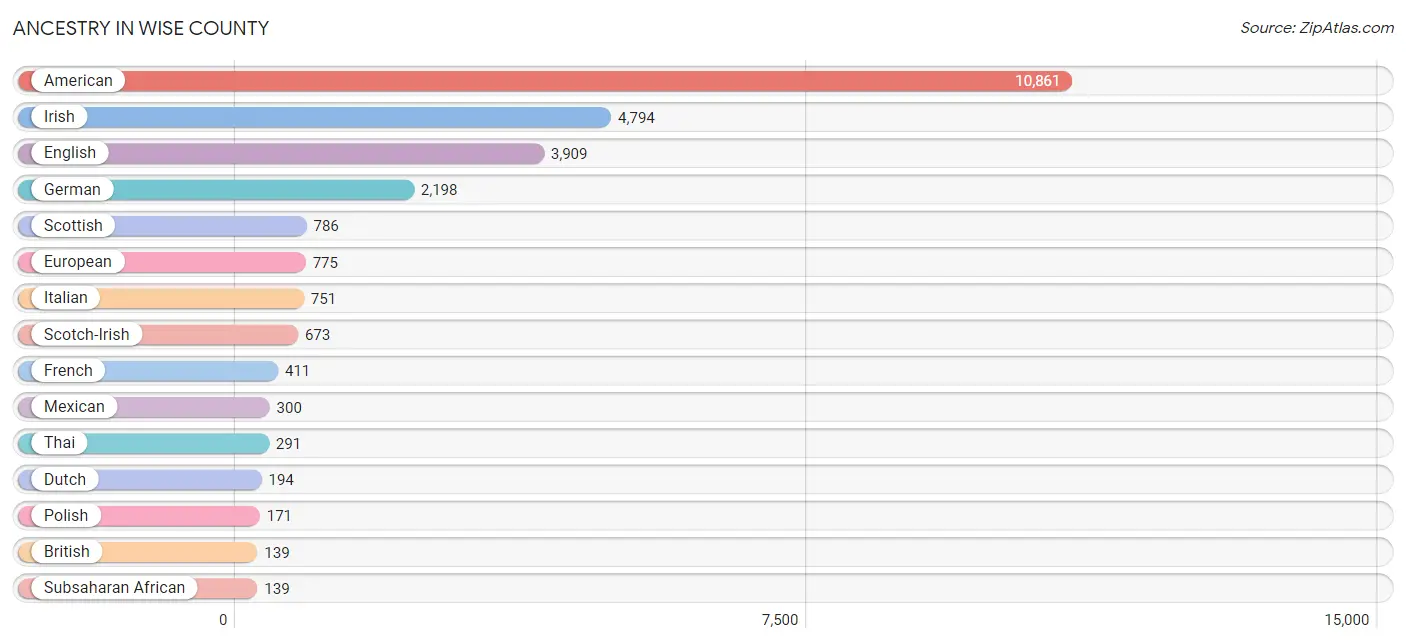
Ancestry in Wise County
The most populous ancestries reported in Wise County are American (10,861 | 30.1%), Irish (4,794 | 13.3%), English (3,909 | 10.8%), German (2,198 | 6.1%), and Scottish (786 | 2.2%), together accounting for 62.5% of all Wise County residents.
| Ancestry | # Population | % Population |
| African | 113 | 0.3% |
| American | 10,861 | 30.1% |
| Arab | 78 | 0.2% |
| Austrian | 31 | 0.1% |
| Blackfeet | 3 | 0.0% |
| Brazilian | 53 | 0.2% |
| British | 139 | 0.4% |
| British West Indian | 10 | 0.0% |
| Burmese | 6 | 0.0% |
| Cajun | 15 | 0.0% |
| Central American | 26 | 0.1% |
| Cherokee | 94 | 0.3% |
| Chippewa | 6 | 0.0% |
| Croatian | 5 | 0.0% |
| Cuban | 24 | 0.1% |
| Dominican | 20 | 0.1% |
| Dutch | 194 | 0.5% |
| Eastern European | 28 | 0.1% |
| English | 3,909 | 10.8% |
| European | 775 | 2.1% |
| Finnish | 37 | 0.1% |
| French | 411 | 1.1% |
| French Canadian | 10 | 0.0% |
| German | 2,198 | 6.1% |
| Greek | 9 | 0.0% |
| Hungarian | 61 | 0.2% |
| Indian (Asian) | 28 | 0.1% |
| Iranian | 38 | 0.1% |
| Irish | 4,794 | 13.3% |
| Italian | 751 | 2.1% |
| Jamaican | 17 | 0.1% |
| Japanese | 2 | 0.0% |
| Korean | 49 | 0.1% |
| Latvian | 4 | 0.0% |
| Lebanese | 8 | 0.0% |
| Lithuanian | 28 | 0.1% |
| Mexican | 300 | 0.8% |
| Mexican American Indian | 2 | 0.0% |
| Moroccan | 53 | 0.2% |
| Nicaraguan | 24 | 0.1% |
| Nigerian | 26 | 0.1% |
| Northern European | 14 | 0.0% |
| Norwegian | 84 | 0.2% |
| Pakistani | 18 | 0.1% |
| Peruvian | 11 | 0.0% |
| Polish | 171 | 0.5% |
| Portuguese | 40 | 0.1% |
| Puerto Rican | 23 | 0.1% |
| Romanian | 26 | 0.1% |
| Russian | 13 | 0.0% |
| Salvadoran | 2 | 0.0% |
| Scandinavian | 28 | 0.1% |
| Scotch-Irish | 673 | 1.9% |
| Scottish | 786 | 2.2% |
| Seminole | 26 | 0.1% |
| Sioux | 21 | 0.1% |
| South American | 11 | 0.0% |
| Spaniard | 51 | 0.1% |
| Spanish | 4 | 0.0% |
| Sri Lankan | 11 | 0.0% |
| Subsaharan African | 139 | 0.4% |
| Swedish | 24 | 0.1% |
| Syrian | 17 | 0.1% |
| Thai | 291 | 0.8% |
| U.S. Virgin Islander | 14 | 0.0% |
| Ukrainian | 23 | 0.1% |
| Vietnamese | 14 | 0.0% |
| Welsh | 103 | 0.3% | View All 68 Rows |
Immigrants in Wise County
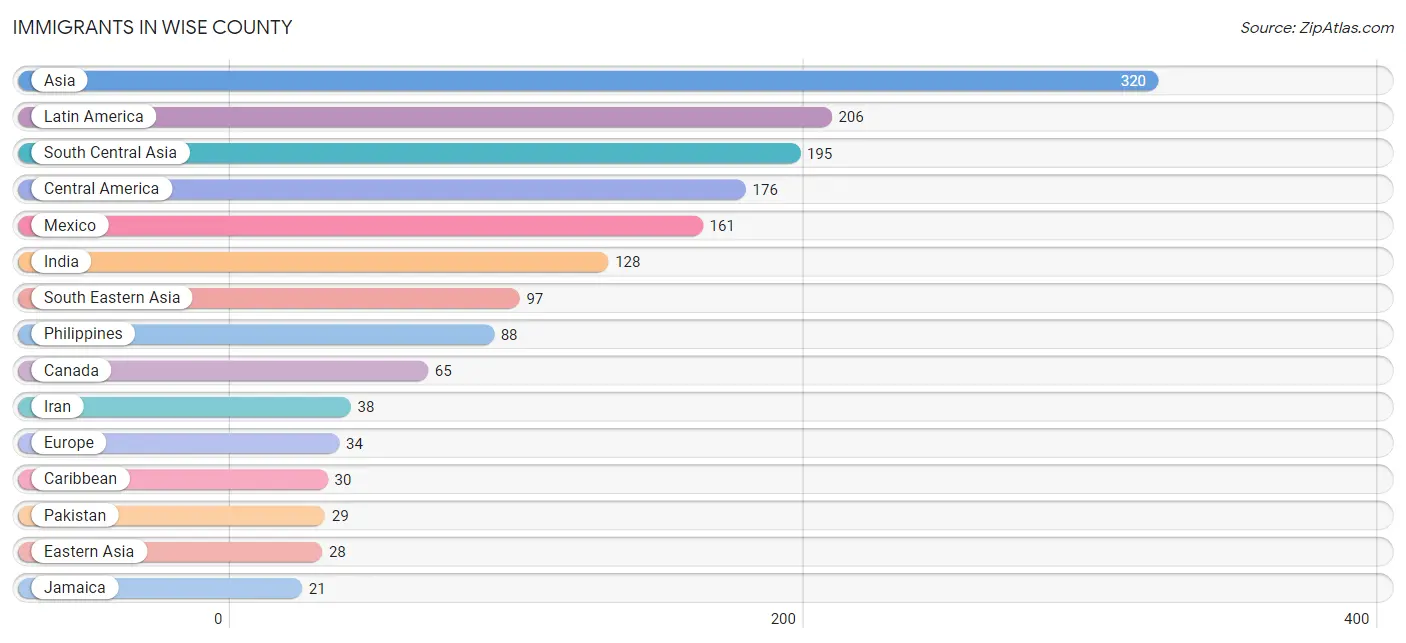
The most numerous immigrant groups reported in Wise County came from Asia (320 | 0.9%), Latin America (206 | 0.6%), South Central Asia (195 | 0.5%), Central America (176 | 0.5%), and Mexico (161 | 0.4%), together accounting for 2.9% of all Wise County residents.
| Immigration Origin | # Population | % Population |
| Africa | 19 | 0.1% |
| Asia | 320 | 0.9% |
| Cambodia | 2 | 0.0% |
| Canada | 65 | 0.2% |
| Caribbean | 30 | 0.1% |
| Central America | 176 | 0.5% |
| China | 17 | 0.1% |
| Dominican Republic | 9 | 0.0% |
| Eastern Asia | 28 | 0.1% |
| Eastern Europe | 11 | 0.0% |
| El Salvador | 3 | 0.0% |
| England | 6 | 0.0% |
| Europe | 34 | 0.1% |
| Germany | 17 | 0.1% |
| India | 128 | 0.4% |
| Iran | 38 | 0.1% |
| Jamaica | 21 | 0.1% |
| Korea | 11 | 0.0% |
| Latin America | 206 | 0.6% |
| Mexico | 161 | 0.4% |
| Nicaragua | 12 | 0.0% |
| Northern Europe | 6 | 0.0% |
| Pakistan | 29 | 0.1% |
| Philippines | 88 | 0.2% |
| South Africa | 19 | 0.1% |
| South Central Asia | 195 | 0.5% |
| South Eastern Asia | 97 | 0.3% |
| Taiwan | 4 | 0.0% |
| Ukraine | 11 | 0.0% |
| Vietnam | 7 | 0.0% |
| Western Europe | 17 | 0.1% | View All 31 Rows |
Sex and Age in Wise County
Sex and Age in Wise County
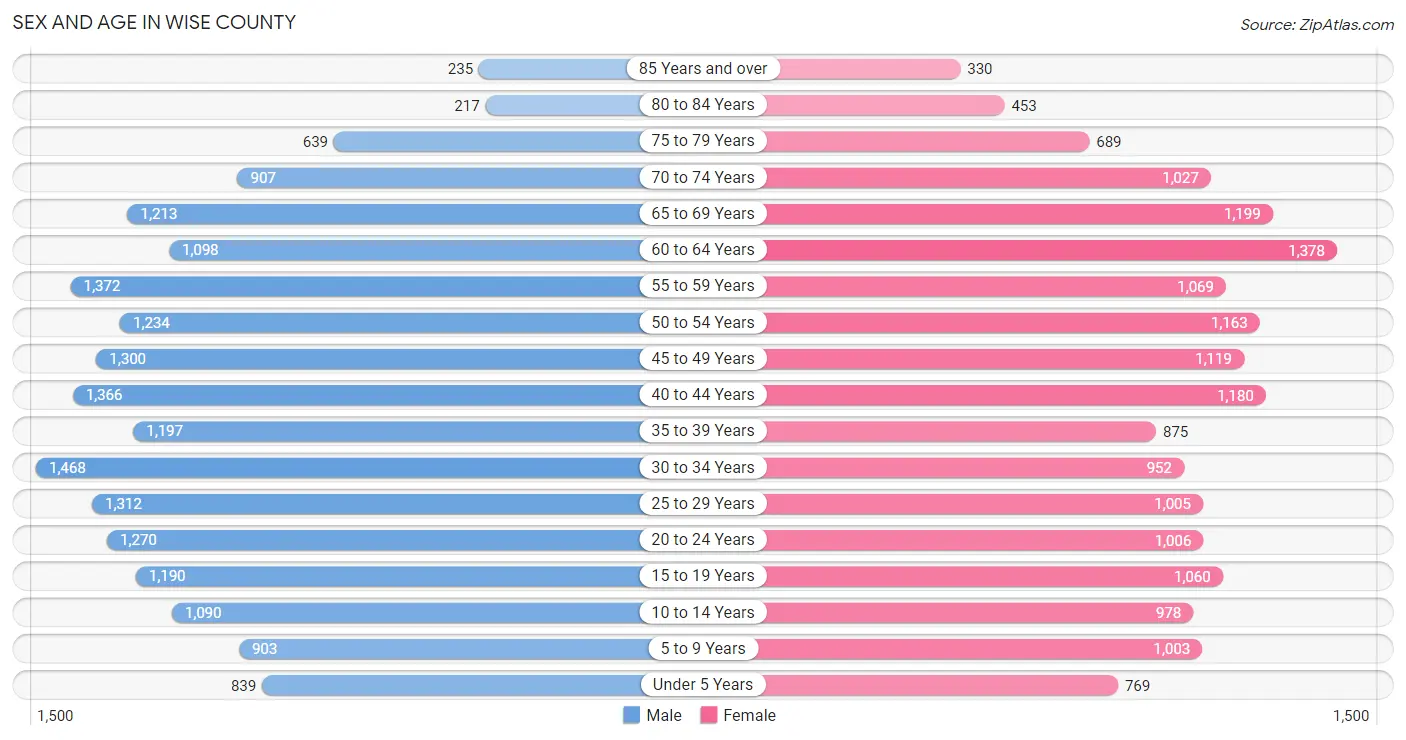
The most populous age groups in Wise County are 30 to 34 Years (1,468 | 7.8%) for men and 60 to 64 Years (1,378 | 8.0%) for women.
| Age Bracket | Male | Female |
| Under 5 Years | 839 (4.4%) | 769 (4.5%) |
| 5 to 9 Years | 903 (4.8%) | 1,003 (5.8%) |
| 10 to 14 Years | 1,090 (5.8%) | 978 (5.7%) |
| 15 to 19 Years | 1,190 (6.3%) | 1,060 (6.1%) |
| 20 to 24 Years | 1,270 (6.7%) | 1,006 (5.8%) |
| 25 to 29 Years | 1,312 (7.0%) | 1,005 (5.8%) |
| 30 to 34 Years | 1,468 (7.8%) | 952 (5.5%) |
| 35 to 39 Years | 1,197 (6.4%) | 875 (5.1%) |
| 40 to 44 Years | 1,366 (7.2%) | 1,180 (6.8%) |
| 45 to 49 Years | 1,300 (6.9%) | 1,119 (6.5%) |
| 50 to 54 Years | 1,234 (6.6%) | 1,163 (6.7%) |
| 55 to 59 Years | 1,372 (7.3%) | 1,069 (6.2%) |
| 60 to 64 Years | 1,098 (5.8%) | 1,378 (8.0%) |
| 65 to 69 Years | 1,213 (6.4%) | 1,199 (7.0%) |
| 70 to 74 Years | 907 (4.8%) | 1,027 (5.9%) |
| 75 to 79 Years | 639 (3.4%) | 689 (4.0%) |
| 80 to 84 Years | 217 (1.1%) | 453 (2.6%) |
| 85 Years and over | 235 (1.3%) | 330 (1.9%) |
| Total | 18,850 (100.0%) | 17,255 (100.0%) |
Families and Households in Wise County
Median Family Size in Wise County
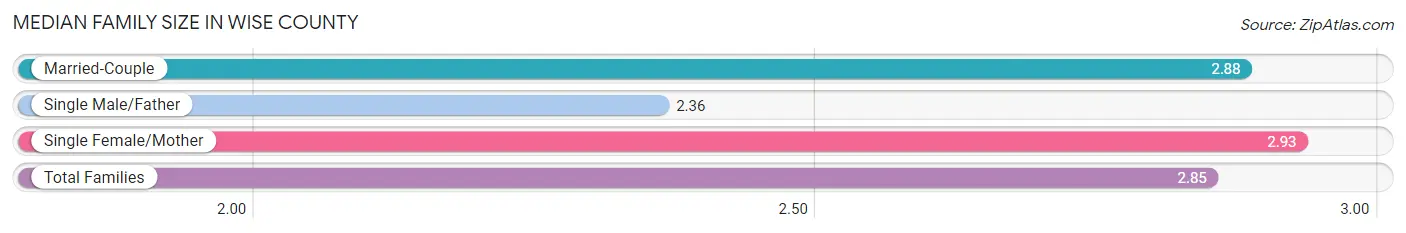
The median family size in Wise County is 2.85 persons per family, with single female/mother families (1,672 | 17.6%) accounting for the largest median family size of 2.93 persons per family. On the other hand, single male/father families (713 | 7.5%) represent the smallest median family size with 2.36 persons per family.
| Family Type | # Families | Family Size |
| Married-Couple | 7,103 (74.9%) | 2.88 |
| Single Male/Father | 713 (7.5%) | 2.36 |
| Single Female/Mother | 1,672 (17.6%) | 2.93 |
| Total Families | 9,488 (100.0%) | 2.85 |
Median Household Size in Wise County
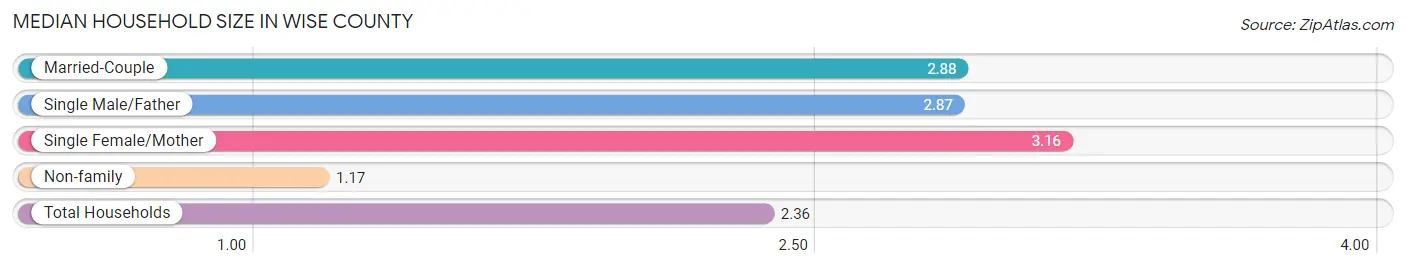
The median household size in Wise County is 2.36 persons per household, with single female/mother households (1,672 | 11.9%) accounting for the largest median household size of 3.16 persons per household. non-family households (4,564 | 32.5%) represent the smallest median household size with 1.17 persons per household.
| Household Type | # Households | Household Size |
| Married-Couple | 7,103 (50.5%) | 2.88 |
| Single Male/Father | 713 (5.1%) | 2.87 |
| Single Female/Mother | 1,672 (11.9%) | 3.16 |
| Non-family | 4,564 (32.5%) | 1.17 |
| Total Households | 14,052 (100.0%) | 2.36 |
Household Size by Marriage Status in Wise County
Out of a total of 14,052 households in Wise County, 9,488 (67.5%) are family households, while 4,564 (32.5%) are nonfamily households. The most numerous type of family households are 2-person households, comprising 4,486, and the most common type of nonfamily households are 1-person households, comprising 4,076.
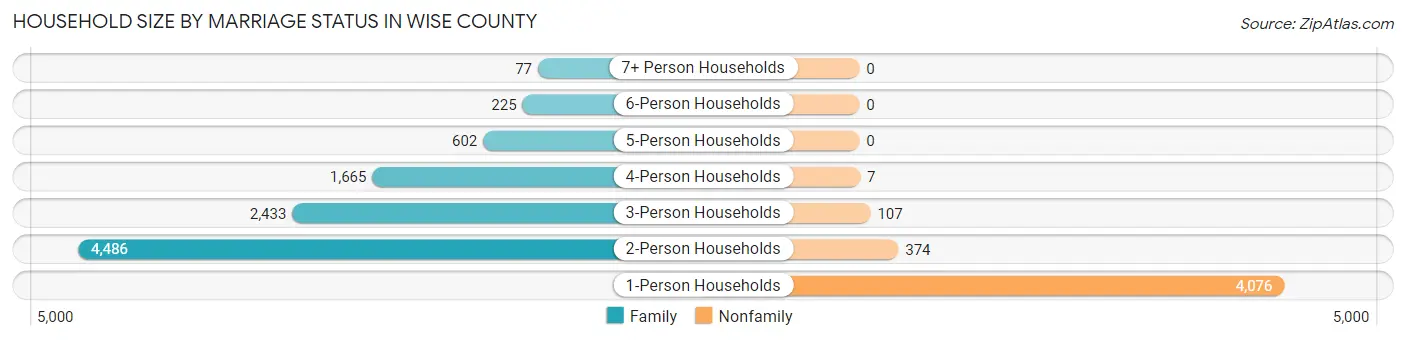
| Household Size | Family Households | Nonfamily Households |
| 1-Person Households | - | 4,076 (29.0%) |
| 2-Person Households | 4,486 (31.9%) | 374 (2.7%) |
| 3-Person Households | 2,433 (17.3%) | 107 (0.8%) |
| 4-Person Households | 1,665 (11.8%) | 7 (0.1%) |
| 5-Person Households | 602 (4.3%) | 0 (0.0%) |
| 6-Person Households | 225 (1.6%) | 0 (0.0%) |
| 7+ Person Households | 77 (0.5%) | 0 (0.0%) |
| Total | 9,488 (67.5%) | 4,564 (32.5%) |
Female Fertility in Wise County
Fertility by Age in Wise County
Average fertility rate in Wise County is 58.0 births per 1,000 women. Women in the age bracket of 15 to 19 years have the highest fertility rate with 116.0 births per 1,000 women. Women in the age bracket of 20 to 34 years acount for 65.0% of all women with births.
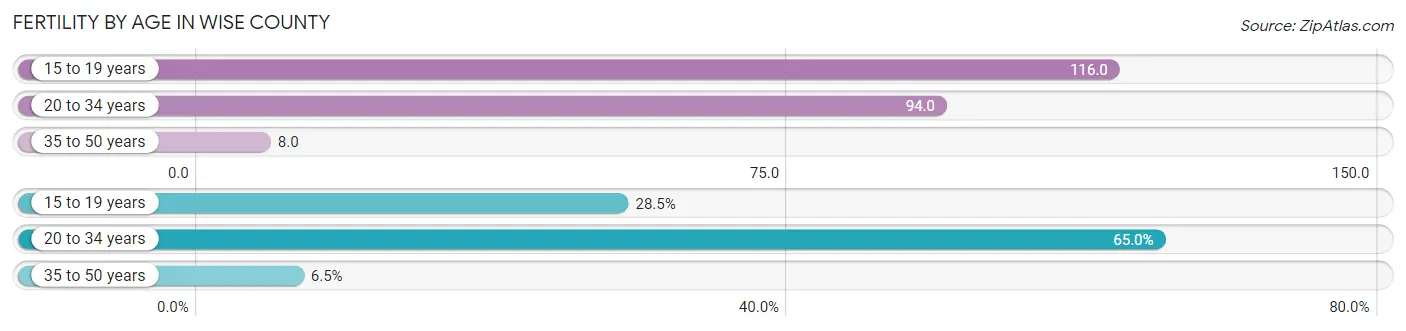
| Age Bracket | Women with Births | Births / 1,000 Women |
| 15 to 19 years | 123 (28.5%) | 116.0 |
| 20 to 34 years | 280 (65.0%) | 94.0 |
| 35 to 50 years | 28 (6.5%) | 8.0 |
| Total | 431 (100.0%) | 58.0 |
Fertility by Age by Marriage Status in Wise County
42.9% of women with births (431) in Wise County are married. The highest percentage of unmarried women with births falls into 15 to 19 years age bracket with 87.8% of them unmarried at the time of birth, while the lowest percentage of unmarried women with births belong to 35 to 50 years age bracket with 35.7% of them unmarried.
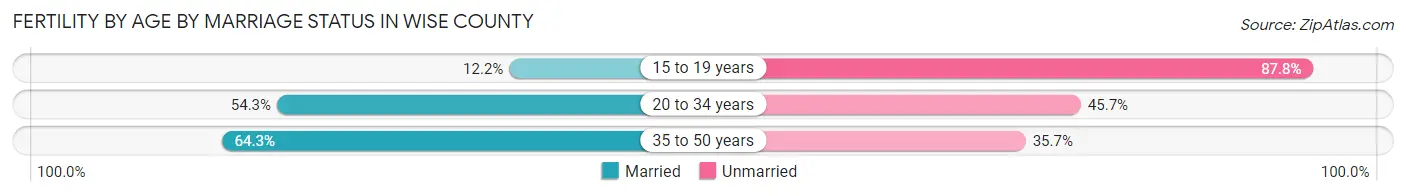
| Age Bracket | Married | Unmarried |
| 15 to 19 years | 15 (12.2%) | 108 (87.8%) |
| 20 to 34 years | 152 (54.3%) | 128 (45.7%) |
| 35 to 50 years | 18 (64.3%) | 10 (35.7%) |
| Total | 185 (42.9%) | 246 (57.1%) |
Fertility by Education in Wise County
Average fertility rate in Wise County is 58.0 births per 1,000 women. Women with the education attainment of less than high school have the highest fertility rate of 102.0 births per 1,000 women, while women with the education attainment of bachelor's degree have the lowest fertility at 29.0 births per 1,000 women. Women with the education attainment of college or associate's degree represent 36.2% of all women with births.
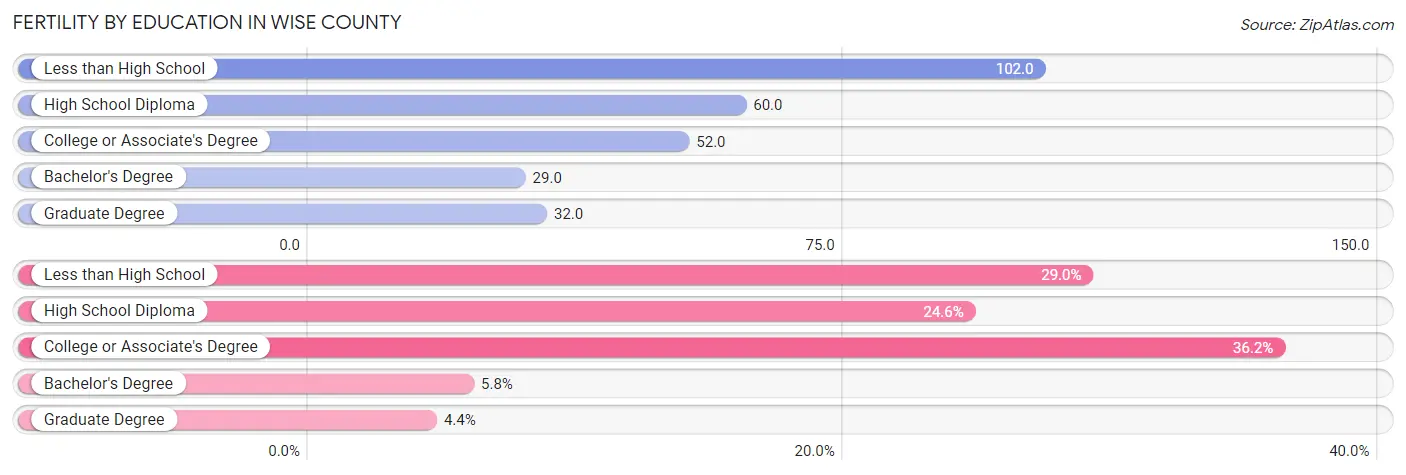
| Educational Attainment | Women with Births | Births / 1,000 Women |
| Less than High School | 125 (29.0%) | 102.0 |
| High School Diploma | 106 (24.6%) | 60.0 |
| College or Associate's Degree | 156 (36.2%) | 52.0 |
| Bachelor's Degree | 25 (5.8%) | 29.0 |
| Graduate Degree | 19 (4.4%) | 32.0 |
| Total | 431 (100.0%) | 58.0 |
Fertility by Education by Marriage Status in Wise County
57.1% of women with births in Wise County are unmarried. Women with the educational attainment of graduate degree are most likely to be married with 100.0% of them married at childbirth, while women with the educational attainment of less than high school are least likely to be married with 93.6% of them unmarried at childbirth.
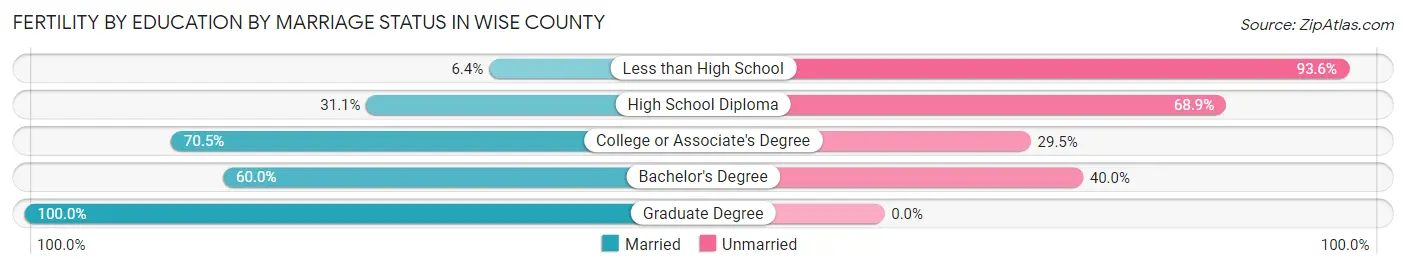
| Educational Attainment | Married | Unmarried |
| Less than High School | 8 (6.4%) | 117 (93.6%) |
| High School Diploma | 33 (31.1%) | 73 (68.9%) |
| College or Associate's Degree | 110 (70.5%) | 46 (29.5%) |
| Bachelor's Degree | 15 (60.0%) | 10 (40.0%) |
| Graduate Degree | 19 (100.0%) | 0 (0.0%) |
| Total | 185 (42.9%) | 246 (57.1%) |
Employment Characteristics in Wise County
Employment by Class of Employer in Wise County
Among the 12,211 employed individuals in Wise County, private company employees (7,892 | 64.6%), local government employees (1,316 | 10.8%), and state government employees (1,130 | 9.2%) make up the most common classes of employment.
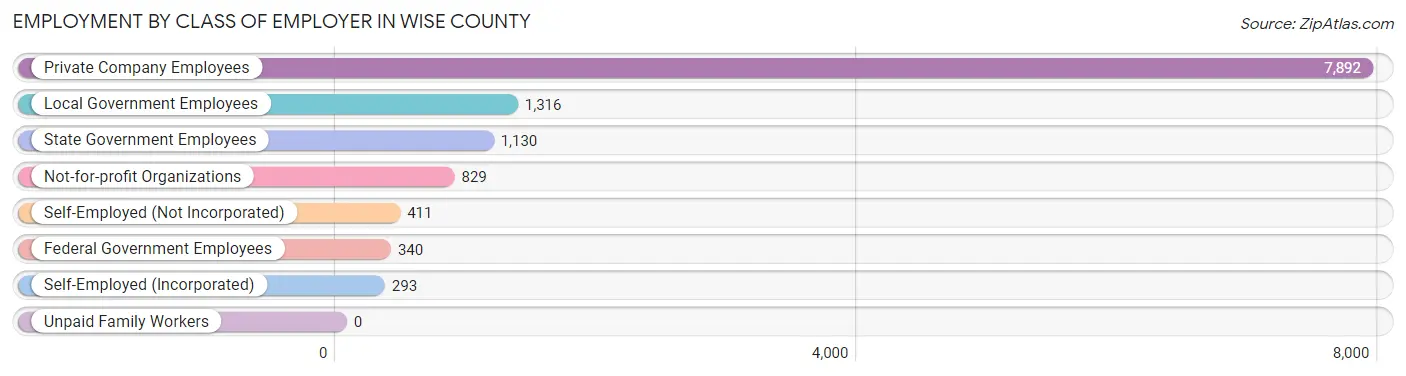
| Employer Class | # Employees | % Employees |
| Private Company Employees | 7,892 | 64.6% |
| Self-Employed (Incorporated) | 293 | 2.4% |
| Self-Employed (Not Incorporated) | 411 | 3.4% |
| Not-for-profit Organizations | 829 | 6.8% |
| Local Government Employees | 1,316 | 10.8% |
| State Government Employees | 1,130 | 9.2% |
| Federal Government Employees | 340 | 2.8% |
| Unpaid Family Workers | 0 | 0.0% |
| Total | 12,211 | 100.0% |
Employment Status by Age in Wise County
According to the labor force statistics for Wise County, out of the total population over 16 years of age (30,055), 46.4% or 13,946 individuals are in the labor force, with 9.1% or 1,269 of them unemployed. The age group with the highest labor force participation rate is 20 to 24 years, with 73.1% or 1,664 individuals in the labor force. Within the labor force, the 16 to 19 years age range has the highest percentage of unemployed individuals, with 25.3% or 236 of them being unemployed.
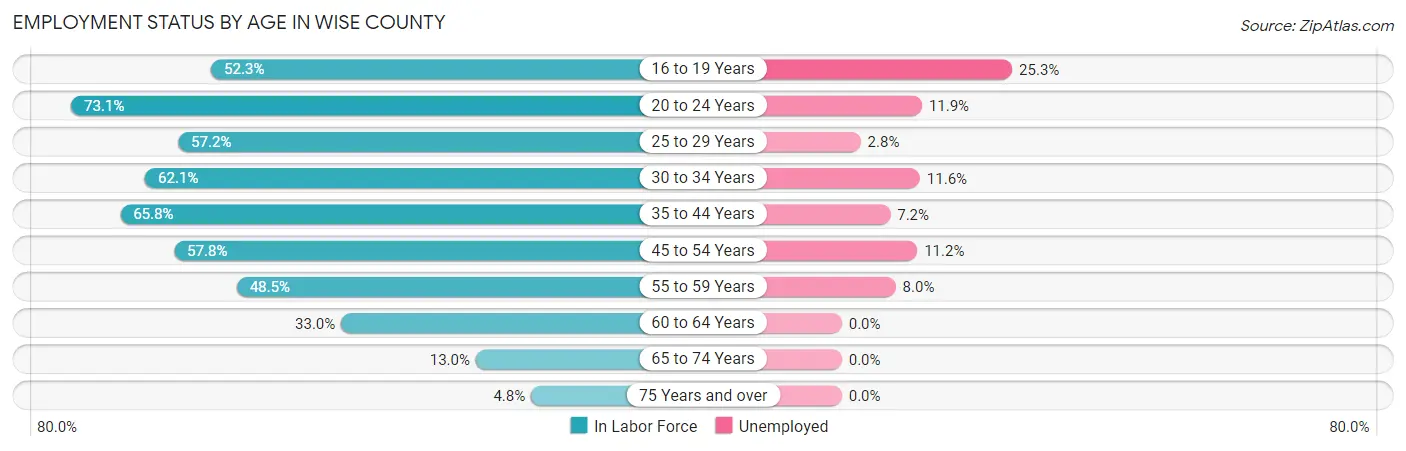
| Age Bracket | In Labor Force | Unemployed |
| 16 to 19 Years | 932 (52.3%) | 236 (25.3%) |
| 20 to 24 Years | 1,664 (73.1%) | 198 (11.9%) |
| 25 to 29 Years | 1,325 (57.2%) | 37 (2.8%) |
| 30 to 34 Years | 1,503 (62.1%) | 174 (11.6%) |
| 35 to 44 Years | 3,039 (65.8%) | 219 (7.2%) |
| 45 to 54 Years | 2,784 (57.8%) | 312 (11.2%) |
| 55 to 59 Years | 1,184 (48.5%) | 95 (8.0%) |
| 60 to 64 Years | 817 (33.0%) | 0 (0.0%) |
| 65 to 74 Years | 565 (13.0%) | 0 (0.0%) |
| 75 Years and over | 123 (4.8%) | 0 (0.0%) |
| Total | 13,946 (46.4%) | 1,269 (9.1%) |
Employment Status by Educational Attainment in Wise County
According to labor force statistics for Wise County, 55.8% of individuals (10,651) out of the total population between 25 and 64 years of age (19,088) are in the labor force, with 7.9% or 841 of them being unemployed. The group with the highest labor force participation rate are those with the educational attainment of bachelor's degree or higher, with 76.2% or 2,557 individuals in the labor force. Within the labor force, individuals with less than high school education have the highest percentage of unemployment, with 20.0% or 236 of them being unemployed.
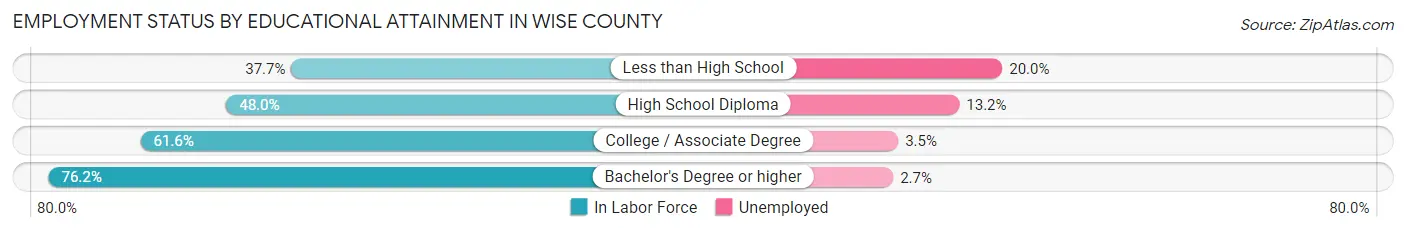
| Educational Attainment | In Labor Force | Unemployed |
| Less than High School | 1,178 (37.7%) | 625 (20.0%) |
| High School Diploma | 2,998 (48.0%) | 824 (13.2%) |
| College / Associate Degree | 3,918 (61.6%) | 223 (3.5%) |
| Bachelor's Degree or higher | 2,557 (76.2%) | 91 (2.7%) |
| Total | 10,651 (55.8%) | 1,508 (7.9%) |
Employment Occupations by Sex in Wise County
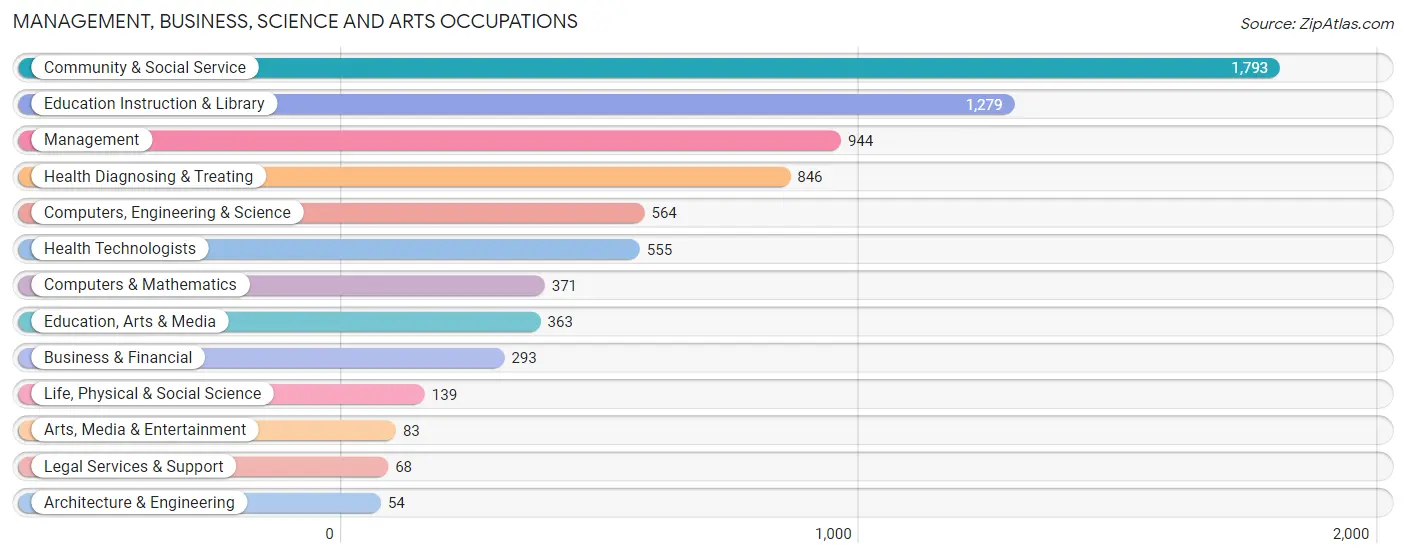
Management, Business, Science and Arts Occupations
The most common Management, Business, Science and Arts occupations in Wise County are Community & Social Service (1,793 | 14.2%), Education Instruction & Library (1,279 | 10.1%), Management (944 | 7.5%), Health Diagnosing & Treating (846 | 6.7%), and Computers, Engineering & Science (564 | 4.5%).
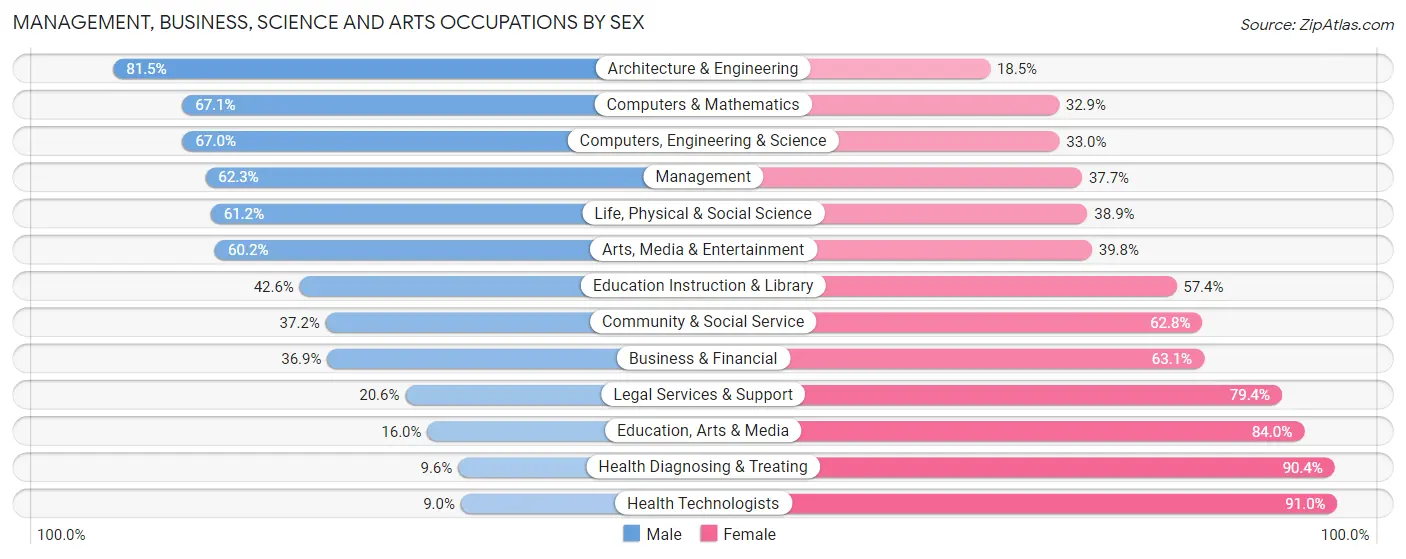
Management, Business, Science and Arts Occupations by Sex
Within the Management, Business, Science and Arts occupations in Wise County, the most male-oriented occupations are Architecture & Engineering (81.5%), Computers & Mathematics (67.1%), and Computers, Engineering & Science (67.0%), while the most female-oriented occupations are Health Technologists (91.0%), Health Diagnosing & Treating (90.4%), and Education, Arts & Media (84.0%).
| Occupation | Male | Female |
| Management | 588 (62.3%) | 356 (37.7%) |
| Business & Financial | 108 (36.9%) | 185 (63.1%) |
| Computers, Engineering & Science | 378 (67.0%) | 186 (33.0%) |
| Computers & Mathematics | 249 (67.1%) | 122 (32.9%) |
| Architecture & Engineering | 44 (81.5%) | 10 (18.5%) |
| Life, Physical & Social Science | 85 (61.2%) | 54 (38.9%) |
| Community & Social Service | 667 (37.2%) | 1,126 (62.8%) |
| Education, Arts & Media | 58 (16.0%) | 305 (84.0%) |
| Legal Services & Support | 14 (20.6%) | 54 (79.4%) |
| Education Instruction & Library | 545 (42.6%) | 734 (57.4%) |
| Arts, Media & Entertainment | 50 (60.2%) | 33 (39.8%) |
| Health Diagnosing & Treating | 81 (9.6%) | 765 (90.4%) |
| Health Technologists | 50 (9.0%) | 505 (91.0%) |
| Total (Category) | 1,822 (41.0%) | 2,618 (59.0%) |
| Total (Overall) | 6,544 (51.7%) | 6,107 (48.3%) |
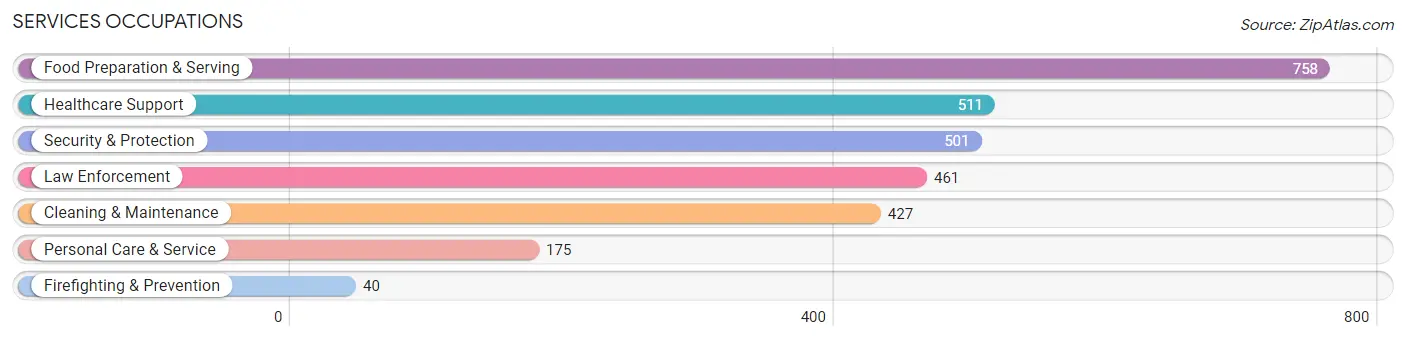
Services Occupations
The most common Services occupations in Wise County are Food Preparation & Serving (758 | 6.0%), Healthcare Support (511 | 4.0%), Security & Protection (501 | 4.0%), Law Enforcement (461 | 3.6%), and Cleaning & Maintenance (427 | 3.4%).
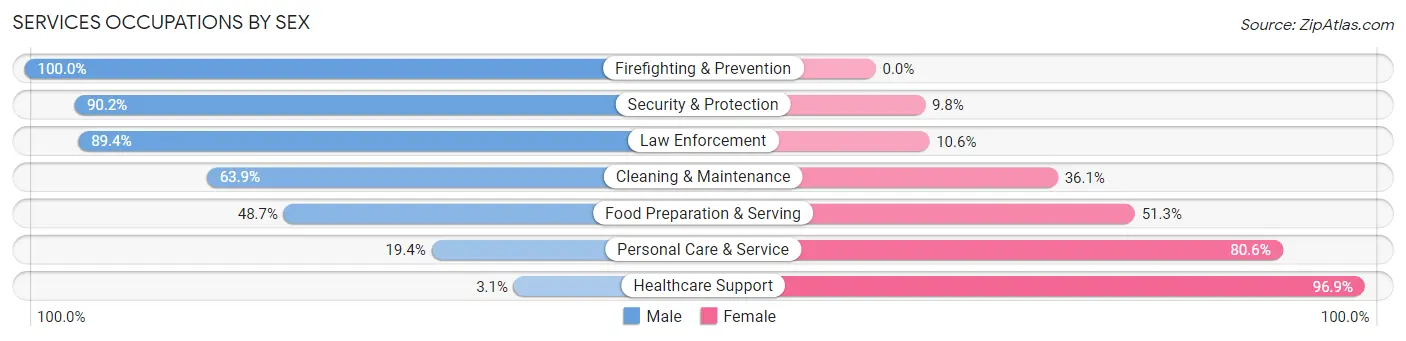
Services Occupations by Sex
Within the Services occupations in Wise County, the most male-oriented occupations are Firefighting & Prevention (100.0%), Security & Protection (90.2%), and Law Enforcement (89.4%), while the most female-oriented occupations are Healthcare Support (96.9%), Personal Care & Service (80.6%), and Food Preparation & Serving (51.3%).
| Occupation | Male | Female |
| Healthcare Support | 16 (3.1%) | 495 (96.9%) |
| Security & Protection | 452 (90.2%) | 49 (9.8%) |
| Firefighting & Prevention | 40 (100.0%) | 0 (0.0%) |
| Law Enforcement | 412 (89.4%) | 49 (10.6%) |
| Food Preparation & Serving | 369 (48.7%) | 389 (51.3%) |
| Cleaning & Maintenance | 273 (63.9%) | 154 (36.1%) |
| Personal Care & Service | 34 (19.4%) | 141 (80.6%) |
| Total (Category) | 1,144 (48.2%) | 1,228 (51.8%) |
| Total (Overall) | 6,544 (51.7%) | 6,107 (48.3%) |
Sales and Office Occupations
The most common Sales and Office occupations in Wise County are Office & Administration (1,656 | 13.1%), and Sales & Related (1,367 | 10.8%).

Sales and Office Occupations by Sex
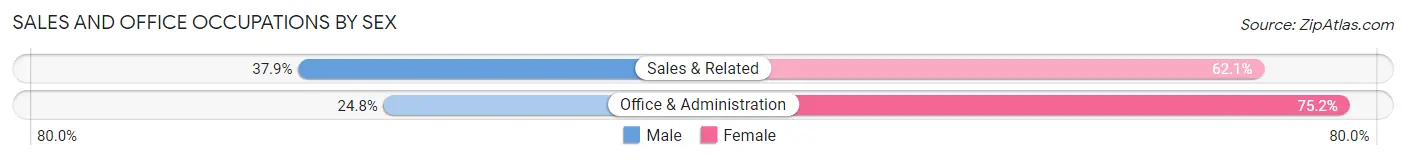
| Occupation | Male | Female |
| Sales & Related | 518 (37.9%) | 849 (62.1%) |
| Office & Administration | 410 (24.8%) | 1,246 (75.2%) |
| Total (Category) | 928 (30.7%) | 2,095 (69.3%) |
| Total (Overall) | 6,544 (51.7%) | 6,107 (48.3%) |
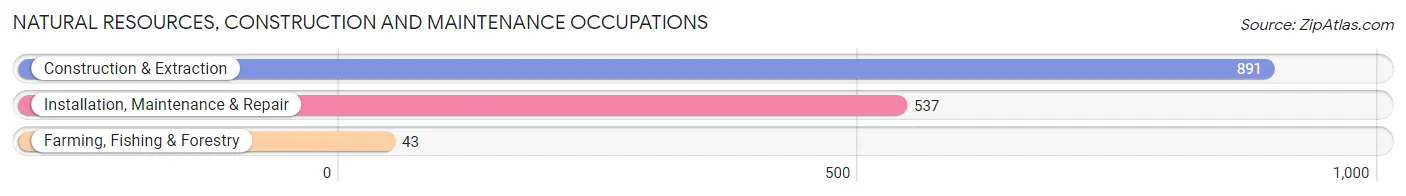
Natural Resources, Construction and Maintenance Occupations
The most common Natural Resources, Construction and Maintenance occupations in Wise County are Construction & Extraction (891 | 7.0%), Installation, Maintenance & Repair (537 | 4.2%), and Farming, Fishing & Forestry (43 | 0.3%).
Natural Resources, Construction and Maintenance Occupations by Sex
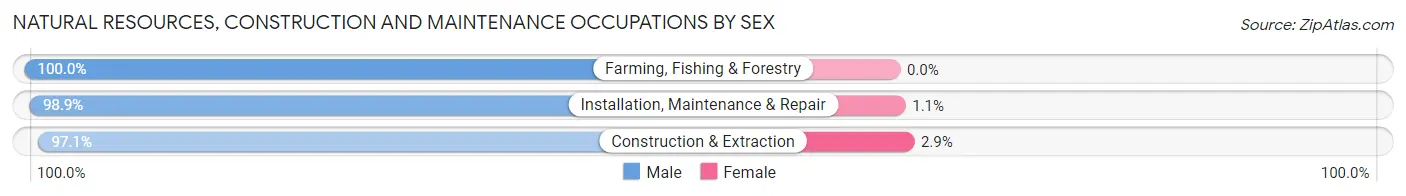
| Occupation | Male | Female |
| Farming, Fishing & Forestry | 43 (100.0%) | 0 (0.0%) |
| Construction & Extraction | 865 (97.1%) | 26 (2.9%) |
| Installation, Maintenance & Repair | 531 (98.9%) | 6 (1.1%) |
| Total (Category) | 1,439 (97.8%) | 32 (2.2%) |
| Total (Overall) | 6,544 (51.7%) | 6,107 (48.3%) |
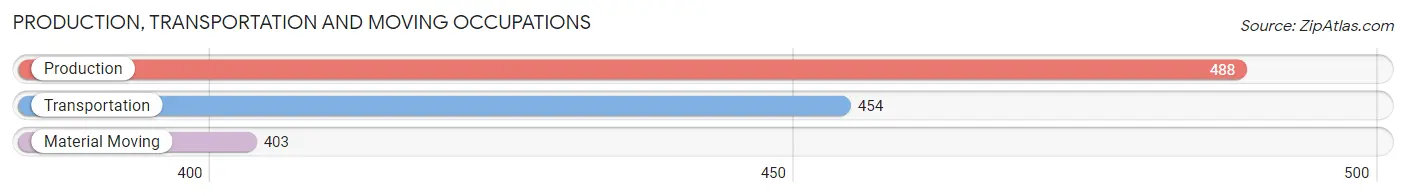
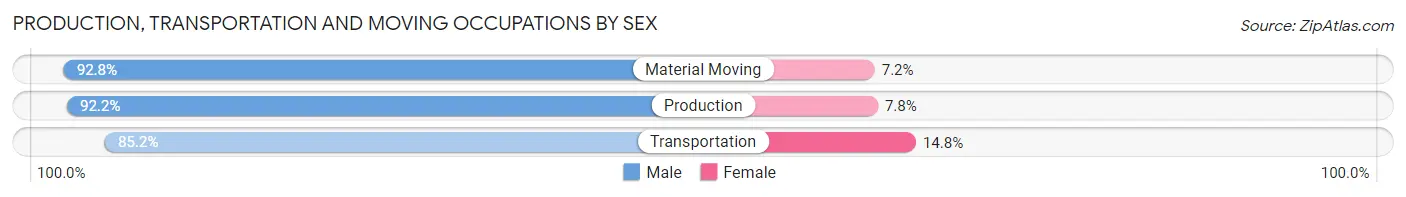
Production, Transportation and Moving Occupations
The most common Production, Transportation and Moving occupations in Wise County are Production (488 | 3.9%), Transportation (454 | 3.6%), and Material Moving (403 | 3.2%).
Production, Transportation and Moving Occupations by Sex
| Occupation | Male | Female |
| Production | 450 (92.2%) | 38 (7.8%) |
| Transportation | 387 (85.2%) | 67 (14.8%) |
| Material Moving | 374 (92.8%) | 29 (7.2%) |
| Total (Category) | 1,211 (90.0%) | 134 (10.0%) |
| Total (Overall) | 6,544 (51.7%) | 6,107 (48.3%) |
Employment Industries by Sex in Wise County
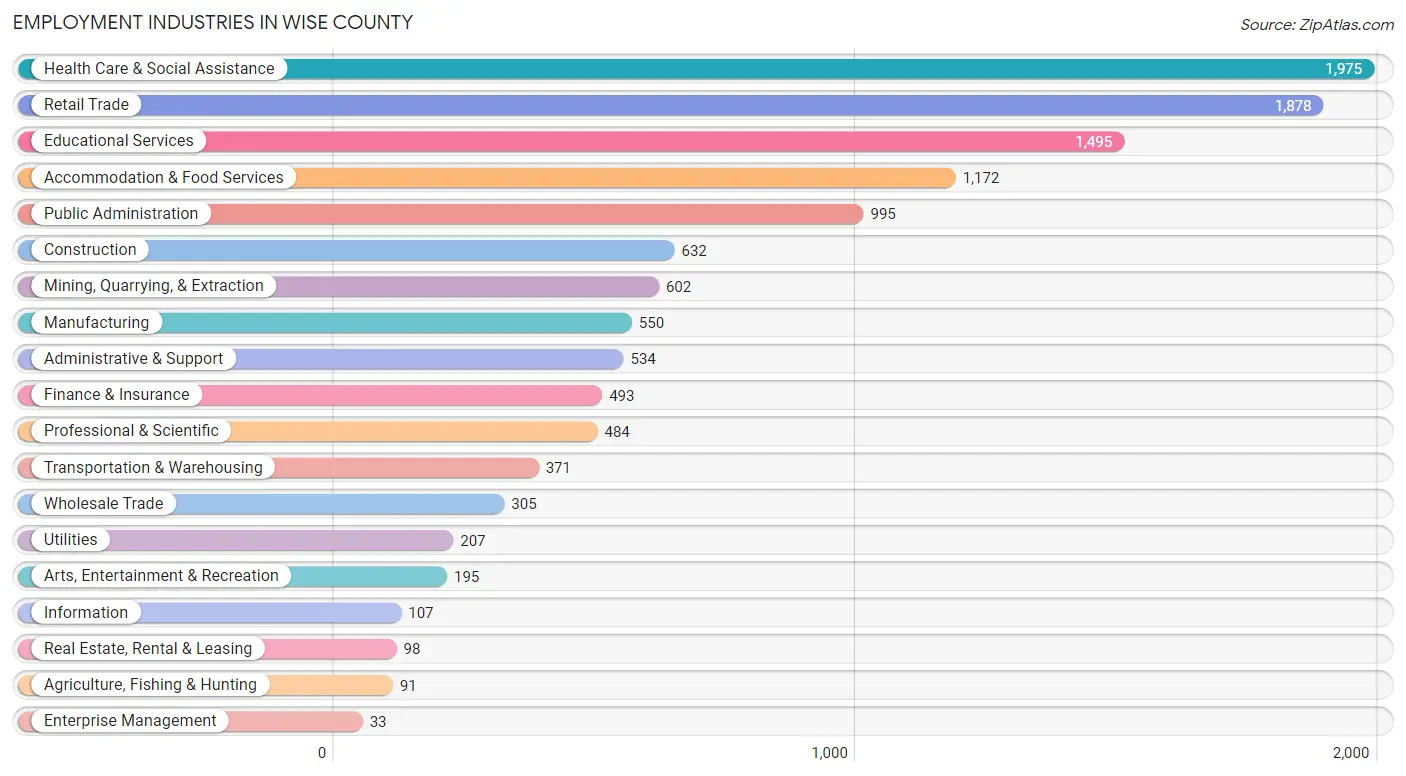
Employment Industries in Wise County
The major employment industries in Wise County include Health Care & Social Assistance (1,975 | 15.6%), Retail Trade (1,878 | 14.8%), Educational Services (1,495 | 11.8%), Accommodation & Food Services (1,172 | 9.3%), and Public Administration (995 | 7.9%).
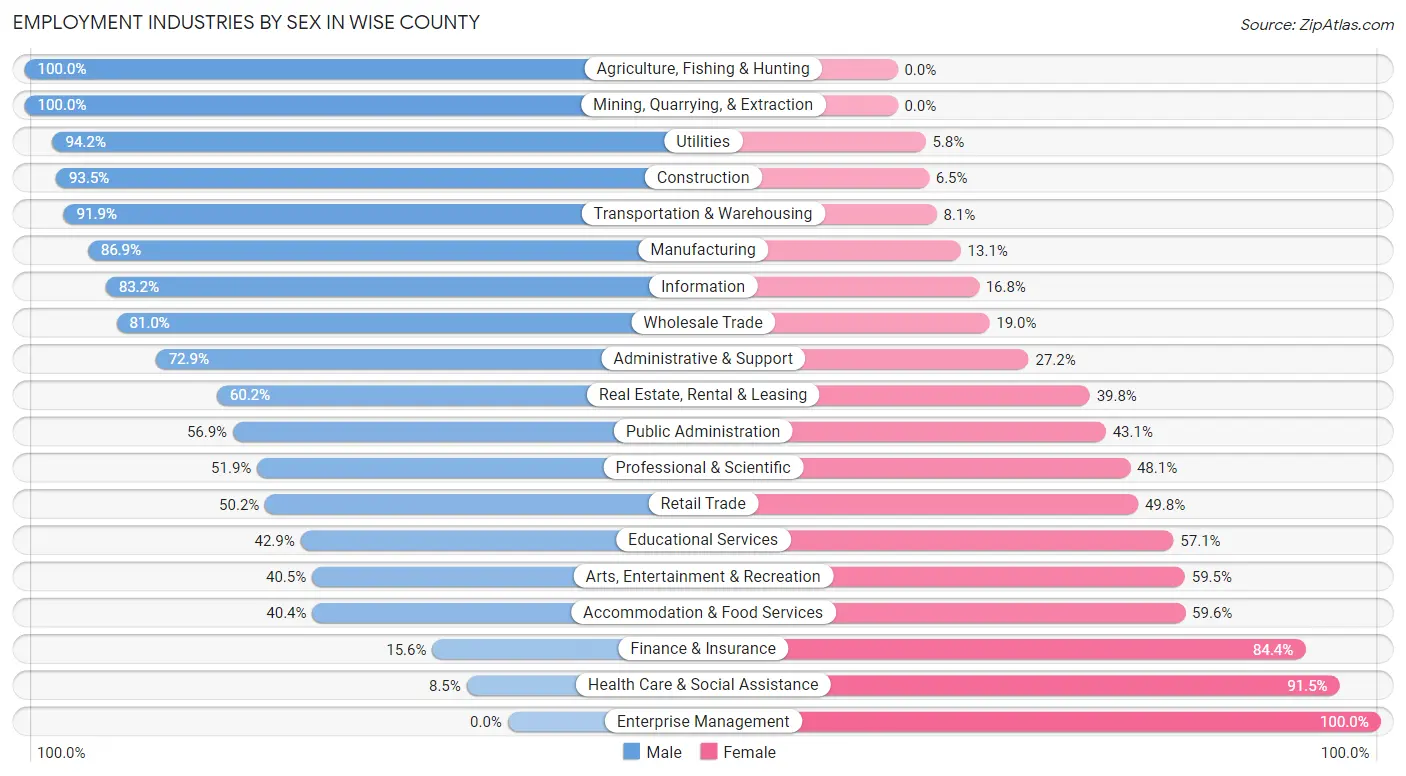
Employment Industries by Sex in Wise County
The Wise County industries that see more men than women are Agriculture, Fishing & Hunting (100.0%), Mining, Quarrying, & Extraction (100.0%), and Utilities (94.2%), whereas the industries that tend to have a higher number of women are Enterprise Management (100.0%), Health Care & Social Assistance (91.5%), and Finance & Insurance (84.4%).
| Industry | Male | Female |
| Agriculture, Fishing & Hunting | 91 (100.0%) | 0 (0.0%) |
| Mining, Quarrying, & Extraction | 602 (100.0%) | 0 (0.0%) |
| Construction | 591 (93.5%) | 41 (6.5%) |
| Manufacturing | 478 (86.9%) | 72 (13.1%) |
| Wholesale Trade | 247 (81.0%) | 58 (19.0%) |
| Retail Trade | 943 (50.2%) | 935 (49.8%) |
| Transportation & Warehousing | 341 (91.9%) | 30 (8.1%) |
| Utilities | 195 (94.2%) | 12 (5.8%) |
| Information | 89 (83.2%) | 18 (16.8%) |
| Finance & Insurance | 77 (15.6%) | 416 (84.4%) |
| Real Estate, Rental & Leasing | 59 (60.2%) | 39 (39.8%) |
| Professional & Scientific | 251 (51.9%) | 233 (48.1%) |
| Enterprise Management | 0 (0.0%) | 33 (100.0%) |
| Administrative & Support | 389 (72.9%) | 145 (27.2%) |
| Educational Services | 641 (42.9%) | 854 (57.1%) |
| Health Care & Social Assistance | 168 (8.5%) | 1,807 (91.5%) |
| Arts, Entertainment & Recreation | 79 (40.5%) | 116 (59.5%) |
| Accommodation & Food Services | 474 (40.4%) | 698 (59.6%) |
| Public Administration | 566 (56.9%) | 429 (43.1%) |
| Total | 6,544 (51.7%) | 6,107 (48.3%) |
Education in Wise County
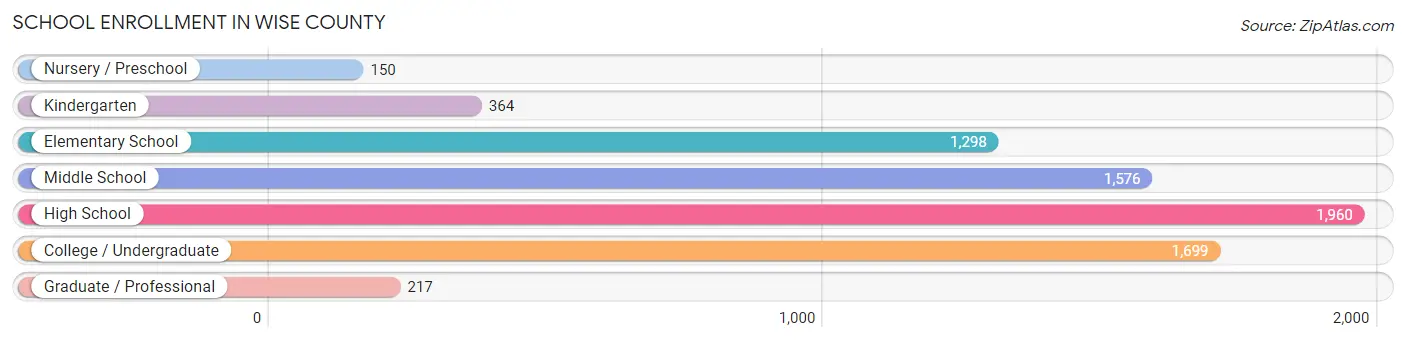
School Enrollment in Wise County
The most common levels of schooling among the 7,264 students in Wise County are high school (1,960 | 27.0%), college / undergraduate (1,699 | 23.4%), and middle school (1,576 | 21.7%).
| School Level | # Students | % Students |
| Nursery / Preschool | 150 | 2.1% |
| Kindergarten | 364 | 5.0% |
| Elementary School | 1,298 | 17.9% |
| Middle School | 1,576 | 21.7% |
| High School | 1,960 | 27.0% |
| College / Undergraduate | 1,699 | 23.4% |
| Graduate / Professional | 217 | 3.0% |
| Total | 7,264 | 100.0% |
School Enrollment by Age by Funding Source in Wise County
Out of a total of 7,264 students who are enrolled in schools in Wise County, 814 (11.2%) attend a private institution, while the remaining 6,450 (88.8%) are enrolled in public schools. The age group of 35 years and over has the highest likelihood of being enrolled in private schools, with 89 (30.0% in the age bracket) enrolled. Conversely, the age group of 18 to 19 year olds has the lowest likelihood of being enrolled in a private school, with 605 (95.7% in the age bracket) attending a public institution.
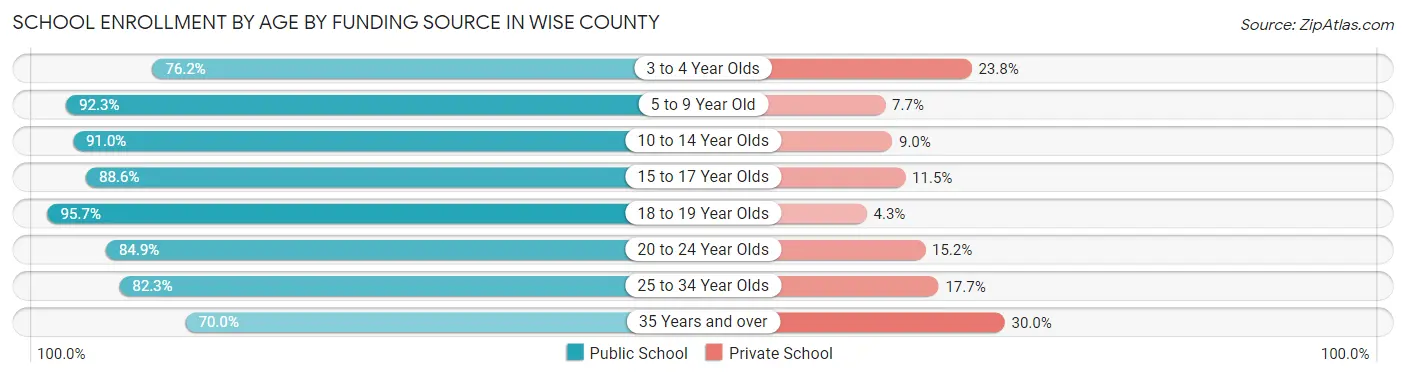
| Age Bracket | Public School | Private School |
| 3 to 4 Year Olds | 112 (76.2%) | 35 (23.8%) |
| 5 to 9 Year Old | 1,456 (92.3%) | 122 (7.7%) |
| 10 to 14 Year Olds | 1,838 (91.0%) | 182 (9.0%) |
| 15 to 17 Year Olds | 1,098 (88.5%) | 142 (11.5%) |
| 18 to 19 Year Olds | 605 (95.7%) | 27 (4.3%) |
| 20 to 24 Year Olds | 689 (84.9%) | 123 (15.1%) |
| 25 to 34 Year Olds | 443 (82.3%) | 95 (17.7%) |
| 35 Years and over | 208 (70.0%) | 89 (30.0%) |
| Total | 6,450 (88.8%) | 814 (11.2%) |
Educational Attainment by Field of Study in Wise County
Education (1,007 | 22.3%), business (699 | 15.4%), psychology (542 | 12.0%), science & technology (407 | 9.0%), and arts & humanities (381 | 8.4%) are the most common fields of study among 4,524 individuals in Wise County who have obtained a bachelor's degree or higher.
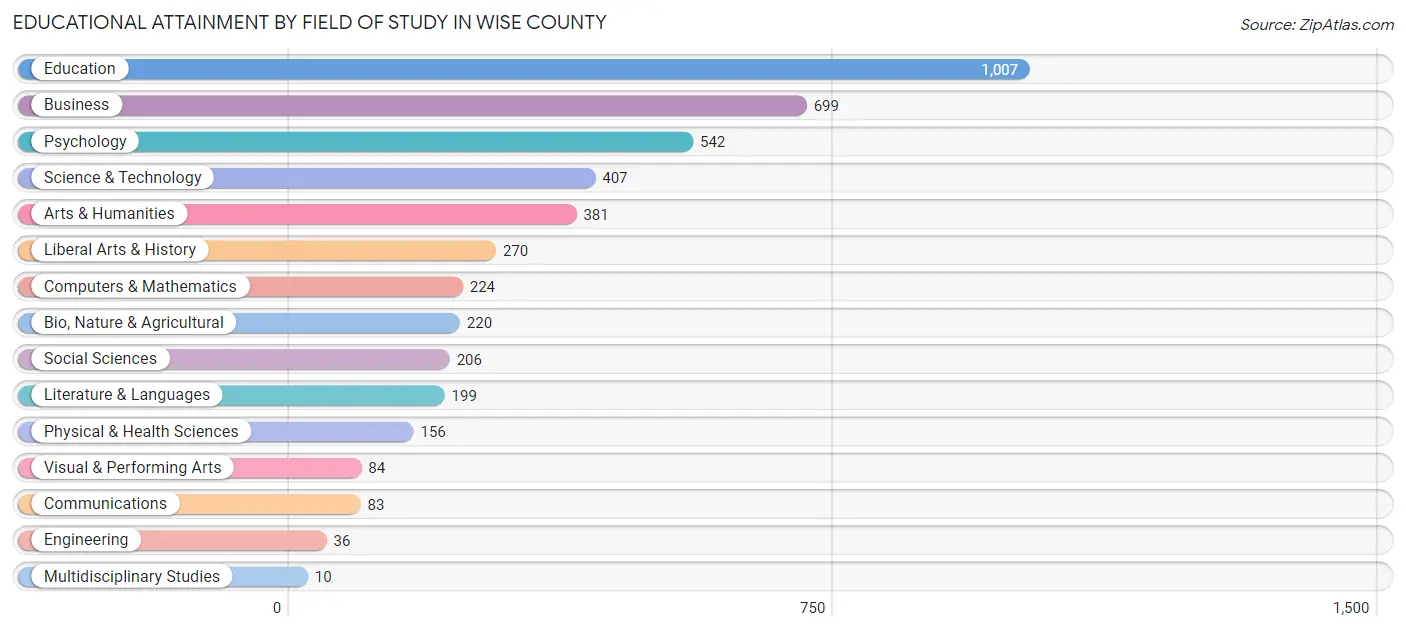
| Field of Study | # Graduates | % Graduates |
| Computers & Mathematics | 224 | 5.0% |
| Bio, Nature & Agricultural | 220 | 4.9% |
| Physical & Health Sciences | 156 | 3.5% |
| Psychology | 542 | 12.0% |
| Social Sciences | 206 | 4.5% |
| Engineering | 36 | 0.8% |
| Multidisciplinary Studies | 10 | 0.2% |
| Science & Technology | 407 | 9.0% |
| Business | 699 | 15.4% |
| Education | 1,007 | 22.3% |
| Literature & Languages | 199 | 4.4% |
| Liberal Arts & History | 270 | 6.0% |
| Visual & Performing Arts | 84 | 1.9% |
| Communications | 83 | 1.8% |
| Arts & Humanities | 381 | 8.4% |
| Total | 4,524 | 100.0% |
Transportation & Commute in Wise County
Vehicle Availability by Sex in Wise County
The most prevalent vehicle ownership categories in Wise County are males with 2 vehicles (2,786, accounting for 44.4%) and females with 2 vehicles (2,343, making up 49.3%).
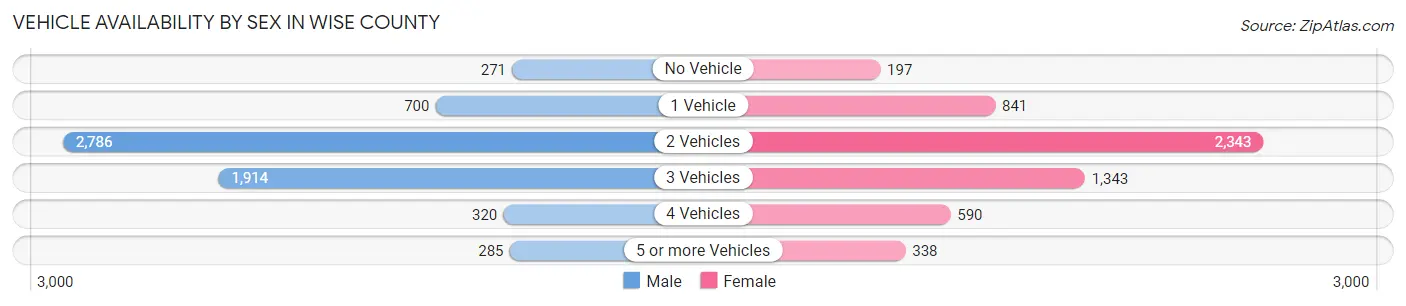
| Vehicles Available | Male | Female |
| No Vehicle | 271 (4.3%) | 197 (3.5%) |
| 1 Vehicle | 700 (11.2%) | 841 (14.9%) |
| 2 Vehicles | 2,786 (44.4%) | 2,343 (41.4%) |
| 3 Vehicles | 1,914 (30.5%) | 1,343 (23.8%) |
| 4 Vehicles | 320 (5.1%) | 590 (10.4%) |
| 5 or more Vehicles | 285 (4.5%) | 338 (6.0%) |
| Total | 6,276 (100.0%) | 5,652 (100.0%) |
Commute Time in Wise County
The most frequently occuring commute durations in Wise County are 10 to 14 minutes (1,988 commuters, 17.3%), 5 to 9 minutes (1,898 commuters, 16.6%), and 15 to 19 minutes (1,576 commuters, 13.8%).
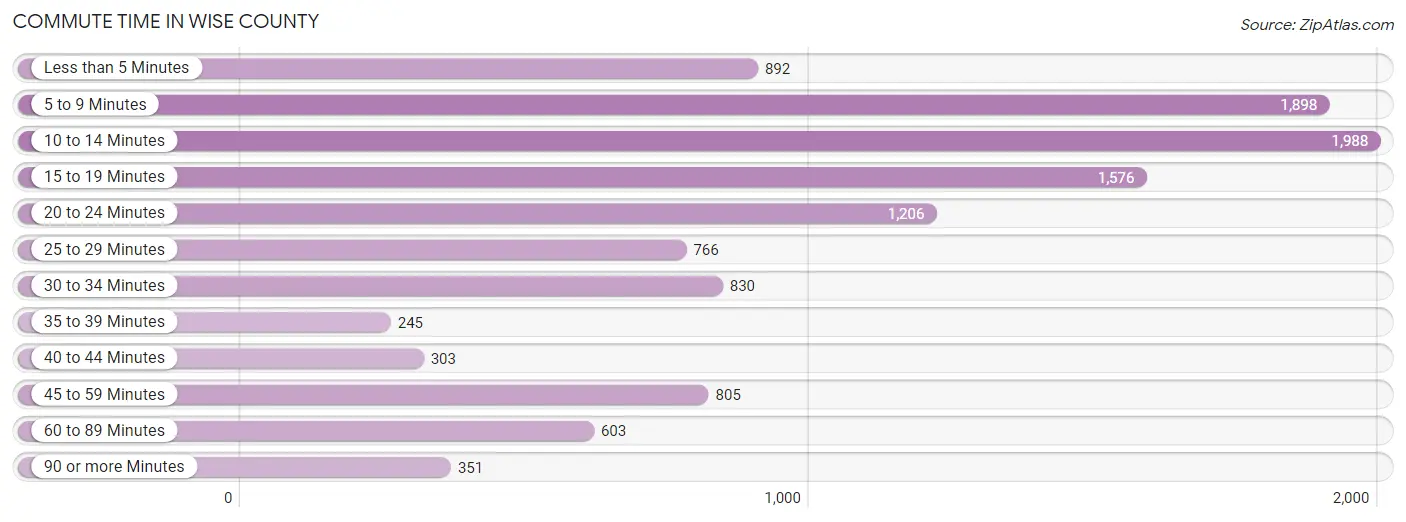
| Commute Time | # Commuters | % Commuters |
| Less than 5 Minutes | 892 | 7.8% |
| 5 to 9 Minutes | 1,898 | 16.6% |
| 10 to 14 Minutes | 1,988 | 17.3% |
| 15 to 19 Minutes | 1,576 | 13.8% |
| 20 to 24 Minutes | 1,206 | 10.5% |
| 25 to 29 Minutes | 766 | 6.7% |
| 30 to 34 Minutes | 830 | 7.2% |
| 35 to 39 Minutes | 245 | 2.1% |
| 40 to 44 Minutes | 303 | 2.6% |
| 45 to 59 Minutes | 805 | 7.0% |
| 60 to 89 Minutes | 603 | 5.3% |
| 90 or more Minutes | 351 | 3.1% |
Commute Time by Sex in Wise County
The most common commute times in Wise County are 10 to 14 minutes (1,056 commuters, 17.4%) for males and 5 to 9 minutes (1,045 commuters, 19.4%) for females.
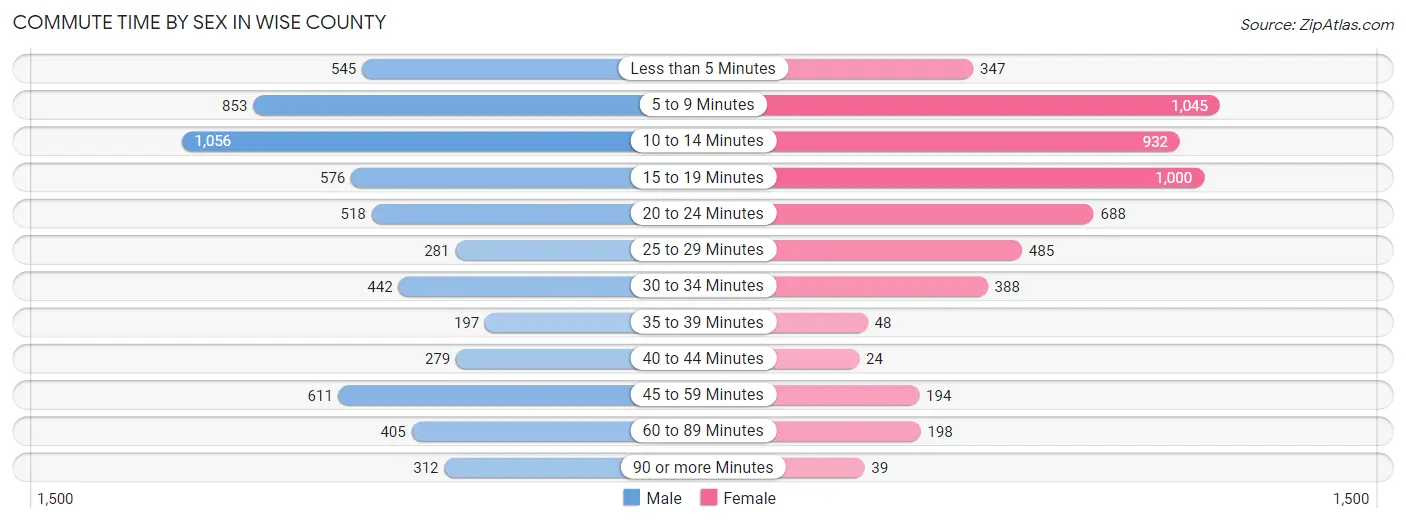
| Commute Time | Male | Female |
| Less than 5 Minutes | 545 (9.0%) | 347 (6.4%) |
| 5 to 9 Minutes | 853 (14.0%) | 1,045 (19.4%) |
| 10 to 14 Minutes | 1,056 (17.4%) | 932 (17.3%) |
| 15 to 19 Minutes | 576 (9.5%) | 1,000 (18.6%) |
| 20 to 24 Minutes | 518 (8.5%) | 688 (12.8%) |
| 25 to 29 Minutes | 281 (4.6%) | 485 (9.0%) |
| 30 to 34 Minutes | 442 (7.3%) | 388 (7.2%) |
| 35 to 39 Minutes | 197 (3.2%) | 48 (0.9%) |
| 40 to 44 Minutes | 279 (4.6%) | 24 (0.4%) |
| 45 to 59 Minutes | 611 (10.1%) | 194 (3.6%) |
| 60 to 89 Minutes | 405 (6.7%) | 198 (3.7%) |
| 90 or more Minutes | 312 (5.1%) | 39 (0.7%) |
Time of Departure to Work by Sex in Wise County
The most frequent times of departure to work in Wise County are 7:30 AM to 7:59 AM (803, 13.2%) for males and 7:30 AM to 7:59 AM (1,188, 22.1%) for females.
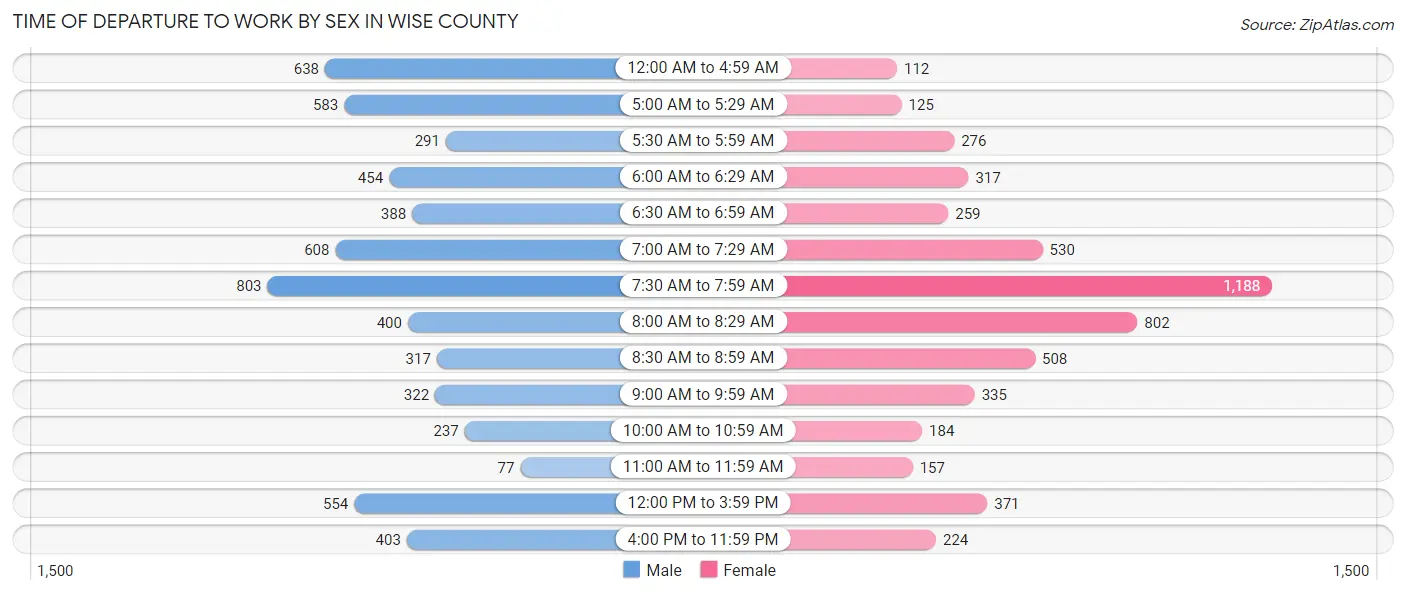
| Time of Departure | Male | Female |
| 12:00 AM to 4:59 AM | 638 (10.5%) | 112 (2.1%) |
| 5:00 AM to 5:29 AM | 583 (9.6%) | 125 (2.3%) |
| 5:30 AM to 5:59 AM | 291 (4.8%) | 276 (5.1%) |
| 6:00 AM to 6:29 AM | 454 (7.5%) | 317 (5.9%) |
| 6:30 AM to 6:59 AM | 388 (6.4%) | 259 (4.8%) |
| 7:00 AM to 7:29 AM | 608 (10.0%) | 530 (9.8%) |
| 7:30 AM to 7:59 AM | 803 (13.2%) | 1,188 (22.1%) |
| 8:00 AM to 8:29 AM | 400 (6.6%) | 802 (14.9%) |
| 8:30 AM to 8:59 AM | 317 (5.2%) | 508 (9.4%) |
| 9:00 AM to 9:59 AM | 322 (5.3%) | 335 (6.2%) |
| 10:00 AM to 10:59 AM | 237 (3.9%) | 184 (3.4%) |
| 11:00 AM to 11:59 AM | 77 (1.3%) | 157 (2.9%) |
| 12:00 PM to 3:59 PM | 554 (9.1%) | 371 (6.9%) |
| 4:00 PM to 11:59 PM | 403 (6.6%) | 224 (4.2%) |
| Total | 6,075 (100.0%) | 5,388 (100.0%) |
Housing Occupancy in Wise County
Occupancy by Ownership in Wise County
Of the total 14,052 dwellings in Wise County, owner-occupied units account for 9,882 (70.3%), while renter-occupied units make up 4,170 (29.7%).
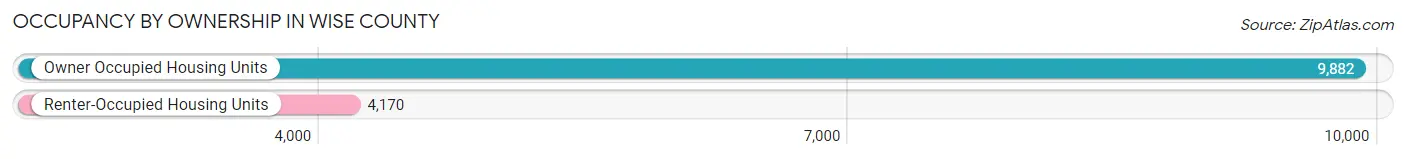
| Occupancy | # Housing Units | % Housing Units |
| Owner Occupied Housing Units | 9,882 | 70.3% |
| Renter-Occupied Housing Units | 4,170 | 29.7% |
| Total Occupied Housing Units | 14,052 | 100.0% |
Occupancy by Household Size in Wise County
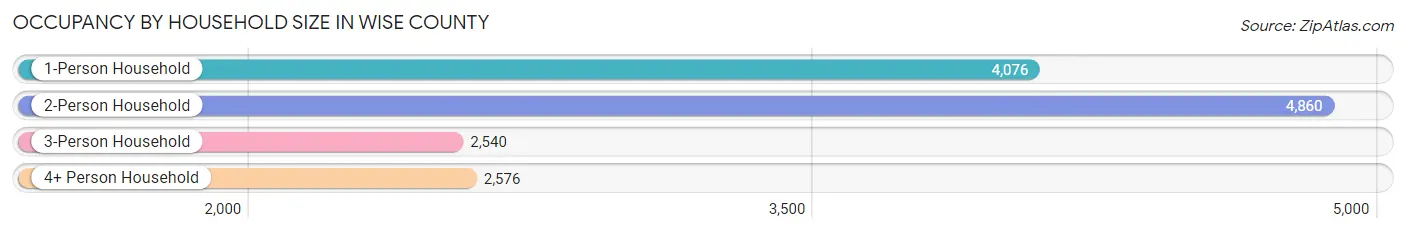
| Household Size | # Housing Units | % Housing Units |
| 1-Person Household | 4,076 | 29.0% |
| 2-Person Household | 4,860 | 34.6% |
| 3-Person Household | 2,540 | 18.1% |
| 4+ Person Household | 2,576 | 18.3% |
| Total Housing Units | 14,052 | 100.0% |
Occupancy by Ownership by Household Size in Wise County
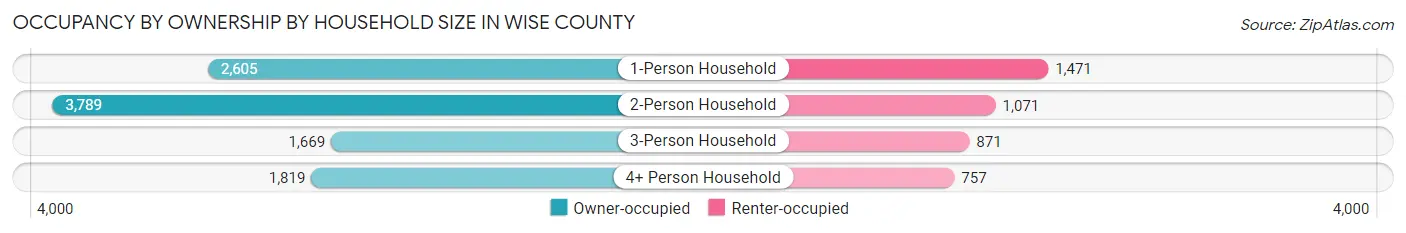
| Household Size | Owner-occupied | Renter-occupied |
| 1-Person Household | 2,605 (63.9%) | 1,471 (36.1%) |
| 2-Person Household | 3,789 (78.0%) | 1,071 (22.0%) |
| 3-Person Household | 1,669 (65.7%) | 871 (34.3%) |
| 4+ Person Household | 1,819 (70.6%) | 757 (29.4%) |
| Total Housing Units | 9,882 (70.3%) | 4,170 (29.7%) |
Occupancy by Educational Attainment in Wise County
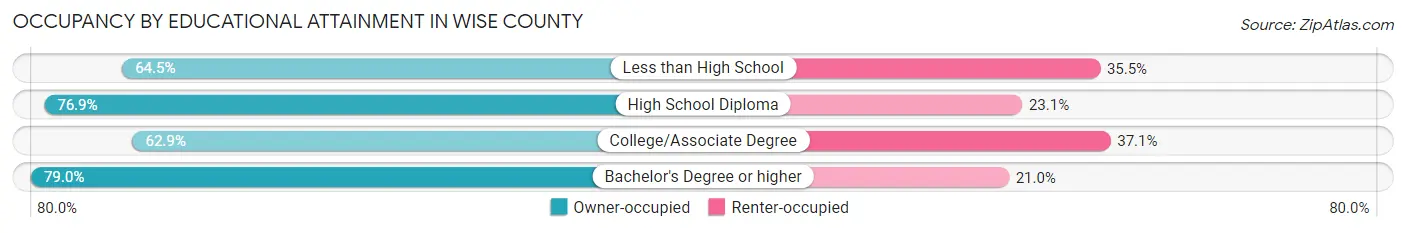
| Household Size | Owner-occupied | Renter-occupied |
| Less than High School | 1,756 (64.5%) | 966 (35.5%) |
| High School Diploma | 3,277 (76.9%) | 986 (23.1%) |
| College/Associate Degree | 2,858 (62.9%) | 1,688 (37.1%) |
| Bachelor's Degree or higher | 1,991 (79.0%) | 530 (21.0%) |
Occupancy by Age of Householder in Wise County
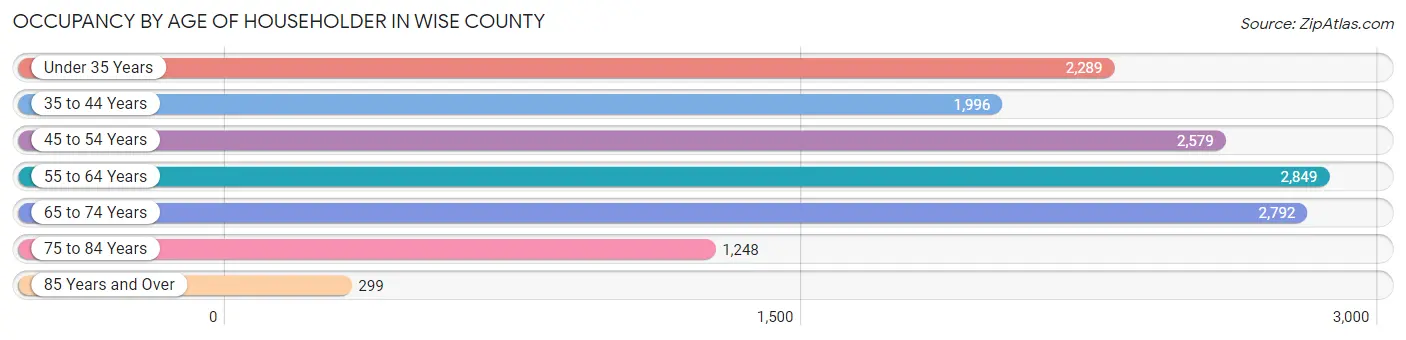
| Age Bracket | # Households | % Households |
| Under 35 Years | 2,289 | 16.3% |
| 35 to 44 Years | 1,996 | 14.2% |
| 45 to 54 Years | 2,579 | 18.3% |
| 55 to 64 Years | 2,849 | 20.3% |
| 65 to 74 Years | 2,792 | 19.9% |
| 75 to 84 Years | 1,248 | 8.9% |
| 85 Years and Over | 299 | 2.1% |
| Total | 14,052 | 100.0% |
Housing Finances in Wise County
Median Income by Occupancy in Wise County
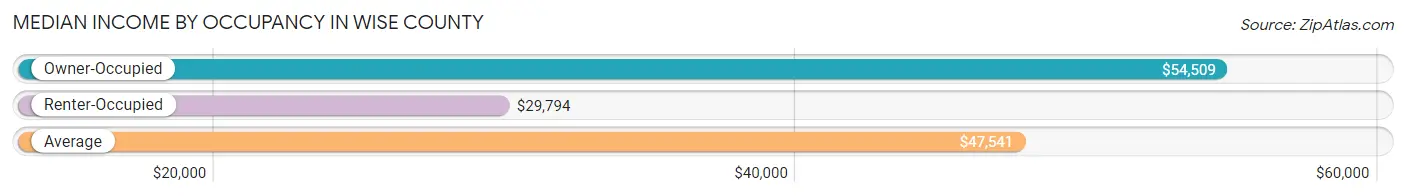
| Occupancy Type | # Households | Median Income |
| Owner-Occupied | 9,882 (70.3%) | $54,509 |
| Renter-Occupied | 4,170 (29.7%) | $29,794 |
| Average | 14,052 (100.0%) | $47,541 |
Occupancy by Householder Income Bracket in Wise County
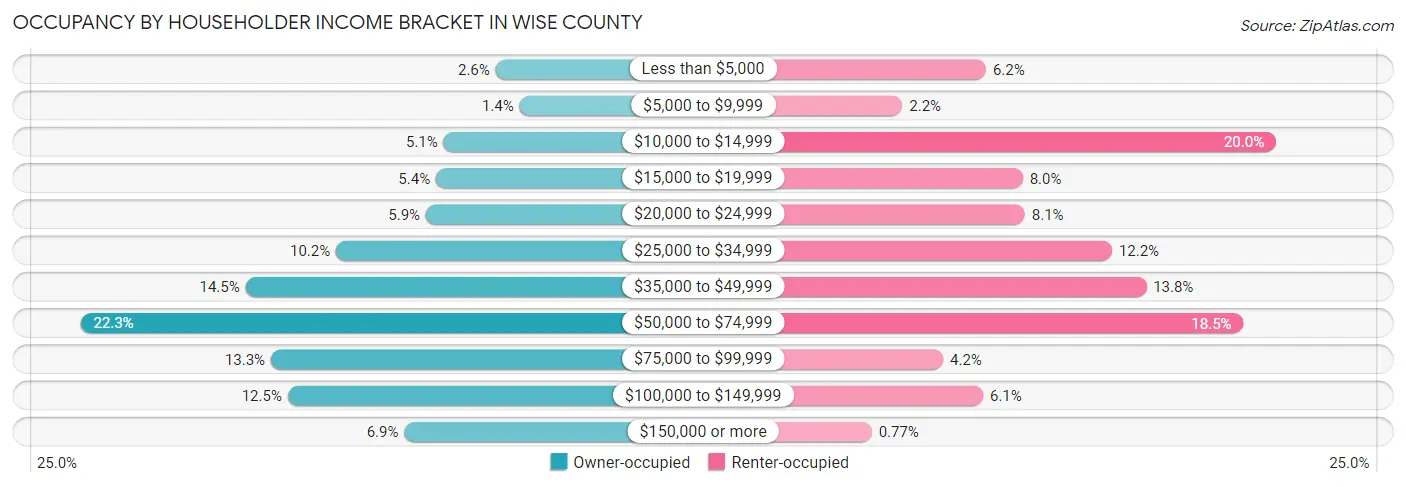
| Income Bracket | Owner-occupied | Renter-occupied |
| Less than $5,000 | 254 (2.6%) | 259 (6.2%) |
| $5,000 to $9,999 | 141 (1.4%) | 93 (2.2%) |
| $10,000 to $14,999 | 499 (5.1%) | 835 (20.0%) |
| $15,000 to $19,999 | 535 (5.4%) | 332 (8.0%) |
| $20,000 to $24,999 | 582 (5.9%) | 336 (8.1%) |
| $25,000 to $34,999 | 1,005 (10.2%) | 509 (12.2%) |
| $35,000 to $49,999 | 1,431 (14.5%) | 577 (13.8%) |
| $50,000 to $74,999 | 2,208 (22.3%) | 770 (18.5%) |
| $75,000 to $99,999 | 1,311 (13.3%) | 174 (4.2%) |
| $100,000 to $149,999 | 1,232 (12.5%) | 253 (6.1%) |
| $150,000 or more | 684 (6.9%) | 32 (0.8%) |
| Total | 9,882 (100.0%) | 4,170 (100.0%) |
Monthly Housing Cost Tiers in Wise County
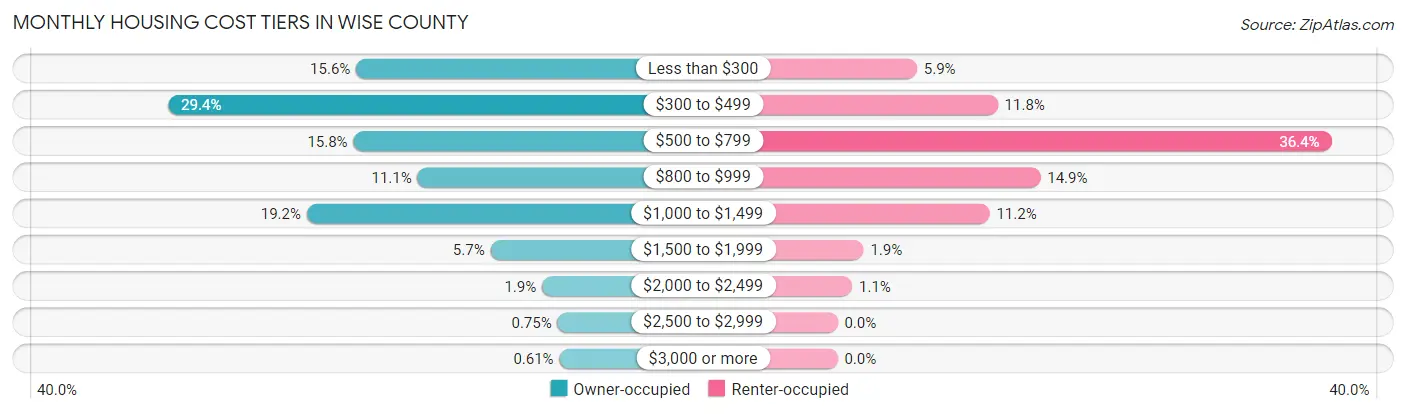
| Monthly Cost | Owner-occupied | Renter-occupied |
| Less than $300 | 1,540 (15.6%) | 244 (5.9%) |
| $300 to $499 | 2,908 (29.4%) | 492 (11.8%) |
| $500 to $799 | 1,559 (15.8%) | 1,517 (36.4%) |
| $800 to $999 | 1,093 (11.1%) | 623 (14.9%) |
| $1,000 to $1,499 | 1,899 (19.2%) | 467 (11.2%) |
| $1,500 to $1,999 | 562 (5.7%) | 80 (1.9%) |
| $2,000 to $2,499 | 187 (1.9%) | 45 (1.1%) |
| $2,500 to $2,999 | 74 (0.7%) | 0 (0.0%) |
| $3,000 or more | 60 (0.6%) | 0 (0.0%) |
| Total | 9,882 (100.0%) | 4,170 (100.0%) |
Physical Housing Characteristics in Wise County
Housing Structures in Wise County
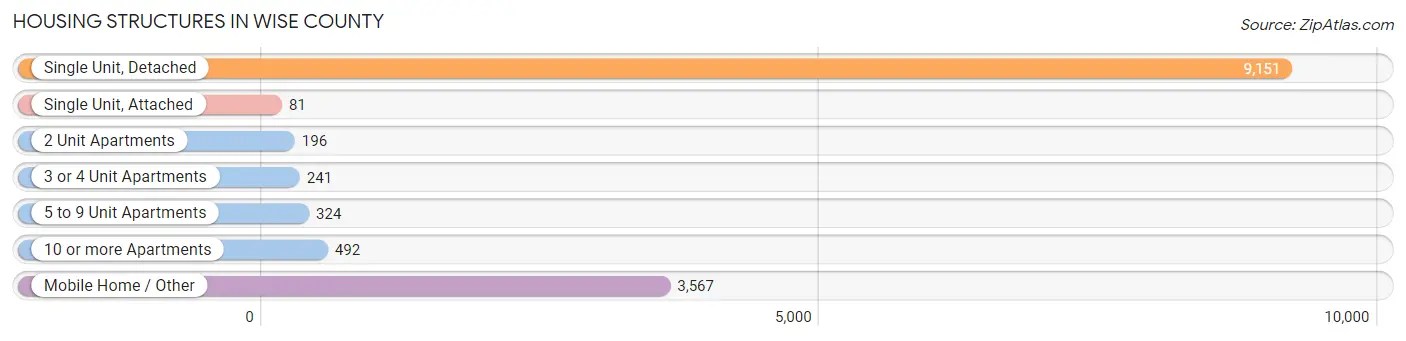
| Structure Type | # Housing Units | % Housing Units |
| Single Unit, Detached | 9,151 | 65.1% |
| Single Unit, Attached | 81 | 0.6% |
| 2 Unit Apartments | 196 | 1.4% |
| 3 or 4 Unit Apartments | 241 | 1.7% |
| 5 to 9 Unit Apartments | 324 | 2.3% |
| 10 or more Apartments | 492 | 3.5% |
| Mobile Home / Other | 3,567 | 25.4% |
| Total | 14,052 | 100.0% |
Housing Structures by Occupancy in Wise County
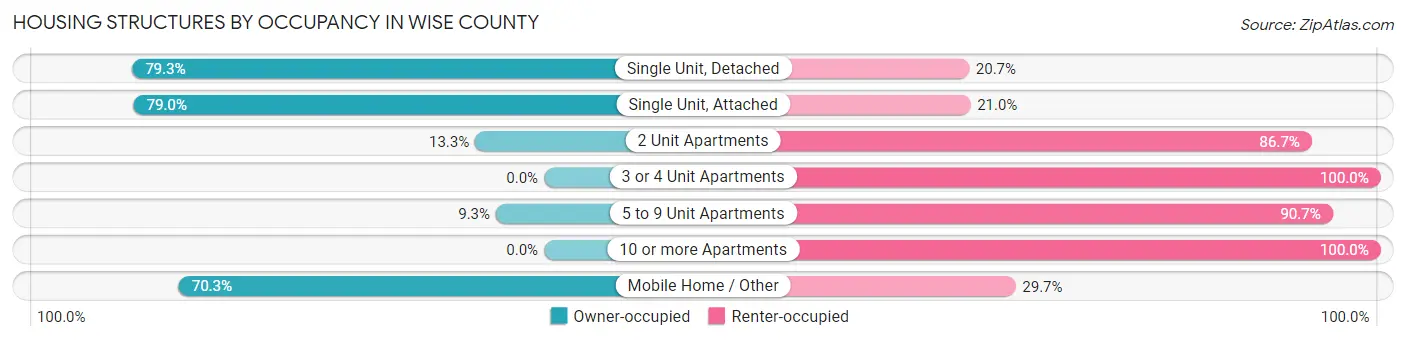
| Structure Type | Owner-occupied | Renter-occupied |
| Single Unit, Detached | 7,254 (79.3%) | 1,897 (20.7%) |
| Single Unit, Attached | 64 (79.0%) | 17 (21.0%) |
| 2 Unit Apartments | 26 (13.3%) | 170 (86.7%) |
| 3 or 4 Unit Apartments | 0 (0.0%) | 241 (100.0%) |
| 5 to 9 Unit Apartments | 30 (9.3%) | 294 (90.7%) |
| 10 or more Apartments | 0 (0.0%) | 492 (100.0%) |
| Mobile Home / Other | 2,508 (70.3%) | 1,059 (29.7%) |
| Total | 9,882 (70.3%) | 4,170 (29.7%) |
Housing Structures by Number of Rooms in Wise County
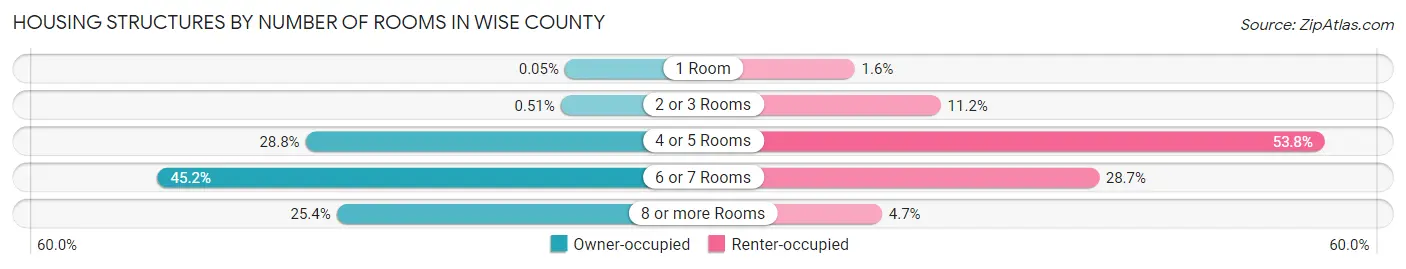
| Number of Rooms | Owner-occupied | Renter-occupied |
| 1 Room | 5 (0.1%) | 68 (1.6%) |
| 2 or 3 Rooms | 50 (0.5%) | 466 (11.2%) |
| 4 or 5 Rooms | 2,849 (28.8%) | 2,244 (53.8%) |
| 6 or 7 Rooms | 4,470 (45.2%) | 1,198 (28.7%) |
| 8 or more Rooms | 2,508 (25.4%) | 194 (4.6%) |
| Total | 9,882 (100.0%) | 4,170 (100.0%) |
Housing Structure by Heating Type in Wise County
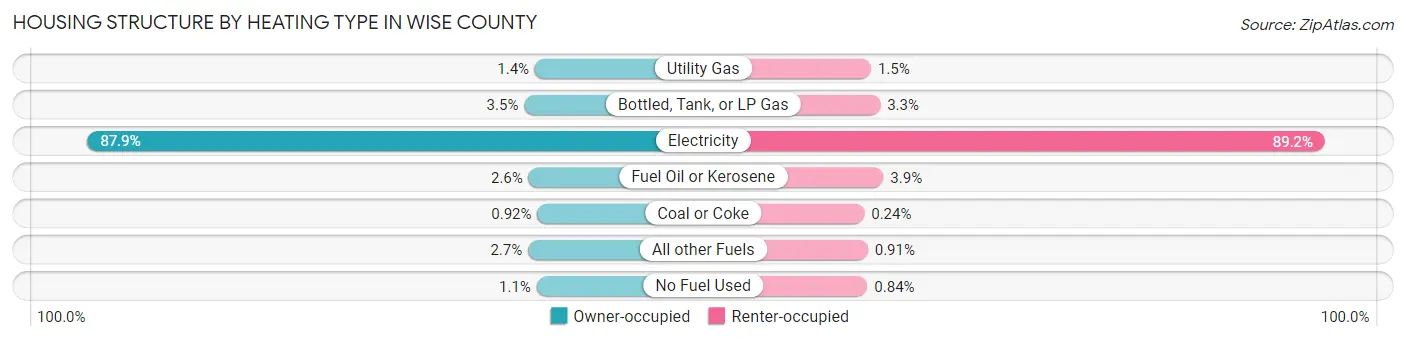
| Heating Type | Owner-occupied | Renter-occupied |
| Utility Gas | 137 (1.4%) | 64 (1.5%) |
| Bottled, Tank, or LP Gas | 341 (3.5%) | 138 (3.3%) |
| Electricity | 8,683 (87.9%) | 3,721 (89.2%) |
| Fuel Oil or Kerosene | 258 (2.6%) | 164 (3.9%) |
| Coal or Coke | 91 (0.9%) | 10 (0.2%) |
| All other Fuels | 268 (2.7%) | 38 (0.9%) |
| No Fuel Used | 104 (1.1%) | 35 (0.8%) |
| Total | 9,882 (100.0%) | 4,170 (100.0%) |
Household Vehicle Usage in Wise County
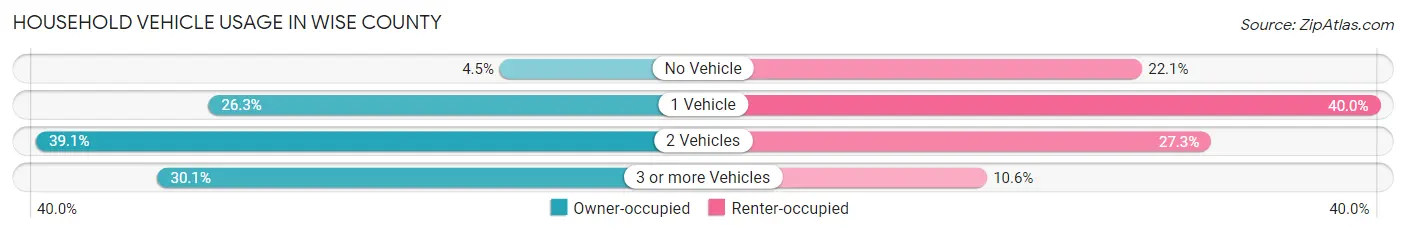
| Vehicles per Household | Owner-occupied | Renter-occupied |
| No Vehicle | 446 (4.5%) | 923 (22.1%) |
| 1 Vehicle | 2,596 (26.3%) | 1,667 (40.0%) |
| 2 Vehicles | 3,868 (39.1%) | 1,140 (27.3%) |
| 3 or more Vehicles | 2,972 (30.1%) | 440 (10.5%) |
| Total | 9,882 (100.0%) | 4,170 (100.0%) |
Real Estate & Mortgages in Wise County
Real Estate and Mortgage Overview in Wise County
| Characteristic | Without Mortgage | With Mortgage |
| Housing Units | 5,555 | 4,327 |
| Median Property Value | $87,100 | $131,600 |
| Median Household Income | $45,785 | $408 |
| Monthly Housing Costs | $384 | $60 |
| Real Estate Taxes | $528 | $40 |
Property Value by Mortgage Status in Wise County
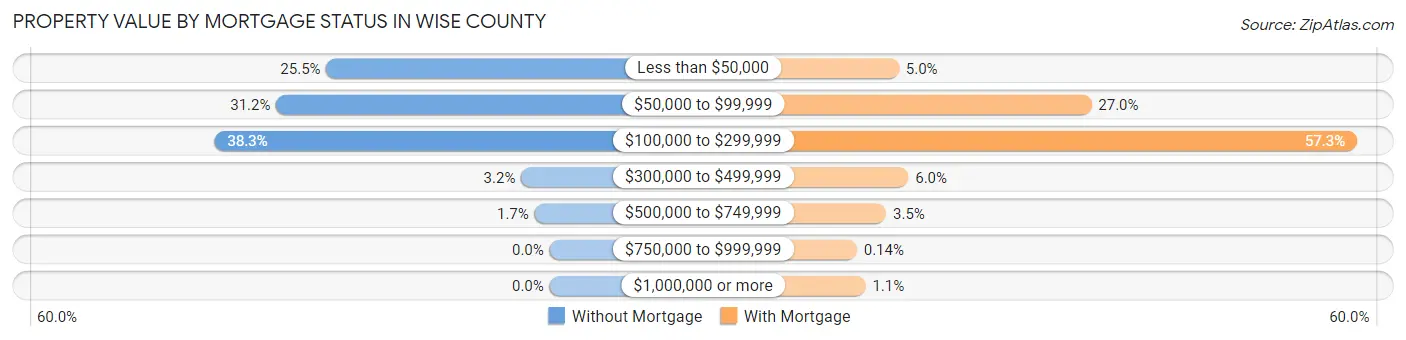
| Property Value | Without Mortgage | With Mortgage |
| Less than $50,000 | 1,417 (25.5%) | 214 (5.0%) |
| $50,000 to $99,999 | 1,735 (31.2%) | 1,166 (27.0%) |
| $100,000 to $299,999 | 2,128 (38.3%) | 2,480 (57.3%) |
| $300,000 to $499,999 | 180 (3.2%) | 261 (6.0%) |
| $500,000 to $749,999 | 95 (1.7%) | 151 (3.5%) |
| $750,000 to $999,999 | 0 (0.0%) | 6 (0.1%) |
| $1,000,000 or more | 0 (0.0%) | 49 (1.1%) |
| Total | 5,555 (100.0%) | 4,327 (100.0%) |
Household Income by Mortgage Status in Wise County
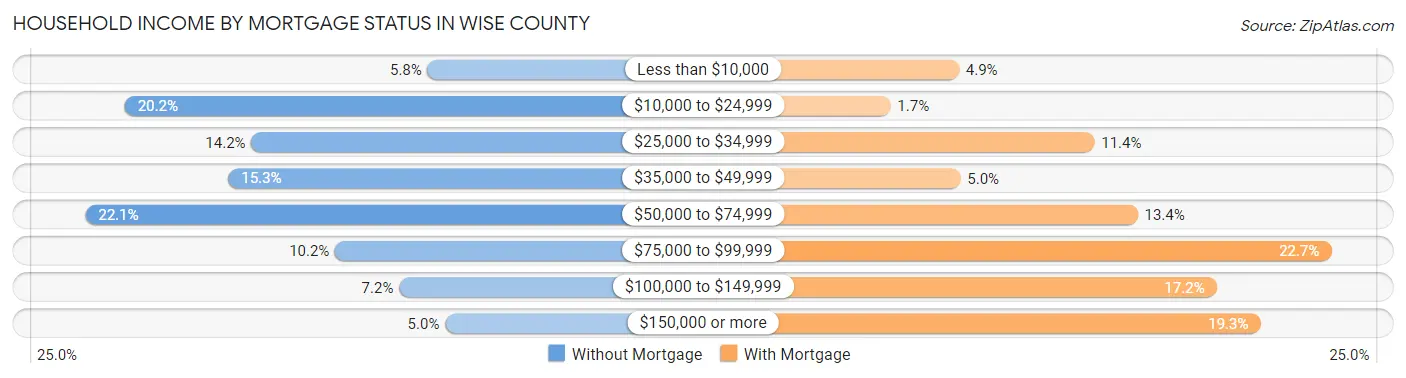
| Household Income | Without Mortgage | With Mortgage |
| Less than $10,000 | 323 (5.8%) | 213 (4.9%) |
| $10,000 to $24,999 | 1,124 (20.2%) | 72 (1.7%) |
| $25,000 to $34,999 | 789 (14.2%) | 492 (11.4%) |
| $35,000 to $49,999 | 850 (15.3%) | 216 (5.0%) |
| $50,000 to $74,999 | 1,228 (22.1%) | 581 (13.4%) |
| $75,000 to $99,999 | 567 (10.2%) | 980 (22.7%) |
| $100,000 to $149,999 | 398 (7.2%) | 744 (17.2%) |
| $150,000 or more | 276 (5.0%) | 834 (19.3%) |
| Total | 5,555 (100.0%) | 4,327 (100.0%) |
Property Value to Household Income Ratio in Wise County
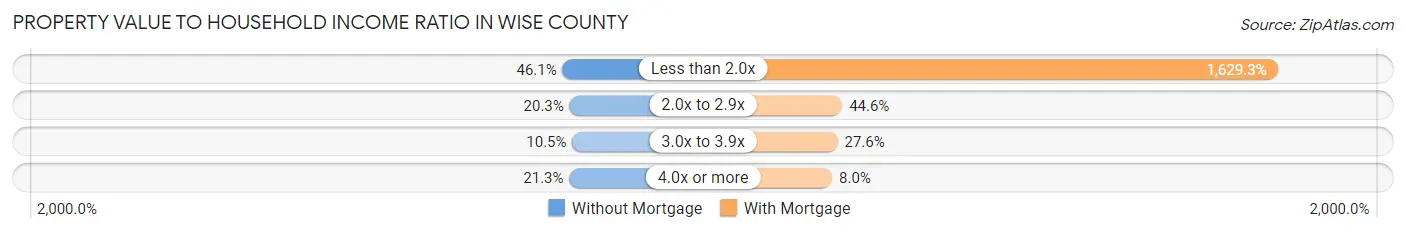
| Value-to-Income Ratio | Without Mortgage | With Mortgage |
| Less than 2.0x | 2,563 (46.1%) | 70,498 (1,629.3%) |
| 2.0x to 2.9x | 1,129 (20.3%) | 1,928 (44.6%) |
| 3.0x to 3.9x | 581 (10.5%) | 1,194 (27.6%) |
| 4.0x or more | 1,185 (21.3%) | 346 (8.0%) |
| Total | 5,555 (100.0%) | 4,327 (100.0%) |
Real Estate Taxes by Mortgage Status in Wise County
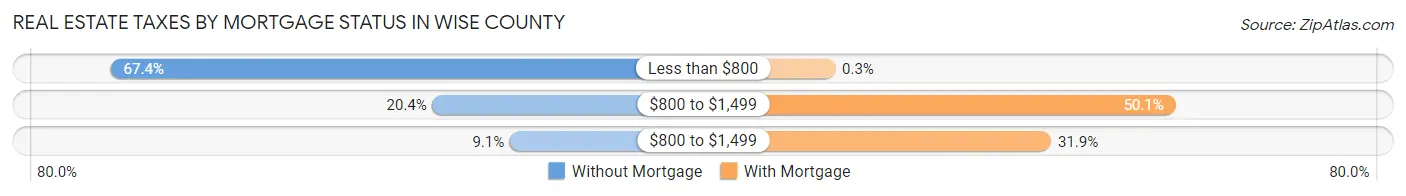
| Property Taxes | Without Mortgage | With Mortgage |
| Less than $800 | 3,745 (67.4%) | 13 (0.3%) |
| $800 to $1,499 | 1,132 (20.4%) | 2,166 (50.1%) |
| $800 to $1,499 | 504 (9.1%) | 1,378 (31.9%) |
| Total | 5,555 (100.0%) | 4,327 (100.0%) |
Health & Disability in Wise County
Health Insurance Coverage by Age in Wise County
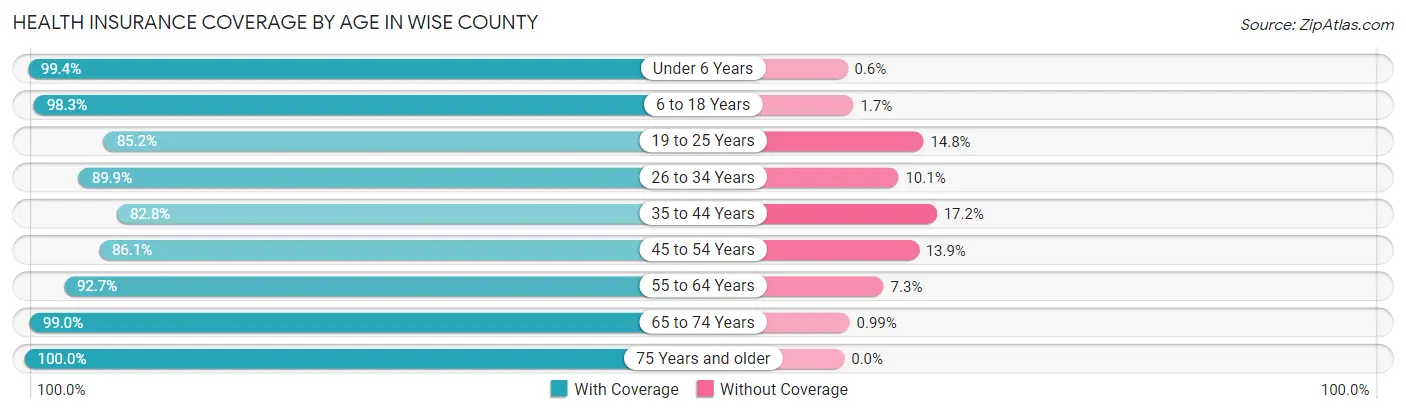
| Age Bracket | With Coverage | Without Coverage |
| Under 6 Years | 1,989 (99.4%) | 12 (0.6%) |
| 6 to 18 Years | 5,113 (98.3%) | 89 (1.7%) |
| 19 to 25 Years | 2,646 (85.2%) | 458 (14.8%) |
| 26 to 34 Years | 3,164 (89.9%) | 356 (10.1%) |
| 35 to 44 Years | 3,330 (82.8%) | 693 (17.2%) |
| 45 to 54 Years | 3,923 (86.1%) | 632 (13.9%) |
| 55 to 64 Years | 4,428 (92.7%) | 351 (7.3%) |
| 65 to 74 Years | 4,205 (99.0%) | 42 (1.0%) |
| 75 Years and older | 2,380 (100.0%) | 0 (0.0%) |
| Total | 31,178 (92.2%) | 2,633 (7.8%) |
Health Insurance Coverage by Citizenship Status in Wise County
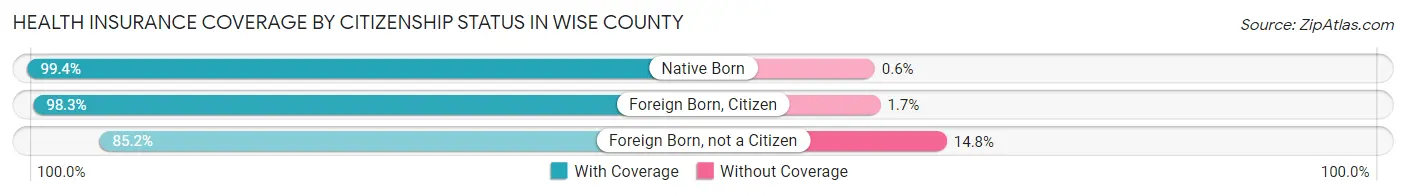
| Citizenship Status | With Coverage | Without Coverage |
| Native Born | 1,989 (99.4%) | 12 (0.6%) |
| Foreign Born, Citizen | 5,113 (98.3%) | 89 (1.7%) |
| Foreign Born, not a Citizen | 2,646 (85.2%) | 458 (14.8%) |
Health Insurance Coverage by Household Income in Wise County
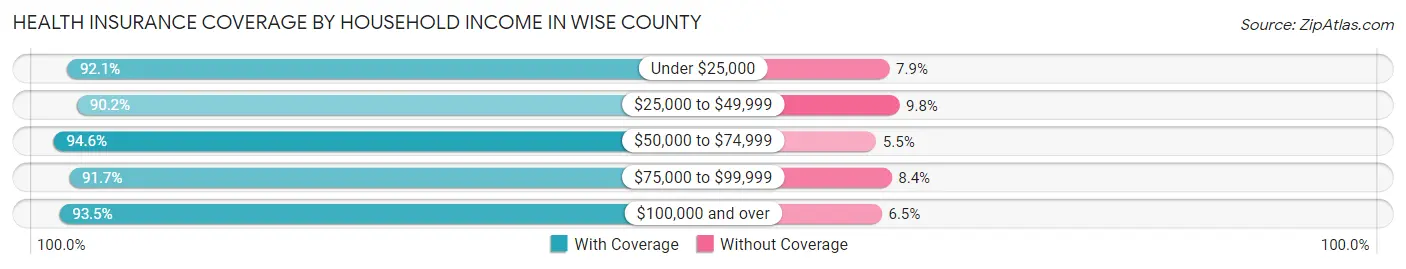
| Household Income | With Coverage | Without Coverage |
| Under $25,000 | 6,260 (92.1%) | 540 (7.9%) |
| $25,000 to $49,999 | 7,228 (90.2%) | 785 (9.8%) |
| $50,000 to $74,999 | 6,803 (94.6%) | 392 (5.4%) |
| $75,000 to $99,999 | 4,172 (91.6%) | 380 (8.4%) |
| $100,000 and over | 6,144 (93.5%) | 428 (6.5%) |
Public vs Private Health Insurance Coverage by Age in Wise County
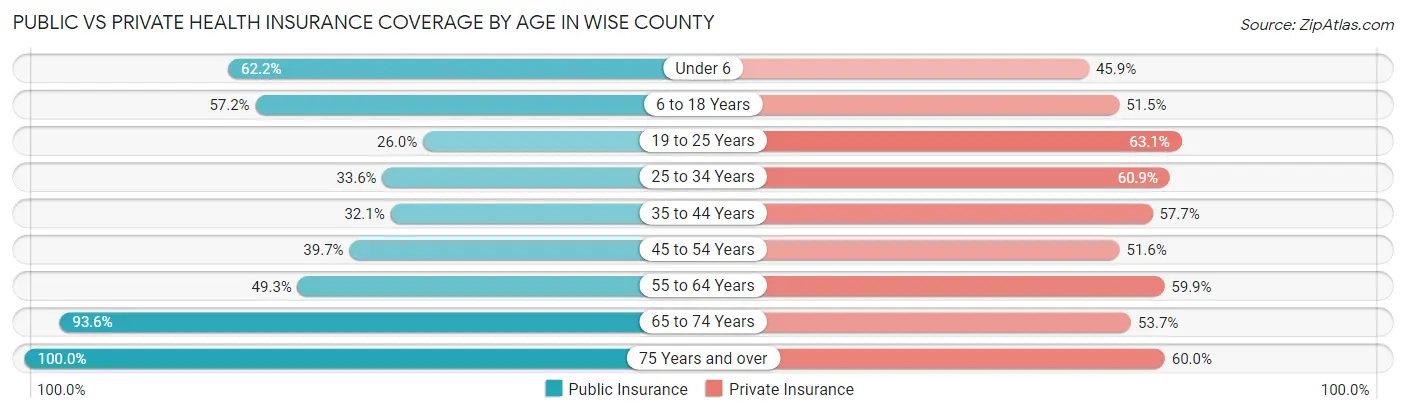
| Age Bracket | Public Insurance | Private Insurance |
| Under 6 | 1,245 (62.2%) | 918 (45.9%) |
| 6 to 18 Years | 2,973 (57.2%) | 2,679 (51.5%) |
| 19 to 25 Years | 808 (26.0%) | 1,958 (63.1%) |
| 25 to 34 Years | 1,182 (33.6%) | 2,143 (60.9%) |
| 35 to 44 Years | 1,291 (32.1%) | 2,320 (57.7%) |
| 45 to 54 Years | 1,809 (39.7%) | 2,348 (51.5%) |
| 55 to 64 Years | 2,357 (49.3%) | 2,861 (59.9%) |
| 65 to 74 Years | 3,973 (93.5%) | 2,281 (53.7%) |
| 75 Years and over | 2,380 (100.0%) | 1,427 (60.0%) |
| Total | 18,018 (53.3%) | 18,935 (56.0%) |
Disability Status by Sex by Age in Wise County
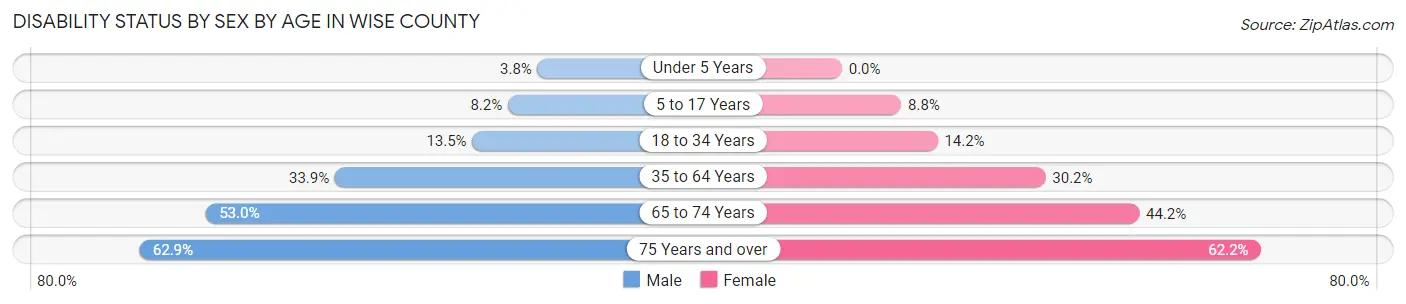
| Age Bracket | Male | Female |
| Under 5 Years | 32 (3.8%) | 0 (0.0%) |
| 5 to 17 Years | 214 (8.2%) | 233 (8.8%) |
| 18 to 34 Years | 488 (13.5%) | 476 (14.2%) |
| 35 to 64 Years | 2,234 (33.9%) | 2,046 (30.2%) |
| 65 to 74 Years | 1,087 (53.0%) | 970 (44.2%) |
| 75 Years and over | 664 (62.9%) | 823 (62.2%) |
Disability Class by Sex by Age in Wise County
Disability Class: Hearing Difficulty
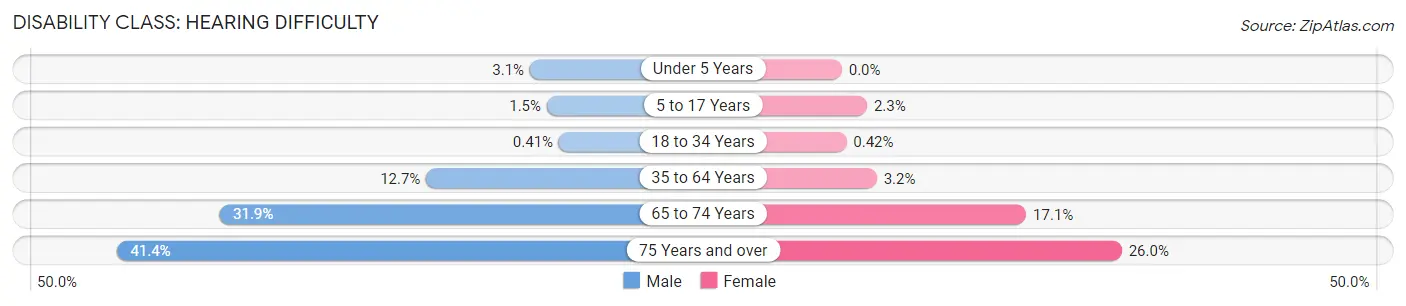
| Age Bracket | Male | Female |
| Under 5 Years | 26 (3.1%) | 0 (0.0%) |
| 5 to 17 Years | 40 (1.5%) | 62 (2.3%) |
| 18 to 34 Years | 15 (0.4%) | 14 (0.4%) |
| 35 to 64 Years | 839 (12.7%) | 219 (3.2%) |
| 65 to 74 Years | 653 (31.9%) | 376 (17.1%) |
| 75 Years and over | 437 (41.4%) | 344 (26.0%) |
Disability Class: Vision Difficulty
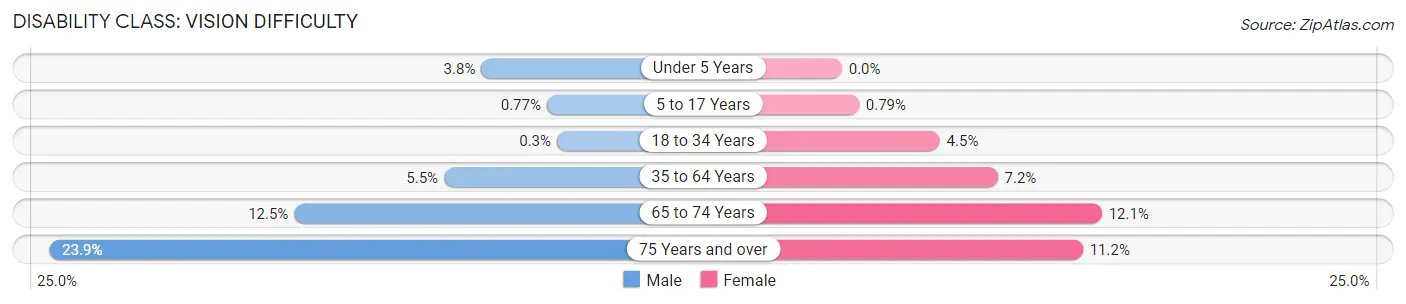
| Age Bracket | Male | Female |
| Under 5 Years | 32 (3.8%) | 0 (0.0%) |
| 5 to 17 Years | 20 (0.8%) | 21 (0.8%) |
| 18 to 34 Years | 11 (0.3%) | 152 (4.5%) |
| 35 to 64 Years | 365 (5.5%) | 489 (7.2%) |
| 65 to 74 Years | 256 (12.5%) | 265 (12.1%) |
| 75 Years and over | 252 (23.9%) | 148 (11.2%) |
Disability Class: Cognitive Difficulty
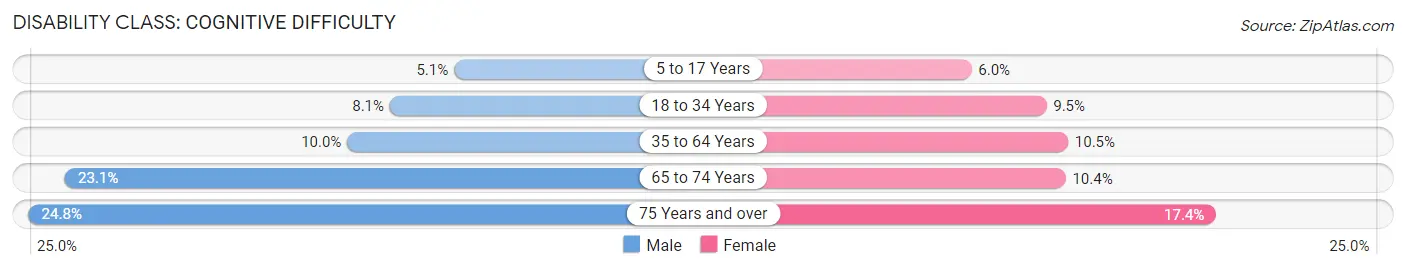
| Age Bracket | Male | Female |
| 5 to 17 Years | 132 (5.1%) | 159 (6.0%) |
| 18 to 34 Years | 291 (8.1%) | 318 (9.5%) |
| 35 to 64 Years | 661 (10.0%) | 710 (10.5%) |
| 65 to 74 Years | 474 (23.1%) | 228 (10.4%) |
| 75 Years and over | 262 (24.8%) | 230 (17.4%) |
Disability Class: Ambulatory Difficulty
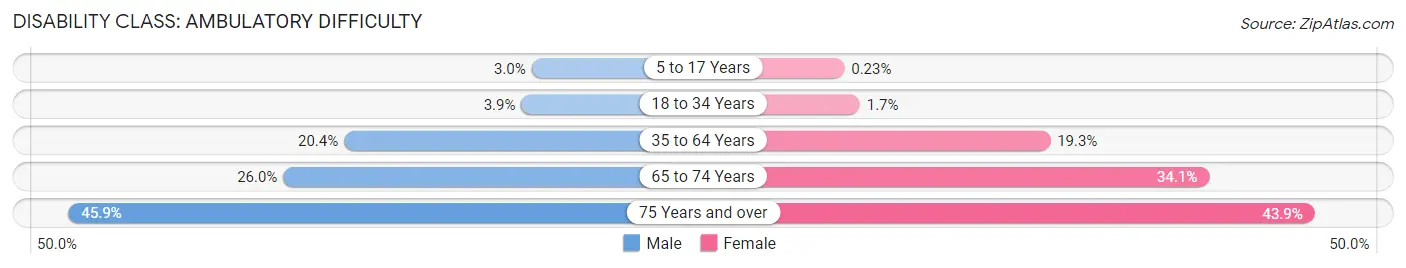
| Age Bracket | Male | Female |
| 5 to 17 Years | 77 (2.9%) | 6 (0.2%) |
| 18 to 34 Years | 141 (3.9%) | 56 (1.7%) |
| 35 to 64 Years | 1,341 (20.3%) | 1,309 (19.3%) |
| 65 to 74 Years | 533 (26.0%) | 749 (34.1%) |
| 75 Years and over | 485 (45.9%) | 581 (43.9%) |
Disability Class: Self-Care Difficulty
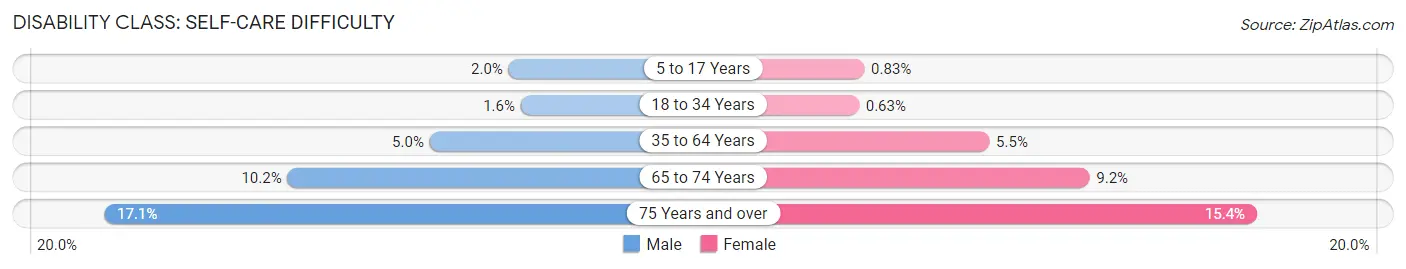
| Age Bracket | Male | Female |
| 5 to 17 Years | 53 (2.0%) | 22 (0.8%) |
| 18 to 34 Years | 57 (1.6%) | 21 (0.6%) |
| 35 to 64 Years | 327 (5.0%) | 370 (5.5%) |
| 65 to 74 Years | 210 (10.2%) | 202 (9.2%) |
| 75 Years and over | 180 (17.1%) | 204 (15.4%) |
Technology Access in Wise County
Computing Device Access in Wise County
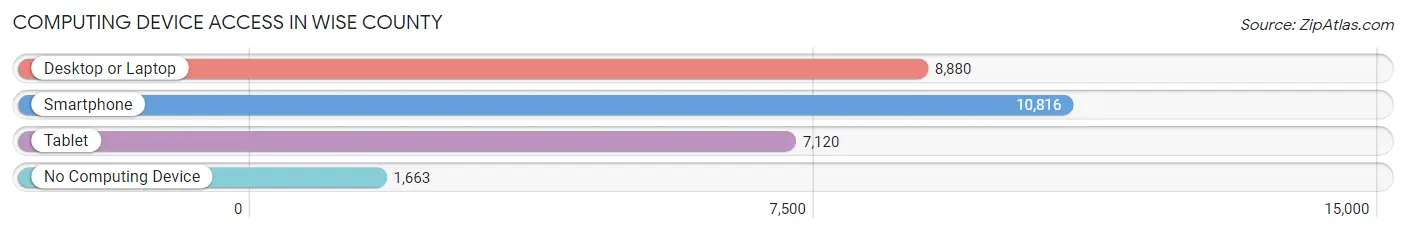
| Device Type | # Households | % Households |
| Desktop or Laptop | 8,880 | 63.2% |
| Smartphone | 10,816 | 77.0% |
| Tablet | 7,120 | 50.7% |
| No Computing Device | 1,663 | 11.8% |
| Total | 14,052 | 100.0% |
Internet Access in Wise County
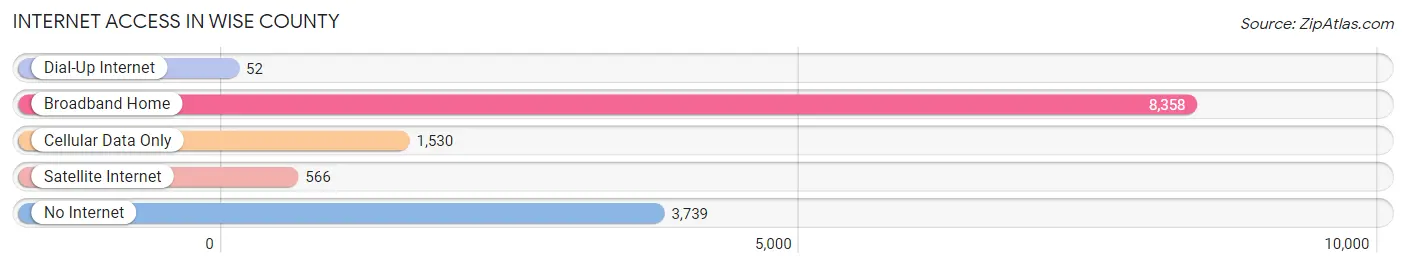
| Internet Type | # Households | % Households |
| Dial-Up Internet | 52 | 0.4% |
| Broadband Home | 8,358 | 59.5% |
| Cellular Data Only | 1,530 | 10.9% |
| Satellite Internet | 566 | 4.0% |
| No Internet | 3,739 | 26.6% |
| Total | 14,052 | 100.0% |
Wise County Summary
Wise County, Virginia is located in the southwestern corner of the state, and is part of the Appalachian region. It is bordered by Kentucky to the west, Tennessee to the south, and Virginia’s Russell and Scott counties to the east and north, respectively. The county seat is Wise, and the county is home to a population of approximately 41,000 people.
Geography
Wise County is situated in the Appalachian Mountains, and is characterized by rugged terrain and steep slopes. The county is divided into two distinct regions: the Appalachian Plateau and the Cumberland Plateau. The Appalachian Plateau is located in the western part of the county, and is characterized by rolling hills and valleys. The Cumberland Plateau is located in the eastern part of the county, and is characterized by steep ridges and deep valleys. The county is home to several rivers, including the Clinch, Powell, and Big Sandy.
The county is home to several state parks, including Natural Tunnel State Park, which features a natural tunnel carved out of the limestone by the Clinch River. The county is also home to several national forests, including the Jefferson National Forest and the George Washington and Jefferson National Forests.
Economy
Wise County’s economy is largely based on agriculture and mining. The county is home to several large coal mines, and is the largest coal-producing county in Virginia. The county is also home to several large farms, and is a major producer of tobacco, corn, and hay.
The county is also home to several manufacturing companies, including a large furniture manufacturer, a large paper mill, and a large textile mill. The county is also home to several large retail stores, including Walmart, Kmart, and Lowe’s.
Demographics
As of the 2010 census, Wise County had a population of 41,452 people. The racial makeup of the county was 94.3% White, 2.7% African American, 0.3% Native American, 0.7% Asian, 0.1% Pacific Islander, 0.7% from other races, and 1.2% from two or more races. Hispanic or Latino of any race were 1.9% of the population.
The median income for a household in the county was $30,945, and the median income for a family was $37,945. The per capita income for the county was $17,845. About 17.2% of families and 21.2% of the population were below the poverty line, including 28.2% of those under age 18 and 16.2% of those age 65 or over.
Conclusion
Wise County, Virginia is a rural county located in the Appalachian region of the state. It is home to a population of approximately 41,000 people, and is largely based on agriculture and mining. The county is home to several state parks, national forests, and manufacturing companies, and has a median household income of $30,945. The county is also home to a diverse population, with 94.3% of the population being White, 2.7% African American, 0.3% Native American, 0.7% Asian, and 0.1% Pacific Islander.
Common Questions
What is Per Capita Income in Wise County?
Per Capita income in Wise County is $23,702.
What is the Median Family Income in Wise County?
Median Family Income in Wise County is $57,953.
What is the Median Household income in Wise County?
Median Household Income in Wise County is $47,541.
What is Income or Wage Gap in Wise County?
Income or Wage Gap in Wise County is 29.8%.
Women in Wise County earn 70.2 cents for every dollar earned by a man.
What is Family Income Deficit in Wise County?
Family Income Deficit in Wise County is $9,964.
Families that are below poverty line in Wise County earn $9,964 less on average than the poverty threshold level.
What is Inequality or Gini Index in Wise County?
Inequality or Gini Index in Wise County is 0.43.
What is the Total Population of Wise County?
Total Population of Wise County is 36,105.
What is the Total Male Population of Wise County?
Total Male Population of Wise County is 18,850.
What is the Total Female Population of Wise County?
Total Female Population of Wise County is 17,255.
What is the Ratio of Males per 100 Females in Wise County?
There are 109.24 Males per 100 Females in Wise County.
What is the Ratio of Females per 100 Males in Wise County?
There are 91.54 Females per 100 Males in Wise County.
What is the Median Population Age in Wise County?
Median Population Age in Wise County is 42.0 Years.
What is the Average Family Size in Wise County
Average Family Size in Wise County is 2.9 People.
What is the Average Household Size in Wise County
Average Household Size in Wise County is 2.4 People.
How Large is the Labor Force in Wise County?
There are 13,946 People in the Labor Forcein in Wise County.
What is the Percentage of People in the Labor Force in Wise County?
46.4% of People are in the Labor Force in Wise County.
What is the Unemployment Rate in Wise County?
Unemployment Rate in Wise County is 9.1%.