Westmoreland County, VA Map & Demographics
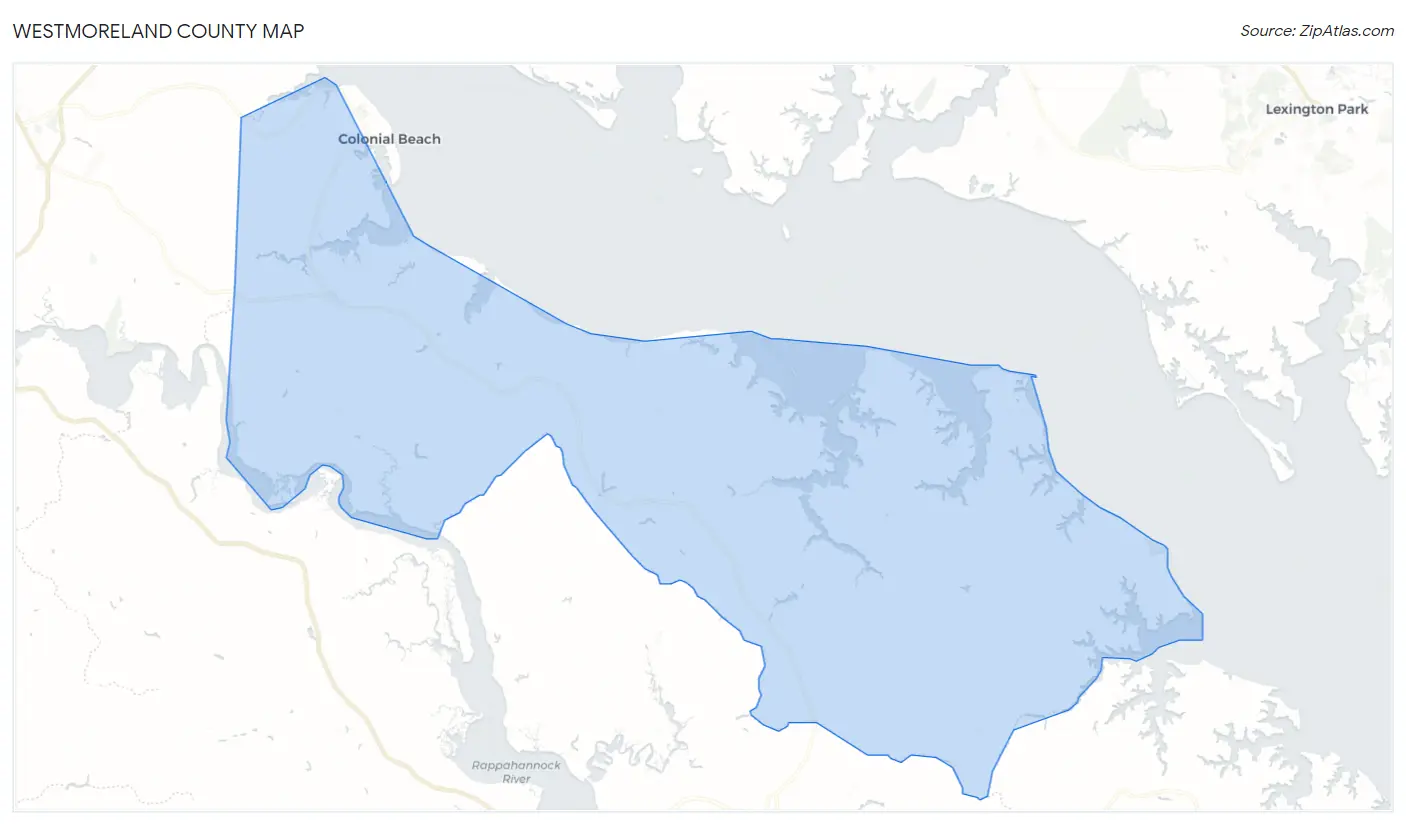
Westmoreland County Map
Westmoreland County Overview
$35,850
PER CAPITA INCOME
$79,034
AVG FAMILY INCOME
$56,647
AVG HOUSEHOLD INCOME
33.6%
WAGE / INCOME GAP [ % ]
66.4¢/ $1
WAGE / INCOME GAP [ $ ]
$16,320
FAMILY INCOME DEFICIT
0.49
INEQUALITY / GINI INDEX
18,480
TOTAL POPULATION
8,916
MALE POPULATION
9,564
FEMALE POPULATION
93.22
MALES / 100 FEMALES
107.27
FEMALES / 100 MALES
47.9
MEDIAN AGE
3.1
AVG FAMILY SIZE
2.3
AVG HOUSEHOLD SIZE
7,889
LABOR FORCE [ PEOPLE ]
51.0%
PERCENT IN LABOR FORCE
9.1%
UNEMPLOYMENT RATE
Westmoreland County Area Codes
Income in Westmoreland County
Income Overview in Westmoreland County
Per Capita Income in Westmoreland County is $35,850, while median incomes of families and households are $79,034 and $56,647 respectively.
| Characteristic | Number | Measure |
| Per Capita Income | 18,480 | $35,850 |
| Median Family Income | 4,552 | $79,034 |
| Mean Family Income | 4,552 | $103,947 |
| Median Household Income | 7,832 | $56,647 |
| Mean Household Income | 7,832 | $82,653 |
| Income Deficit | 4,552 | $16,320 |
| Wage / Income Gap (%) | 18,480 | 33.60% |
| Wage / Income Gap ($) | 18,480 | 66.40¢ per $1 |
| Gini / Inequality Index | 18,480 | 0.49 |
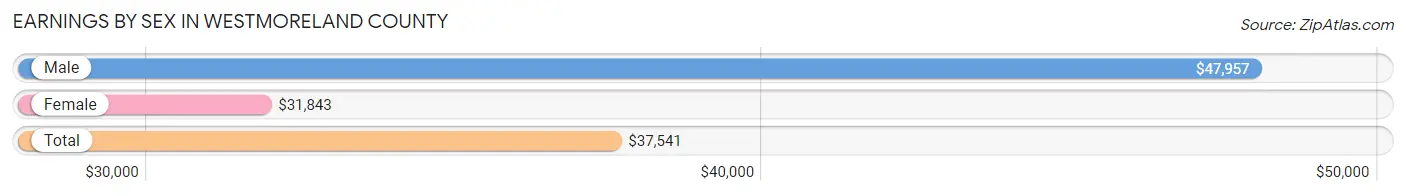
Earnings by Sex in Westmoreland County
Average Earnings in Westmoreland County are $37,541, $47,957 for men and $31,843 for women, a difference of 33.6%.
| Sex | Number | Average Earnings |
| Male | 4,058 (48.6%) | $47,957 |
| Female | 4,286 (51.4%) | $31,843 |
| Total | 8,344 (100.0%) | $37,541 |
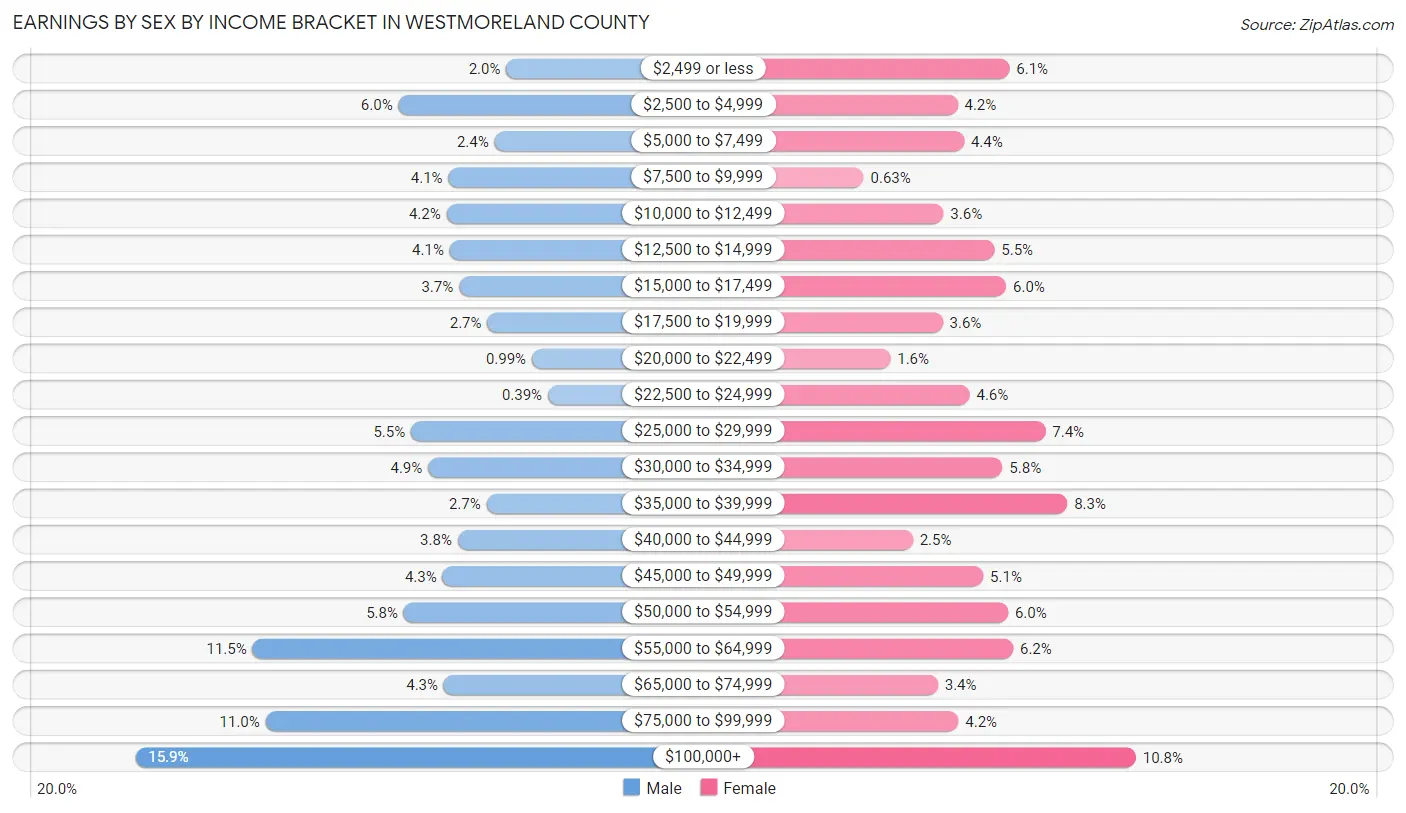
Earnings by Sex by Income Bracket in Westmoreland County
The most common earnings brackets in Westmoreland County are $100,000+ for men (643 | 15.9%) and $100,000+ for women (464 | 10.8%).
| Income | Male | Female |
| $2,499 or less | 79 (1.9%) | 261 (6.1%) |
| $2,500 to $4,999 | 243 (6.0%) | 178 (4.2%) |
| $5,000 to $7,499 | 97 (2.4%) | 188 (4.4%) |
| $7,500 to $9,999 | 167 (4.1%) | 27 (0.6%) |
| $10,000 to $12,499 | 170 (4.2%) | 155 (3.6%) |
| $12,500 to $14,999 | 165 (4.1%) | 237 (5.5%) |
| $15,000 to $17,499 | 151 (3.7%) | 256 (6.0%) |
| $17,500 to $19,999 | 108 (2.7%) | 154 (3.6%) |
| $20,000 to $22,499 | 40 (1.0%) | 70 (1.6%) |
| $22,500 to $24,999 | 16 (0.4%) | 197 (4.6%) |
| $25,000 to $29,999 | 224 (5.5%) | 319 (7.4%) |
| $30,000 to $34,999 | 198 (4.9%) | 250 (5.8%) |
| $35,000 to $39,999 | 109 (2.7%) | 354 (8.3%) |
| $40,000 to $44,999 | 153 (3.8%) | 106 (2.5%) |
| $45,000 to $49,999 | 176 (4.3%) | 219 (5.1%) |
| $50,000 to $54,999 | 235 (5.8%) | 259 (6.0%) |
| $55,000 to $64,999 | 465 (11.5%) | 267 (6.2%) |
| $65,000 to $74,999 | 174 (4.3%) | 146 (3.4%) |
| $75,000 to $99,999 | 445 (11.0%) | 179 (4.2%) |
| $100,000+ | 643 (15.9%) | 464 (10.8%) |
| Total | 4,058 (100.0%) | 4,286 (100.0%) |
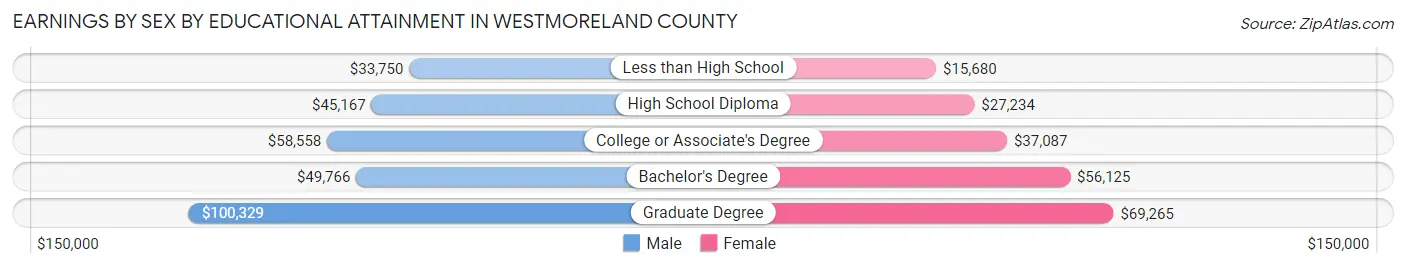
Earnings by Sex by Educational Attainment in Westmoreland County
Average earnings in Westmoreland County are $52,599 for men and $35,575 for women, a difference of 32.4%. Men with an educational attainment of graduate degree enjoy the highest average annual earnings of $100,329, while those with less than high school education earn the least with $33,750. Women with an educational attainment of graduate degree earn the most with the average annual earnings of $69,265, while those with less than high school education have the smallest earnings of $15,680.
| Educational Attainment | Male Income | Female Income |
| Less than High School | $33,750 | $15,680 |
| High School Diploma | $45,167 | $27,234 |
| College or Associate's Degree | $58,558 | $37,087 |
| Bachelor's Degree | $49,766 | $56,125 |
| Graduate Degree | $100,329 | $69,265 |
| Total | $52,599 | $35,575 |
Family Income in Westmoreland County
Family Income Brackets in Westmoreland County
According to the Westmoreland County family income data, there are 879 families falling into the $100,000 to $149,999 income range, which is the most common income bracket and makes up 19.3% of all families. Conversely, the $10,000 to $14,999 income bracket is the least frequent group with only 114 families (2.5%) belonging to this category.
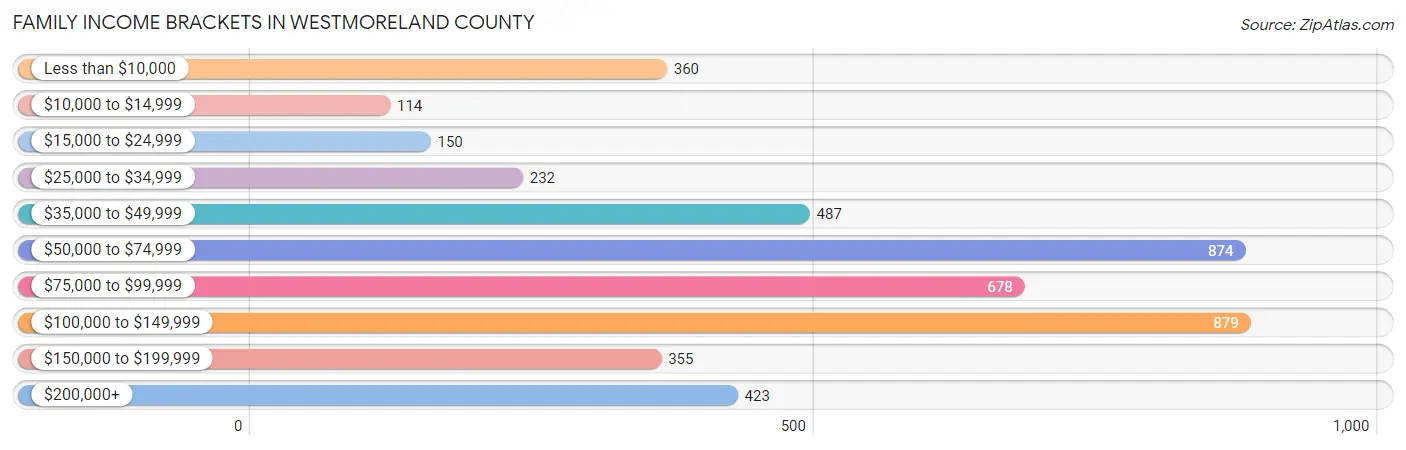
| Income Bracket | # Families | % Families |
| Less than $10,000 | 360 | 7.9% |
| $10,000 to $14,999 | 114 | 2.5% |
| $15,000 to $24,999 | 150 | 3.3% |
| $25,000 to $34,999 | 232 | 5.1% |
| $35,000 to $49,999 | 487 | 10.7% |
| $50,000 to $74,999 | 874 | 19.2% |
| $75,000 to $99,999 | 678 | 14.9% |
| $100,000 to $149,999 | 879 | 19.3% |
| $150,000 to $199,999 | 355 | 7.8% |
| $200,000+ | 423 | 9.3% |
Family Income by Famaliy Size in Westmoreland County
7+ person families (35 | 0.8%) account for the highest median family income in Westmoreland County with $148,438 per family, while 2-person families (2,328 | 51.1%) have the highest median income of $41,193 per family member.
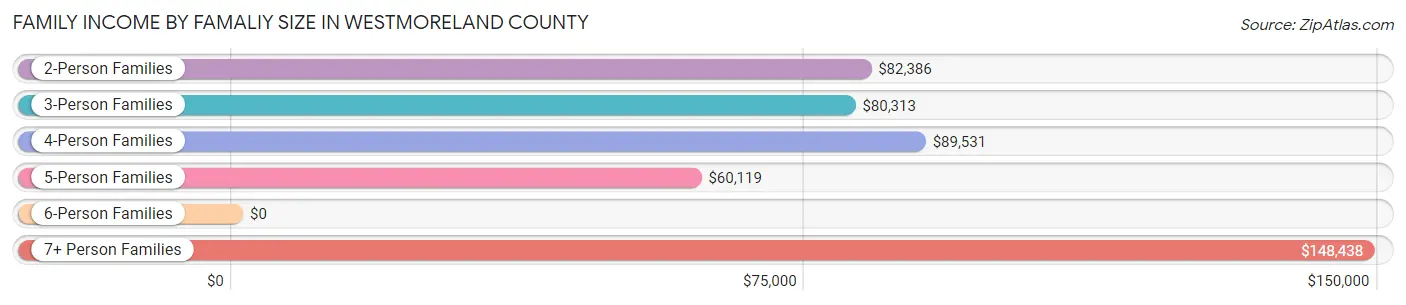
| Income Bracket | # Families | Median Income |
| 2-Person Families | 2,328 (51.1%) | $82,386 |
| 3-Person Families | 934 (20.5%) | $80,313 |
| 4-Person Families | 695 (15.3%) | $89,531 |
| 5-Person Families | 474 (10.4%) | $60,119 |
| 6-Person Families | 86 (1.9%) | $0 |
| 7+ Person Families | 35 (0.8%) | $148,438 |
| Total | 4,552 (100.0%) | $79,034 |
Family Income by Number of Earners in Westmoreland County
The median family income in Westmoreland County is $79,034, with families comprising 2 earners (1,694) having the highest median family income of $113,672, while families with no earners (1,189) have the lowest median family income of $44,432, accounting for 37.2% and 26.1% of families, respectively.
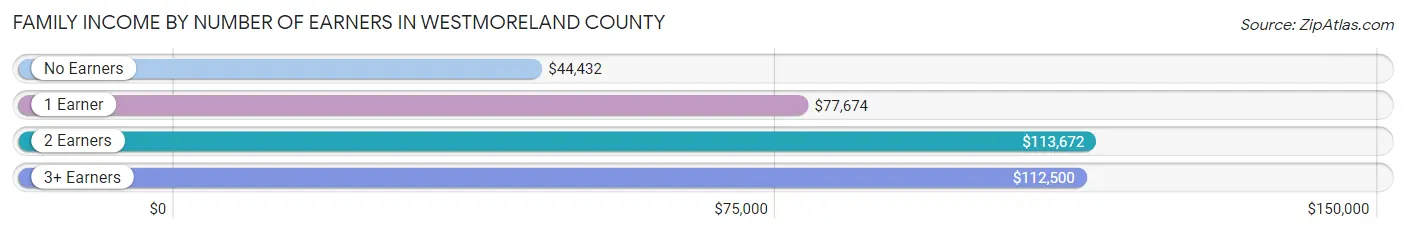
| Number of Earners | # Families | Median Income |
| No Earners | 1,189 (26.1%) | $44,432 |
| 1 Earner | 1,383 (30.4%) | $77,674 |
| 2 Earners | 1,694 (37.2%) | $113,672 |
| 3+ Earners | 286 (6.3%) | $112,500 |
| Total | 4,552 (100.0%) | $79,034 |
Household Income in Westmoreland County
Household Income Brackets in Westmoreland County
With 1,441 households falling in the category, the $50,000 to $74,999 income range is the most frequent in Westmoreland County, accounting for 18.4% of all households. In contrast, only 446 households (5.7%) fall into the $25,000 to $34,999 income bracket, making it the least populous group.
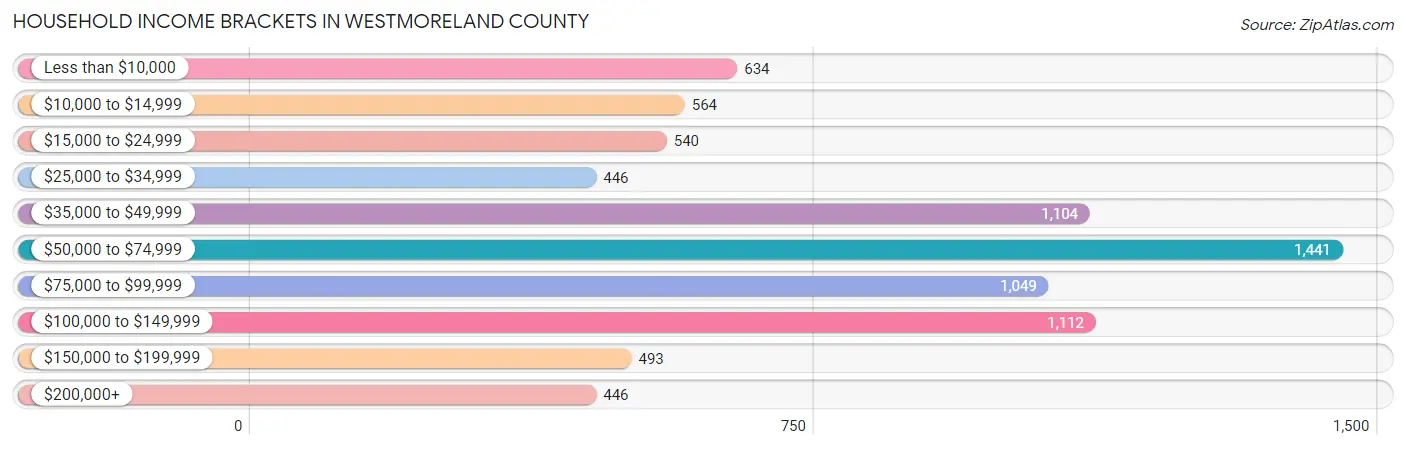
| Income Bracket | # Households | % Households |
| Less than $10,000 | 634 | 8.1% |
| $10,000 to $14,999 | 564 | 7.2% |
| $15,000 to $24,999 | 540 | 6.9% |
| $25,000 to $34,999 | 446 | 5.7% |
| $35,000 to $49,999 | 1,104 | 14.1% |
| $50,000 to $74,999 | 1,441 | 18.4% |
| $75,000 to $99,999 | 1,049 | 13.4% |
| $100,000 to $149,999 | 1,112 | 14.2% |
| $150,000 to $199,999 | 493 | 6.3% |
| $200,000+ | 446 | 5.7% |
Household Income by Householder Age in Westmoreland County
The median household income in Westmoreland County is $56,647, with the highest median household income of $87,710 found in the 25 to 44 years age bracket for the primary householder. A total of 1,722 households (22.0%) fall into this category. Meanwhile, the 15 to 24 years age bracket for the primary householder has the lowest median household income of $0, with 48 households (0.6%) in this group.
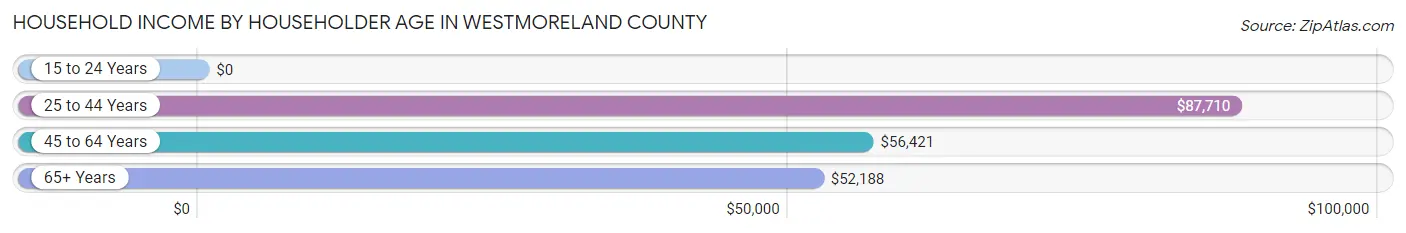
| Income Bracket | # Households | Median Income |
| 15 to 24 Years | 48 (0.6%) | $0 |
| 25 to 44 Years | 1,722 (22.0%) | $87,710 |
| 45 to 64 Years | 3,059 (39.1%) | $56,421 |
| 65+ Years | 3,003 (38.3%) | $52,188 |
| Total | 7,832 (100.0%) | $56,647 |
Poverty in Westmoreland County
Income Below Poverty by Sex and Age in Westmoreland County
With 15.1% poverty level for males and 16.9% for females among the residents of Westmoreland County, 6 to 11 year old males and 18 to 24 year old females are the most vulnerable to poverty, with 176 males (32.1%) and 195 females (34.7%) in their respective age groups living below the poverty level.
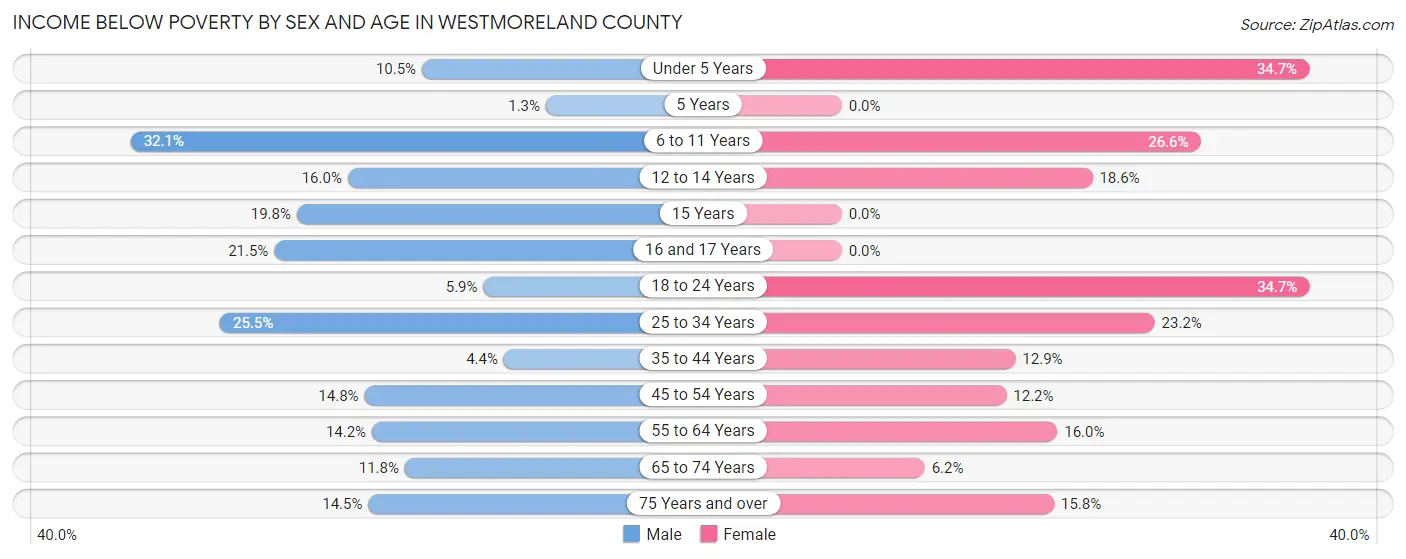
| Age Bracket | Male | Female |
| Under 5 Years | 23 (10.5%) | 198 (34.7%) |
| 5 Years | 1 (1.3%) | 0 (0.0%) |
| 6 to 11 Years | 176 (32.1%) | 127 (26.6%) |
| 12 to 14 Years | 65 (16.0%) | 51 (18.6%) |
| 15 Years | 38 (19.8%) | 0 (0.0%) |
| 16 and 17 Years | 35 (21.5%) | 0 (0.0%) |
| 18 to 24 Years | 38 (5.9%) | 195 (34.7%) |
| 25 to 34 Years | 268 (25.5%) | 269 (23.2%) |
| 35 to 44 Years | 34 (4.4%) | 121 (12.9%) |
| 45 to 54 Years | 164 (14.8%) | 137 (12.2%) |
| 55 to 64 Years | 198 (14.2%) | 256 (16.0%) |
| 65 to 74 Years | 146 (11.8%) | 88 (6.2%) |
| 75 Years and over | 142 (14.5%) | 165 (15.8%) |
| Total | 1,328 (15.1%) | 1,607 (16.9%) |
Income Above Poverty by Sex and Age in Westmoreland County
According to the poverty statistics in Westmoreland County, males aged 5 years and females aged 5 years are the age groups that are most secure financially, with 98.7% of males and 100.0% of females in these age groups living above the poverty line.
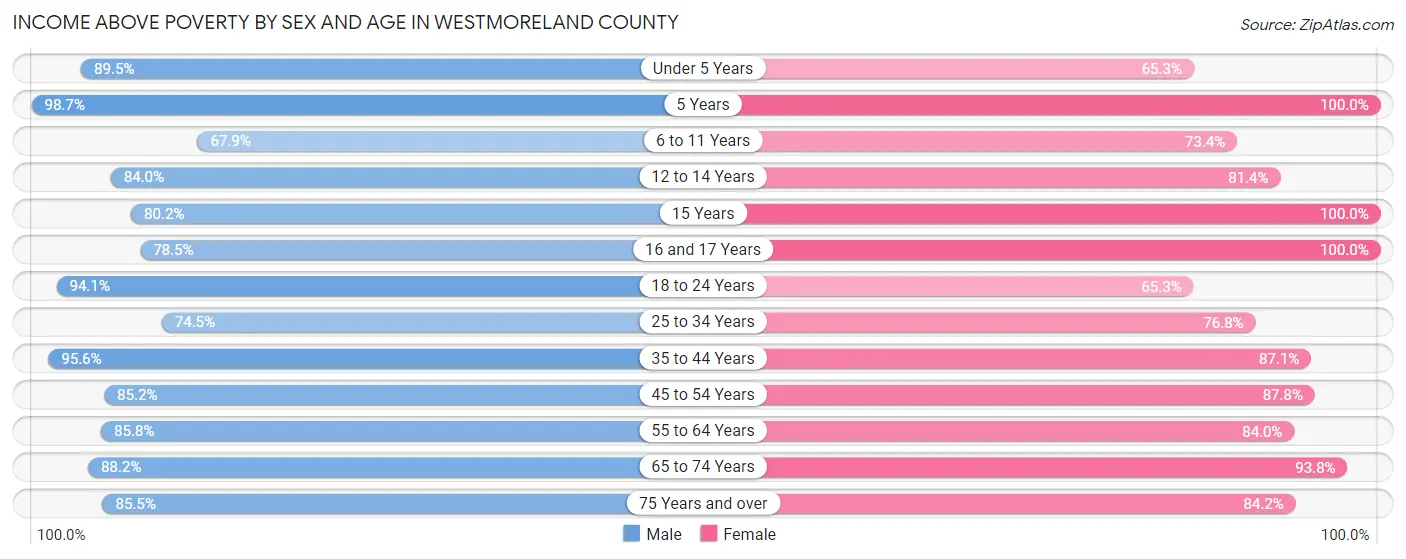
| Age Bracket | Male | Female |
| Under 5 Years | 196 (89.5%) | 373 (65.3%) |
| 5 Years | 76 (98.7%) | 65 (100.0%) |
| 6 to 11 Years | 372 (67.9%) | 350 (73.4%) |
| 12 to 14 Years | 341 (84.0%) | 223 (81.4%) |
| 15 Years | 154 (80.2%) | 68 (100.0%) |
| 16 and 17 Years | 128 (78.5%) | 193 (100.0%) |
| 18 to 24 Years | 602 (94.1%) | 367 (65.3%) |
| 25 to 34 Years | 784 (74.5%) | 889 (76.8%) |
| 35 to 44 Years | 736 (95.6%) | 818 (87.1%) |
| 45 to 54 Years | 946 (85.2%) | 984 (87.8%) |
| 55 to 64 Years | 1,195 (85.8%) | 1,344 (84.0%) |
| 65 to 74 Years | 1,094 (88.2%) | 1,341 (93.8%) |
| 75 Years and over | 839 (85.5%) | 882 (84.2%) |
| Total | 7,463 (84.9%) | 7,897 (83.1%) |
Income Below Poverty Among Married-Couple Families in Westmoreland County
The poverty statistics for married-couple families in Westmoreland County show that 2.8% or 86 of the total 3,070 families live below the poverty line. Families with no children have the highest poverty rate of 3.1%, comprising of 61 families. On the other hand, families with 5 or more children have the lowest poverty rate of 0.0%, which includes 0 families.
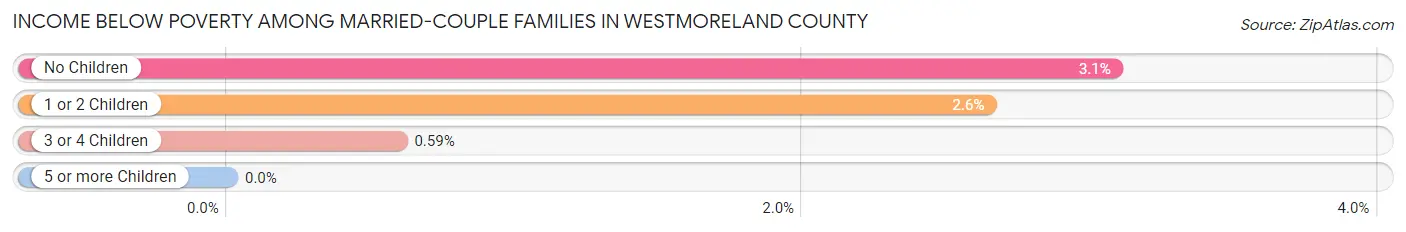
| Children | Above Poverty | Below Poverty |
| No Children | 1,918 (96.9%) | 61 (3.1%) |
| 1 or 2 Children | 885 (97.4%) | 24 (2.6%) |
| 3 or 4 Children | 168 (99.4%) | 1 (0.6%) |
| 5 or more Children | 13 (100.0%) | 0 (0.0%) |
| Total | 2,984 (97.2%) | 86 (2.8%) |
Income Below Poverty Among Single-Parent Households in Westmoreland County
According to the poverty data in Westmoreland County, 43.2% or 165 single-father households and 27.5% or 302 single-mother households are living below the poverty line. Among single-father households, those with 3 or 4 children have the highest poverty rate, with 69 households (100.0%) experiencing poverty. Likewise, among single-mother households, those with 3 or 4 children have the highest poverty rate, with 81 households (53.3%) falling below the poverty line.
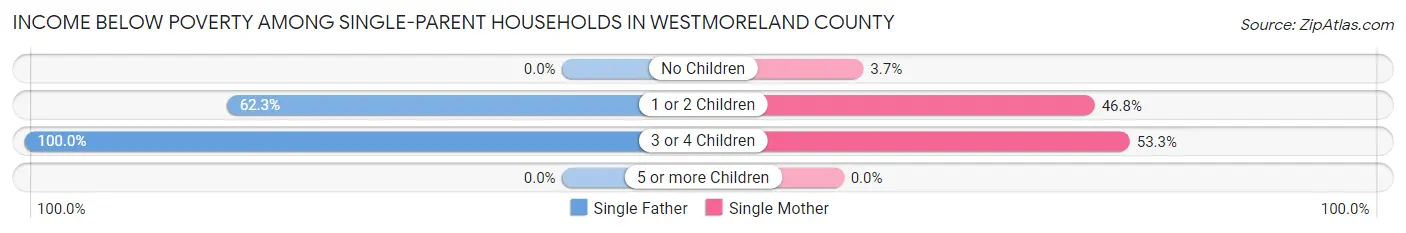
| Children | Single Father | Single Mother |
| No Children | 0 (0.0%) | 19 (3.7%) |
| 1 or 2 Children | 96 (62.3%) | 202 (46.8%) |
| 3 or 4 Children | 69 (100.0%) | 81 (53.3%) |
| 5 or more Children | 0 (0.0%) | 0 (0.0%) |
| Total | 165 (43.2%) | 302 (27.5%) |
Income Below Poverty Among Married-Couple vs Single-Parent Households in Westmoreland County
The poverty data for Westmoreland County shows that 86 of the married-couple family households (2.8%) and 467 of the single-parent households (31.5%) are living below the poverty level. Within the married-couple family households, those with no children have the highest poverty rate, with 61 households (3.1%) falling below the poverty line. Among the single-parent households, those with 3 or 4 children have the highest poverty rate, with 150 household (67.9%) living below poverty.
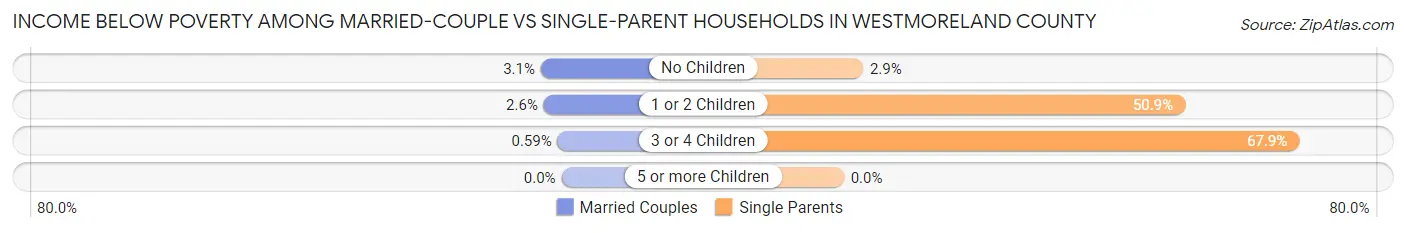
| Children | Married-Couple Families | Single-Parent Households |
| No Children | 61 (3.1%) | 19 (2.9%) |
| 1 or 2 Children | 24 (2.6%) | 298 (50.8%) |
| 3 or 4 Children | 1 (0.6%) | 150 (67.9%) |
| 5 or more Children | 0 (0.0%) | 0 (0.0%) |
| Total | 86 (2.8%) | 467 (31.5%) |
Race in Westmoreland County
The most populous races in Westmoreland County are White / Caucasian (11,706 | 63.3%), Black / African American (4,507 | 24.4%), and Hispanic or Latino (1,259 | 6.8%).
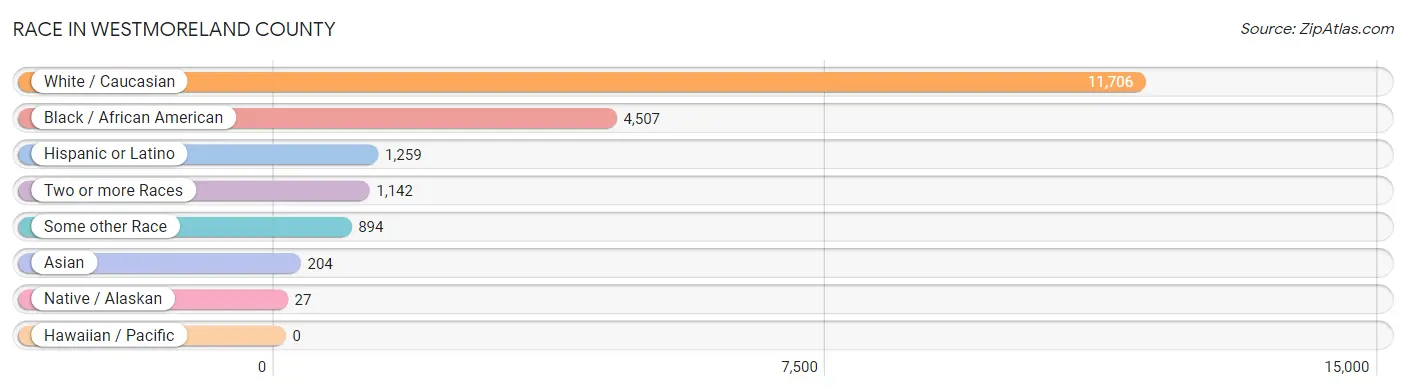
| Race | # Population | % Population |
| Asian | 204 | 1.1% |
| Black / African American | 4,507 | 24.4% |
| Hawaiian / Pacific | 0 | 0.0% |
| Hispanic or Latino | 1,259 | 6.8% |
| Native / Alaskan | 27 | 0.2% |
| White / Caucasian | 11,706 | 63.3% |
| Two or more Races | 1,142 | 6.2% |
| Some other Race | 894 | 4.8% |
| Total | 18,480 | 100.0% |
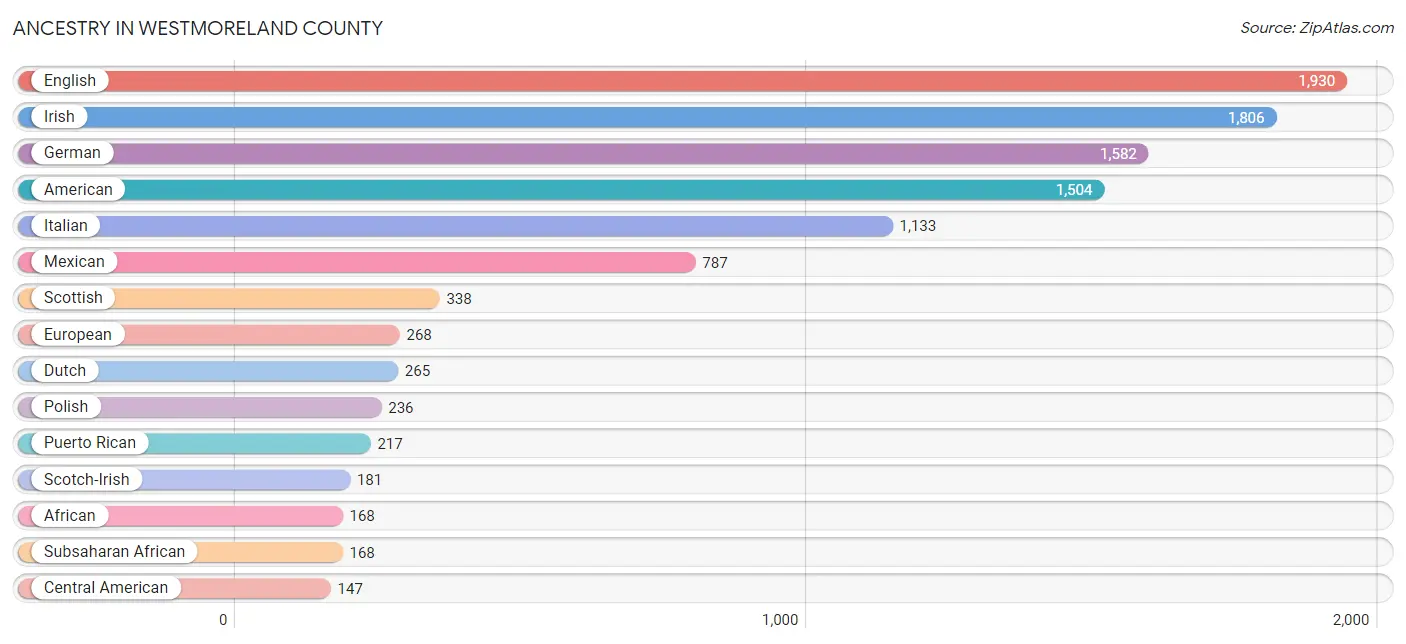
Ancestry in Westmoreland County
The most populous ancestries reported in Westmoreland County are English (1,930 | 10.4%), Irish (1,806 | 9.8%), German (1,582 | 8.6%), American (1,504 | 8.1%), and Italian (1,133 | 6.1%), together accounting for 43.0% of all Westmoreland County residents.
| Ancestry | # Population | % Population |
| African | 168 | 0.9% |
| American | 1,504 | 8.1% |
| Arab | 1 | 0.0% |
| Austrian | 36 | 0.2% |
| Bangladeshi | 48 | 0.3% |
| Bhutanese | 23 | 0.1% |
| Blackfeet | 45 | 0.2% |
| Bolivian | 83 | 0.4% |
| British | 108 | 0.6% |
| Burmese | 2 | 0.0% |
| Central American | 147 | 0.8% |
| Cherokee | 36 | 0.2% |
| Croatian | 8 | 0.0% |
| Cuban | 25 | 0.1% |
| Czech | 55 | 0.3% |
| Czechoslovakian | 3 | 0.0% |
| Danish | 47 | 0.3% |
| Dutch | 265 | 1.4% |
| Eastern European | 8 | 0.0% |
| English | 1,930 | 10.4% |
| European | 268 | 1.5% |
| Finnish | 5 | 0.0% |
| French | 147 | 0.8% |
| French Canadian | 103 | 0.6% |
| German | 1,582 | 8.6% |
| Greek | 86 | 0.5% |
| Hungarian | 59 | 0.3% |
| Indian (Asian) | 72 | 0.4% |
| Irish | 1,806 | 9.8% |
| Italian | 1,133 | 6.1% |
| Jamaican | 19 | 0.1% |
| Korean | 47 | 0.3% |
| Lithuanian | 9 | 0.1% |
| Mexican | 787 | 4.3% |
| Northern European | 48 | 0.3% |
| Norwegian | 106 | 0.6% |
| Pakistani | 3 | 0.0% |
| Palestinian | 1 | 0.0% |
| Pennsylvania German | 56 | 0.3% |
| Polish | 236 | 1.3% |
| Potawatomi | 18 | 0.1% |
| Puerto Rican | 217 | 1.2% |
| Romanian | 6 | 0.0% |
| Russian | 140 | 0.8% |
| Salvadoran | 147 | 0.8% |
| Scandinavian | 87 | 0.5% |
| Scotch-Irish | 181 | 1.0% |
| Scottish | 338 | 1.8% |
| Slavic | 17 | 0.1% |
| South American | 83 | 0.4% |
| Sri Lankan | 51 | 0.3% |
| Subsaharan African | 168 | 0.9% |
| Swedish | 13 | 0.1% |
| Swiss | 36 | 0.2% |
| Thai | 28 | 0.2% |
| Ukrainian | 6 | 0.0% |
| Welsh | 118 | 0.6% | View All 57 Rows |
Immigrants in Westmoreland County
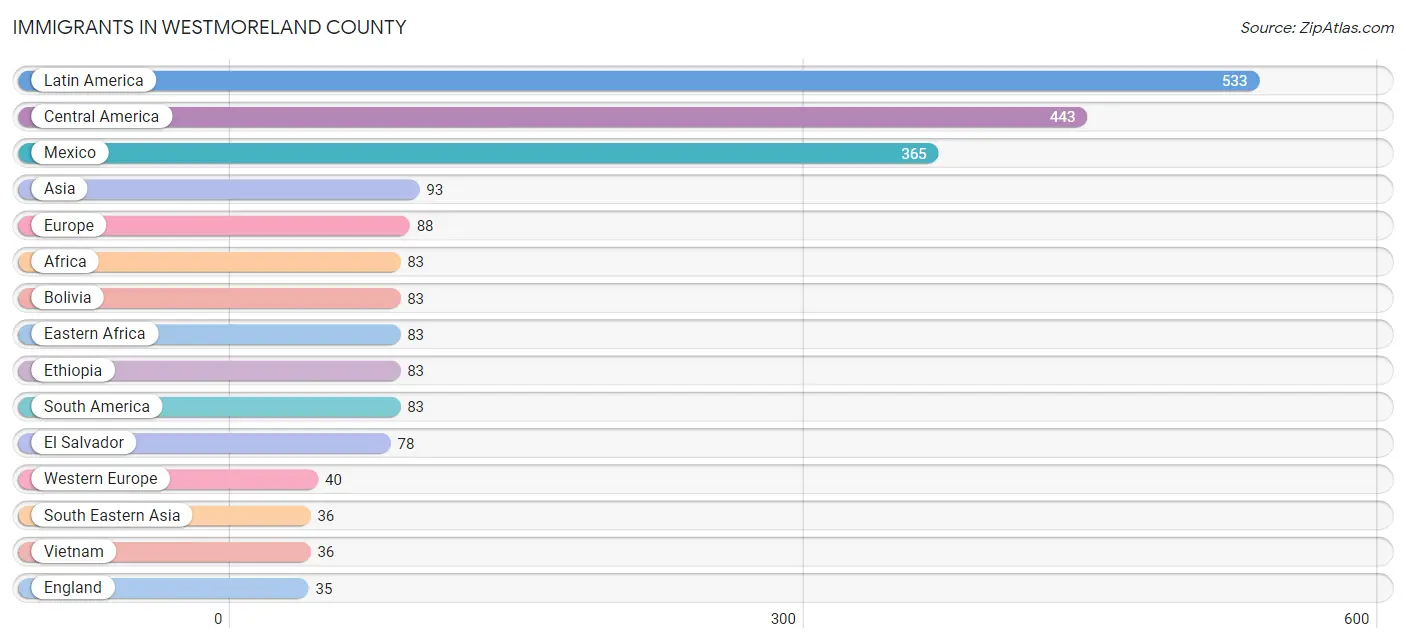
The most numerous immigrant groups reported in Westmoreland County came from Latin America (533 | 2.9%), Central America (443 | 2.4%), Mexico (365 | 2.0%), Asia (93 | 0.5%), and Europe (88 | 0.5%), together accounting for 8.2% of all Westmoreland County residents.
| Immigration Origin | # Population | % Population |
| Africa | 83 | 0.4% |
| Asia | 93 | 0.5% |
| Bolivia | 83 | 0.4% |
| Canada | 19 | 0.1% |
| Caribbean | 7 | 0.0% |
| Central America | 443 | 2.4% |
| China | 27 | 0.2% |
| Eastern Africa | 83 | 0.4% |
| Eastern Asia | 29 | 0.2% |
| Eastern Europe | 6 | 0.0% |
| El Salvador | 78 | 0.4% |
| England | 35 | 0.2% |
| Ethiopia | 83 | 0.4% |
| Europe | 88 | 0.5% |
| France | 25 | 0.1% |
| Germany | 15 | 0.1% |
| India | 28 | 0.2% |
| Jamaica | 7 | 0.0% |
| Korea | 2 | 0.0% |
| Latin America | 533 | 2.9% |
| Mexico | 365 | 2.0% |
| Northern Europe | 35 | 0.2% |
| South America | 83 | 0.4% |
| South Central Asia | 28 | 0.2% |
| South Eastern Asia | 36 | 0.2% |
| Southern Europe | 7 | 0.0% |
| Spain | 7 | 0.0% |
| Ukraine | 6 | 0.0% |
| Vietnam | 36 | 0.2% |
| Western Europe | 40 | 0.2% | View All 30 Rows |
Sex and Age in Westmoreland County
Sex and Age in Westmoreland County
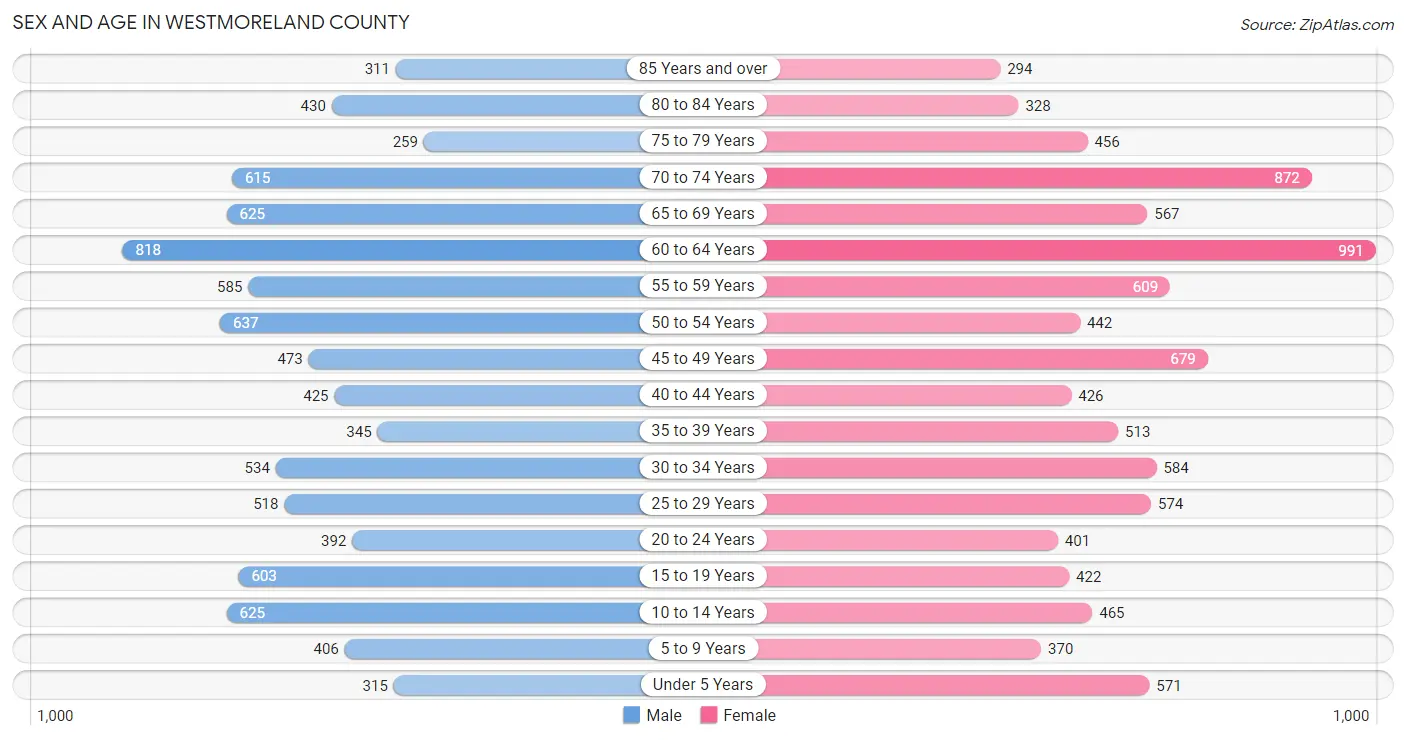
The most populous age groups in Westmoreland County are 60 to 64 Years (818 | 9.2%) for men and 60 to 64 Years (991 | 10.4%) for women.
| Age Bracket | Male | Female |
| Under 5 Years | 315 (3.5%) | 571 (6.0%) |
| 5 to 9 Years | 406 (4.5%) | 370 (3.9%) |
| 10 to 14 Years | 625 (7.0%) | 465 (4.9%) |
| 15 to 19 Years | 603 (6.8%) | 422 (4.4%) |
| 20 to 24 Years | 392 (4.4%) | 401 (4.2%) |
| 25 to 29 Years | 518 (5.8%) | 574 (6.0%) |
| 30 to 34 Years | 534 (6.0%) | 584 (6.1%) |
| 35 to 39 Years | 345 (3.9%) | 513 (5.4%) |
| 40 to 44 Years | 425 (4.8%) | 426 (4.4%) |
| 45 to 49 Years | 473 (5.3%) | 679 (7.1%) |
| 50 to 54 Years | 637 (7.1%) | 442 (4.6%) |
| 55 to 59 Years | 585 (6.6%) | 609 (6.4%) |
| 60 to 64 Years | 818 (9.2%) | 991 (10.4%) |
| 65 to 69 Years | 625 (7.0%) | 567 (5.9%) |
| 70 to 74 Years | 615 (6.9%) | 872 (9.1%) |
| 75 to 79 Years | 259 (2.9%) | 456 (4.8%) |
| 80 to 84 Years | 430 (4.8%) | 328 (3.4%) |
| 85 Years and over | 311 (3.5%) | 294 (3.1%) |
| Total | 8,916 (100.0%) | 9,564 (100.0%) |
Families and Households in Westmoreland County
Median Family Size in Westmoreland County
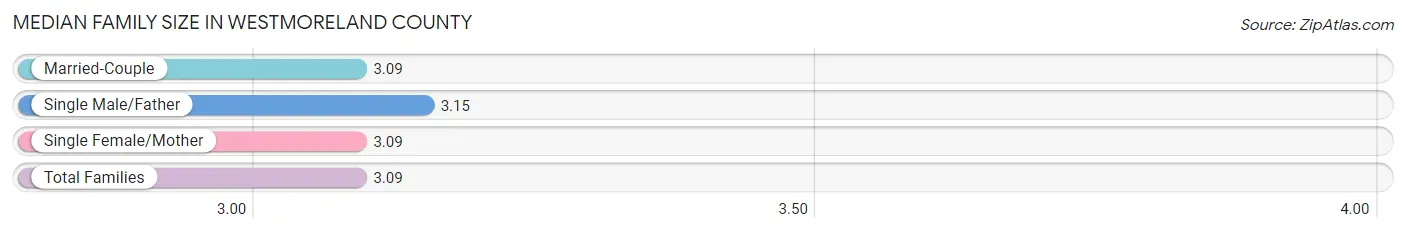
The median family size in Westmoreland County is 3.09 persons per family, with single male/father families (382 | 8.4%) accounting for the largest median family size of 3.15 persons per family. On the other hand, married-couple families (3,070 | 67.4%) represent the smallest median family size with 3.09 persons per family.
| Family Type | # Families | Family Size |
| Married-Couple | 3,070 (67.4%) | 3.09 |
| Single Male/Father | 382 (8.4%) | 3.15 |
| Single Female/Mother | 1,100 (24.2%) | 3.09 |
| Total Families | 4,552 (100.0%) | 3.09 |
Median Household Size in Westmoreland County
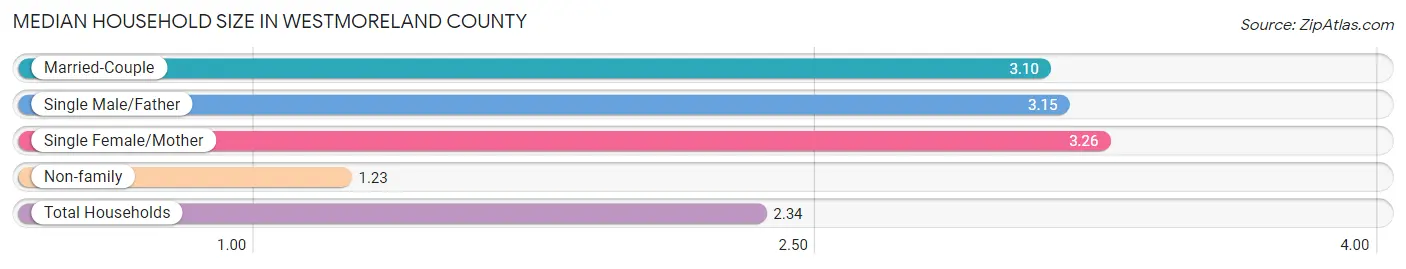
The median household size in Westmoreland County is 2.34 persons per household, with single female/mother households (1,100 | 14.0%) accounting for the largest median household size of 3.26 persons per household. non-family households (3,280 | 41.9%) represent the smallest median household size with 1.23 persons per household.
| Household Type | # Households | Household Size |
| Married-Couple | 3,070 (39.2%) | 3.10 |
| Single Male/Father | 382 (4.9%) | 3.15 |
| Single Female/Mother | 1,100 (14.0%) | 3.26 |
| Non-family | 3,280 (41.9%) | 1.23 |
| Total Households | 7,832 (100.0%) | 2.34 |
Household Size by Marriage Status in Westmoreland County
Out of a total of 7,832 households in Westmoreland County, 4,552 (58.1%) are family households, while 3,280 (41.9%) are nonfamily households. The most numerous type of family households are 2-person households, comprising 2,172, and the most common type of nonfamily households are 1-person households, comprising 2,785.
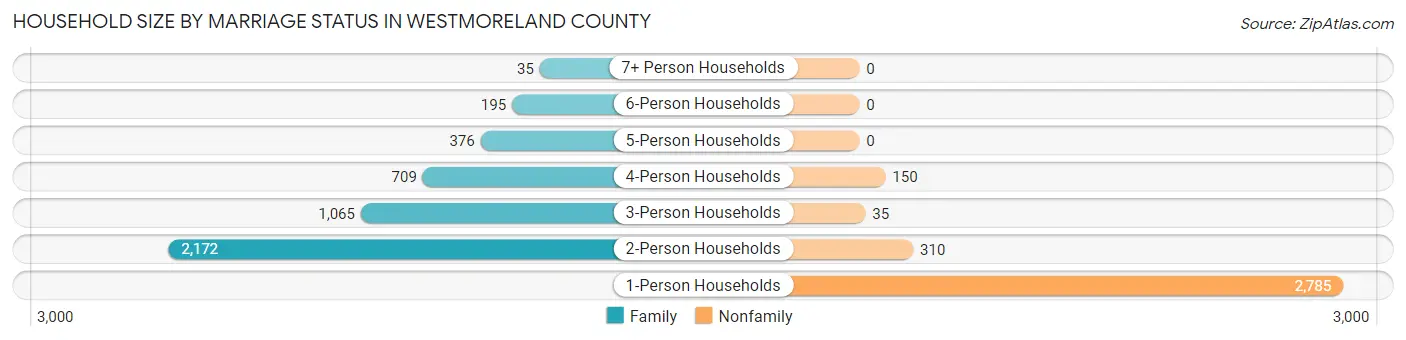
| Household Size | Family Households | Nonfamily Households |
| 1-Person Households | - | 2,785 (35.6%) |
| 2-Person Households | 2,172 (27.7%) | 310 (4.0%) |
| 3-Person Households | 1,065 (13.6%) | 35 (0.4%) |
| 4-Person Households | 709 (9.0%) | 150 (1.9%) |
| 5-Person Households | 376 (4.8%) | 0 (0.0%) |
| 6-Person Households | 195 (2.5%) | 0 (0.0%) |
| 7+ Person Households | 35 (0.4%) | 0 (0.0%) |
| Total | 4,552 (58.1%) | 3,280 (41.9%) |
Female Fertility in Westmoreland County
Fertility by Age in Westmoreland County
Average fertility rate in Westmoreland County is 89.0 births per 1,000 women. Women in the age bracket of 20 to 34 years have the highest fertility rate with 187.0 births per 1,000 women. Women in the age bracket of 20 to 34 years acount for 89.0% of all women with births.
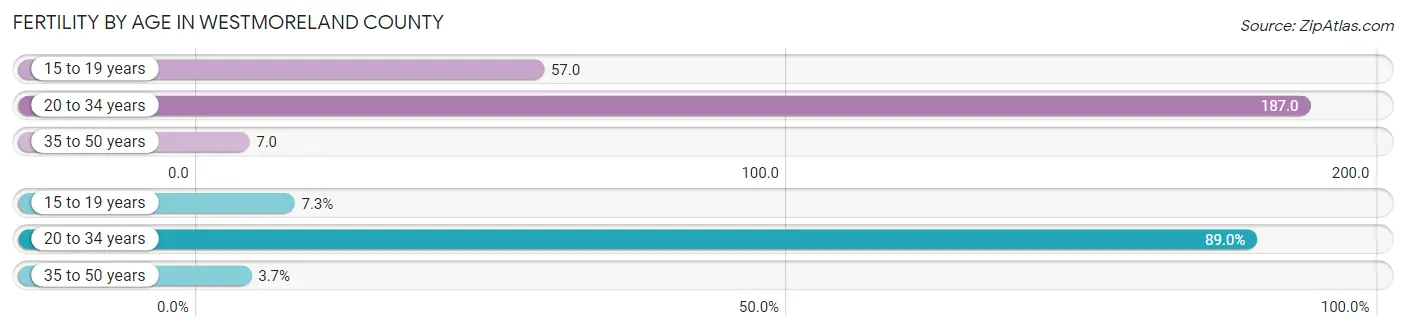
| Age Bracket | Women with Births | Births / 1,000 Women |
| 15 to 19 years | 24 (7.3%) | 57.0 |
| 20 to 34 years | 291 (89.0%) | 187.0 |
| 35 to 50 years | 12 (3.7%) | 7.0 |
| Total | 327 (100.0%) | 89.0 |
Fertility by Age by Marriage Status in Westmoreland County
41.3% of women with births (327) in Westmoreland County are married. The highest percentage of unmarried women with births falls into 15 to 19 years age bracket with 100.0% of them unmarried at the time of birth, while the lowest percentage of unmarried women with births belong to 35 to 50 years age bracket with 0.0% of them unmarried.
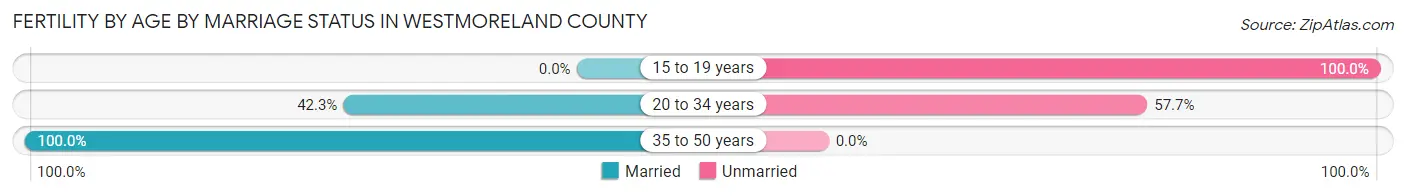
| Age Bracket | Married | Unmarried |
| 15 to 19 years | 0 (0.0%) | 24 (100.0%) |
| 20 to 34 years | 123 (42.3%) | 168 (57.7%) |
| 35 to 50 years | 12 (100.0%) | 0 (0.0%) |
| Total | 135 (41.3%) | 192 (58.7%) |
Fertility by Education in Westmoreland County
Average fertility rate in Westmoreland County is 89.0 births per 1,000 women. Women with the education attainment of high school diploma have the highest fertility rate of 125.0 births per 1,000 women, while women with the education attainment of college or associate's degree have the lowest fertility at 44.0 births per 1,000 women. Women with the education attainment of high school diploma represent 42.5% of all women with births.
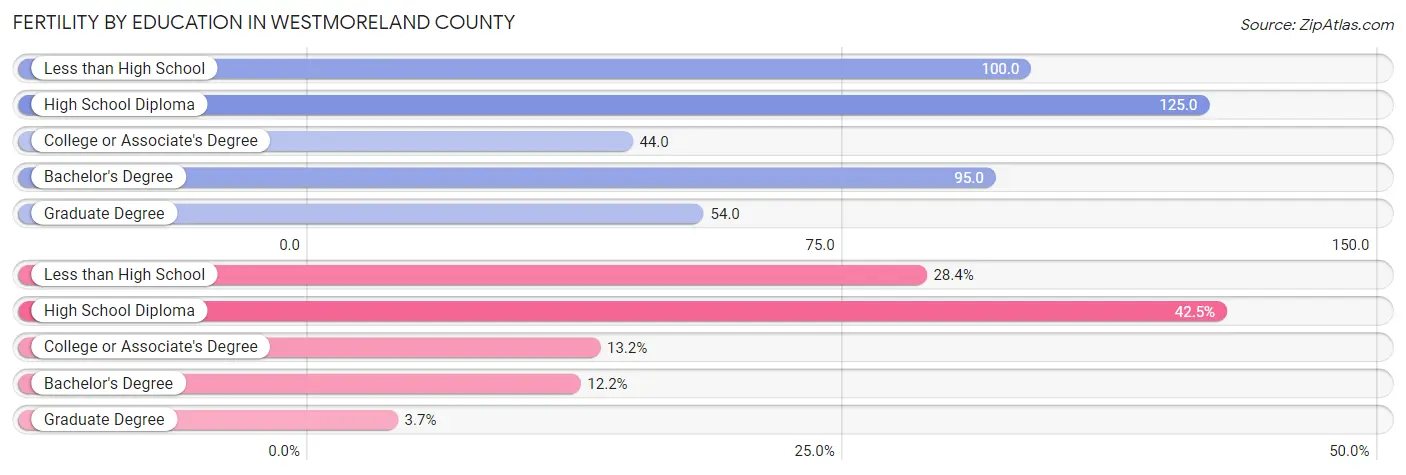
| Educational Attainment | Women with Births | Births / 1,000 Women |
| Less than High School | 93 (28.4%) | 100.0 |
| High School Diploma | 139 (42.5%) | 125.0 |
| College or Associate's Degree | 43 (13.2%) | 44.0 |
| Bachelor's Degree | 40 (12.2%) | 95.0 |
| Graduate Degree | 12 (3.7%) | 54.0 |
| Total | 327 (100.0%) | 89.0 |
Fertility by Education by Marriage Status in Westmoreland County
58.7% of women with births in Westmoreland County are unmarried. Women with the educational attainment of bachelor's degree are most likely to be married with 100.0% of them married at childbirth, while women with the educational attainment of less than high school are least likely to be married with 100.0% of them unmarried at childbirth.
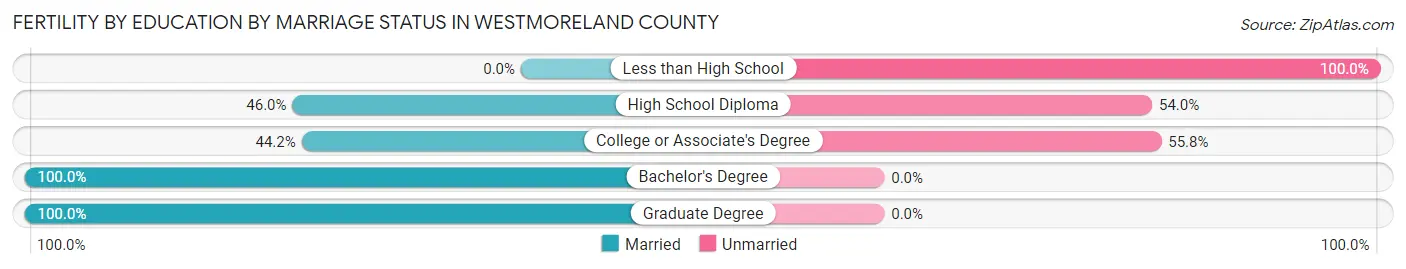
| Educational Attainment | Married | Unmarried |
| Less than High School | 0 (0.0%) | 93 (100.0%) |
| High School Diploma | 64 (46.0%) | 75 (54.0%) |
| College or Associate's Degree | 19 (44.2%) | 24 (55.8%) |
| Bachelor's Degree | 40 (100.0%) | 0 (0.0%) |
| Graduate Degree | 12 (100.0%) | 0 (0.0%) |
| Total | 135 (41.3%) | 192 (58.7%) |
Employment Characteristics in Westmoreland County
Employment by Class of Employer in Westmoreland County
Among the 7,028 employed individuals in Westmoreland County, private company employees (3,796 | 54.0%), self-employed (not incorporated) (734 | 10.4%), and local government employees (657 | 9.3%) make up the most common classes of employment.
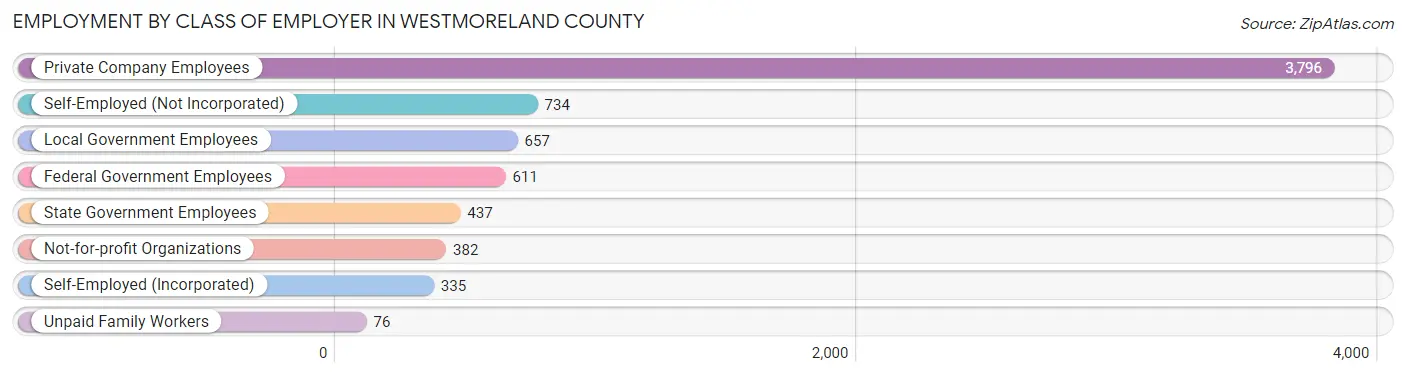
| Employer Class | # Employees | % Employees |
| Private Company Employees | 3,796 | 54.0% |
| Self-Employed (Incorporated) | 335 | 4.8% |
| Self-Employed (Not Incorporated) | 734 | 10.4% |
| Not-for-profit Organizations | 382 | 5.4% |
| Local Government Employees | 657 | 9.3% |
| State Government Employees | 437 | 6.2% |
| Federal Government Employees | 611 | 8.7% |
| Unpaid Family Workers | 76 | 1.1% |
| Total | 7,028 | 100.0% |
Employment Status by Age in Westmoreland County
According to the labor force statistics for Westmoreland County, out of the total population over 16 years of age (15,468), 51.0% or 7,889 individuals are in the labor force, with 9.1% or 718 of them unemployed. The age group with the highest labor force participation rate is 30 to 34 years, with 81.8% or 915 individuals in the labor force. Within the labor force, the 20 to 24 years age range has the highest percentage of unemployed individuals, with 24.7% or 154 of them being unemployed.
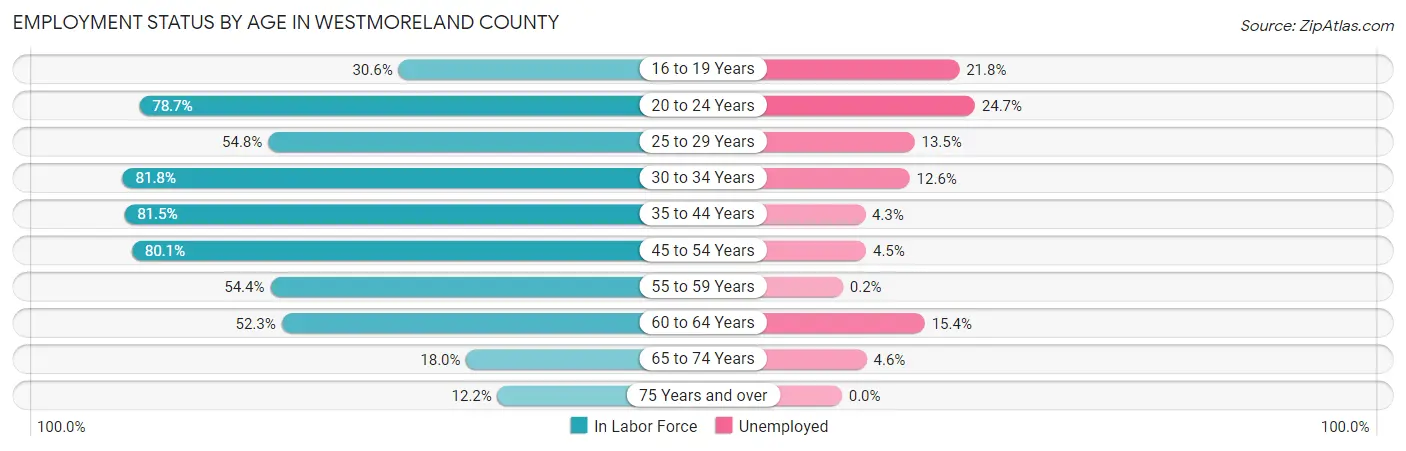
| Age Bracket | In Labor Force | Unemployed |
| 16 to 19 Years | 234 (30.6%) | 51 (21.8%) |
| 20 to 24 Years | 624 (78.7%) | 154 (24.7%) |
| 25 to 29 Years | 598 (54.8%) | 81 (13.5%) |
| 30 to 34 Years | 915 (81.8%) | 115 (12.6%) |
| 35 to 44 Years | 1,393 (81.5%) | 60 (4.3%) |
| 45 to 54 Years | 1,787 (80.1%) | 80 (4.5%) |
| 55 to 59 Years | 650 (54.4%) | 1 (0.2%) |
| 60 to 64 Years | 946 (52.3%) | 146 (15.4%) |
| 65 to 74 Years | 482 (18.0%) | 22 (4.6%) |
| 75 Years and over | 254 (12.2%) | 0 (0.0%) |
| Total | 7,889 (51.0%) | 718 (9.1%) |
Employment Status by Educational Attainment in Westmoreland County
According to labor force statistics for Westmoreland County, 68.7% of individuals (6,288) out of the total population between 25 and 64 years of age (9,153) are in the labor force, with 7.8% or 490 of them being unemployed. The group with the highest labor force participation rate are those with the educational attainment of bachelor's degree or higher, with 79.1% or 1,271 individuals in the labor force. Within the labor force, individuals with less than high school education have the highest percentage of unemployment, with 22.2% or 185 of them being unemployed.
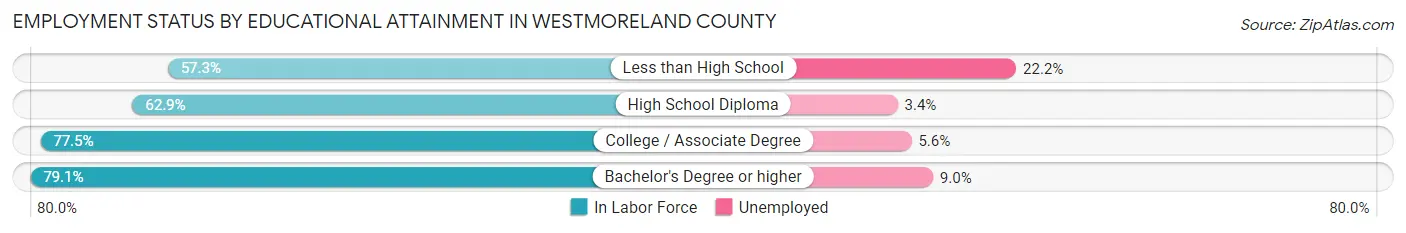
| Educational Attainment | In Labor Force | Unemployed |
| Less than High School | 835 (57.3%) | 323 (22.2%) |
| High School Diploma | 2,310 (62.9%) | 125 (3.4%) |
| College / Associate Degree | 1,873 (77.5%) | 135 (5.6%) |
| Bachelor's Degree or higher | 1,271 (79.1%) | 145 (9.0%) |
| Total | 6,288 (68.7%) | 714 (7.8%) |
Employment Occupations by Sex in Westmoreland County
Management, Business, Science and Arts Occupations
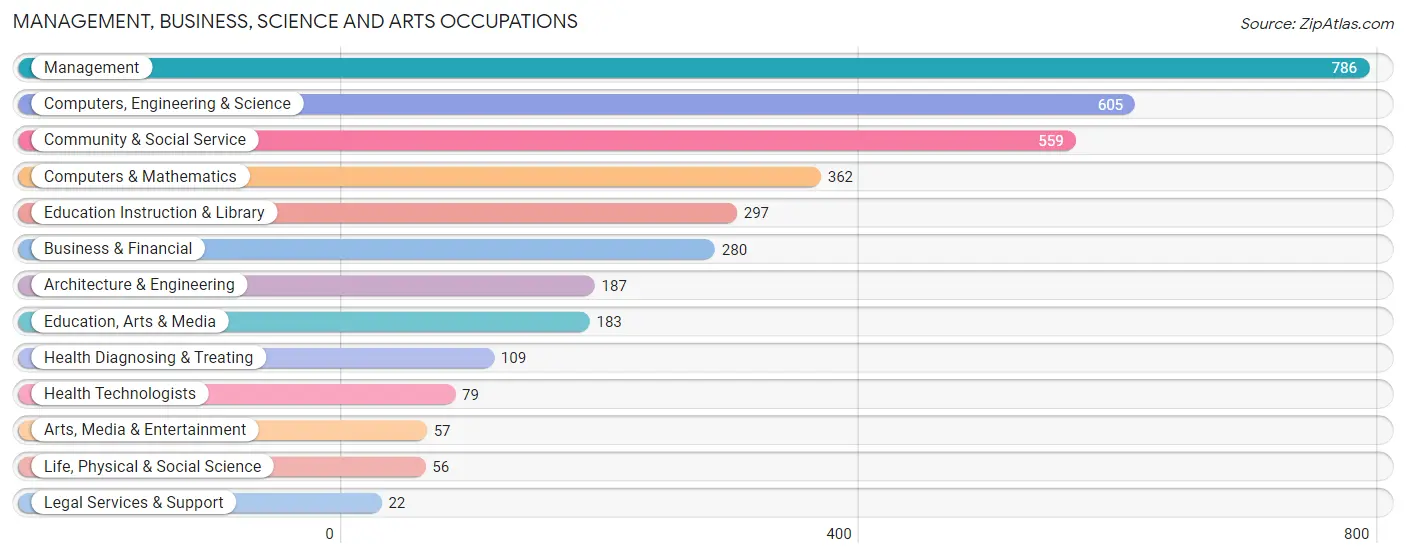
The most common Management, Business, Science and Arts occupations in Westmoreland County are Management (786 | 11.2%), Computers, Engineering & Science (605 | 8.6%), Community & Social Service (559 | 8.0%), Computers & Mathematics (362 | 5.2%), and Education Instruction & Library (297 | 4.2%).
Management, Business, Science and Arts Occupations by Sex
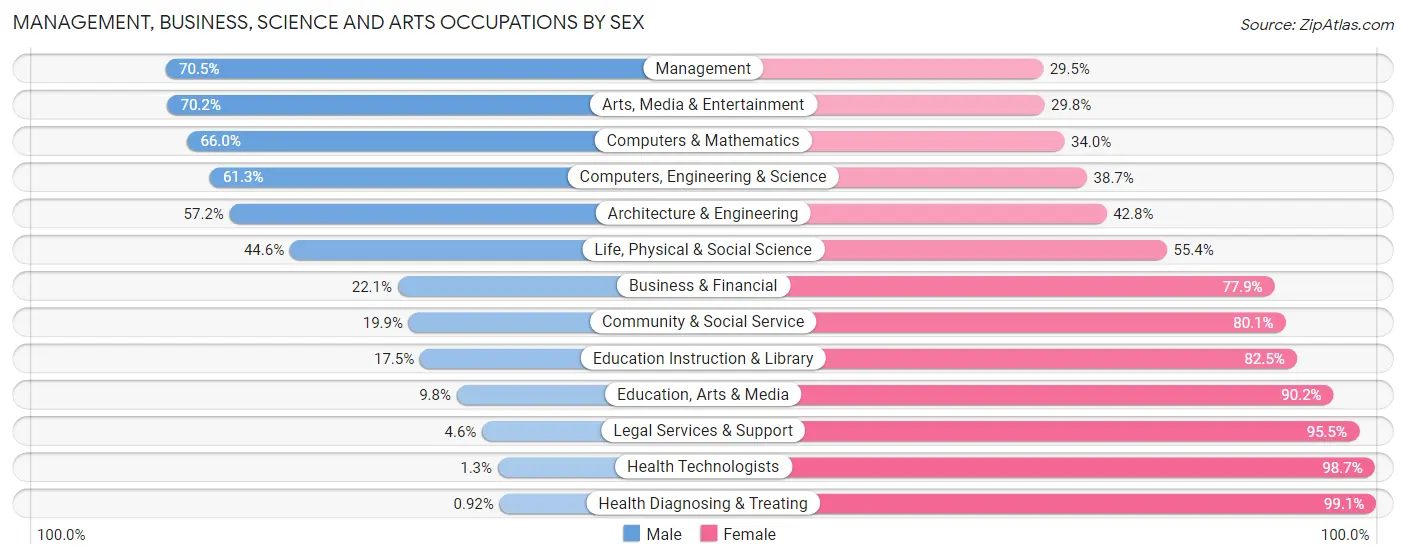
Within the Management, Business, Science and Arts occupations in Westmoreland County, the most male-oriented occupations are Management (70.5%), Arts, Media & Entertainment (70.2%), and Computers & Mathematics (66.0%), while the most female-oriented occupations are Health Diagnosing & Treating (99.1%), Health Technologists (98.7%), and Legal Services & Support (95.5%).
| Occupation | Male | Female |
| Management | 554 (70.5%) | 232 (29.5%) |
| Business & Financial | 62 (22.1%) | 218 (77.9%) |
| Computers, Engineering & Science | 371 (61.3%) | 234 (38.7%) |
| Computers & Mathematics | 239 (66.0%) | 123 (34.0%) |
| Architecture & Engineering | 107 (57.2%) | 80 (42.8%) |
| Life, Physical & Social Science | 25 (44.6%) | 31 (55.4%) |
| Community & Social Service | 111 (19.9%) | 448 (80.1%) |
| Education, Arts & Media | 18 (9.8%) | 165 (90.2%) |
| Legal Services & Support | 1 (4.5%) | 21 (95.5%) |
| Education Instruction & Library | 52 (17.5%) | 245 (82.5%) |
| Arts, Media & Entertainment | 40 (70.2%) | 17 (29.8%) |
| Health Diagnosing & Treating | 1 (0.9%) | 108 (99.1%) |
| Health Technologists | 1 (1.3%) | 78 (98.7%) |
| Total (Category) | 1,099 (47.0%) | 1,240 (53.0%) |
| Total (Overall) | 3,206 (45.7%) | 3,810 (54.3%) |
Services Occupations
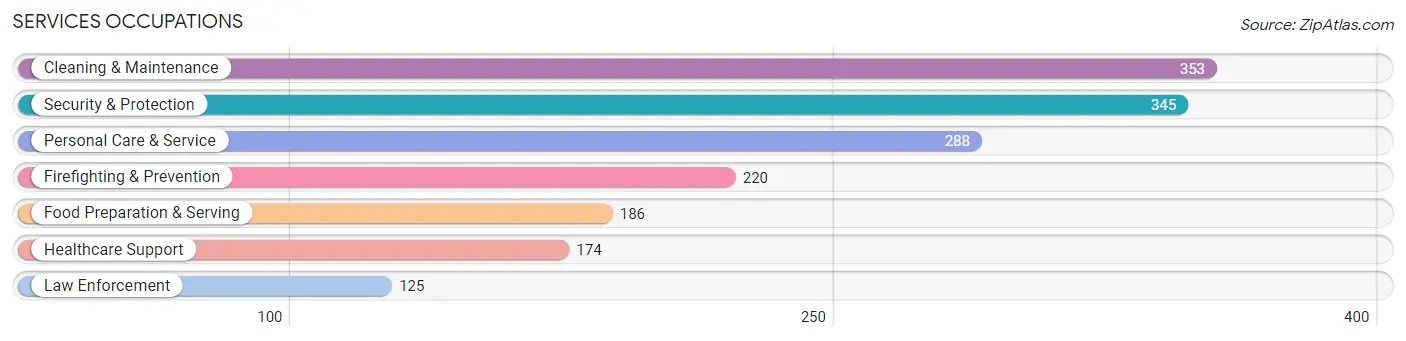
The most common Services occupations in Westmoreland County are Cleaning & Maintenance (353 | 5.0%), Security & Protection (345 | 4.9%), Personal Care & Service (288 | 4.1%), Firefighting & Prevention (220 | 3.1%), and Food Preparation & Serving (186 | 2.6%).
Services Occupations by Sex
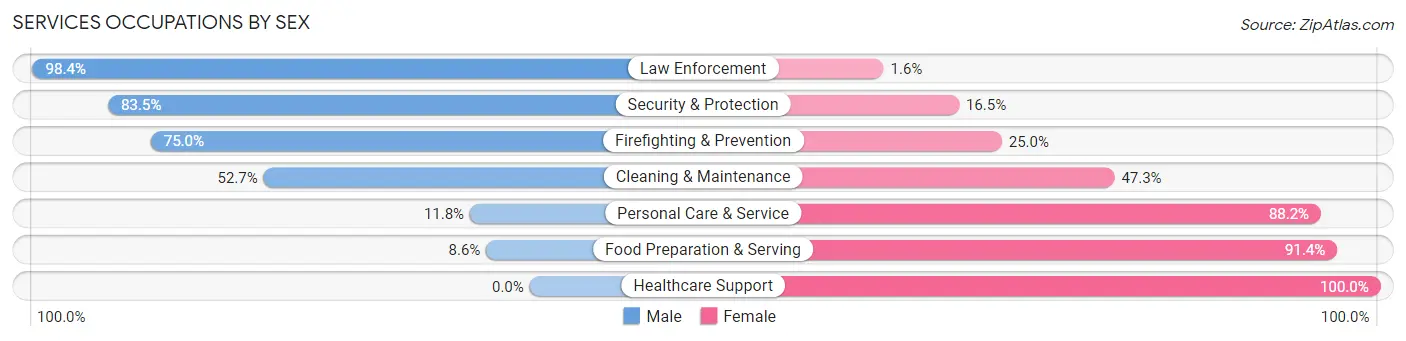
Within the Services occupations in Westmoreland County, the most male-oriented occupations are Law Enforcement (98.4%), Security & Protection (83.5%), and Firefighting & Prevention (75.0%), while the most female-oriented occupations are Healthcare Support (100.0%), Food Preparation & Serving (91.4%), and Personal Care & Service (88.2%).
| Occupation | Male | Female |
| Healthcare Support | 0 (0.0%) | 174 (100.0%) |
| Security & Protection | 288 (83.5%) | 57 (16.5%) |
| Firefighting & Prevention | 165 (75.0%) | 55 (25.0%) |
| Law Enforcement | 123 (98.4%) | 2 (1.6%) |
| Food Preparation & Serving | 16 (8.6%) | 170 (91.4%) |
| Cleaning & Maintenance | 186 (52.7%) | 167 (47.3%) |
| Personal Care & Service | 34 (11.8%) | 254 (88.2%) |
| Total (Category) | 524 (38.9%) | 822 (61.1%) |
| Total (Overall) | 3,206 (45.7%) | 3,810 (54.3%) |
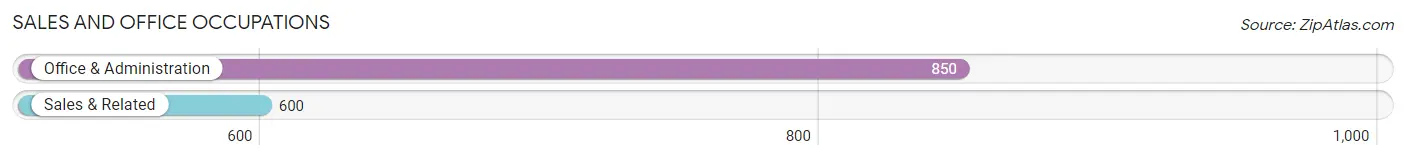
Sales and Office Occupations
The most common Sales and Office occupations in Westmoreland County are Office & Administration (850 | 12.1%), and Sales & Related (600 | 8.6%).
Sales and Office Occupations by Sex
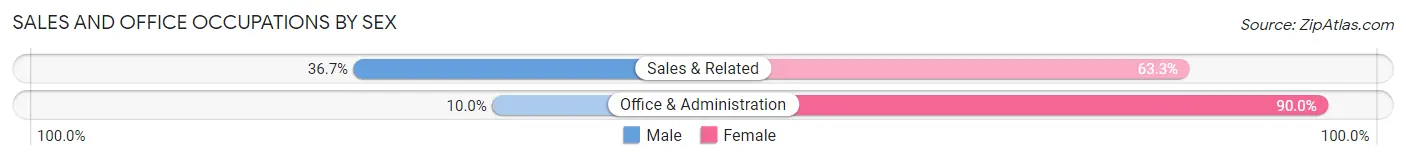
| Occupation | Male | Female |
| Sales & Related | 220 (36.7%) | 380 (63.3%) |
| Office & Administration | 85 (10.0%) | 765 (90.0%) |
| Total (Category) | 305 (21.0%) | 1,145 (79.0%) |
| Total (Overall) | 3,206 (45.7%) | 3,810 (54.3%) |
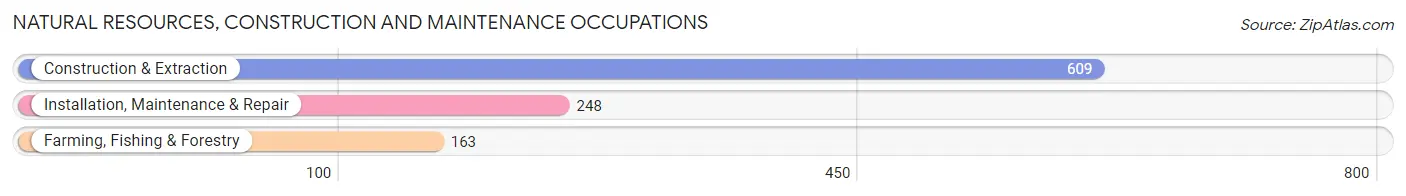
Natural Resources, Construction and Maintenance Occupations
The most common Natural Resources, Construction and Maintenance occupations in Westmoreland County are Construction & Extraction (609 | 8.7%), Installation, Maintenance & Repair (248 | 3.5%), and Farming, Fishing & Forestry (163 | 2.3%).
Natural Resources, Construction and Maintenance Occupations by Sex
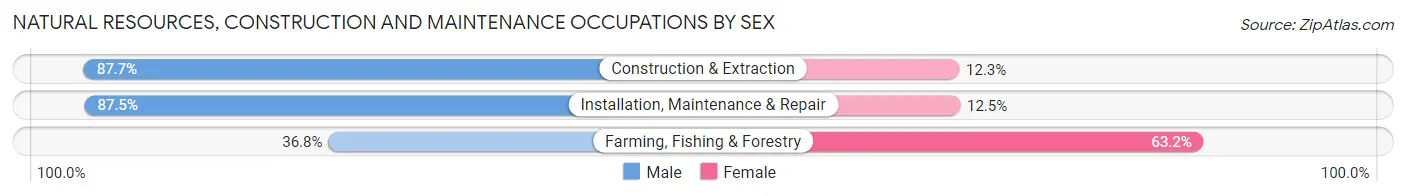
| Occupation | Male | Female |
| Farming, Fishing & Forestry | 60 (36.8%) | 103 (63.2%) |
| Construction & Extraction | 534 (87.7%) | 75 (12.3%) |
| Installation, Maintenance & Repair | 217 (87.5%) | 31 (12.5%) |
| Total (Category) | 811 (79.5%) | 209 (20.5%) |
| Total (Overall) | 3,206 (45.7%) | 3,810 (54.3%) |
Production, Transportation and Moving Occupations
The most common Production, Transportation and Moving occupations in Westmoreland County are Transportation (452 | 6.4%), Material Moving (245 | 3.5%), and Production (164 | 2.3%).
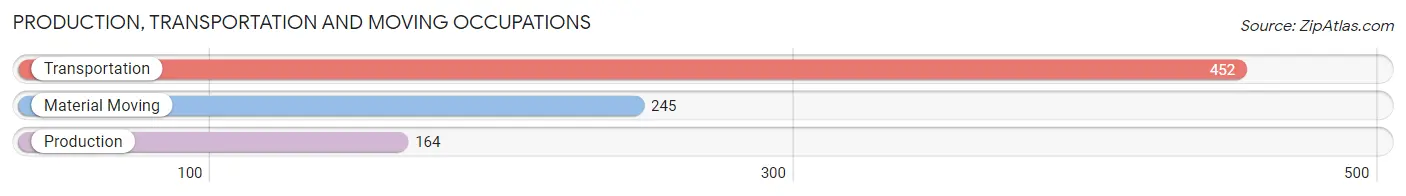
Production, Transportation and Moving Occupations by Sex
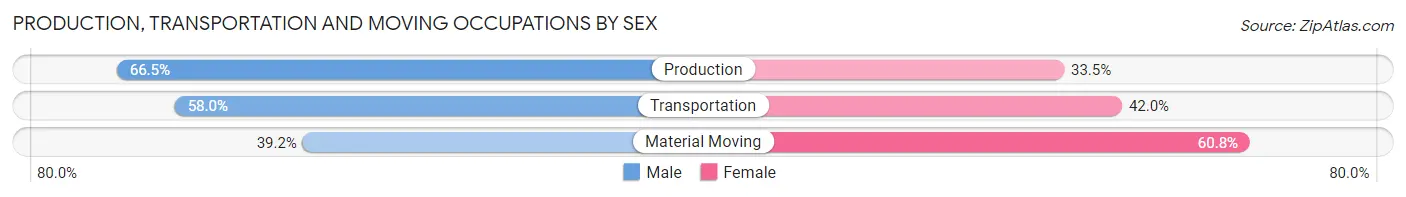
| Occupation | Male | Female |
| Production | 109 (66.5%) | 55 (33.5%) |
| Transportation | 262 (58.0%) | 190 (42.0%) |
| Material Moving | 96 (39.2%) | 149 (60.8%) |
| Total (Category) | 467 (54.2%) | 394 (45.8%) |
| Total (Overall) | 3,206 (45.7%) | 3,810 (54.3%) |
Employment Industries by Sex in Westmoreland County
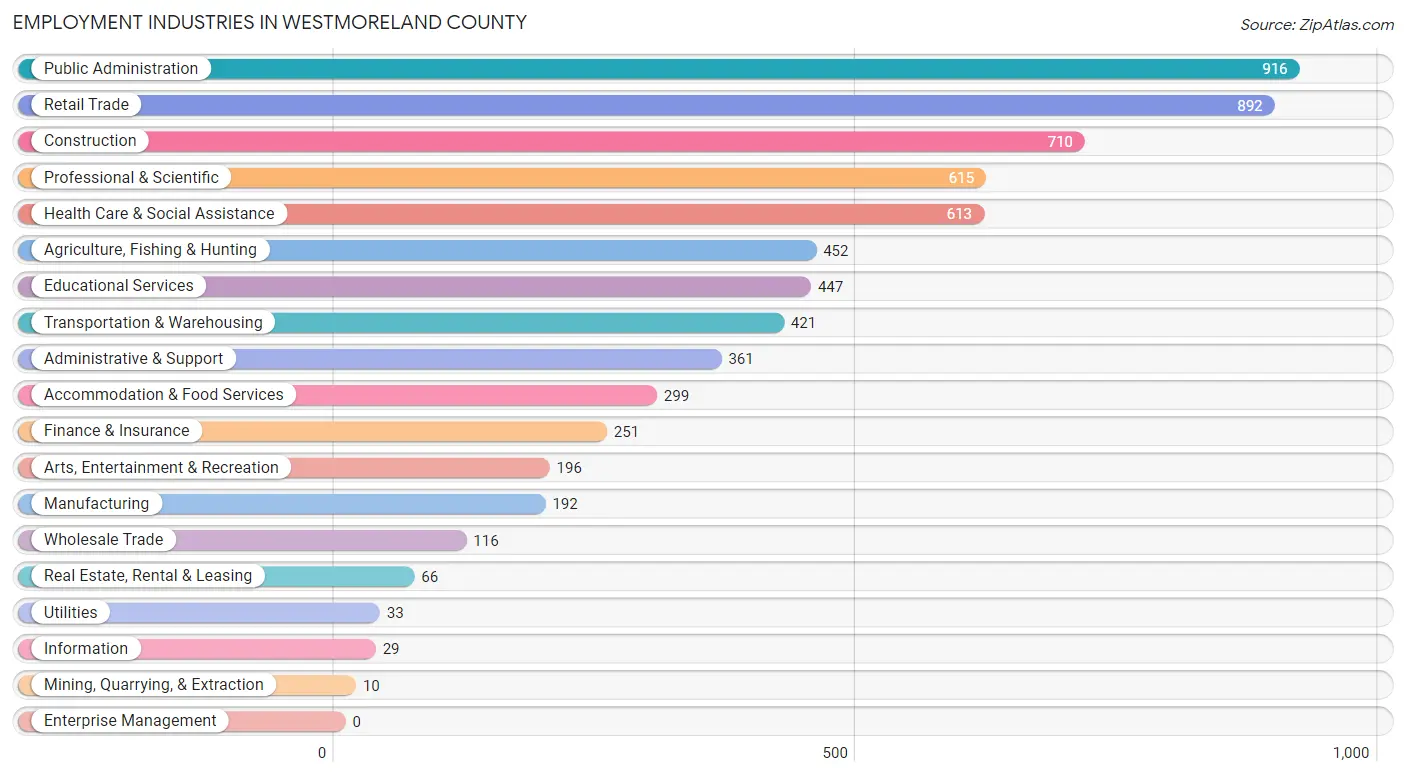
Employment Industries in Westmoreland County
The major employment industries in Westmoreland County include Public Administration (916 | 13.1%), Retail Trade (892 | 12.7%), Construction (710 | 10.1%), Professional & Scientific (615 | 8.8%), and Health Care & Social Assistance (613 | 8.7%).
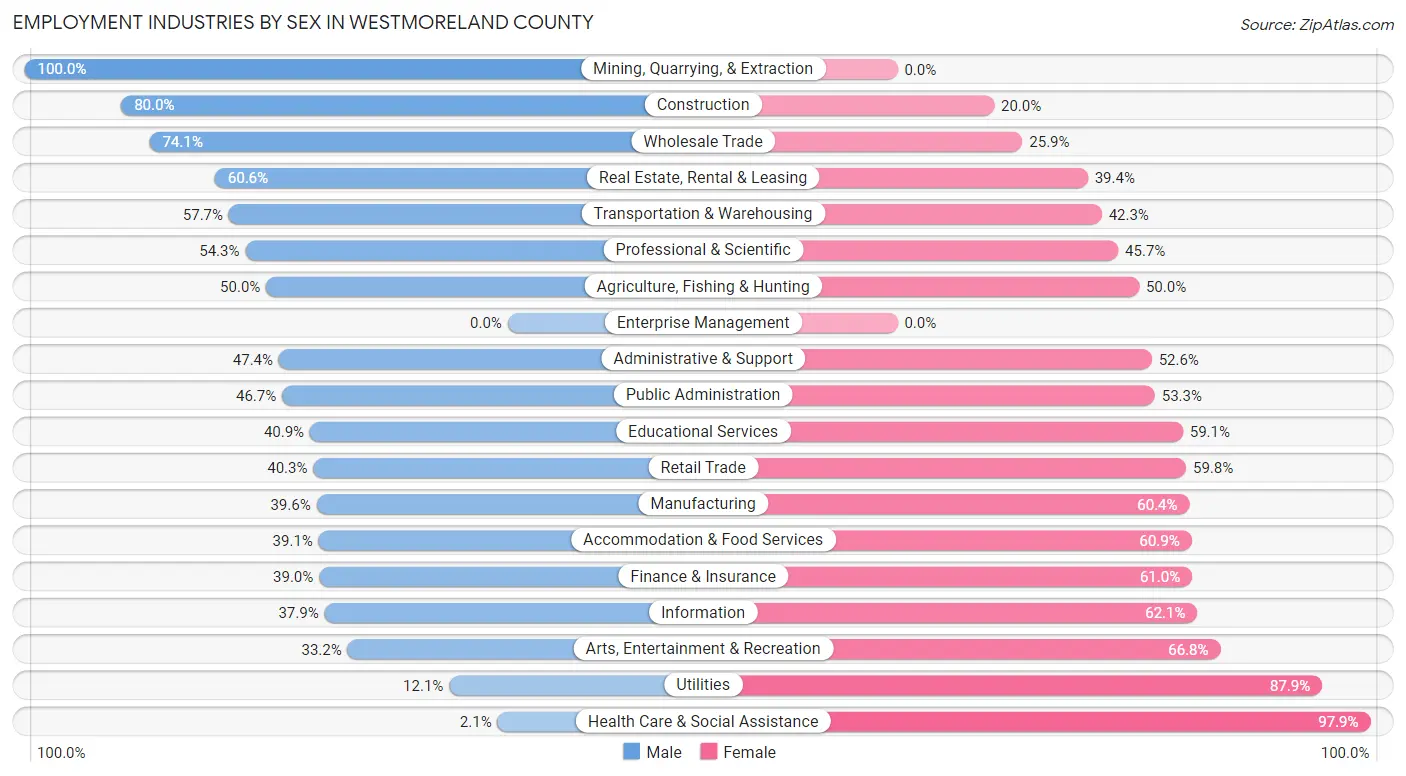
Employment Industries by Sex in Westmoreland County
The Westmoreland County industries that see more men than women are Mining, Quarrying, & Extraction (100.0%), Construction (80.0%), and Wholesale Trade (74.1%), whereas the industries that tend to have a higher number of women are Health Care & Social Assistance (97.9%), Utilities (87.9%), and Arts, Entertainment & Recreation (66.8%).
| Industry | Male | Female |
| Agriculture, Fishing & Hunting | 226 (50.0%) | 226 (50.0%) |
| Mining, Quarrying, & Extraction | 10 (100.0%) | 0 (0.0%) |
| Construction | 568 (80.0%) | 142 (20.0%) |
| Manufacturing | 76 (39.6%) | 116 (60.4%) |
| Wholesale Trade | 86 (74.1%) | 30 (25.9%) |
| Retail Trade | 359 (40.3%) | 533 (59.8%) |
| Transportation & Warehousing | 243 (57.7%) | 178 (42.3%) |
| Utilities | 4 (12.1%) | 29 (87.9%) |
| Information | 11 (37.9%) | 18 (62.1%) |
| Finance & Insurance | 98 (39.0%) | 153 (61.0%) |
| Real Estate, Rental & Leasing | 40 (60.6%) | 26 (39.4%) |
| Professional & Scientific | 334 (54.3%) | 281 (45.7%) |
| Enterprise Management | 0 (0.0%) | 0 (0.0%) |
| Administrative & Support | 171 (47.4%) | 190 (52.6%) |
| Educational Services | 183 (40.9%) | 264 (59.1%) |
| Health Care & Social Assistance | 13 (2.1%) | 600 (97.9%) |
| Arts, Entertainment & Recreation | 65 (33.2%) | 131 (66.8%) |
| Accommodation & Food Services | 117 (39.1%) | 182 (60.9%) |
| Public Administration | 428 (46.7%) | 488 (53.3%) |
| Total | 3,206 (45.7%) | 3,810 (54.3%) |
Education in Westmoreland County
School Enrollment in Westmoreland County
The most common levels of schooling among the 3,029 students in Westmoreland County are high school (958 | 31.6%), elementary school (747 | 24.7%), and middle school (728 | 24.0%).
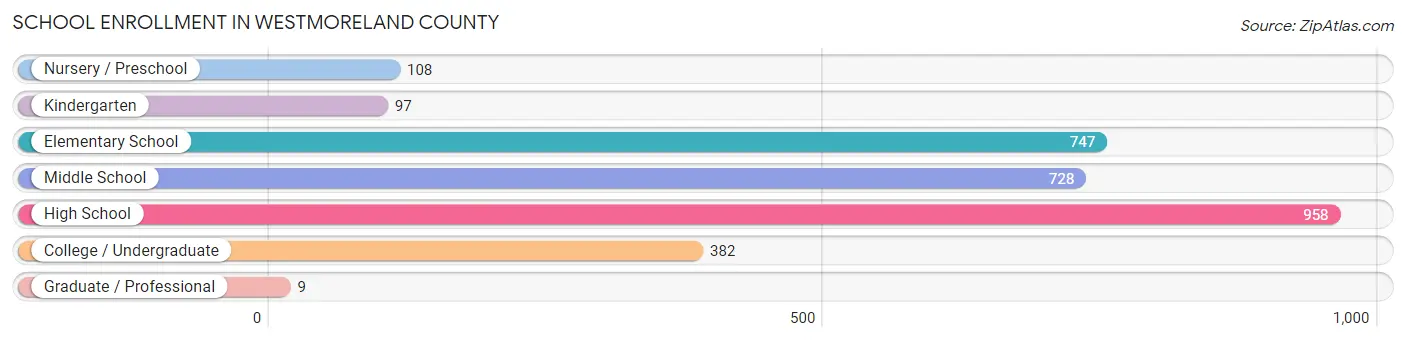
| School Level | # Students | % Students |
| Nursery / Preschool | 108 | 3.6% |
| Kindergarten | 97 | 3.2% |
| Elementary School | 747 | 24.7% |
| Middle School | 728 | 24.0% |
| High School | 958 | 31.6% |
| College / Undergraduate | 382 | 12.6% |
| Graduate / Professional | 9 | 0.3% |
| Total | 3,029 | 100.0% |
School Enrollment by Age by Funding Source in Westmoreland County
Out of a total of 3,029 students who are enrolled in schools in Westmoreland County, 176 (5.8%) attend a private institution, while the remaining 2,853 (94.2%) are enrolled in public schools. The age group of 25 to 34 year olds has the highest likelihood of being enrolled in private schools, with 32 (17.8% in the age bracket) enrolled. Conversely, the age group of 15 to 17 year olds has the lowest likelihood of being enrolled in a private school, with 595 (100.0% in the age bracket) attending a public institution.
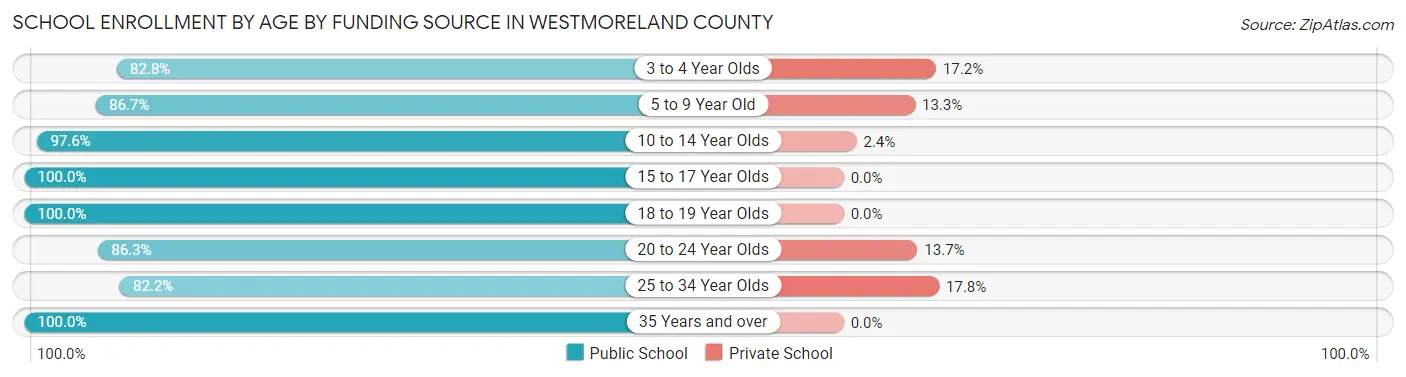
| Age Bracket | Public School | Private School |
| 3 to 4 Year Olds | 77 (82.8%) | 16 (17.2%) |
| 5 to 9 Year Old | 612 (86.7%) | 94 (13.3%) |
| 10 to 14 Year Olds | 1,058 (97.6%) | 26 (2.4%) |
| 15 to 17 Year Olds | 595 (100.0%) | 0 (0.0%) |
| 18 to 19 Year Olds | 211 (100.0%) | 0 (0.0%) |
| 20 to 24 Year Olds | 44 (86.3%) | 7 (13.7%) |
| 25 to 34 Year Olds | 148 (82.2%) | 32 (17.8%) |
| 35 Years and over | 109 (100.0%) | 0 (0.0%) |
| Total | 2,853 (94.2%) | 176 (5.8%) |
Educational Attainment by Field of Study in Westmoreland County
Business (520 | 18.4%), education (364 | 12.9%), social sciences (290 | 10.2%), science & technology (280 | 9.9%), and computers & mathematics (257 | 9.1%) are the most common fields of study among 2,828 individuals in Westmoreland County who have obtained a bachelor's degree or higher.
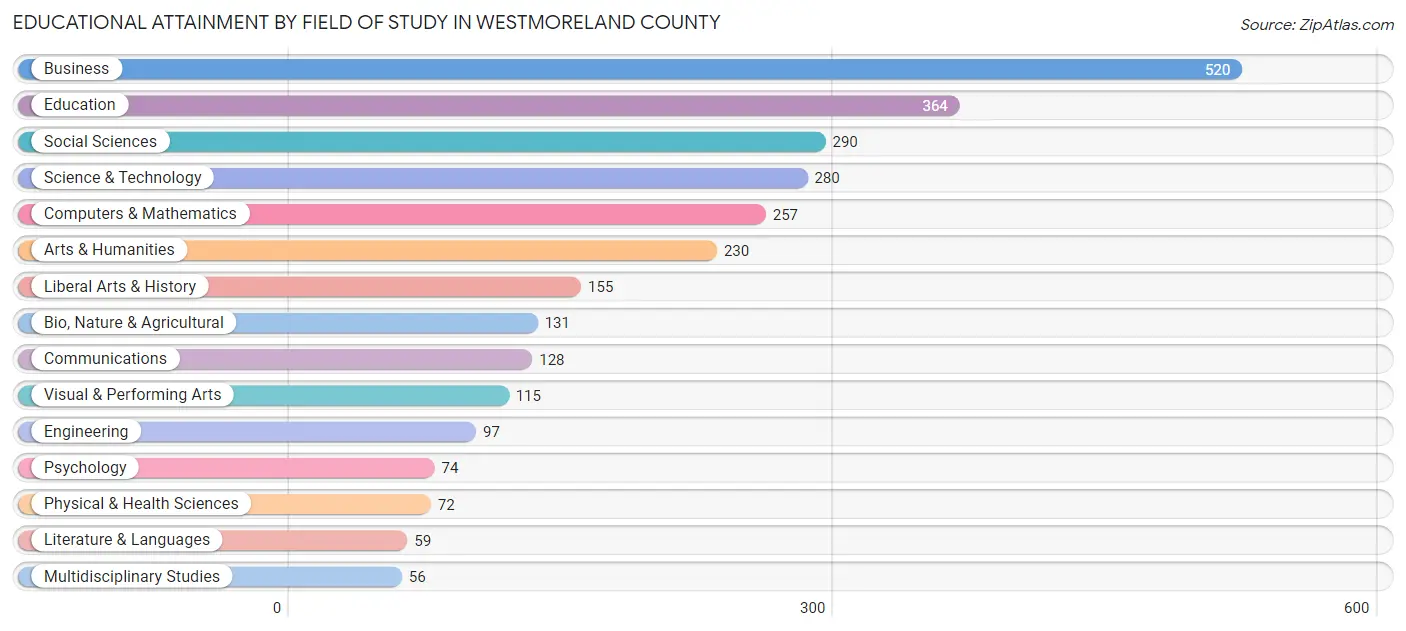
| Field of Study | # Graduates | % Graduates |
| Computers & Mathematics | 257 | 9.1% |
| Bio, Nature & Agricultural | 131 | 4.6% |
| Physical & Health Sciences | 72 | 2.5% |
| Psychology | 74 | 2.6% |
| Social Sciences | 290 | 10.2% |
| Engineering | 97 | 3.4% |
| Multidisciplinary Studies | 56 | 2.0% |
| Science & Technology | 280 | 9.9% |
| Business | 520 | 18.4% |
| Education | 364 | 12.9% |
| Literature & Languages | 59 | 2.1% |
| Liberal Arts & History | 155 | 5.5% |
| Visual & Performing Arts | 115 | 4.1% |
| Communications | 128 | 4.5% |
| Arts & Humanities | 230 | 8.1% |
| Total | 2,828 | 100.0% |
Transportation & Commute in Westmoreland County
Vehicle Availability by Sex in Westmoreland County
The most prevalent vehicle ownership categories in Westmoreland County are males with 2 vehicles (1,104, accounting for 34.1%) and females with 2 vehicles (1,319, making up 29.6%).
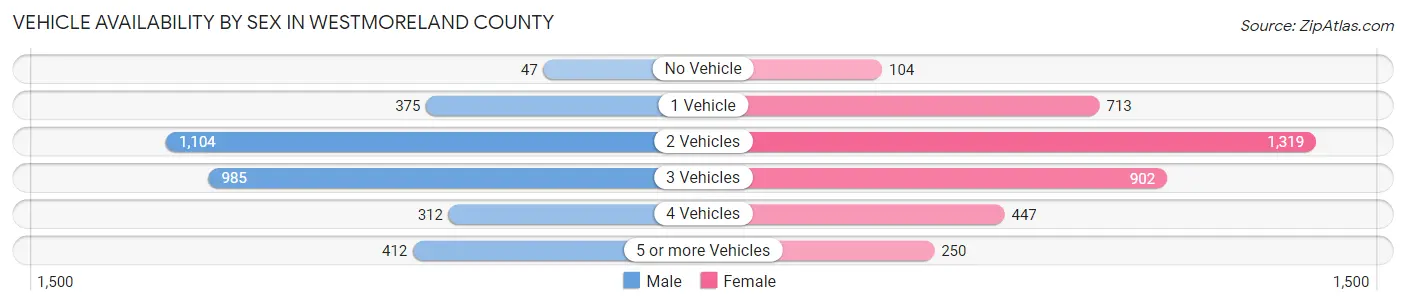
| Vehicles Available | Male | Female |
| No Vehicle | 47 (1.5%) | 104 (2.8%) |
| 1 Vehicle | 375 (11.6%) | 713 (19.1%) |
| 2 Vehicles | 1,104 (34.1%) | 1,319 (35.3%) |
| 3 Vehicles | 985 (30.4%) | 902 (24.1%) |
| 4 Vehicles | 312 (9.6%) | 447 (12.0%) |
| 5 or more Vehicles | 412 (12.7%) | 250 (6.7%) |
| Total | 3,235 (100.0%) | 3,735 (100.0%) |
Commute Time in Westmoreland County
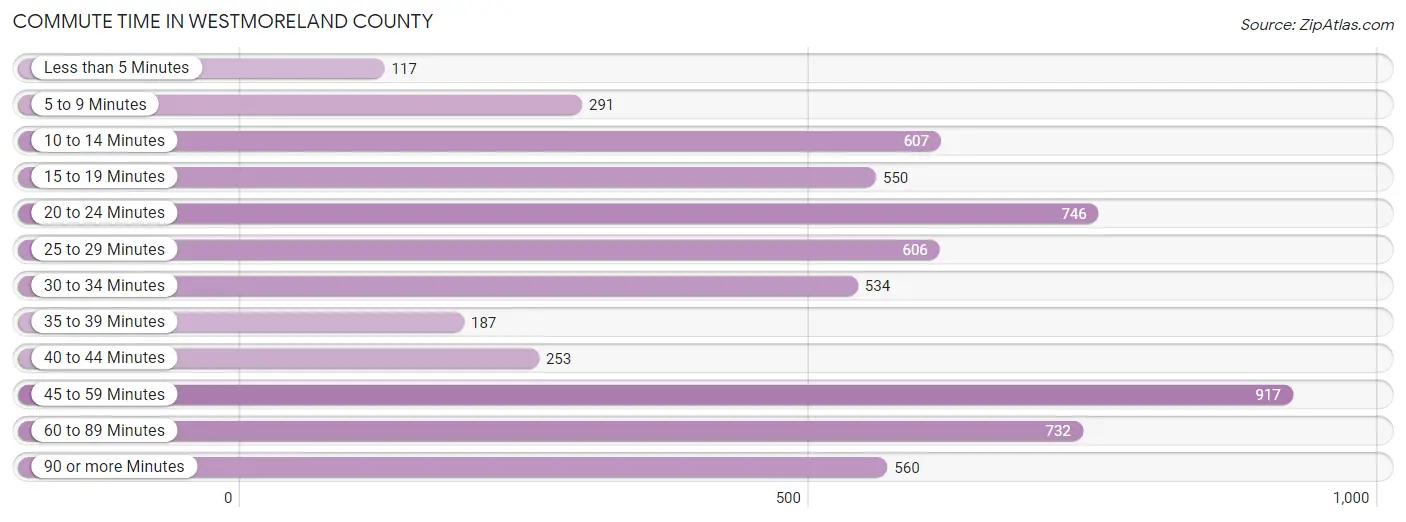
The most frequently occuring commute durations in Westmoreland County are 45 to 59 minutes (917 commuters, 15.0%), 20 to 24 minutes (746 commuters, 12.2%), and 60 to 89 minutes (732 commuters, 12.0%).
| Commute Time | # Commuters | % Commuters |
| Less than 5 Minutes | 117 | 1.9% |
| 5 to 9 Minutes | 291 | 4.8% |
| 10 to 14 Minutes | 607 | 10.0% |
| 15 to 19 Minutes | 550 | 9.0% |
| 20 to 24 Minutes | 746 | 12.2% |
| 25 to 29 Minutes | 606 | 9.9% |
| 30 to 34 Minutes | 534 | 8.7% |
| 35 to 39 Minutes | 187 | 3.1% |
| 40 to 44 Minutes | 253 | 4.2% |
| 45 to 59 Minutes | 917 | 15.0% |
| 60 to 89 Minutes | 732 | 12.0% |
| 90 or more Minutes | 560 | 9.2% |
Commute Time by Sex in Westmoreland County
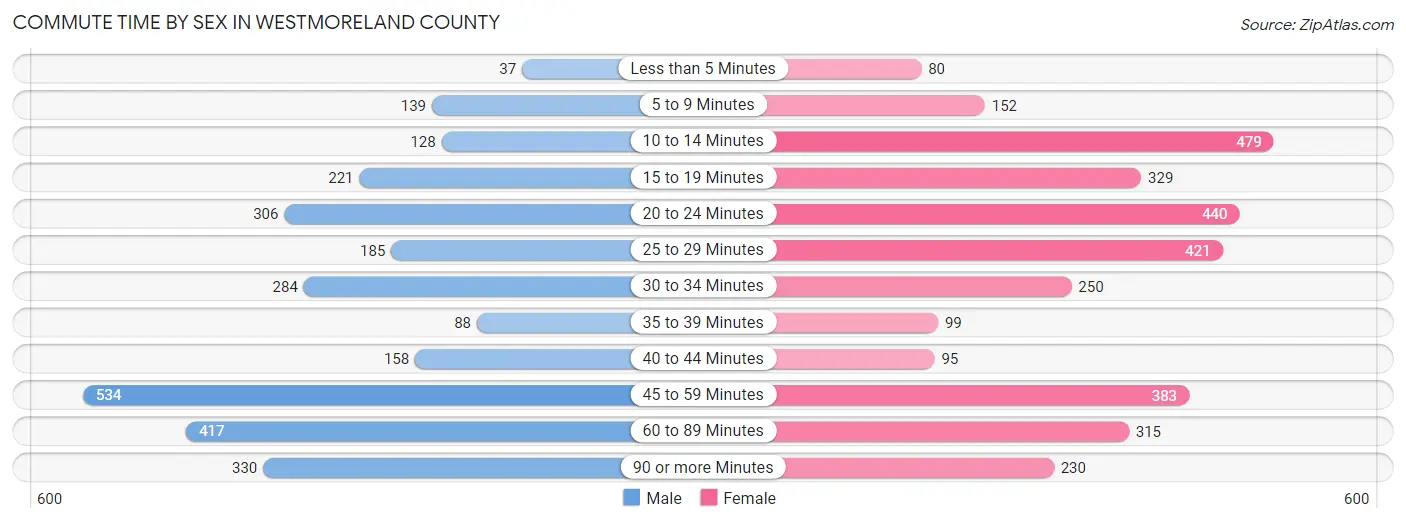
The most common commute times in Westmoreland County are 45 to 59 minutes (534 commuters, 18.9%) for males and 10 to 14 minutes (479 commuters, 14.6%) for females.
| Commute Time | Male | Female |
| Less than 5 Minutes | 37 (1.3%) | 80 (2.4%) |
| 5 to 9 Minutes | 139 (4.9%) | 152 (4.6%) |
| 10 to 14 Minutes | 128 (4.5%) | 479 (14.6%) |
| 15 to 19 Minutes | 221 (7.8%) | 329 (10.1%) |
| 20 to 24 Minutes | 306 (10.8%) | 440 (13.4%) |
| 25 to 29 Minutes | 185 (6.5%) | 421 (12.9%) |
| 30 to 34 Minutes | 284 (10.1%) | 250 (7.6%) |
| 35 to 39 Minutes | 88 (3.1%) | 99 (3.0%) |
| 40 to 44 Minutes | 158 (5.6%) | 95 (2.9%) |
| 45 to 59 Minutes | 534 (18.9%) | 383 (11.7%) |
| 60 to 89 Minutes | 417 (14.7%) | 315 (9.6%) |
| 90 or more Minutes | 330 (11.7%) | 230 (7.0%) |
Time of Departure to Work by Sex in Westmoreland County
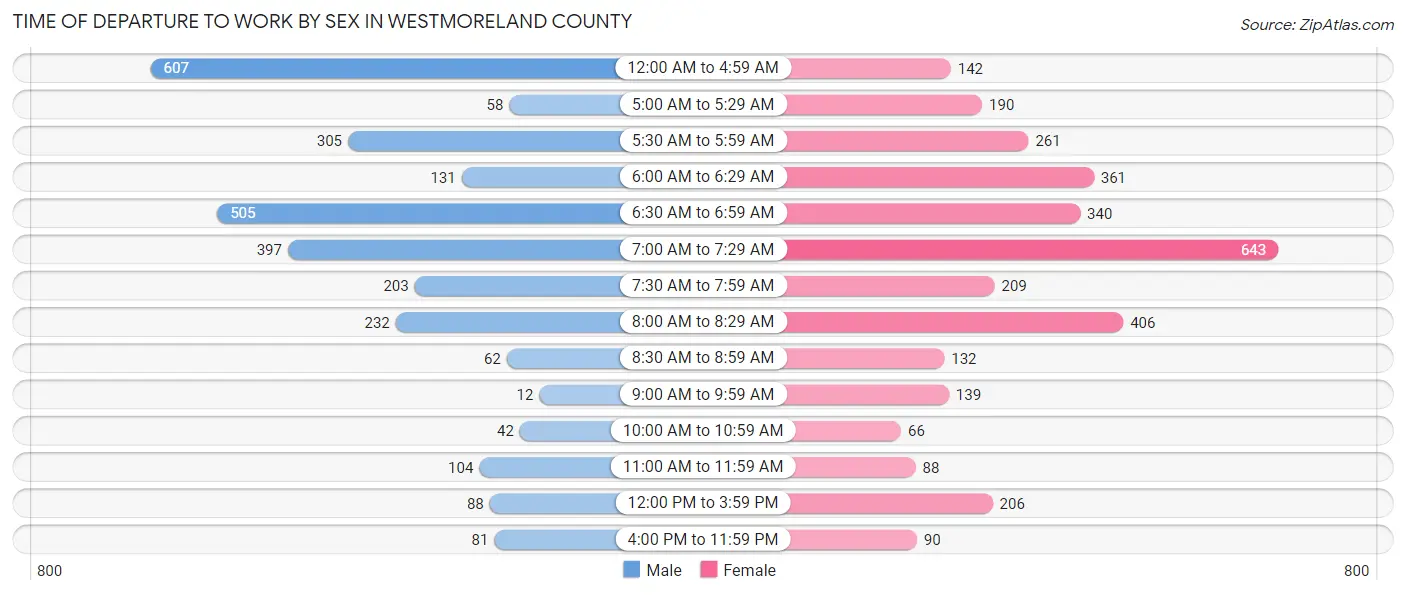
The most frequent times of departure to work in Westmoreland County are 12:00 AM to 4:59 AM (607, 21.5%) for males and 7:00 AM to 7:29 AM (643, 19.7%) for females.
| Time of Departure | Male | Female |
| 12:00 AM to 4:59 AM | 607 (21.5%) | 142 (4.3%) |
| 5:00 AM to 5:29 AM | 58 (2.1%) | 190 (5.8%) |
| 5:30 AM to 5:59 AM | 305 (10.8%) | 261 (8.0%) |
| 6:00 AM to 6:29 AM | 131 (4.6%) | 361 (11.0%) |
| 6:30 AM to 6:59 AM | 505 (17.9%) | 340 (10.4%) |
| 7:00 AM to 7:29 AM | 397 (14.0%) | 643 (19.7%) |
| 7:30 AM to 7:59 AM | 203 (7.2%) | 209 (6.4%) |
| 8:00 AM to 8:29 AM | 232 (8.2%) | 406 (12.4%) |
| 8:30 AM to 8:59 AM | 62 (2.2%) | 132 (4.0%) |
| 9:00 AM to 9:59 AM | 12 (0.4%) | 139 (4.3%) |
| 10:00 AM to 10:59 AM | 42 (1.5%) | 66 (2.0%) |
| 11:00 AM to 11:59 AM | 104 (3.7%) | 88 (2.7%) |
| 12:00 PM to 3:59 PM | 88 (3.1%) | 206 (6.3%) |
| 4:00 PM to 11:59 PM | 81 (2.9%) | 90 (2.8%) |
| Total | 2,827 (100.0%) | 3,273 (100.0%) |
Housing Occupancy in Westmoreland County
Occupancy by Ownership in Westmoreland County
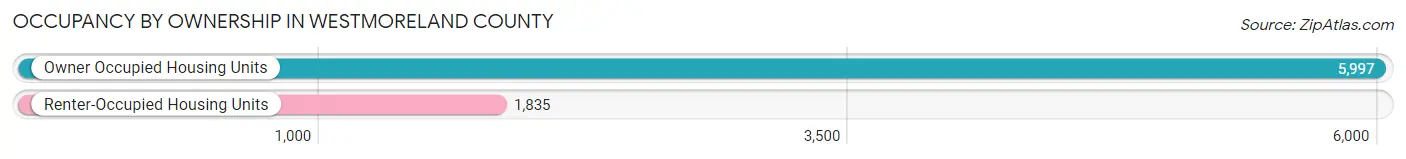
Of the total 7,832 dwellings in Westmoreland County, owner-occupied units account for 5,997 (76.6%), while renter-occupied units make up 1,835 (23.4%).
| Occupancy | # Housing Units | % Housing Units |
| Owner Occupied Housing Units | 5,997 | 76.6% |
| Renter-Occupied Housing Units | 1,835 | 23.4% |
| Total Occupied Housing Units | 7,832 | 100.0% |
Occupancy by Household Size in Westmoreland County
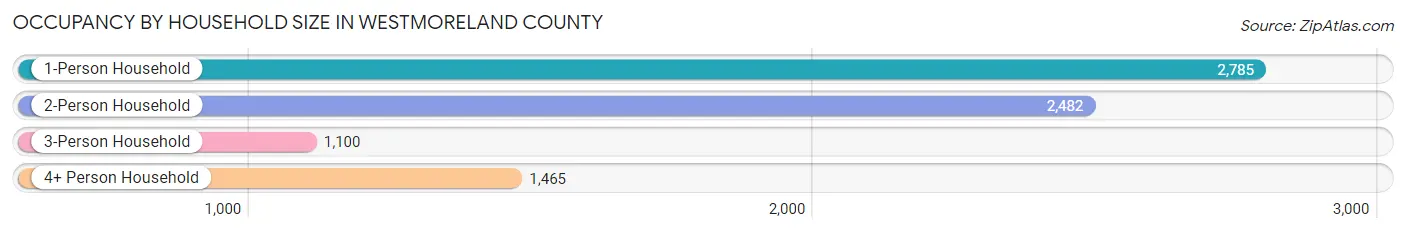
| Household Size | # Housing Units | % Housing Units |
| 1-Person Household | 2,785 | 35.6% |
| 2-Person Household | 2,482 | 31.7% |
| 3-Person Household | 1,100 | 14.0% |
| 4+ Person Household | 1,465 | 18.7% |
| Total Housing Units | 7,832 | 100.0% |
Occupancy by Ownership by Household Size in Westmoreland County
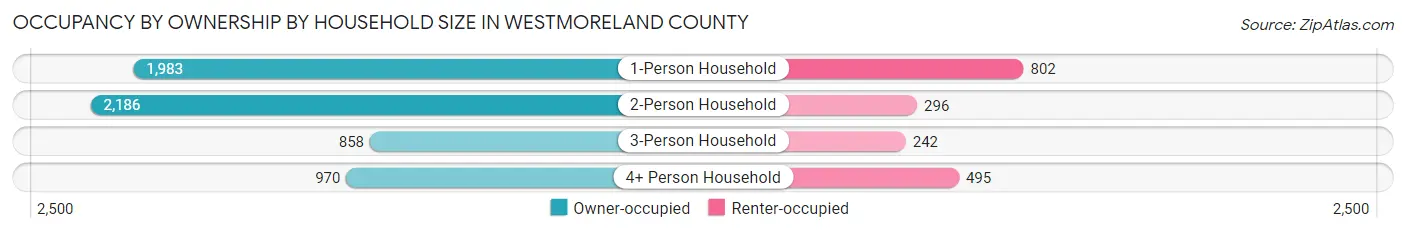
| Household Size | Owner-occupied | Renter-occupied |
| 1-Person Household | 1,983 (71.2%) | 802 (28.8%) |
| 2-Person Household | 2,186 (88.1%) | 296 (11.9%) |
| 3-Person Household | 858 (78.0%) | 242 (22.0%) |
| 4+ Person Household | 970 (66.2%) | 495 (33.8%) |
| Total Housing Units | 5,997 (76.6%) | 1,835 (23.4%) |
Occupancy by Educational Attainment in Westmoreland County
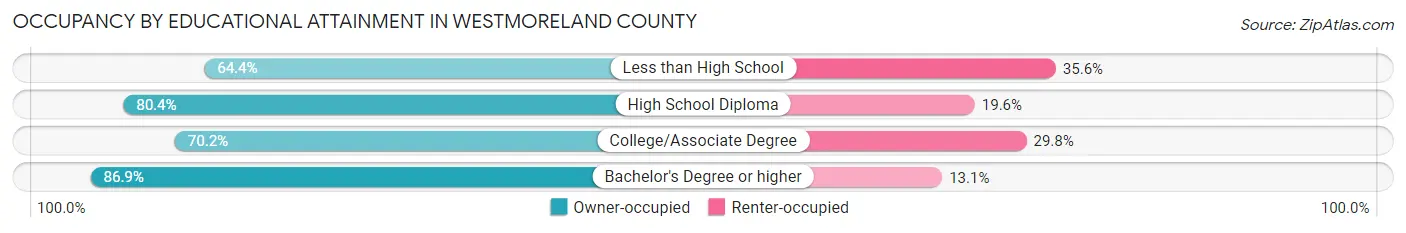
| Household Size | Owner-occupied | Renter-occupied |
| Less than High School | 795 (64.4%) | 440 (35.6%) |
| High School Diploma | 2,335 (80.4%) | 568 (19.6%) |
| College/Associate Degree | 1,441 (70.2%) | 612 (29.8%) |
| Bachelor's Degree or higher | 1,426 (86.9%) | 215 (13.1%) |
Occupancy by Age of Householder in Westmoreland County
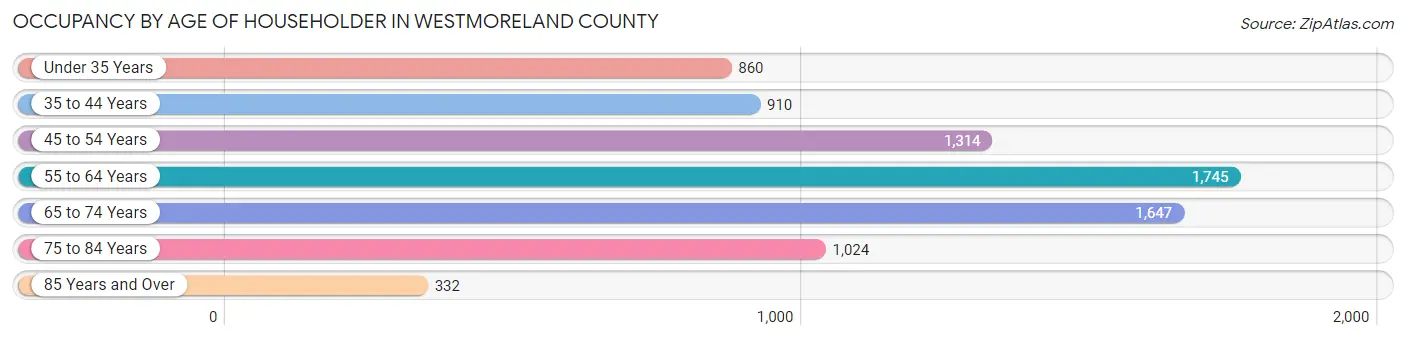
| Age Bracket | # Households | % Households |
| Under 35 Years | 860 | 11.0% |
| 35 to 44 Years | 910 | 11.6% |
| 45 to 54 Years | 1,314 | 16.8% |
| 55 to 64 Years | 1,745 | 22.3% |
| 65 to 74 Years | 1,647 | 21.0% |
| 75 to 84 Years | 1,024 | 13.1% |
| 85 Years and Over | 332 | 4.2% |
| Total | 7,832 | 100.0% |
Housing Finances in Westmoreland County
Median Income by Occupancy in Westmoreland County
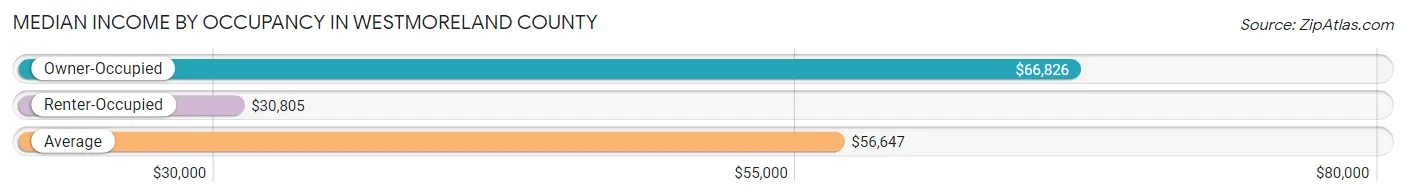
| Occupancy Type | # Households | Median Income |
| Owner-Occupied | 5,997 (76.6%) | $66,826 |
| Renter-Occupied | 1,835 (23.4%) | $30,805 |
| Average | 7,832 (100.0%) | $56,647 |
Occupancy by Householder Income Bracket in Westmoreland County
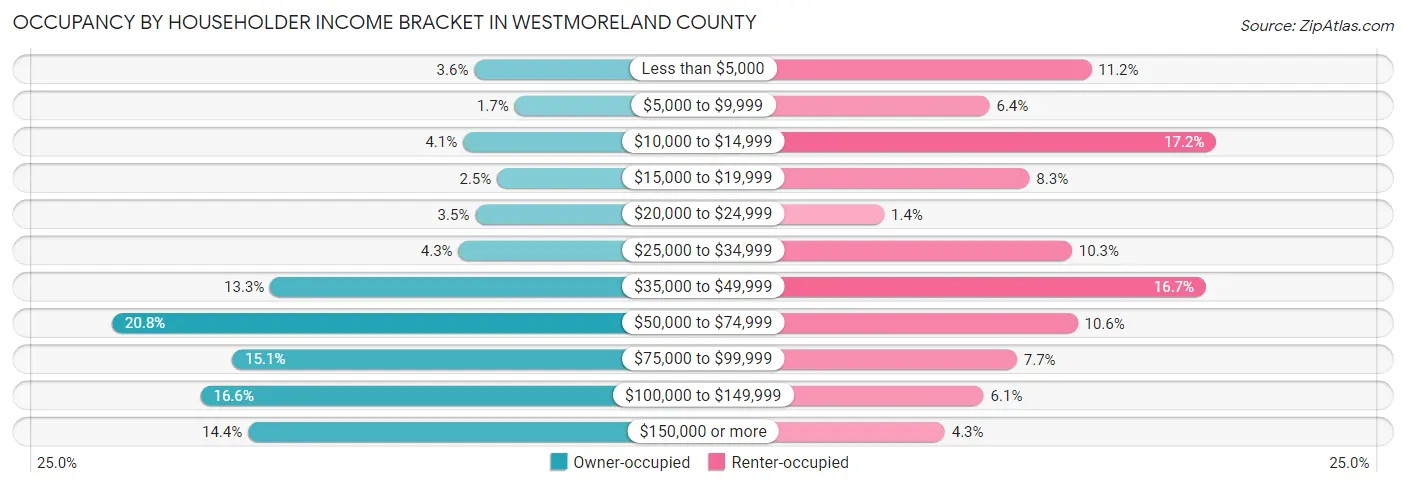
| Income Bracket | Owner-occupied | Renter-occupied |
| Less than $5,000 | 215 (3.6%) | 206 (11.2%) |
| $5,000 to $9,999 | 100 (1.7%) | 117 (6.4%) |
| $10,000 to $14,999 | 247 (4.1%) | 315 (17.2%) |
| $15,000 to $19,999 | 150 (2.5%) | 152 (8.3%) |
| $20,000 to $24,999 | 212 (3.5%) | 25 (1.4%) |
| $25,000 to $34,999 | 260 (4.3%) | 189 (10.3%) |
| $35,000 to $49,999 | 798 (13.3%) | 306 (16.7%) |
| $50,000 to $74,999 | 1,250 (20.8%) | 194 (10.6%) |
| $75,000 to $99,999 | 907 (15.1%) | 141 (7.7%) |
| $100,000 to $149,999 | 997 (16.6%) | 112 (6.1%) |
| $150,000 or more | 861 (14.4%) | 78 (4.3%) |
| Total | 5,997 (100.0%) | 1,835 (100.0%) |
Monthly Housing Cost Tiers in Westmoreland County
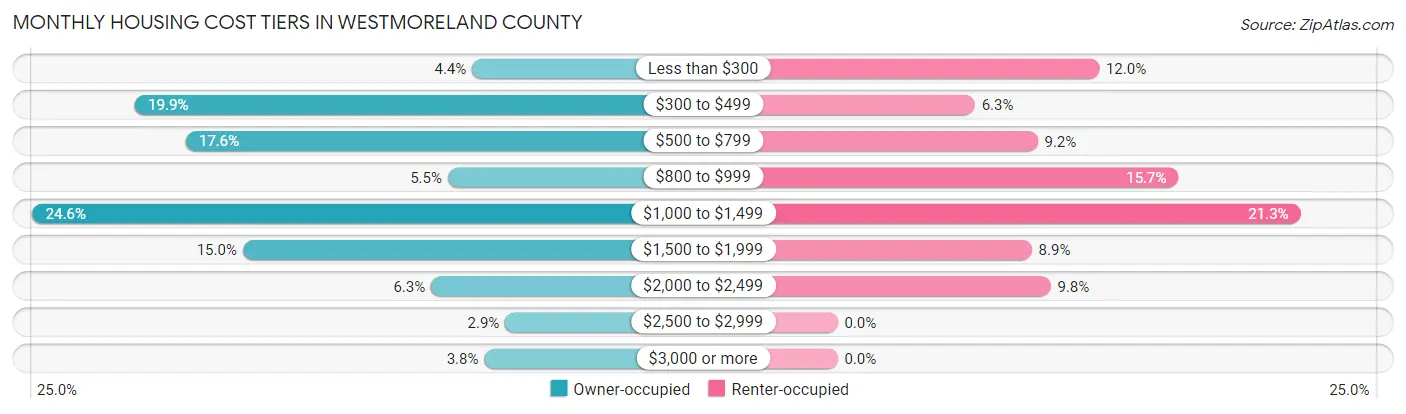
| Monthly Cost | Owner-occupied | Renter-occupied |
| Less than $300 | 264 (4.4%) | 221 (12.0%) |
| $300 to $499 | 1,194 (19.9%) | 116 (6.3%) |
| $500 to $799 | 1,054 (17.6%) | 169 (9.2%) |
| $800 to $999 | 331 (5.5%) | 288 (15.7%) |
| $1,000 to $1,499 | 1,477 (24.6%) | 391 (21.3%) |
| $1,500 to $1,999 | 897 (15.0%) | 164 (8.9%) |
| $2,000 to $2,499 | 377 (6.3%) | 180 (9.8%) |
| $2,500 to $2,999 | 173 (2.9%) | 0 (0.0%) |
| $3,000 or more | 230 (3.8%) | 0 (0.0%) |
| Total | 5,997 (100.0%) | 1,835 (100.0%) |
Physical Housing Characteristics in Westmoreland County
Housing Structures in Westmoreland County
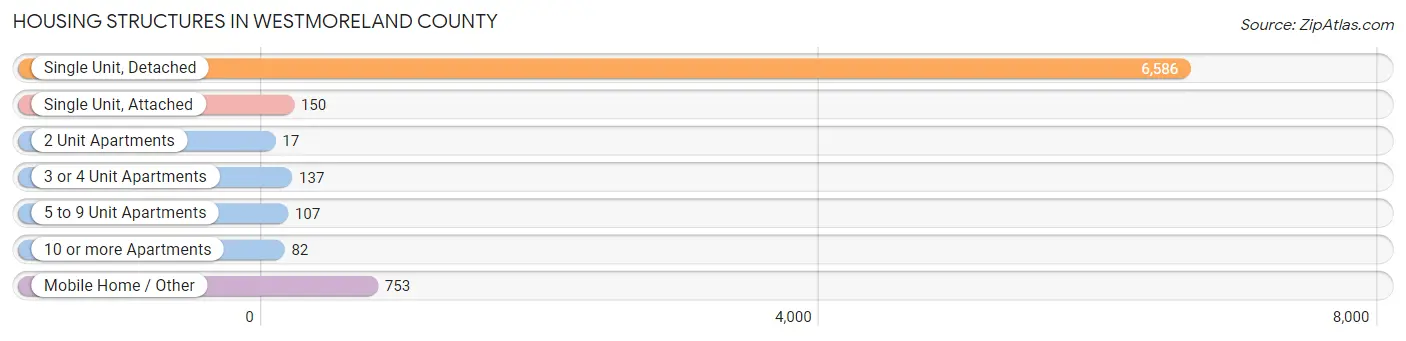
| Structure Type | # Housing Units | % Housing Units |
| Single Unit, Detached | 6,586 | 84.1% |
| Single Unit, Attached | 150 | 1.9% |
| 2 Unit Apartments | 17 | 0.2% |
| 3 or 4 Unit Apartments | 137 | 1.8% |
| 5 to 9 Unit Apartments | 107 | 1.4% |
| 10 or more Apartments | 82 | 1.1% |
| Mobile Home / Other | 753 | 9.6% |
| Total | 7,832 | 100.0% |
Housing Structures by Occupancy in Westmoreland County
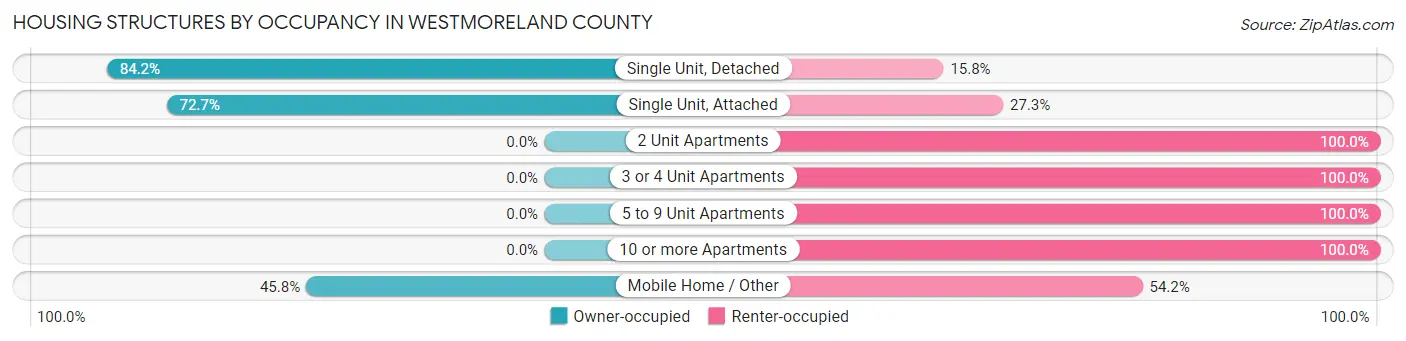
| Structure Type | Owner-occupied | Renter-occupied |
| Single Unit, Detached | 5,543 (84.2%) | 1,043 (15.8%) |
| Single Unit, Attached | 109 (72.7%) | 41 (27.3%) |
| 2 Unit Apartments | 0 (0.0%) | 17 (100.0%) |
| 3 or 4 Unit Apartments | 0 (0.0%) | 137 (100.0%) |
| 5 to 9 Unit Apartments | 0 (0.0%) | 107 (100.0%) |
| 10 or more Apartments | 0 (0.0%) | 82 (100.0%) |
| Mobile Home / Other | 345 (45.8%) | 408 (54.2%) |
| Total | 5,997 (76.6%) | 1,835 (23.4%) |
Housing Structures by Number of Rooms in Westmoreland County
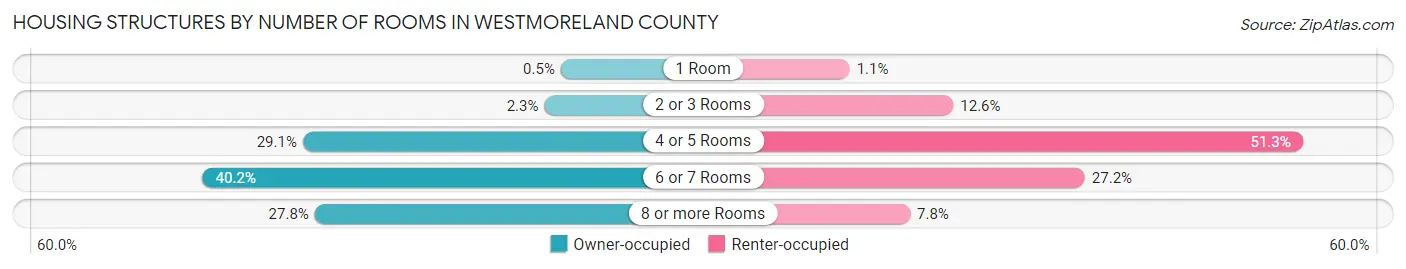
| Number of Rooms | Owner-occupied | Renter-occupied |
| 1 Room | 30 (0.5%) | 20 (1.1%) |
| 2 or 3 Rooms | 139 (2.3%) | 231 (12.6%) |
| 4 or 5 Rooms | 1,747 (29.1%) | 942 (51.3%) |
| 6 or 7 Rooms | 2,413 (40.2%) | 499 (27.2%) |
| 8 or more Rooms | 1,668 (27.8%) | 143 (7.8%) |
| Total | 5,997 (100.0%) | 1,835 (100.0%) |
Housing Structure by Heating Type in Westmoreland County
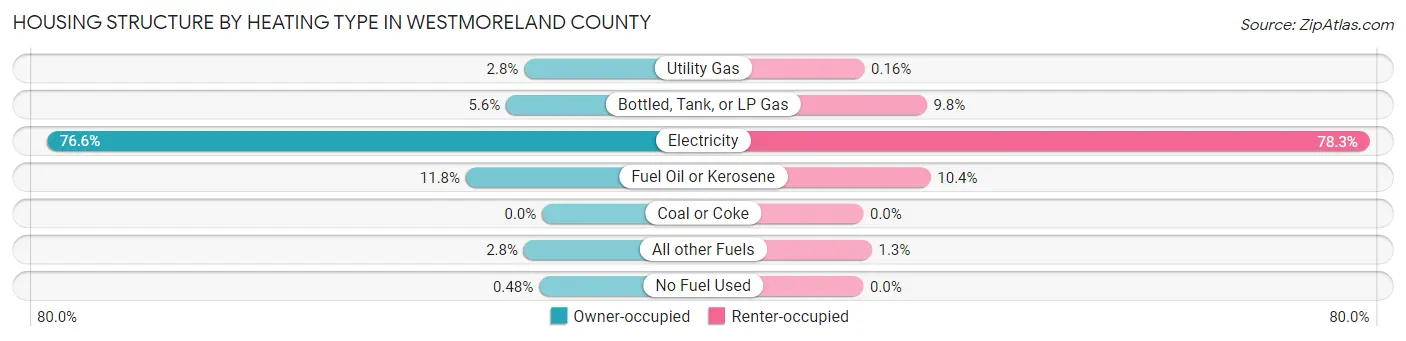
| Heating Type | Owner-occupied | Renter-occupied |
| Utility Gas | 166 (2.8%) | 3 (0.2%) |
| Bottled, Tank, or LP Gas | 334 (5.6%) | 180 (9.8%) |
| Electricity | 4,591 (76.5%) | 1,437 (78.3%) |
| Fuel Oil or Kerosene | 707 (11.8%) | 191 (10.4%) |
| Coal or Coke | 0 (0.0%) | 0 (0.0%) |
| All other Fuels | 170 (2.8%) | 24 (1.3%) |
| No Fuel Used | 29 (0.5%) | 0 (0.0%) |
| Total | 5,997 (100.0%) | 1,835 (100.0%) |
Household Vehicle Usage in Westmoreland County
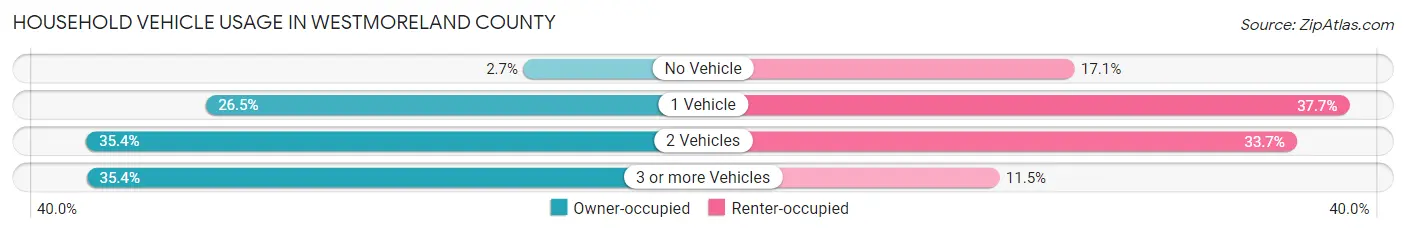
| Vehicles per Household | Owner-occupied | Renter-occupied |
| No Vehicle | 163 (2.7%) | 314 (17.1%) |
| 1 Vehicle | 1,590 (26.5%) | 691 (37.7%) |
| 2 Vehicles | 2,123 (35.4%) | 619 (33.7%) |
| 3 or more Vehicles | 2,121 (35.4%) | 211 (11.5%) |
| Total | 5,997 (100.0%) | 1,835 (100.0%) |
Real Estate & Mortgages in Westmoreland County
Real Estate and Mortgage Overview in Westmoreland County
| Characteristic | Without Mortgage | With Mortgage |
| Housing Units | 2,512 | 3,485 |
| Median Property Value | $255,600 | $240,100 |
| Median Household Income | $52,061 | $680 |
| Monthly Housing Costs | $477 | $230 |
| Real Estate Taxes | $1,660 | $61 |
Property Value by Mortgage Status in Westmoreland County
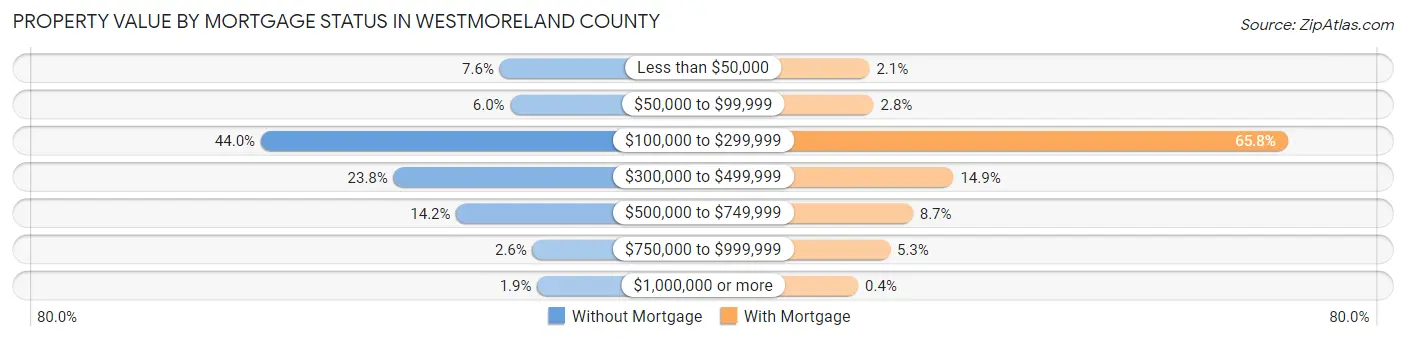
| Property Value | Without Mortgage | With Mortgage |
| Less than $50,000 | 191 (7.6%) | 74 (2.1%) |
| $50,000 to $99,999 | 150 (6.0%) | 96 (2.8%) |
| $100,000 to $299,999 | 1,105 (44.0%) | 2,294 (65.8%) |
| $300,000 to $499,999 | 597 (23.8%) | 520 (14.9%) |
| $500,000 to $749,999 | 357 (14.2%) | 304 (8.7%) |
| $750,000 to $999,999 | 65 (2.6%) | 183 (5.2%) |
| $1,000,000 or more | 47 (1.9%) | 14 (0.4%) |
| Total | 2,512 (100.0%) | 3,485 (100.0%) |
Household Income by Mortgage Status in Westmoreland County
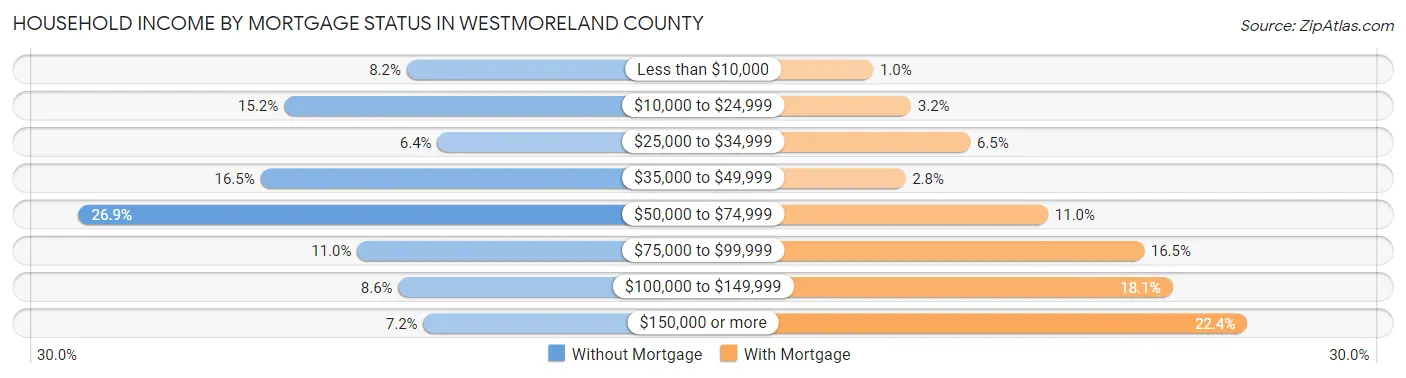
| Household Income | Without Mortgage | With Mortgage |
| Less than $10,000 | 205 (8.2%) | 35 (1.0%) |
| $10,000 to $24,999 | 381 (15.2%) | 110 (3.2%) |
| $25,000 to $34,999 | 161 (6.4%) | 228 (6.5%) |
| $35,000 to $49,999 | 415 (16.5%) | 99 (2.8%) |
| $50,000 to $74,999 | 676 (26.9%) | 383 (11.0%) |
| $75,000 to $99,999 | 276 (11.0%) | 574 (16.5%) |
| $100,000 to $149,999 | 217 (8.6%) | 631 (18.1%) |
| $150,000 or more | 181 (7.2%) | 780 (22.4%) |
| Total | 2,512 (100.0%) | 3,485 (100.0%) |
Property Value to Household Income Ratio in Westmoreland County
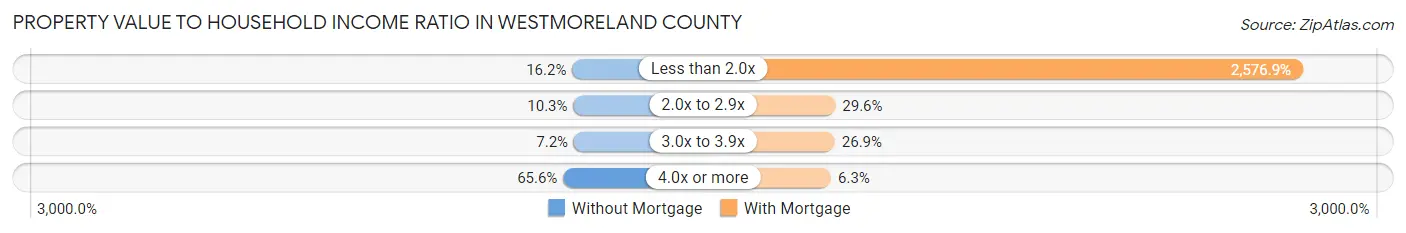
| Value-to-Income Ratio | Without Mortgage | With Mortgage |
| Less than 2.0x | 407 (16.2%) | 89,805 (2,576.9%) |
| 2.0x to 2.9x | 259 (10.3%) | 1,030 (29.6%) |
| 3.0x to 3.9x | 181 (7.2%) | 936 (26.9%) |
| 4.0x or more | 1,647 (65.6%) | 219 (6.3%) |
| Total | 2,512 (100.0%) | 3,485 (100.0%) |
Real Estate Taxes by Mortgage Status in Westmoreland County
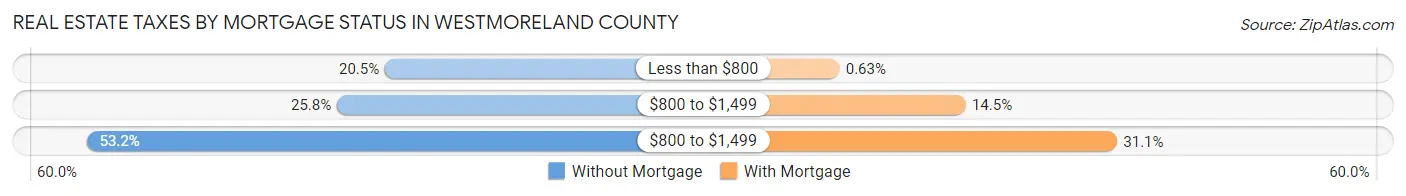
| Property Taxes | Without Mortgage | With Mortgage |
| Less than $800 | 515 (20.5%) | 22 (0.6%) |
| $800 to $1,499 | 647 (25.8%) | 504 (14.5%) |
| $800 to $1,499 | 1,337 (53.2%) | 1,082 (31.0%) |
| Total | 2,512 (100.0%) | 3,485 (100.0%) |
Health & Disability in Westmoreland County
Health Insurance Coverage by Age in Westmoreland County
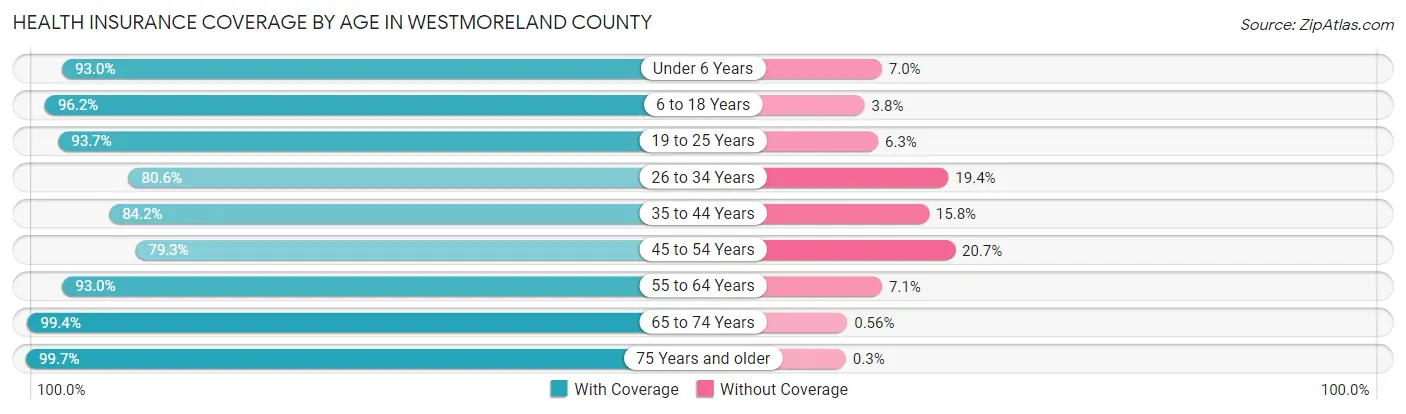
| Age Bracket | With Coverage | Without Coverage |
| Under 6 Years | 956 (93.0%) | 72 (7.0%) |
| 6 to 18 Years | 2,377 (96.2%) | 94 (3.8%) |
| 19 to 25 Years | 1,189 (93.7%) | 80 (6.3%) |
| 26 to 34 Years | 1,611 (80.6%) | 388 (19.4%) |
| 35 to 44 Years | 1,313 (84.2%) | 246 (15.8%) |
| 45 to 54 Years | 1,770 (79.3%) | 461 (20.7%) |
| 55 to 64 Years | 2,782 (92.9%) | 211 (7.0%) |
| 65 to 74 Years | 2,654 (99.4%) | 15 (0.6%) |
| 75 Years and older | 2,022 (99.7%) | 6 (0.3%) |
| Total | 16,674 (91.4%) | 1,573 (8.6%) |
Health Insurance Coverage by Citizenship Status in Westmoreland County
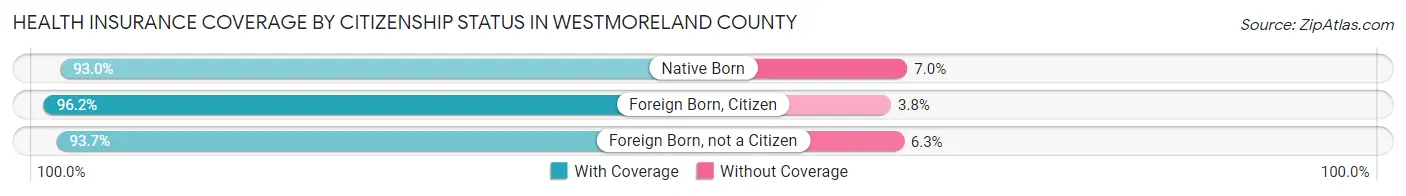
| Citizenship Status | With Coverage | Without Coverage |
| Native Born | 956 (93.0%) | 72 (7.0%) |
| Foreign Born, Citizen | 2,377 (96.2%) | 94 (3.8%) |
| Foreign Born, not a Citizen | 1,189 (93.7%) | 80 (6.3%) |
Health Insurance Coverage by Household Income in Westmoreland County
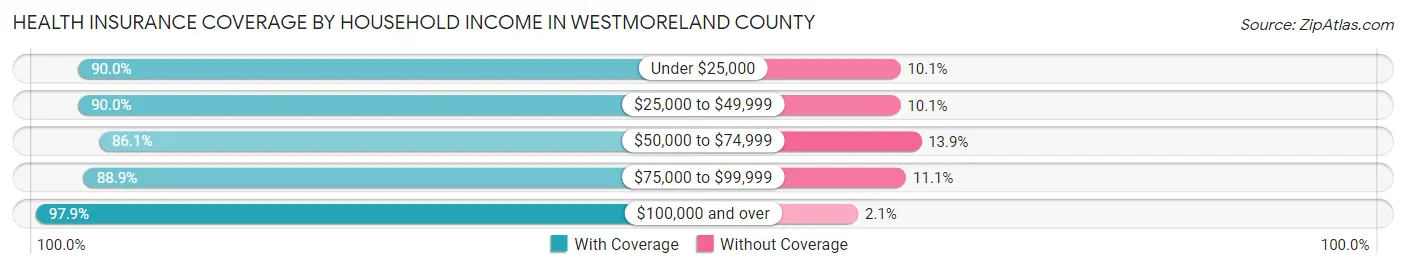
| Household Income | With Coverage | Without Coverage |
| Under $25,000 | 2,532 (89.9%) | 283 (10.1%) |
| $25,000 to $49,999 | 2,810 (89.9%) | 314 (10.1%) |
| $50,000 to $74,999 | 2,995 (86.1%) | 485 (13.9%) |
| $75,000 to $99,999 | 2,797 (88.9%) | 350 (11.1%) |
| $100,000 and over | 5,496 (97.9%) | 119 (2.1%) |
Public vs Private Health Insurance Coverage by Age in Westmoreland County
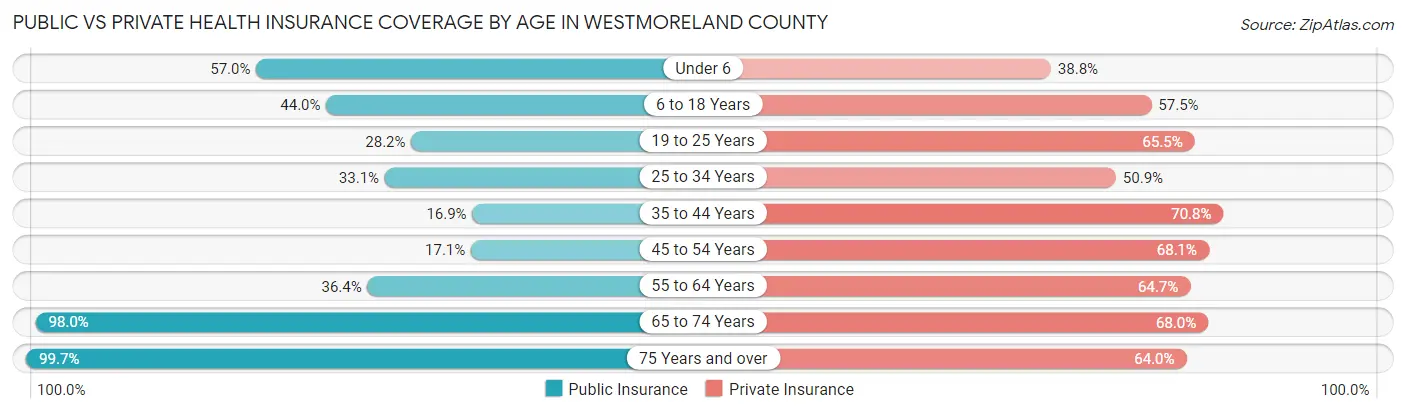
| Age Bracket | Public Insurance | Private Insurance |
| Under 6 | 586 (57.0%) | 399 (38.8%) |
| 6 to 18 Years | 1,087 (44.0%) | 1,420 (57.5%) |
| 19 to 25 Years | 358 (28.2%) | 831 (65.5%) |
| 25 to 34 Years | 662 (33.1%) | 1,017 (50.9%) |
| 35 to 44 Years | 263 (16.9%) | 1,104 (70.8%) |
| 45 to 54 Years | 382 (17.1%) | 1,520 (68.1%) |
| 55 to 64 Years | 1,088 (36.3%) | 1,935 (64.6%) |
| 65 to 74 Years | 2,615 (98.0%) | 1,814 (68.0%) |
| 75 Years and over | 2,022 (99.7%) | 1,297 (63.9%) |
| Total | 9,063 (49.7%) | 11,337 (62.1%) |
Disability Status by Sex by Age in Westmoreland County
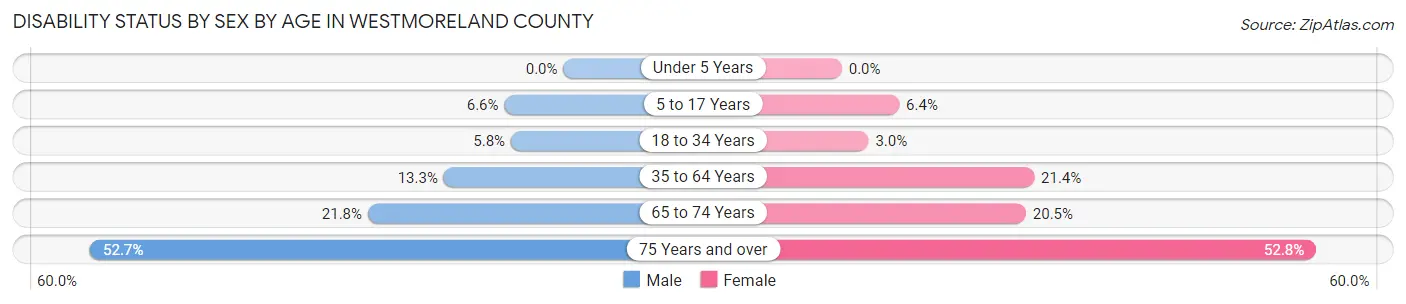
| Age Bracket | Male | Female |
| Under 5 Years | 0 (0.0%) | 0 (0.0%) |
| 5 to 17 Years | 91 (6.6%) | 70 (6.4%) |
| 18 to 34 Years | 98 (5.8%) | 51 (3.0%) |
| 35 to 64 Years | 416 (13.3%) | 784 (21.4%) |
| 65 to 74 Years | 270 (21.8%) | 293 (20.5%) |
| 75 Years and over | 517 (52.7%) | 553 (52.8%) |
Disability Class by Sex by Age in Westmoreland County
Disability Class: Hearing Difficulty
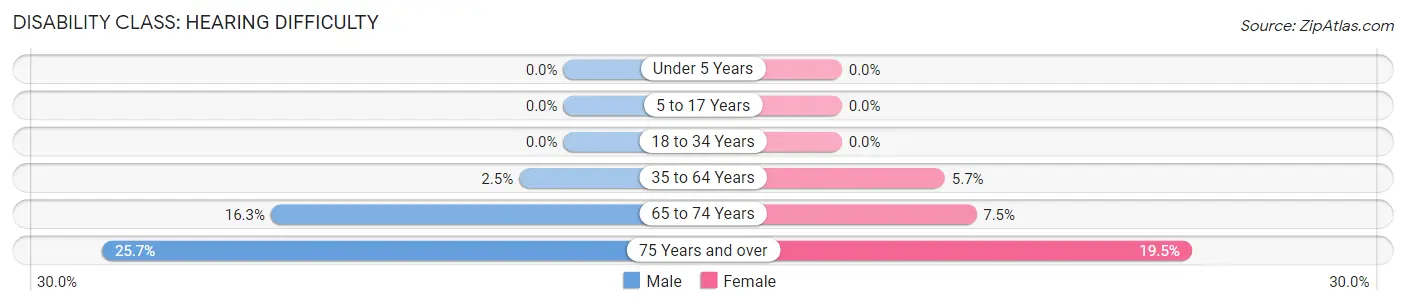
| Age Bracket | Male | Female |
| Under 5 Years | 0 (0.0%) | 0 (0.0%) |
| 5 to 17 Years | 0 (0.0%) | 0 (0.0%) |
| 18 to 34 Years | 0 (0.0%) | 0 (0.0%) |
| 35 to 64 Years | 77 (2.5%) | 210 (5.7%) |
| 65 to 74 Years | 202 (16.3%) | 107 (7.5%) |
| 75 Years and over | 252 (25.7%) | 204 (19.5%) |
Disability Class: Vision Difficulty
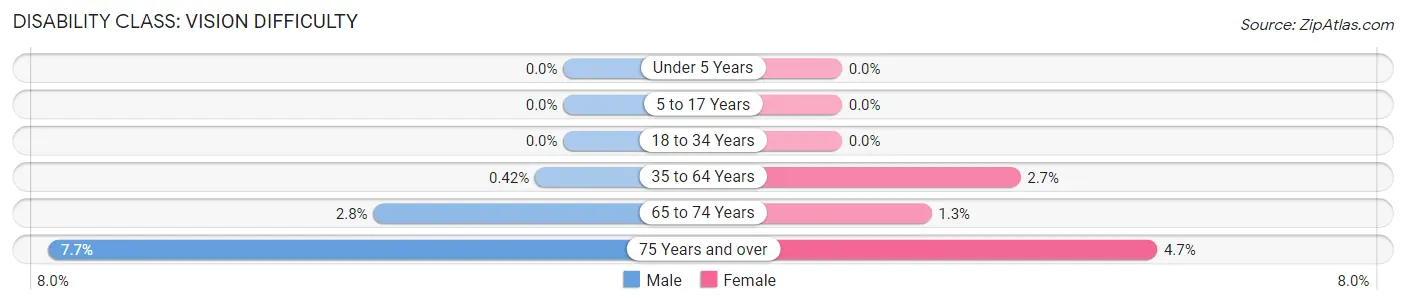
| Age Bracket | Male | Female |
| Under 5 Years | 0 (0.0%) | 0 (0.0%) |
| 5 to 17 Years | 0 (0.0%) | 0 (0.0%) |
| 18 to 34 Years | 0 (0.0%) | 0 (0.0%) |
| 35 to 64 Years | 13 (0.4%) | 97 (2.6%) |
| 65 to 74 Years | 35 (2.8%) | 19 (1.3%) |
| 75 Years and over | 75 (7.6%) | 49 (4.7%) |
Disability Class: Cognitive Difficulty
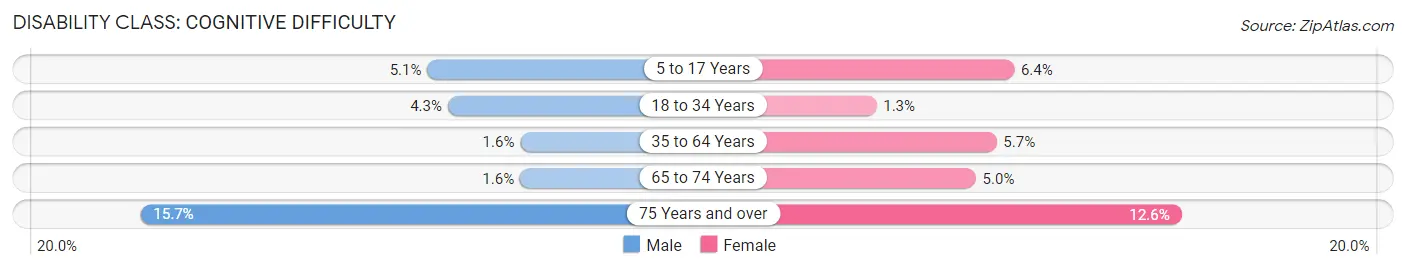
| Age Bracket | Male | Female |
| 5 to 17 Years | 70 (5.1%) | 70 (6.4%) |
| 18 to 34 Years | 72 (4.3%) | 22 (1.3%) |
| 35 to 64 Years | 50 (1.6%) | 210 (5.7%) |
| 65 to 74 Years | 20 (1.6%) | 71 (5.0%) |
| 75 Years and over | 154 (15.7%) | 132 (12.6%) |
Disability Class: Ambulatory Difficulty
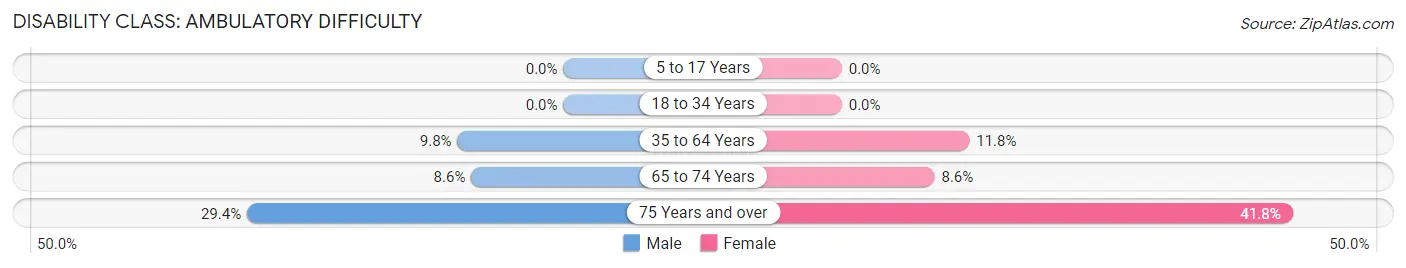
| Age Bracket | Male | Female |
| 5 to 17 Years | 0 (0.0%) | 0 (0.0%) |
| 18 to 34 Years | 0 (0.0%) | 0 (0.0%) |
| 35 to 64 Years | 307 (9.8%) | 433 (11.8%) |
| 65 to 74 Years | 106 (8.6%) | 123 (8.6%) |
| 75 Years and over | 288 (29.4%) | 438 (41.8%) |
Disability Class: Self-Care Difficulty
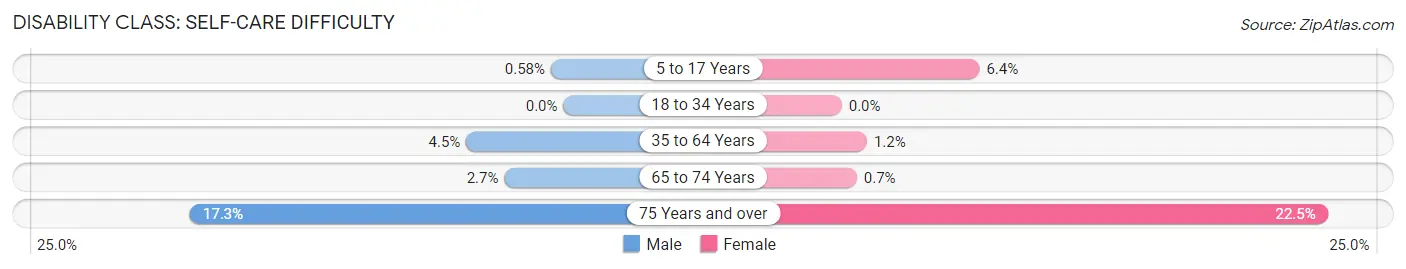
| Age Bracket | Male | Female |
| 5 to 17 Years | 8 (0.6%) | 70 (6.4%) |
| 18 to 34 Years | 0 (0.0%) | 0 (0.0%) |
| 35 to 64 Years | 141 (4.5%) | 43 (1.2%) |
| 65 to 74 Years | 34 (2.7%) | 10 (0.7%) |
| 75 Years and over | 170 (17.3%) | 236 (22.5%) |
Technology Access in Westmoreland County
Computing Device Access in Westmoreland County
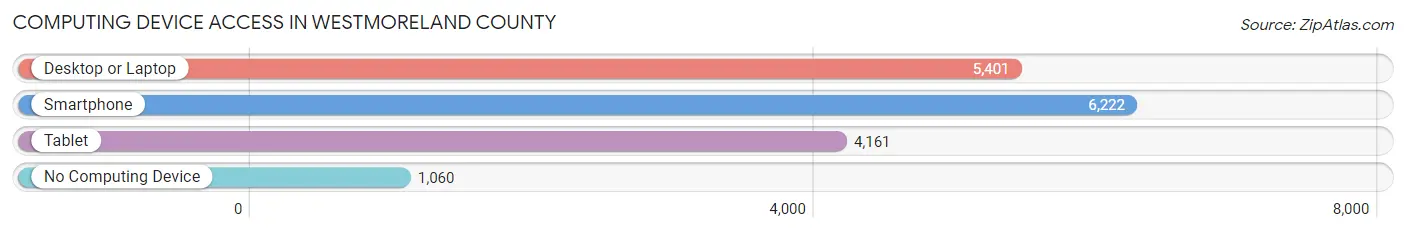
| Device Type | # Households | % Households |
| Desktop or Laptop | 5,401 | 69.0% |
| Smartphone | 6,222 | 79.4% |
| Tablet | 4,161 | 53.1% |
| No Computing Device | 1,060 | 13.5% |
| Total | 7,832 | 100.0% |
Internet Access in Westmoreland County
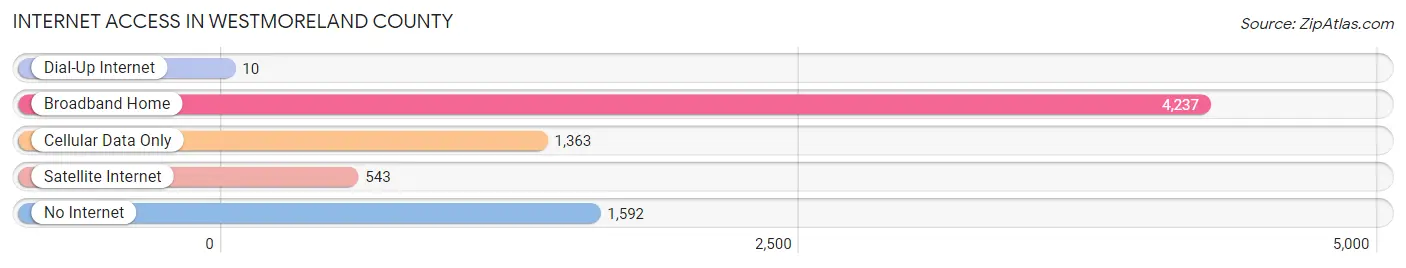
| Internet Type | # Households | % Households |
| Dial-Up Internet | 10 | 0.1% |
| Broadband Home | 4,237 | 54.1% |
| Cellular Data Only | 1,363 | 17.4% |
| Satellite Internet | 543 | 6.9% |
| No Internet | 1,592 | 20.3% |
| Total | 7,832 | 100.0% |
Westmoreland County Summary
Westmoreland County, Virginia is located in the Northern Neck region of the Commonwealth of Virginia. It is bordered by the Potomac River to the north, the Rappahannock River to the south, and the Chesapeake Bay to the east. The county seat is Montross, and the county is home to approximately 17,000 people.
History
Westmoreland County was established in 1653, making it one of the oldest counties in Virginia. It was named after the English county of Westmorland, which was the birthplace of the county’s first settler, Richard Lee. The county was originally part of Northumberland County, but was split off in 1653.
During the American Revolution, Westmoreland County was a major center of activity. The county was the site of the Battle of Kettle Run in 1781, and the Battle of Nomini Creek in 1782. The county was also the site of the Battle of White Plains in 1781, which was the first major battle of the Revolution in Virginia.
In the 19th century, Westmoreland County was a major center of the slave trade. The county was home to several large plantations, and the county’s economy was heavily dependent on the labor of enslaved African Americans.
Geography
Westmoreland County is located in the Northern Neck region of Virginia. It is bordered by the Potomac River to the north, the Rappahannock River to the south, and the Chesapeake Bay to the east. The county is mostly rural, with the majority of the land being used for farming and forestry. The county is home to several state parks, including Westmoreland State Park and George Washington Birthplace National Monument.
Economy
Westmoreland County’s economy is largely based on agriculture and forestry. The county is home to several large farms, and the county’s agricultural products include corn, soybeans, wheat, hay, and tobacco. The county is also home to several large timber companies, and the county’s forests are a major source of timber for the state.
In addition to agriculture and forestry, Westmoreland County is home to several manufacturing companies. The county is home to several large seafood processing plants, and the county is also home to several large boatbuilding companies. The county is also home to several large wineries, and the county’s wine industry is a major source of revenue for the county.
Demographics
As of the 2010 census, Westmoreland County had a population of 17,000. The population is largely white (87.3%), with African Americans making up 8.3% of the population. The median household income in the county is $50,000, and the median home value is $170,000.
Westmoreland County is home to several small towns and villages, including Montross, Colonial Beach, Kinsale, and Oak Grove. The county is also home to several large unincorporated communities, including Oak Grove, Kinsale, and Colonial Beach.
Conclusion
Westmoreland County, Virginia is a rural county located in the Northern Neck region of the Commonwealth of Virginia. The county is home to approximately 17,000 people, and the county’s economy is largely based on agriculture and forestry. The county is also home to several small towns and villages, as well as several large unincorporated communities. Westmoreland County has a rich history, and it was the site of several major battles during the American Revolution.
Common Questions
What is Per Capita Income in Westmoreland County?
Per Capita income in Westmoreland County is $35,850.
What is the Median Family Income in Westmoreland County?
Median Family Income in Westmoreland County is $79,034.
What is the Median Household income in Westmoreland County?
Median Household Income in Westmoreland County is $56,647.
What is Income or Wage Gap in Westmoreland County?
Income or Wage Gap in Westmoreland County is 33.6%.
Women in Westmoreland County earn 66.4 cents for every dollar earned by a man.
What is Family Income Deficit in Westmoreland County?
Family Income Deficit in Westmoreland County is $16,320.
Families that are below poverty line in Westmoreland County earn $16,320 less on average than the poverty threshold level.
What is Inequality or Gini Index in Westmoreland County?
Inequality or Gini Index in Westmoreland County is 0.49.
What is the Total Population of Westmoreland County?
Total Population of Westmoreland County is 18,480.
What is the Total Male Population of Westmoreland County?
Total Male Population of Westmoreland County is 8,916.
What is the Total Female Population of Westmoreland County?
Total Female Population of Westmoreland County is 9,564.
What is the Ratio of Males per 100 Females in Westmoreland County?
There are 93.22 Males per 100 Females in Westmoreland County.
What is the Ratio of Females per 100 Males in Westmoreland County?
There are 107.27 Females per 100 Males in Westmoreland County.
What is the Median Population Age in Westmoreland County?
Median Population Age in Westmoreland County is 47.9 Years.
What is the Average Family Size in Westmoreland County
Average Family Size in Westmoreland County is 3.1 People.
What is the Average Household Size in Westmoreland County
Average Household Size in Westmoreland County is 2.3 People.
How Large is the Labor Force in Westmoreland County?
There are 7,889 People in the Labor Forcein in Westmoreland County.
What is the Percentage of People in the Labor Force in Westmoreland County?
51.0% of People are in the Labor Force in Westmoreland County.
What is the Unemployment Rate in Westmoreland County?
Unemployment Rate in Westmoreland County is 9.1%.