Tazewell County, VA Map & Demographics
Tazewell County Map
Tazewell County Overview
$27,327
PER CAPITA INCOME
$59,904
AVG FAMILY INCOME
$46,508
AVG HOUSEHOLD INCOME
27.9%
WAGE / INCOME GAP [ % ]
72.1¢/ $1
WAGE / INCOME GAP [ $ ]
$11,561
FAMILY INCOME DEFICIT
0.47
INEQUALITY / GINI INDEX
40,392
TOTAL POPULATION
20,128
MALE POPULATION
20,264
FEMALE POPULATION
99.33
MALES / 100 FEMALES
100.68
FEMALES / 100 MALES
44.6
MEDIAN AGE
3.0
AVG FAMILY SIZE
2.5
AVG HOUSEHOLD SIZE
15,214
LABOR FORCE [ PEOPLE ]
45.6%
PERCENT IN LABOR FORCE
5.7%
UNEMPLOYMENT RATE
Tazewell County Area Codes
Income in Tazewell County
Income Overview in Tazewell County
Per Capita Income in Tazewell County is $27,327, while median incomes of families and households are $59,904 and $46,508 respectively.
| Characteristic | Number | Measure |
| Per Capita Income | 40,392 | $27,327 |
| Median Family Income | 10,760 | $59,904 |
| Mean Family Income | 10,760 | $79,333 |
| Median Household Income | 15,800 | $46,508 |
| Mean Household Income | 15,800 | $65,927 |
| Income Deficit | 10,760 | $11,561 |
| Wage / Income Gap (%) | 40,392 | 27.91% |
| Wage / Income Gap ($) | 40,392 | 72.09¢ per $1 |
| Gini / Inequality Index | 40,392 | 0.47 |
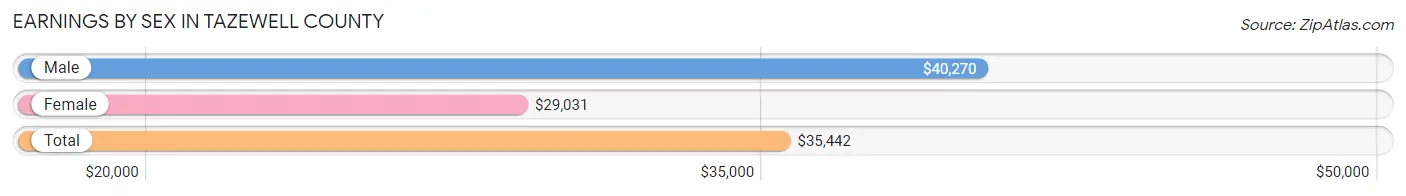
Earnings by Sex in Tazewell County
Average Earnings in Tazewell County are $35,442, $40,270 for men and $29,031 for women, a difference of 27.9%.
| Sex | Number | Average Earnings |
| Male | 8,825 (54.9%) | $40,270 |
| Female | 7,240 (45.1%) | $29,031 |
| Total | 16,065 (100.0%) | $35,442 |
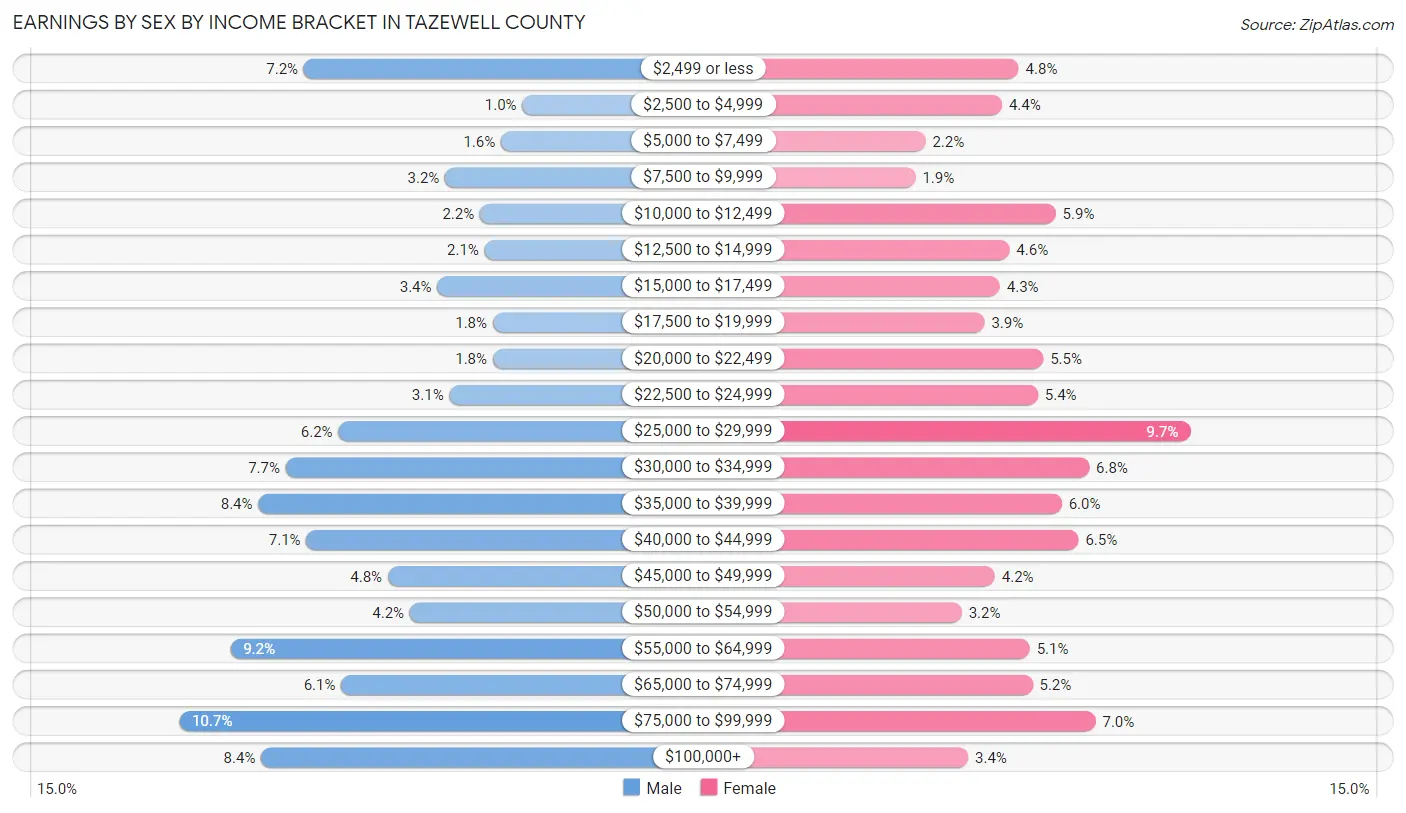
Earnings by Sex by Income Bracket in Tazewell County
The most common earnings brackets in Tazewell County are $75,000 to $99,999 for men (941 | 10.7%) and $25,000 to $29,999 for women (699 | 9.7%).
| Income | Male | Female |
| $2,499 or less | 631 (7.1%) | 350 (4.8%) |
| $2,500 to $4,999 | 89 (1.0%) | 316 (4.4%) |
| $5,000 to $7,499 | 142 (1.6%) | 160 (2.2%) |
| $7,500 to $9,999 | 281 (3.2%) | 140 (1.9%) |
| $10,000 to $12,499 | 194 (2.2%) | 425 (5.9%) |
| $12,500 to $14,999 | 183 (2.1%) | 331 (4.6%) |
| $15,000 to $17,499 | 300 (3.4%) | 311 (4.3%) |
| $17,500 to $19,999 | 162 (1.8%) | 280 (3.9%) |
| $20,000 to $22,499 | 162 (1.8%) | 400 (5.5%) |
| $22,500 to $24,999 | 270 (3.1%) | 389 (5.4%) |
| $25,000 to $29,999 | 545 (6.2%) | 699 (9.7%) |
| $30,000 to $34,999 | 676 (7.7%) | 493 (6.8%) |
| $35,000 to $39,999 | 744 (8.4%) | 437 (6.0%) |
| $40,000 to $44,999 | 625 (7.1%) | 471 (6.5%) |
| $45,000 to $49,999 | 423 (4.8%) | 301 (4.2%) |
| $50,000 to $54,999 | 368 (4.2%) | 234 (3.2%) |
| $55,000 to $64,999 | 814 (9.2%) | 372 (5.1%) |
| $65,000 to $74,999 | 538 (6.1%) | 378 (5.2%) |
| $75,000 to $99,999 | 941 (10.7%) | 506 (7.0%) |
| $100,000+ | 737 (8.4%) | 247 (3.4%) |
| Total | 8,825 (100.0%) | 7,240 (100.0%) |
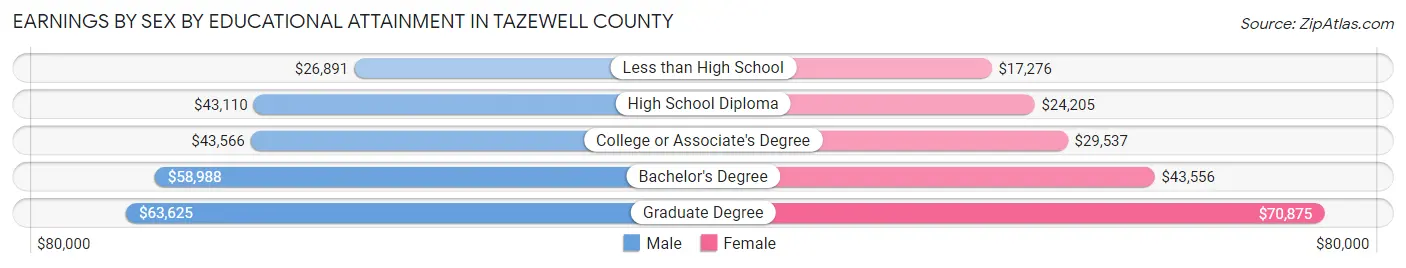
Earnings by Sex by Educational Attainment in Tazewell County
Average earnings in Tazewell County are $43,996 for men and $30,995 for women, a difference of 29.5%. Men with an educational attainment of graduate degree enjoy the highest average annual earnings of $63,625, while those with less than high school education earn the least with $26,891. Women with an educational attainment of graduate degree earn the most with the average annual earnings of $70,875, while those with less than high school education have the smallest earnings of $17,276.
| Educational Attainment | Male Income | Female Income |
| Less than High School | $26,891 | $17,276 |
| High School Diploma | $43,110 | $24,205 |
| College or Associate's Degree | $43,566 | $29,537 |
| Bachelor's Degree | $58,988 | $43,556 |
| Graduate Degree | $63,625 | $70,875 |
| Total | $43,996 | $30,995 |
Family Income in Tazewell County
Family Income Brackets in Tazewell County
According to the Tazewell County family income data, there are 2,023 families falling into the $100,000 to $149,999 income range, which is the most common income bracket and makes up 18.8% of all families. Conversely, the $10,000 to $14,999 income bracket is the least frequent group with only 334 families (3.1%) belonging to this category.
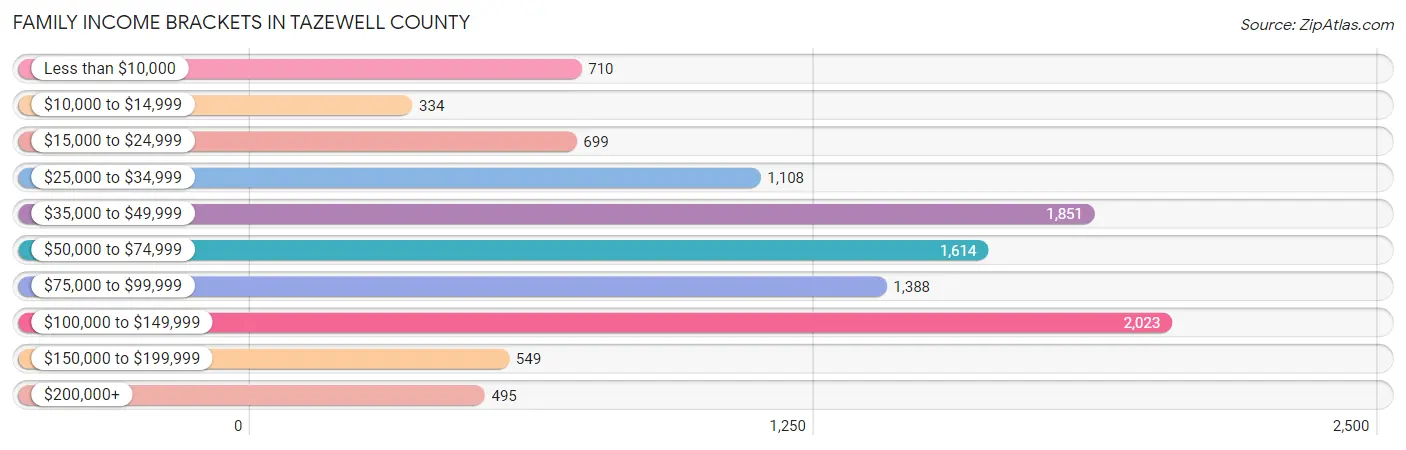
| Income Bracket | # Families | % Families |
| Less than $10,000 | 710 | 6.6% |
| $10,000 to $14,999 | 334 | 3.1% |
| $15,000 to $24,999 | 699 | 6.5% |
| $25,000 to $34,999 | 1,108 | 10.3% |
| $35,000 to $49,999 | 1,851 | 17.2% |
| $50,000 to $74,999 | 1,614 | 15.0% |
| $75,000 to $99,999 | 1,388 | 12.9% |
| $100,000 to $149,999 | 2,023 | 18.8% |
| $150,000 to $199,999 | 549 | 5.1% |
| $200,000+ | 495 | 4.6% |
Family Income by Famaliy Size in Tazewell County
4-person families (1,503 | 14.0%) account for the highest median family income in Tazewell County with $109,861 per family, while 4-person families (1,503 | 14.0%) have the highest median income of $27,465 per family member.
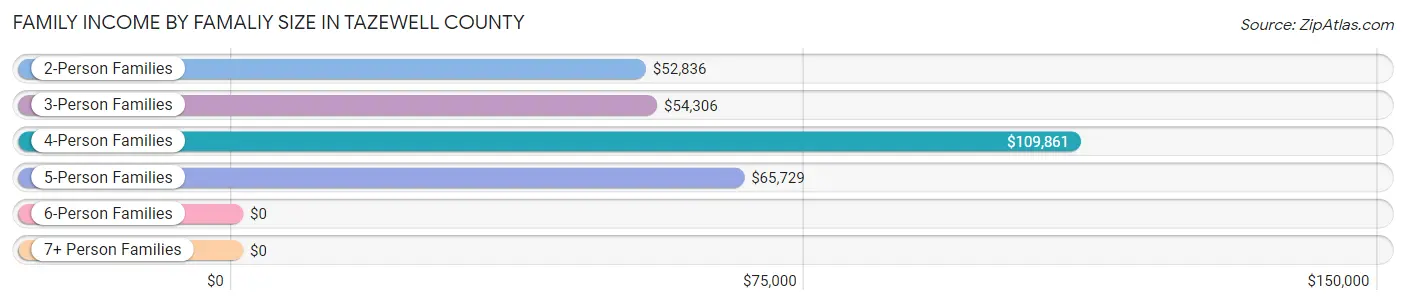
| Income Bracket | # Families | Median Income |
| 2-Person Families | 5,750 (53.4%) | $52,836 |
| 3-Person Families | 2,749 (25.6%) | $54,306 |
| 4-Person Families | 1,503 (14.0%) | $109,861 |
| 5-Person Families | 637 (5.9%) | $65,729 |
| 6-Person Families | 95 (0.9%) | $0 |
| 7+ Person Families | 26 (0.2%) | $0 |
| Total | 10,760 (100.0%) | $59,904 |
Family Income by Number of Earners in Tazewell County
The median family income in Tazewell County is $59,904, with families comprising 3+ earners (740) having the highest median family income of $120,769, while families with no earners (3,457) have the lowest median family income of $32,853, accounting for 6.9% and 32.1% of families, respectively.
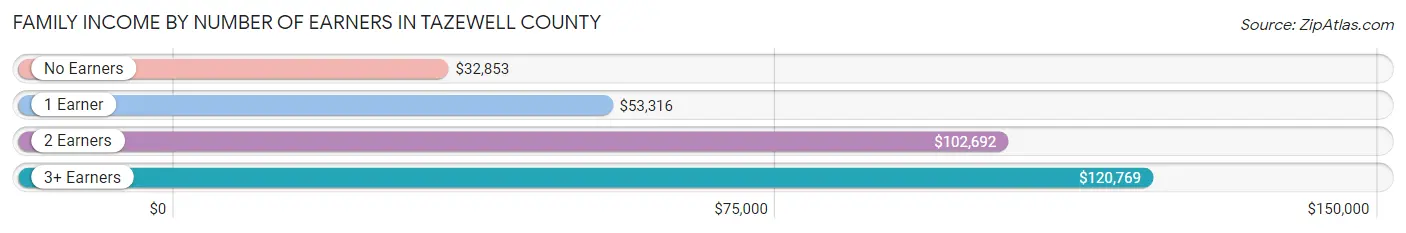
| Number of Earners | # Families | Median Income |
| No Earners | 3,457 (32.1%) | $32,853 |
| 1 Earner | 3,497 (32.5%) | $53,316 |
| 2 Earners | 3,066 (28.5%) | $102,692 |
| 3+ Earners | 740 (6.9%) | $120,769 |
| Total | 10,760 (100.0%) | $59,904 |
Household Income in Tazewell County
Household Income Brackets in Tazewell County
With 2,528 households falling in the category, the $50,000 to $74,999 income range is the most frequent in Tazewell County, accounting for 16.0% of all households. In contrast, only 506 households (3.2%) fall into the $200,000+ income bracket, making it the least populous group.
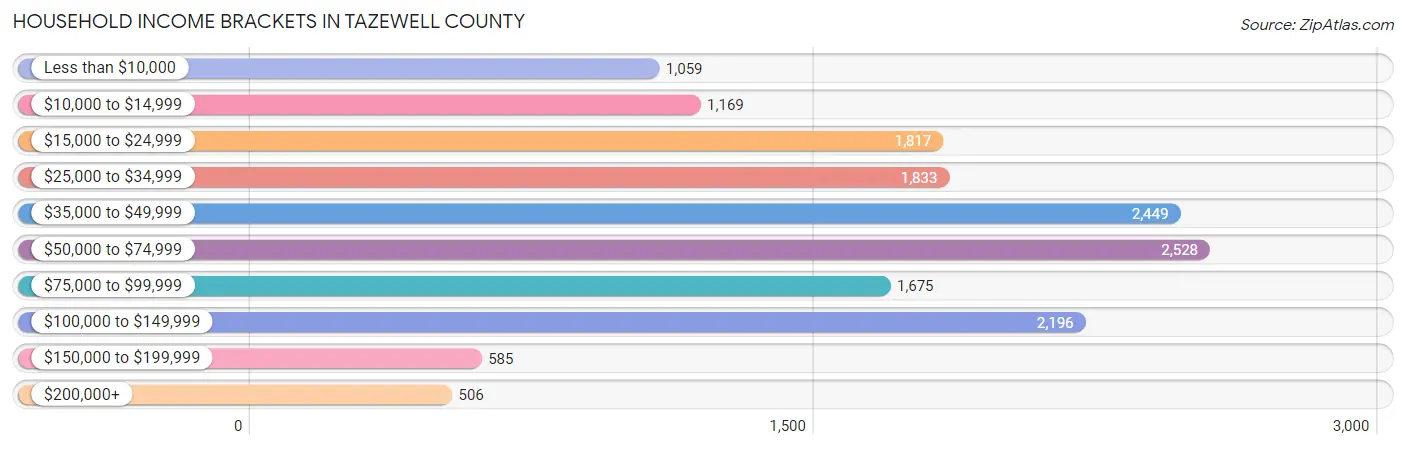
| Income Bracket | # Households | % Households |
| Less than $10,000 | 1,059 | 6.7% |
| $10,000 to $14,999 | 1,169 | 7.4% |
| $15,000 to $24,999 | 1,817 | 11.5% |
| $25,000 to $34,999 | 1,833 | 11.6% |
| $35,000 to $49,999 | 2,449 | 15.5% |
| $50,000 to $74,999 | 2,528 | 16.0% |
| $75,000 to $99,999 | 1,675 | 10.6% |
| $100,000 to $149,999 | 2,196 | 13.9% |
| $150,000 to $199,999 | 585 | 3.7% |
| $200,000+ | 506 | 3.2% |
Household Income by Householder Age in Tazewell County
The median household income in Tazewell County is $46,508, with the highest median household income of $65,168 found in the 25 to 44 years age bracket for the primary householder. A total of 3,629 households (23.0%) fall into this category. Meanwhile, the 15 to 24 years age bracket for the primary householder has the lowest median household income of $0, with 799 households (5.1%) in this group.
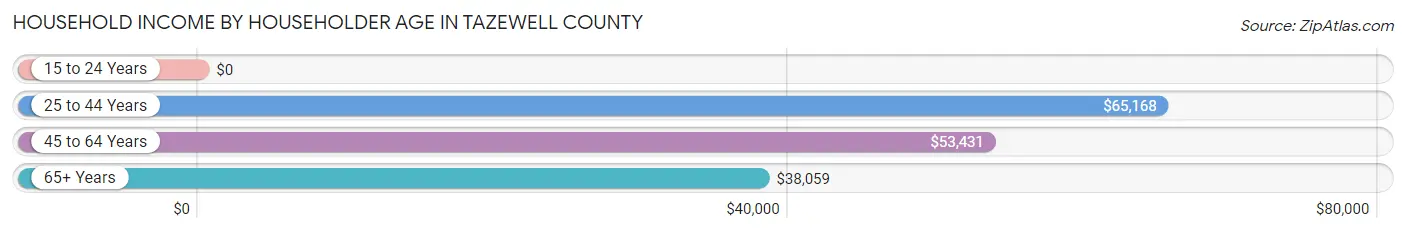
| Income Bracket | # Households | Median Income |
| 15 to 24 Years | 799 (5.1%) | $0 |
| 25 to 44 Years | 3,629 (23.0%) | $65,168 |
| 45 to 64 Years | 5,424 (34.3%) | $53,431 |
| 65+ Years | 5,948 (37.7%) | $38,059 |
| Total | 15,800 (100.0%) | $46,508 |
Poverty in Tazewell County
Income Below Poverty by Sex and Age in Tazewell County
With 14.9% poverty level for males and 21.2% for females among the residents of Tazewell County, 6 to 11 year old males and 15 year old females are the most vulnerable to poverty, with 533 males (31.5%) and 105 females (43.4%) in their respective age groups living below the poverty level.
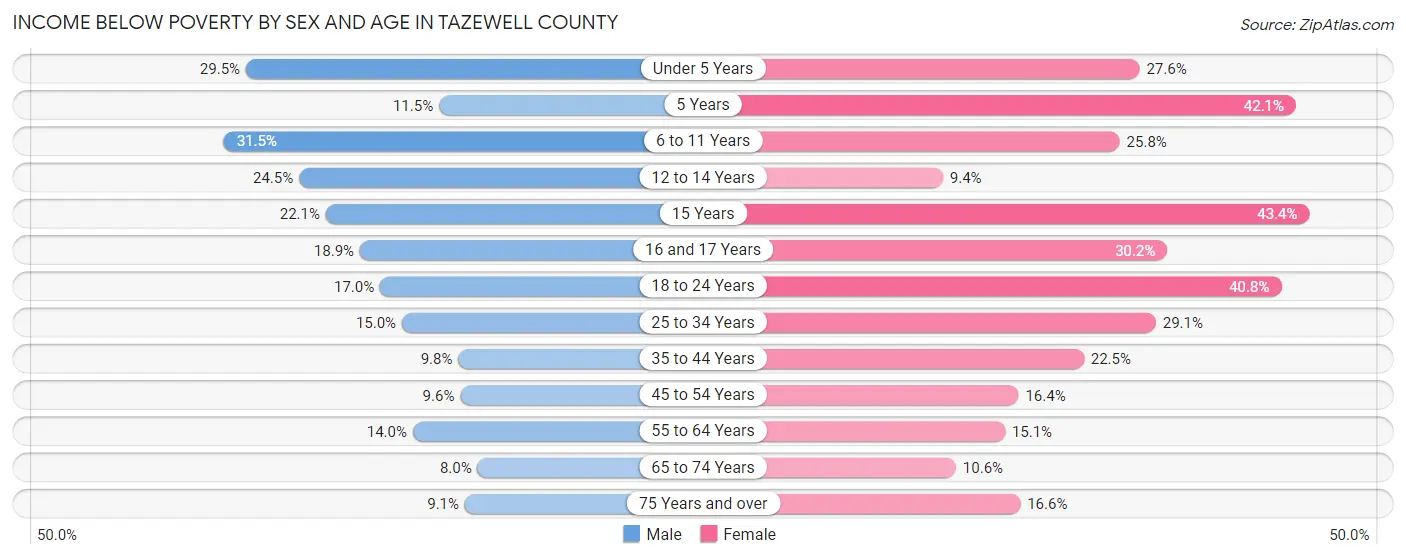
| Age Bracket | Male | Female |
| Under 5 Years | 266 (29.5%) | 281 (27.6%) |
| 5 Years | 18 (11.5%) | 59 (42.1%) |
| 6 to 11 Years | 533 (31.5%) | 341 (25.8%) |
| 12 to 14 Years | 142 (24.5%) | 50 (9.4%) |
| 15 Years | 73 (22.1%) | 105 (43.4%) |
| 16 and 17 Years | 88 (18.9%) | 135 (30.2%) |
| 18 to 24 Years | 242 (17.0%) | 672 (40.8%) |
| 25 to 34 Years | 308 (15.0%) | 565 (29.1%) |
| 35 to 44 Years | 218 (9.8%) | 500 (22.5%) |
| 45 to 54 Years | 219 (9.6%) | 410 (16.4%) |
| 55 to 64 Years | 373 (14.0%) | 446 (15.1%) |
| 65 to 74 Years | 209 (8.0%) | 298 (10.6%) |
| 75 Years and over | 131 (9.1%) | 353 (16.6%) |
| Total | 2,820 (14.9%) | 4,215 (21.2%) |
Income Above Poverty by Sex and Age in Tazewell County
According to the poverty statistics in Tazewell County, males aged 65 to 74 years and females aged 12 to 14 years are the age groups that are most secure financially, with 92.0% of males and 90.6% of females in these age groups living above the poverty line.
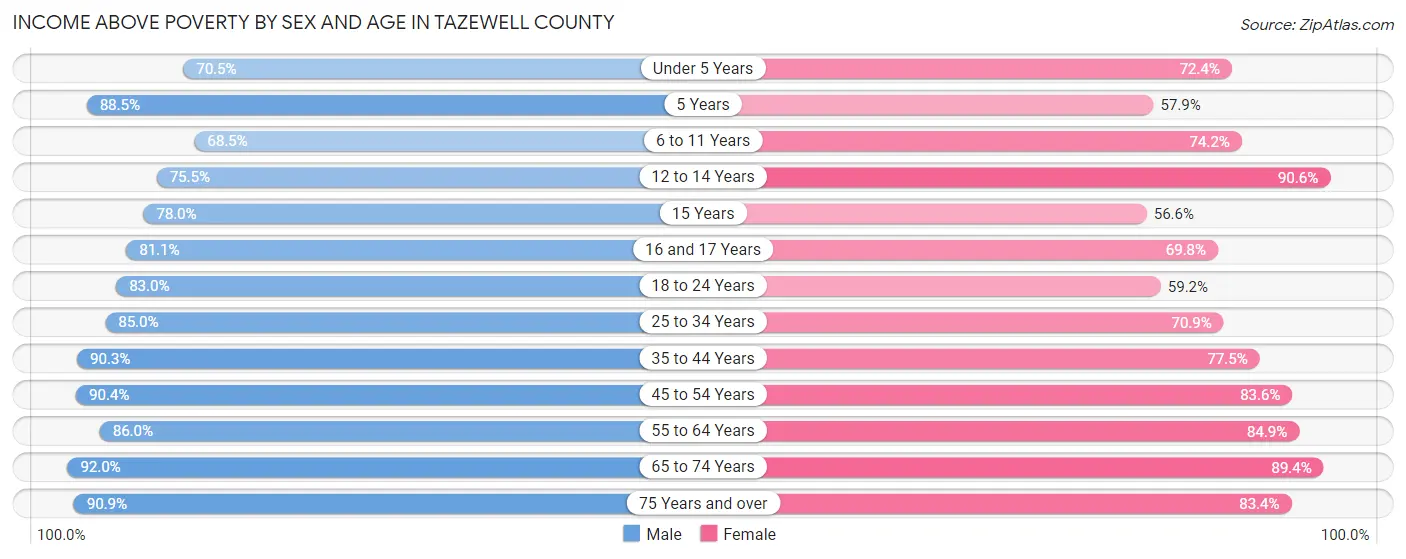
| Age Bracket | Male | Female |
| Under 5 Years | 637 (70.5%) | 736 (72.4%) |
| 5 Years | 138 (88.5%) | 81 (57.9%) |
| 6 to 11 Years | 1,158 (68.5%) | 981 (74.2%) |
| 12 to 14 Years | 437 (75.5%) | 483 (90.6%) |
| 15 Years | 258 (77.9%) | 137 (56.6%) |
| 16 and 17 Years | 378 (81.1%) | 312 (69.8%) |
| 18 to 24 Years | 1,181 (83.0%) | 976 (59.2%) |
| 25 to 34 Years | 1,748 (85.0%) | 1,374 (70.9%) |
| 35 to 44 Years | 2,018 (90.2%) | 1,726 (77.5%) |
| 45 to 54 Years | 2,069 (90.4%) | 2,090 (83.6%) |
| 55 to 64 Years | 2,297 (86.0%) | 2,499 (84.9%) |
| 65 to 74 Years | 2,418 (92.0%) | 2,516 (89.4%) |
| 75 Years and over | 1,303 (90.9%) | 1,778 (83.4%) |
| Total | 16,040 (85.1%) | 15,689 (78.8%) |
Income Below Poverty Among Married-Couple Families in Tazewell County
The poverty statistics for married-couple families in Tazewell County show that 5.3% or 410 of the total 7,706 families live below the poverty line. Families with 3 or 4 children have the highest poverty rate of 19.4%, comprising of 68 families. On the other hand, families with 1 or 2 children have the lowest poverty rate of 3.2%, which includes 63 families.
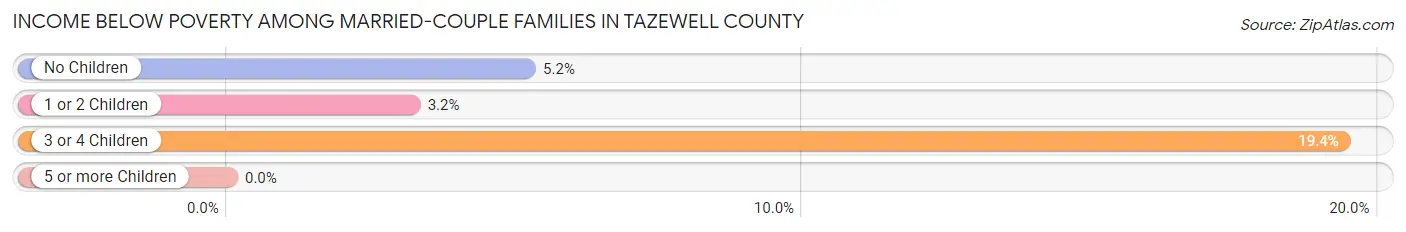
| Children | Above Poverty | Below Poverty |
| No Children | 5,093 (94.8%) | 279 (5.2%) |
| 1 or 2 Children | 1,920 (96.8%) | 63 (3.2%) |
| 3 or 4 Children | 283 (80.6%) | 68 (19.4%) |
| 5 or more Children | 0 (0.0%) | 0 (0.0%) |
| Total | 7,296 (94.7%) | 410 (5.3%) |
Income Below Poverty Among Single-Parent Households in Tazewell County
According to the poverty data in Tazewell County, 16.3% or 135 single-father households and 46.9% or 1,046 single-mother households are living below the poverty line. Among single-father households, those with 1 or 2 children have the highest poverty rate, with 106 households (28.3%) experiencing poverty. Likewise, among single-mother households, those with 1 or 2 children have the highest poverty rate, with 842 households (64.0%) falling below the poverty line.
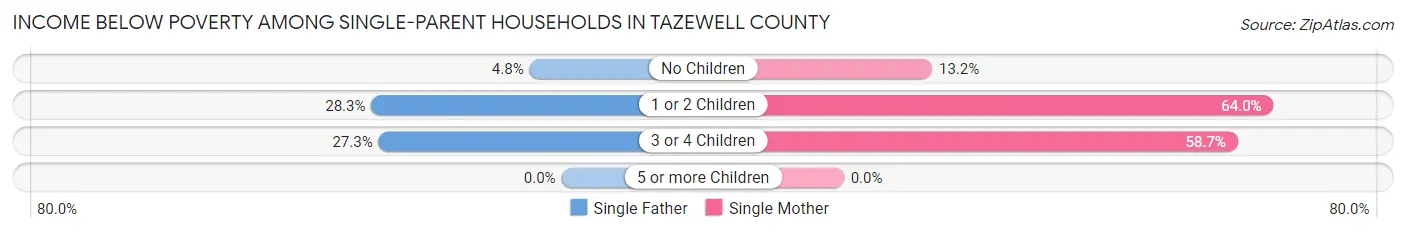
| Children | Single Father | Single Mother |
| No Children | 20 (4.8%) | 96 (13.2%) |
| 1 or 2 Children | 106 (28.3%) | 842 (64.0%) |
| 3 or 4 Children | 9 (27.3%) | 108 (58.7%) |
| 5 or more Children | 0 (0.0%) | 0 (0.0%) |
| Total | 135 (16.3%) | 1,046 (46.9%) |
Income Below Poverty Among Married-Couple vs Single-Parent Households in Tazewell County
The poverty data for Tazewell County shows that 410 of the married-couple family households (5.3%) and 1,181 of the single-parent households (38.7%) are living below the poverty level. Within the married-couple family households, those with 3 or 4 children have the highest poverty rate, with 68 households (19.4%) falling below the poverty line. Among the single-parent households, those with 1 or 2 children have the highest poverty rate, with 948 household (56.1%) living below poverty.
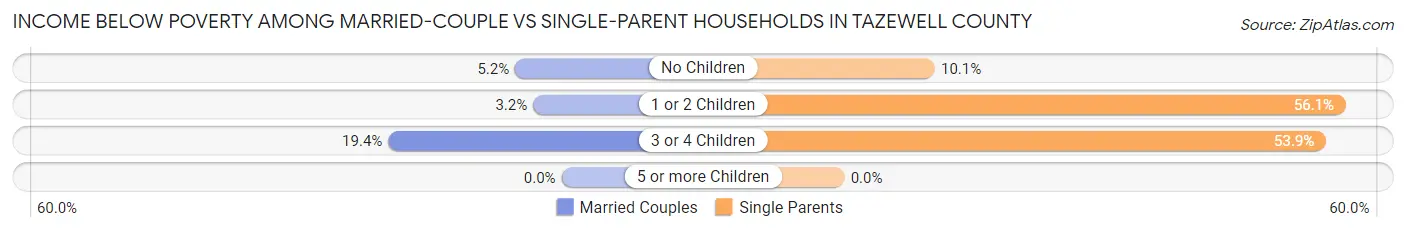
| Children | Married-Couple Families | Single-Parent Households |
| No Children | 279 (5.2%) | 116 (10.1%) |
| 1 or 2 Children | 63 (3.2%) | 948 (56.1%) |
| 3 or 4 Children | 68 (19.4%) | 117 (53.9%) |
| 5 or more Children | 0 (0.0%) | 0 (0.0%) |
| Total | 410 (5.3%) | 1,181 (38.7%) |
Race in Tazewell County
The most populous races in Tazewell County are White / Caucasian (37,700 | 93.3%), Black / African American (1,630 | 4.0%), and Two or more Races (646 | 1.6%).
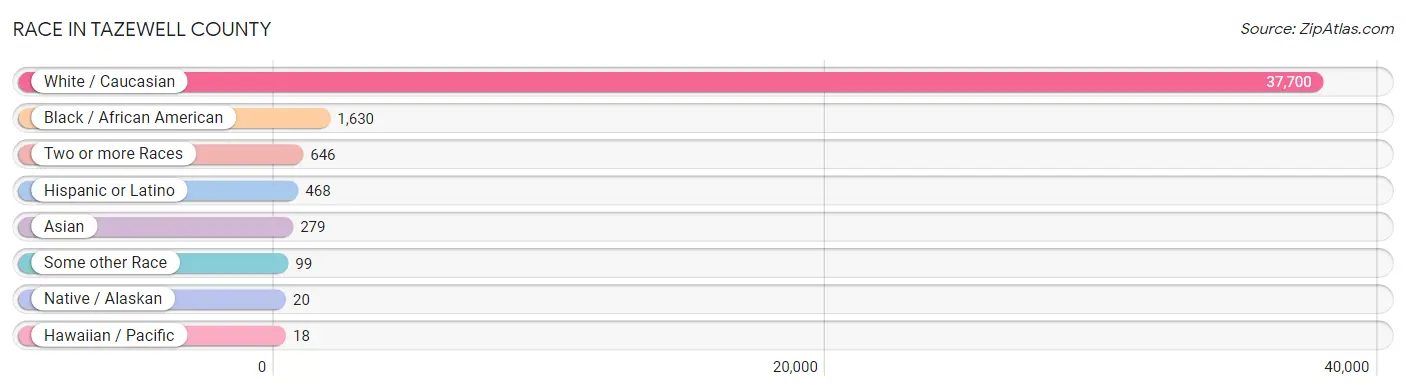
| Race | # Population | % Population |
| Asian | 279 | 0.7% |
| Black / African American | 1,630 | 4.0% |
| Hawaiian / Pacific | 18 | 0.0% |
| Hispanic or Latino | 468 | 1.2% |
| Native / Alaskan | 20 | 0.1% |
| White / Caucasian | 37,700 | 93.3% |
| Two or more Races | 646 | 1.6% |
| Some other Race | 99 | 0.3% |
| Total | 40,392 | 100.0% |
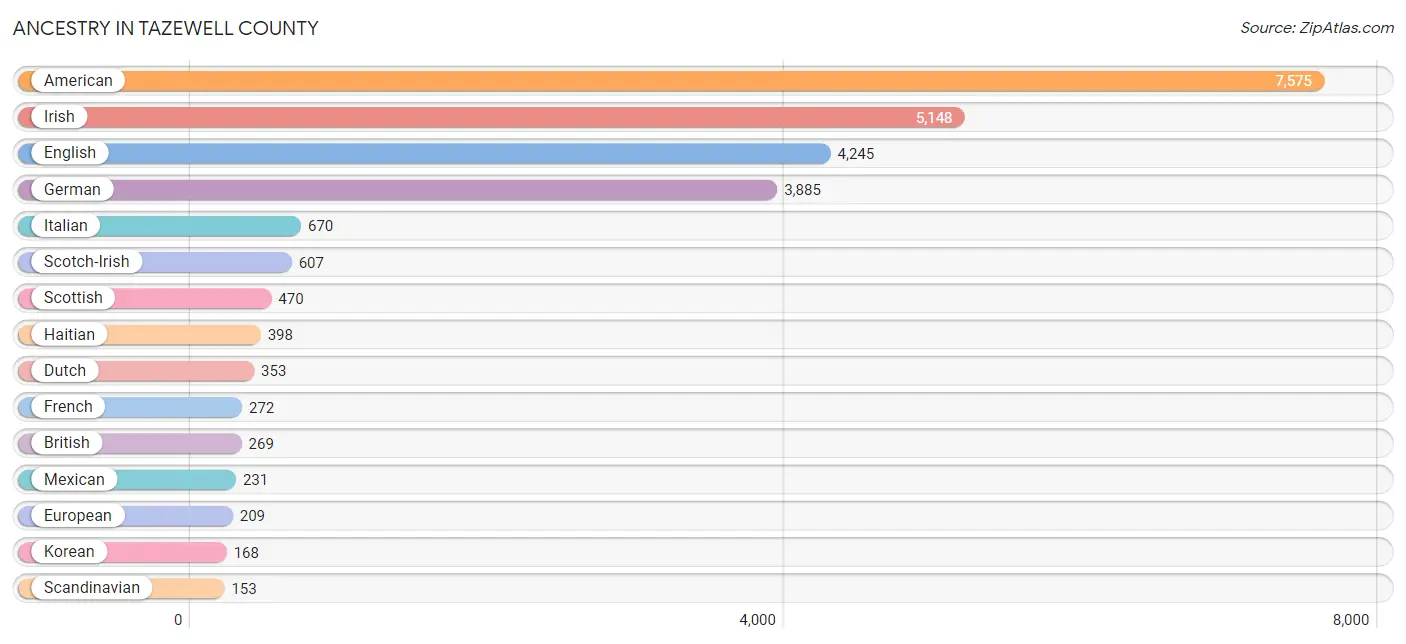
Ancestry in Tazewell County
The most populous ancestries reported in Tazewell County are American (7,575 | 18.8%), Irish (5,148 | 12.8%), English (4,245 | 10.5%), German (3,885 | 9.6%), and Italian (670 | 1.7%), together accounting for 53.3% of all Tazewell County residents.
| Ancestry | # Population | % Population |
| African | 10 | 0.0% |
| American | 7,575 | 18.8% |
| Arab | 70 | 0.2% |
| Belgian | 2 | 0.0% |
| Bhutanese | 1 | 0.0% |
| Blackfeet | 33 | 0.1% |
| British | 269 | 0.7% |
| British West Indian | 4 | 0.0% |
| Canadian | 52 | 0.1% |
| Central American | 47 | 0.1% |
| Cherokee | 42 | 0.1% |
| Cree | 10 | 0.0% |
| Czech | 24 | 0.1% |
| Czechoslovakian | 13 | 0.0% |
| Danish | 7 | 0.0% |
| Dominican | 12 | 0.0% |
| Dutch | 353 | 0.9% |
| Eastern European | 43 | 0.1% |
| English | 4,245 | 10.5% |
| European | 209 | 0.5% |
| French | 272 | 0.7% |
| French American Indian | 1 | 0.0% |
| French Canadian | 23 | 0.1% |
| German | 3,885 | 9.6% |
| Greek | 4 | 0.0% |
| Haitian | 398 | 1.0% |
| Honduran | 46 | 0.1% |
| Hungarian | 114 | 0.3% |
| Indian (Asian) | 98 | 0.2% |
| Irish | 5,148 | 12.8% |
| Italian | 670 | 1.7% |
| Jamaican | 3 | 0.0% |
| Korean | 168 | 0.4% |
| Lebanese | 26 | 0.1% |
| Lithuanian | 23 | 0.1% |
| Mexican | 231 | 0.6% |
| Norwegian | 68 | 0.2% |
| Pennsylvania German | 19 | 0.1% |
| Polish | 107 | 0.3% |
| Puerto Rican | 130 | 0.3% |
| Romanian | 11 | 0.0% |
| Russian | 48 | 0.1% |
| Salvadoran | 1 | 0.0% |
| Samoan | 41 | 0.1% |
| Scandinavian | 153 | 0.4% |
| Scotch-Irish | 607 | 1.5% |
| Scottish | 470 | 1.2% |
| Seminole | 10 | 0.0% |
| Sioux | 6 | 0.0% |
| Slavic | 5 | 0.0% |
| Slovak | 20 | 0.1% |
| Spaniard | 9 | 0.0% |
| Spanish American | 23 | 0.1% |
| Subsaharan African | 10 | 0.0% |
| Swedish | 54 | 0.1% |
| Swiss | 6 | 0.0% |
| Thai | 117 | 0.3% |
| Ukrainian | 14 | 0.0% |
| Welsh | 93 | 0.2% |
| Yugoslavian | 19 | 0.1% | View All 60 Rows |
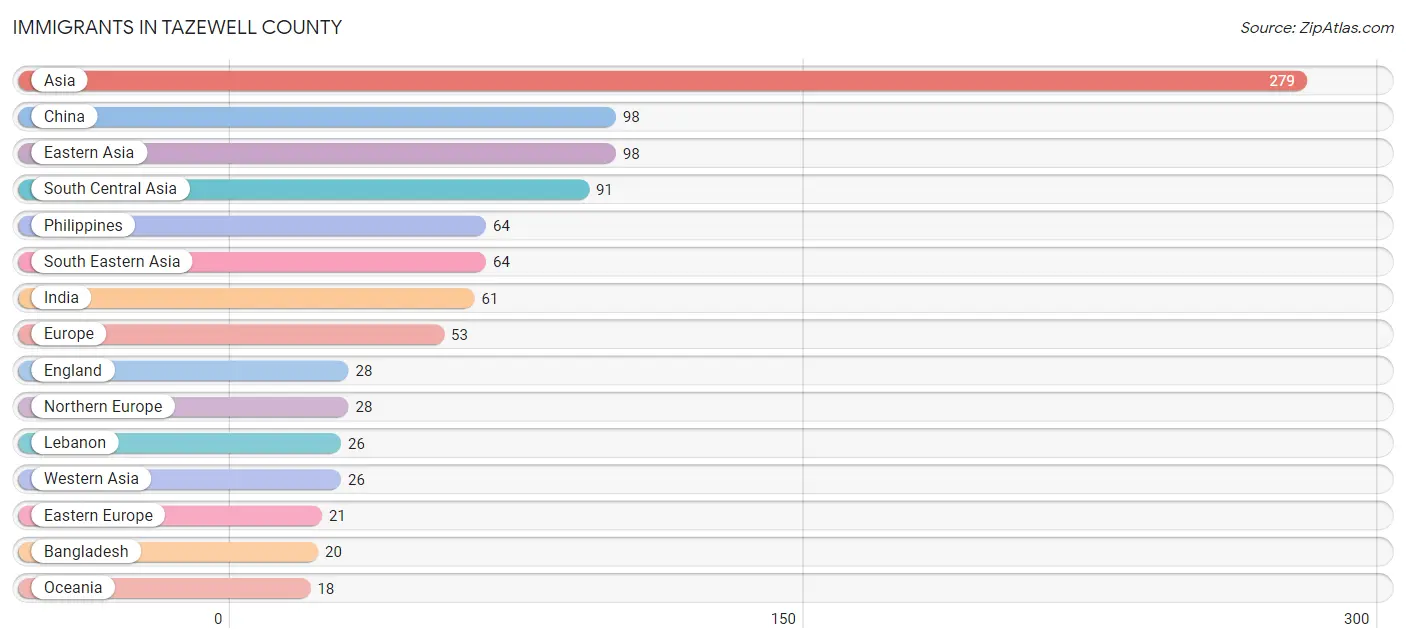
Immigrants in Tazewell County
The most numerous immigrant groups reported in Tazewell County came from Asia (279 | 0.7%), China (98 | 0.2%), Eastern Asia (98 | 0.2%), South Central Asia (91 | 0.2%), and Philippines (64 | 0.2%), together accounting for 1.6% of all Tazewell County residents.
| Immigration Origin | # Population | % Population |
| Asia | 279 | 0.7% |
| Bangladesh | 20 | 0.1% |
| Canada | 4 | 0.0% |
| Central America | 8 | 0.0% |
| China | 98 | 0.2% |
| Eastern Asia | 98 | 0.2% |
| Eastern Europe | 21 | 0.1% |
| England | 28 | 0.1% |
| Europe | 53 | 0.1% |
| India | 61 | 0.2% |
| Iran | 10 | 0.0% |
| Latin America | 8 | 0.0% |
| Lebanon | 26 | 0.1% |
| Mexico | 8 | 0.0% |
| Northern Europe | 28 | 0.1% |
| Oceania | 18 | 0.0% |
| Philippines | 64 | 0.2% |
| Russia | 11 | 0.0% |
| South Central Asia | 91 | 0.2% |
| South Eastern Asia | 64 | 0.2% |
| Southern Europe | 4 | 0.0% |
| Spain | 4 | 0.0% |
| Ukraine | 10 | 0.0% |
| Western Asia | 26 | 0.1% | View All 24 Rows |
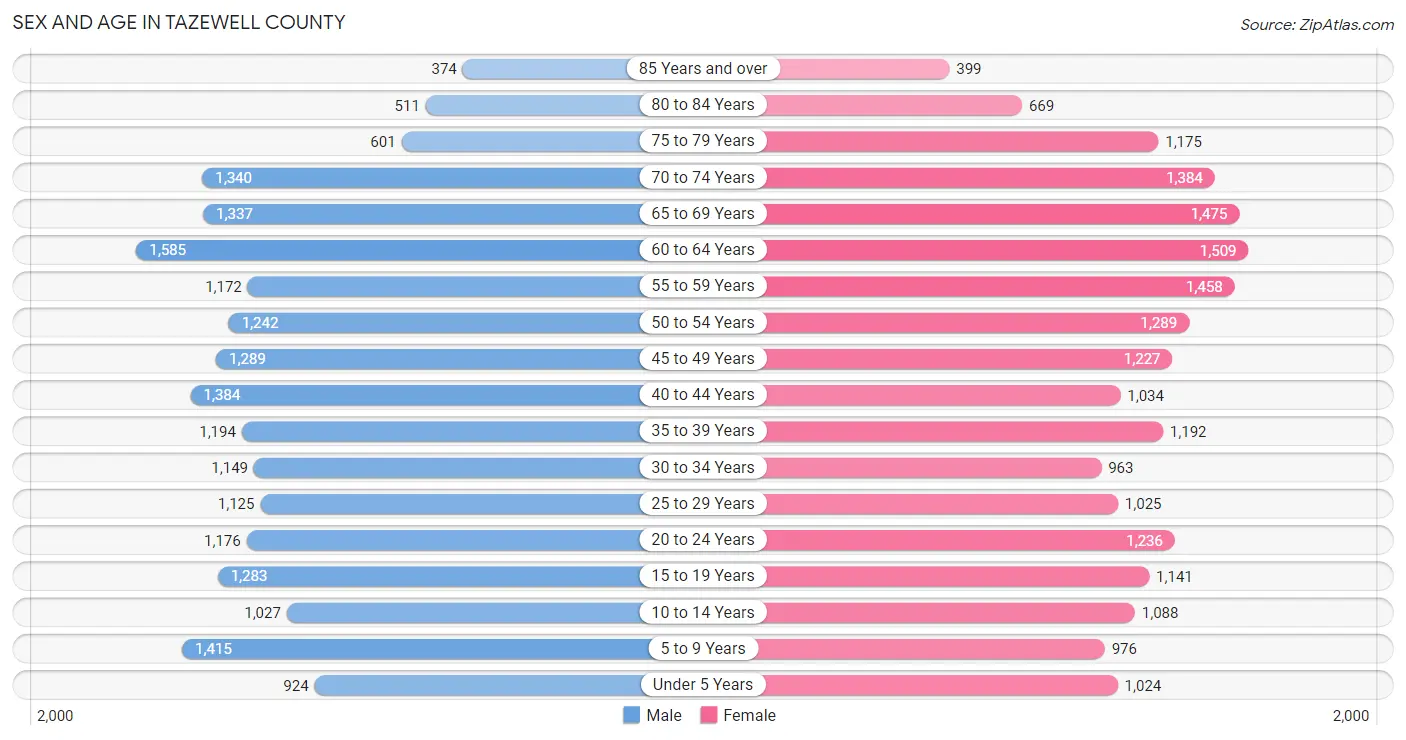
Sex and Age in Tazewell County
Sex and Age in Tazewell County
The most populous age groups in Tazewell County are 60 to 64 Years (1,585 | 7.9%) for men and 60 to 64 Years (1,509 | 7.4%) for women.
| Age Bracket | Male | Female |
| Under 5 Years | 924 (4.6%) | 1,024 (5.1%) |
| 5 to 9 Years | 1,415 (7.0%) | 976 (4.8%) |
| 10 to 14 Years | 1,027 (5.1%) | 1,088 (5.4%) |
| 15 to 19 Years | 1,283 (6.4%) | 1,141 (5.6%) |
| 20 to 24 Years | 1,176 (5.8%) | 1,236 (6.1%) |
| 25 to 29 Years | 1,125 (5.6%) | 1,025 (5.1%) |
| 30 to 34 Years | 1,149 (5.7%) | 963 (4.8%) |
| 35 to 39 Years | 1,194 (5.9%) | 1,192 (5.9%) |
| 40 to 44 Years | 1,384 (6.9%) | 1,034 (5.1%) |
| 45 to 49 Years | 1,289 (6.4%) | 1,227 (6.1%) |
| 50 to 54 Years | 1,242 (6.2%) | 1,289 (6.4%) |
| 55 to 59 Years | 1,172 (5.8%) | 1,458 (7.2%) |
| 60 to 64 Years | 1,585 (7.9%) | 1,509 (7.4%) |
| 65 to 69 Years | 1,337 (6.6%) | 1,475 (7.3%) |
| 70 to 74 Years | 1,340 (6.7%) | 1,384 (6.8%) |
| 75 to 79 Years | 601 (3.0%) | 1,175 (5.8%) |
| 80 to 84 Years | 511 (2.5%) | 669 (3.3%) |
| 85 Years and over | 374 (1.9%) | 399 (2.0%) |
| Total | 20,128 (100.0%) | 20,264 (100.0%) |
Families and Households in Tazewell County
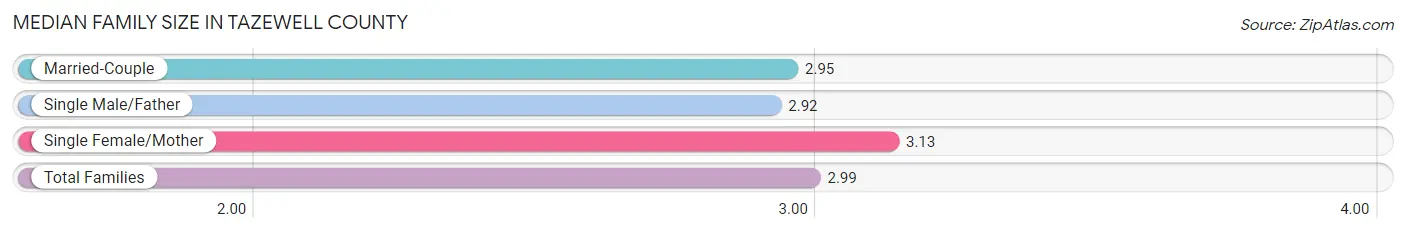
Median Family Size in Tazewell County
The median family size in Tazewell County is 2.99 persons per family, with single female/mother families (2,228 | 20.7%) accounting for the largest median family size of 3.13 persons per family. On the other hand, single male/father families (826 | 7.7%) represent the smallest median family size with 2.92 persons per family.
| Family Type | # Families | Family Size |
| Married-Couple | 7,706 (71.6%) | 2.95 |
| Single Male/Father | 826 (7.7%) | 2.92 |
| Single Female/Mother | 2,228 (20.7%) | 3.13 |
| Total Families | 10,760 (100.0%) | 2.99 |
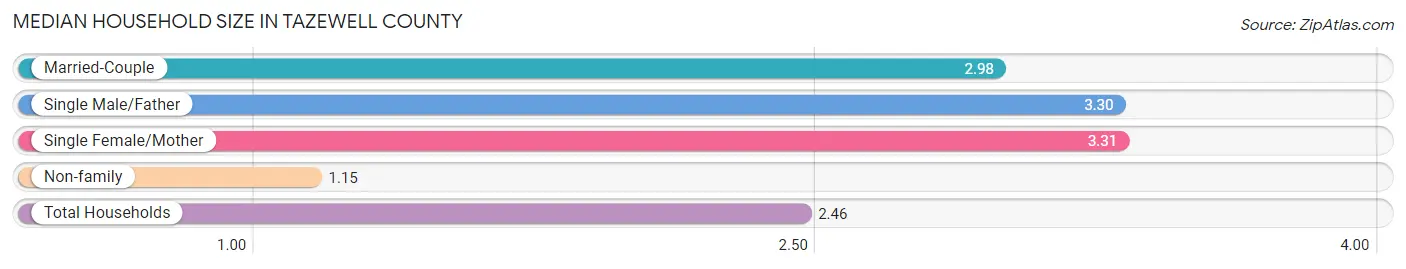
Median Household Size in Tazewell County
The median household size in Tazewell County is 2.46 persons per household, with single female/mother households (2,228 | 14.1%) accounting for the largest median household size of 3.31 persons per household. non-family households (5,040 | 31.9%) represent the smallest median household size with 1.15 persons per household.
| Household Type | # Households | Household Size |
| Married-Couple | 7,706 (48.8%) | 2.98 |
| Single Male/Father | 826 (5.2%) | 3.30 |
| Single Female/Mother | 2,228 (14.1%) | 3.31 |
| Non-family | 5,040 (31.9%) | 1.15 |
| Total Households | 15,800 (100.0%) | 2.46 |
Household Size by Marriage Status in Tazewell County
Out of a total of 15,800 households in Tazewell County, 10,760 (68.1%) are family households, while 5,040 (31.9%) are nonfamily households. The most numerous type of family households are 2-person households, comprising 5,465, and the most common type of nonfamily households are 1-person households, comprising 4,543.
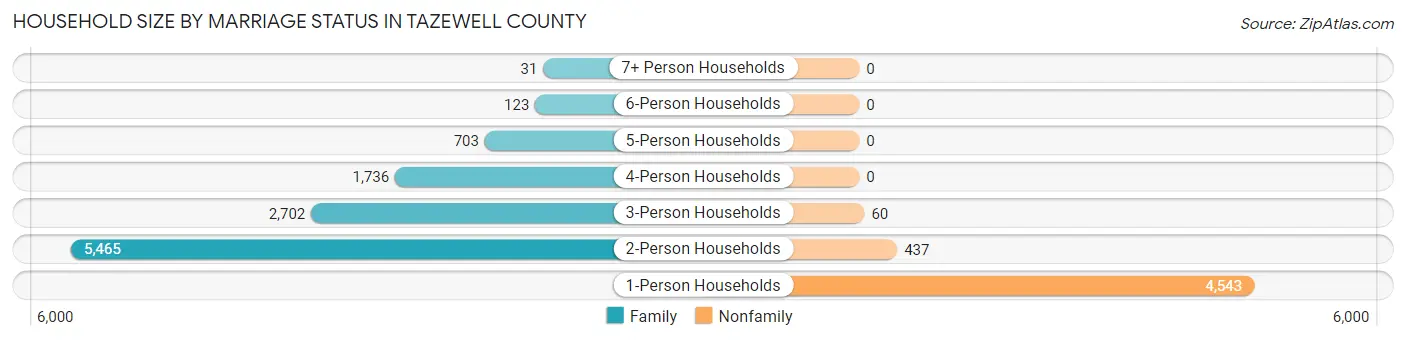
| Household Size | Family Households | Nonfamily Households |
| 1-Person Households | - | 4,543 (28.7%) |
| 2-Person Households | 5,465 (34.6%) | 437 (2.8%) |
| 3-Person Households | 2,702 (17.1%) | 60 (0.4%) |
| 4-Person Households | 1,736 (11.0%) | 0 (0.0%) |
| 5-Person Households | 703 (4.4%) | 0 (0.0%) |
| 6-Person Households | 123 (0.8%) | 0 (0.0%) |
| 7+ Person Households | 31 (0.2%) | 0 (0.0%) |
| Total | 10,760 (68.1%) | 5,040 (31.9%) |
Female Fertility in Tazewell County
Fertility by Age in Tazewell County
Average fertility rate in Tazewell County is 92.0 births per 1,000 women. Women in the age bracket of 20 to 34 years have the highest fertility rate with 191.0 births per 1,000 women. Women in the age bracket of 20 to 34 years acount for 82.9% of all women with births.
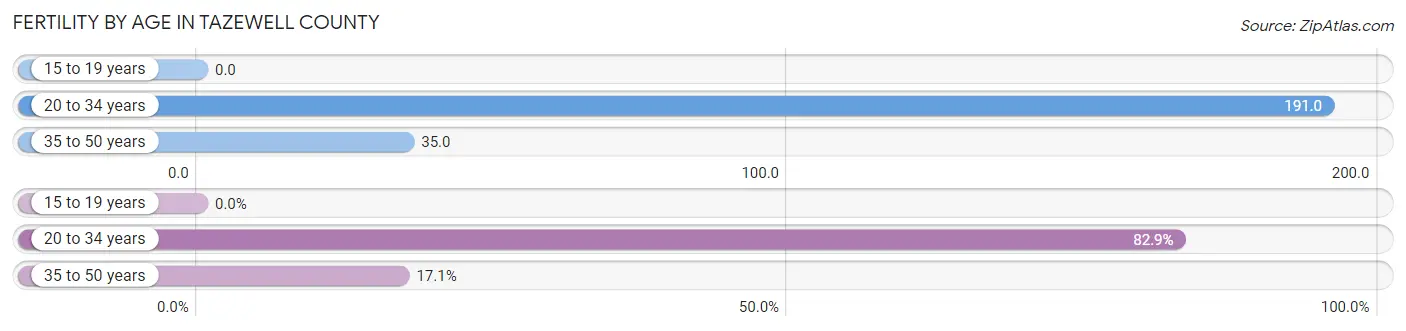
| Age Bracket | Women with Births | Births / 1,000 Women |
| 15 to 19 years | 0 (0.0%) | 0.0 |
| 20 to 34 years | 616 (82.9%) | 191.0 |
| 35 to 50 years | 127 (17.1%) | 35.0 |
| Total | 743 (100.0%) | 92.0 |
Fertility by Age by Marriage Status in Tazewell County
45.2% of women with births (743) in Tazewell County are married. The highest percentage of unmarried women with births falls into 20 to 34 years age bracket with 65.9% of them unmarried at the time of birth, while the lowest percentage of unmarried women with births belong to 35 to 50 years age bracket with 0.8% of them unmarried.
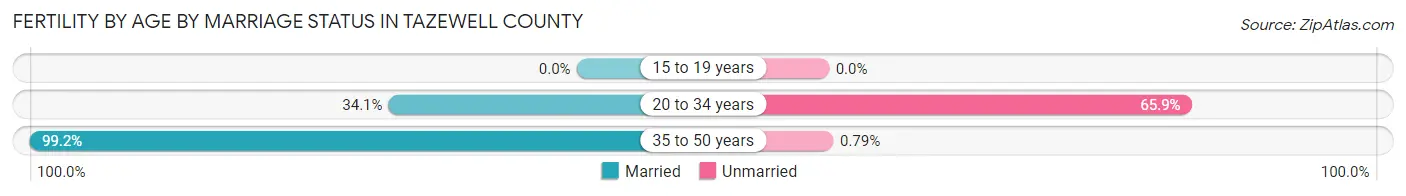
| Age Bracket | Married | Unmarried |
| 15 to 19 years | 0 (0.0%) | 0 (0.0%) |
| 20 to 34 years | 210 (34.1%) | 406 (65.9%) |
| 35 to 50 years | 126 (99.2%) | 1 (0.8%) |
| Total | 336 (45.2%) | 407 (54.8%) |
Fertility by Education in Tazewell County
Average fertility rate in Tazewell County is 92.0 births per 1,000 women. Women with the education attainment of less than high school have the highest fertility rate of 186.0 births per 1,000 women, while women with the education attainment of graduate degree have the lowest fertility at 19.0 births per 1,000 women. Women with the education attainment of less than high school represent 34.9% of all women with births.
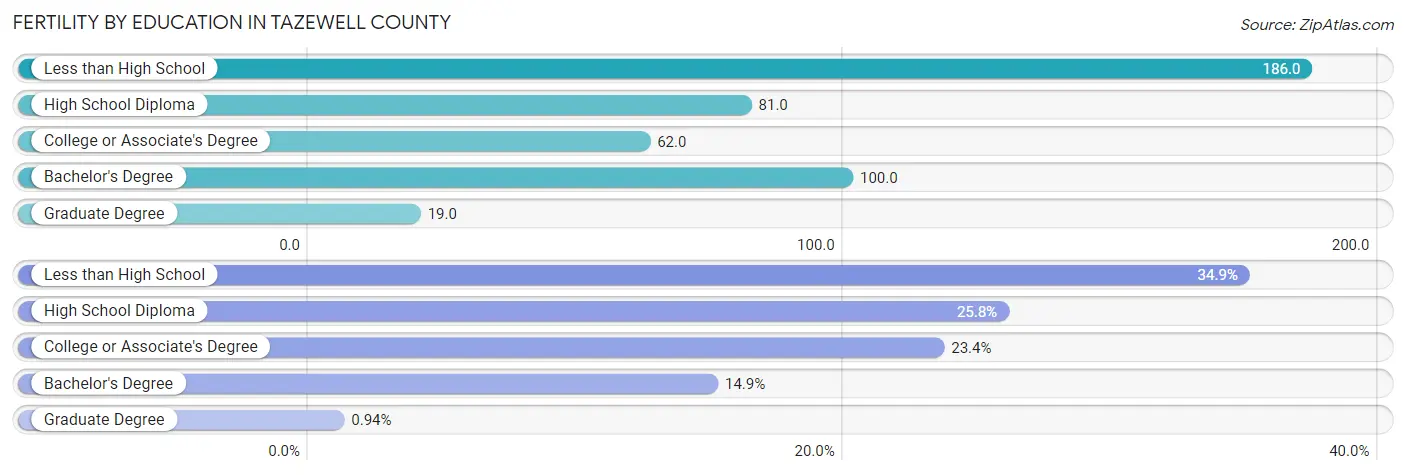
| Educational Attainment | Women with Births | Births / 1,000 Women |
| Less than High School | 259 (34.9%) | 186.0 |
| High School Diploma | 192 (25.8%) | 81.0 |
| College or Associate's Degree | 174 (23.4%) | 62.0 |
| Bachelor's Degree | 111 (14.9%) | 100.0 |
| Graduate Degree | 7 (0.9%) | 19.0 |
| Total | 743 (100.0%) | 92.0 |
Fertility by Education by Marriage Status in Tazewell County
54.8% of women with births in Tazewell County are unmarried. Women with the educational attainment of bachelor's degree are most likely to be married with 100.0% of them married at childbirth, while women with the educational attainment of less than high school are least likely to be married with 98.5% of them unmarried at childbirth.
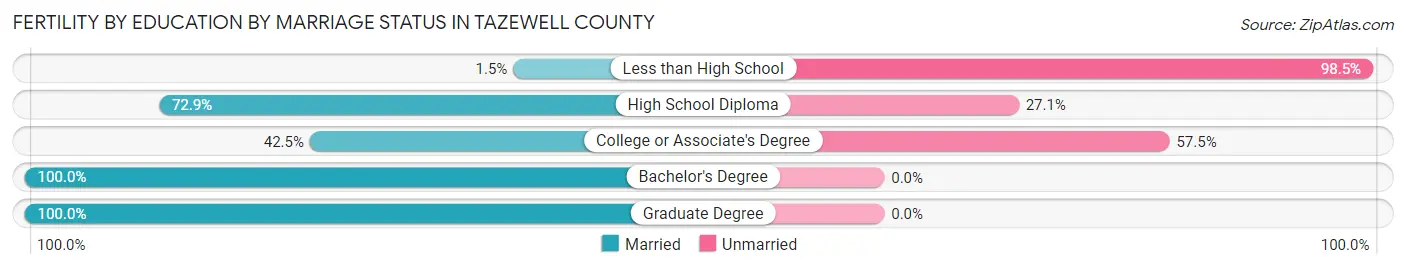
| Educational Attainment | Married | Unmarried |
| Less than High School | 4 (1.5%) | 255 (98.5%) |
| High School Diploma | 140 (72.9%) | 52 (27.1%) |
| College or Associate's Degree | 74 (42.5%) | 100 (57.5%) |
| Bachelor's Degree | 111 (100.0%) | 0 (0.0%) |
| Graduate Degree | 7 (100.0%) | 0 (0.0%) |
| Total | 336 (45.2%) | 407 (54.8%) |
Employment Characteristics in Tazewell County
Employment by Class of Employer in Tazewell County
Among the 14,127 employed individuals in Tazewell County, private company employees (9,400 | 66.5%), local government employees (1,370 | 9.7%), and state government employees (1,272 | 9.0%) make up the most common classes of employment.
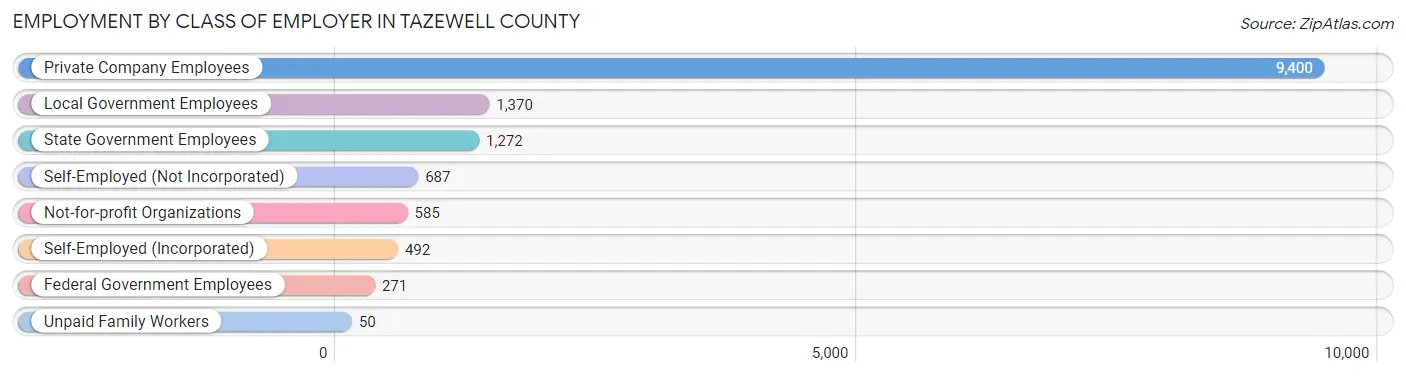
| Employer Class | # Employees | % Employees |
| Private Company Employees | 9,400 | 66.5% |
| Self-Employed (Incorporated) | 492 | 3.5% |
| Self-Employed (Not Incorporated) | 687 | 4.9% |
| Not-for-profit Organizations | 585 | 4.1% |
| Local Government Employees | 1,370 | 9.7% |
| State Government Employees | 1,272 | 9.0% |
| Federal Government Employees | 271 | 1.9% |
| Unpaid Family Workers | 50 | 0.4% |
| Total | 14,127 | 100.0% |
Employment Status by Age in Tazewell County
According to the labor force statistics for Tazewell County, out of the total population over 16 years of age (33,365), 45.6% or 15,214 individuals are in the labor force, with 5.7% or 867 of them unemployed. The age group with the highest labor force participation rate is 25 to 29 years, with 77.2% or 1,660 individuals in the labor force. Within the labor force, the 20 to 24 years age range has the highest percentage of unemployed individuals, with 16.6% or 229 of them being unemployed.
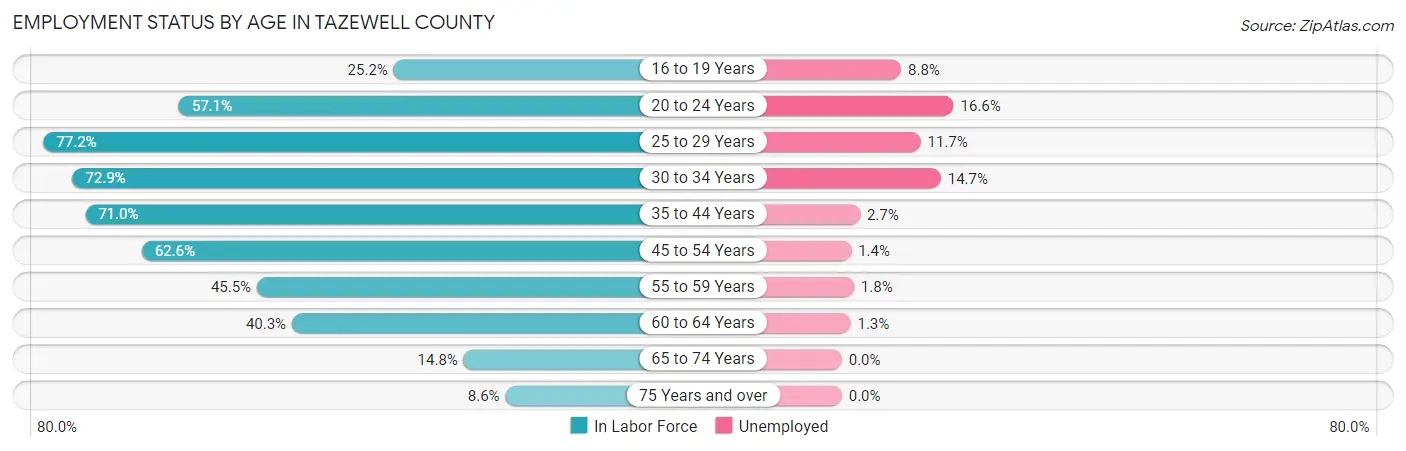
| Age Bracket | In Labor Force | Unemployed |
| 16 to 19 Years | 466 (25.2%) | 41 (8.8%) |
| 20 to 24 Years | 1,377 (57.1%) | 229 (16.6%) |
| 25 to 29 Years | 1,660 (77.2%) | 194 (11.7%) |
| 30 to 34 Years | 1,540 (72.9%) | 226 (14.7%) |
| 35 to 44 Years | 3,411 (71.0%) | 92 (2.7%) |
| 45 to 54 Years | 3,159 (62.6%) | 44 (1.4%) |
| 55 to 59 Years | 1,197 (45.5%) | 22 (1.8%) |
| 60 to 64 Years | 1,247 (40.3%) | 16 (1.3%) |
| 65 to 74 Years | 819 (14.8%) | 0 (0.0%) |
| 75 Years and over | 321 (8.6%) | 0 (0.0%) |
| Total | 15,214 (45.6%) | 867 (5.7%) |
Employment Status by Educational Attainment in Tazewell County
According to labor force statistics for Tazewell County, 61.6% of individuals (12,220) out of the total population between 25 and 64 years of age (19,837) are in the labor force, with 4.9% or 599 of them being unemployed. The group with the highest labor force participation rate are those with the educational attainment of bachelor's degree or higher, with 79.7% or 2,750 individuals in the labor force. Within the labor force, individuals with less than high school education have the highest percentage of unemployment, with 9.8% or 53 of them being unemployed.
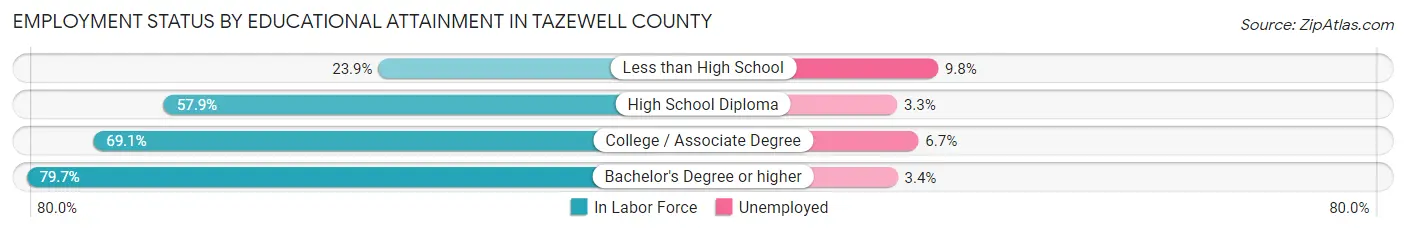
| Educational Attainment | In Labor Force | Unemployed |
| Less than High School | 539 (23.9%) | 221 (9.8%) |
| High School Diploma | 4,378 (57.9%) | 250 (3.3%) |
| College / Associate Degree | 4,541 (69.1%) | 440 (6.7%) |
| Bachelor's Degree or higher | 2,750 (79.7%) | 117 (3.4%) |
| Total | 12,220 (61.6%) | 972 (4.9%) |
Employment Occupations by Sex in Tazewell County
Management, Business, Science and Arts Occupations
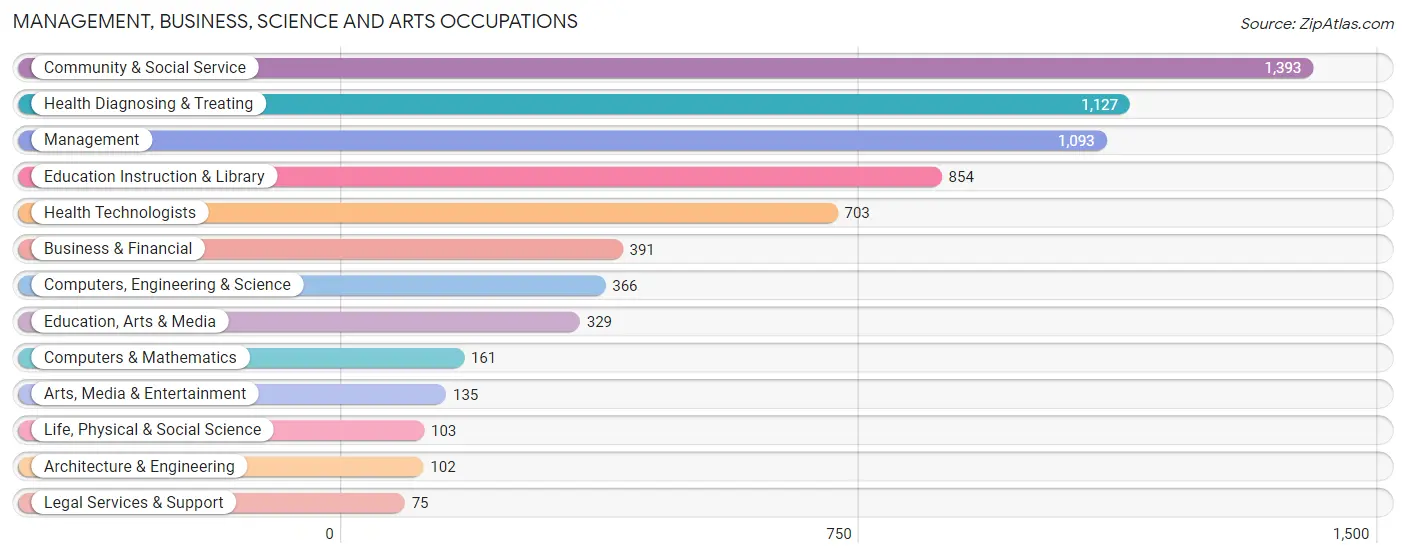
The most common Management, Business, Science and Arts occupations in Tazewell County are Community & Social Service (1,393 | 9.7%), Health Diagnosing & Treating (1,127 | 7.9%), Management (1,093 | 7.6%), Education Instruction & Library (854 | 6.0%), and Health Technologists (703 | 4.9%).
Management, Business, Science and Arts Occupations by Sex
Within the Management, Business, Science and Arts occupations in Tazewell County, the most male-oriented occupations are Life, Physical & Social Science (80.6%), Architecture & Engineering (76.5%), and Legal Services & Support (73.3%), while the most female-oriented occupations are Health Diagnosing & Treating (79.0%), Education, Arts & Media (76.9%), and Health Technologists (75.2%).
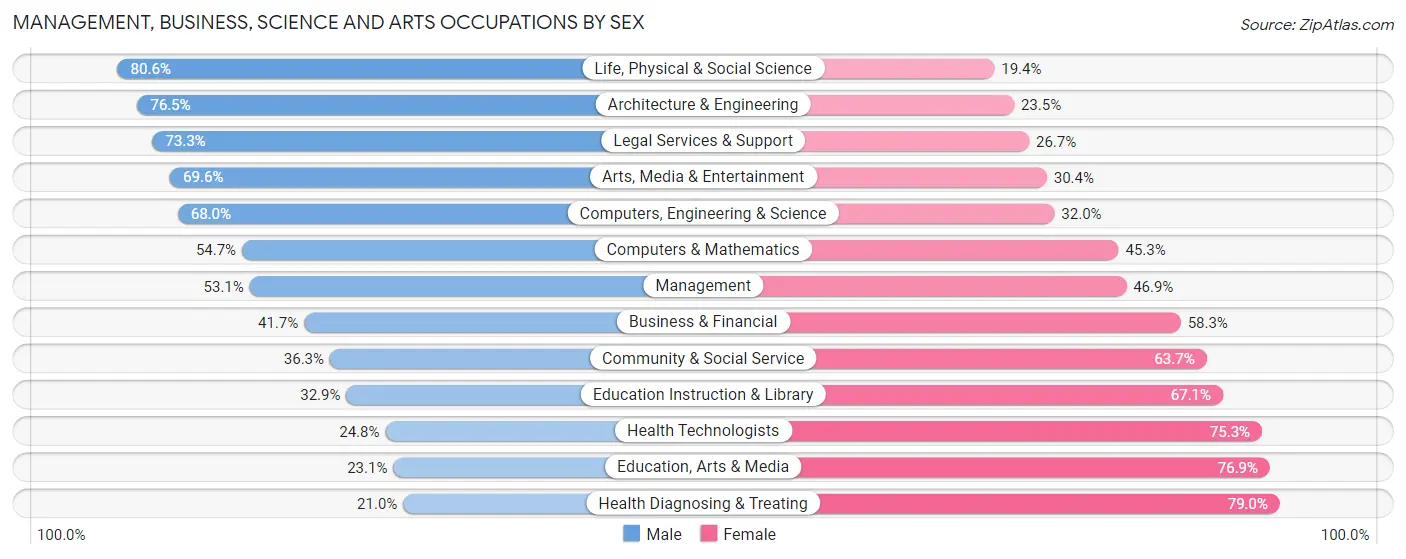
| Occupation | Male | Female |
| Management | 580 (53.1%) | 513 (46.9%) |
| Business & Financial | 163 (41.7%) | 228 (58.3%) |
| Computers, Engineering & Science | 249 (68.0%) | 117 (32.0%) |
| Computers & Mathematics | 88 (54.7%) | 73 (45.3%) |
| Architecture & Engineering | 78 (76.5%) | 24 (23.5%) |
| Life, Physical & Social Science | 83 (80.6%) | 20 (19.4%) |
| Community & Social Service | 506 (36.3%) | 887 (63.7%) |
| Education, Arts & Media | 76 (23.1%) | 253 (76.9%) |
| Legal Services & Support | 55 (73.3%) | 20 (26.7%) |
| Education Instruction & Library | 281 (32.9%) | 573 (67.1%) |
| Arts, Media & Entertainment | 94 (69.6%) | 41 (30.4%) |
| Health Diagnosing & Treating | 237 (21.0%) | 890 (79.0%) |
| Health Technologists | 174 (24.7%) | 529 (75.2%) |
| Total (Category) | 1,735 (39.7%) | 2,635 (60.3%) |
| Total (Overall) | 8,008 (55.9%) | 6,320 (44.1%) |
Services Occupations
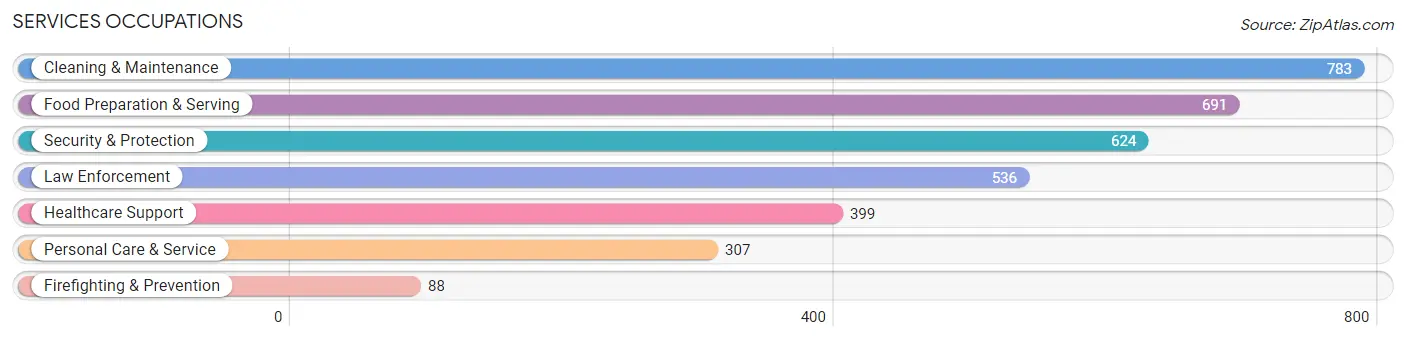
The most common Services occupations in Tazewell County are Cleaning & Maintenance (783 | 5.5%), Food Preparation & Serving (691 | 4.8%), Security & Protection (624 | 4.4%), Law Enforcement (536 | 3.7%), and Healthcare Support (399 | 2.8%).
Services Occupations by Sex
Within the Services occupations in Tazewell County, the most male-oriented occupations are Law Enforcement (87.7%), Security & Protection (82.4%), and Cleaning & Maintenance (67.9%), while the most female-oriented occupations are Personal Care & Service (91.5%), Healthcare Support (76.7%), and Food Preparation & Serving (50.5%).
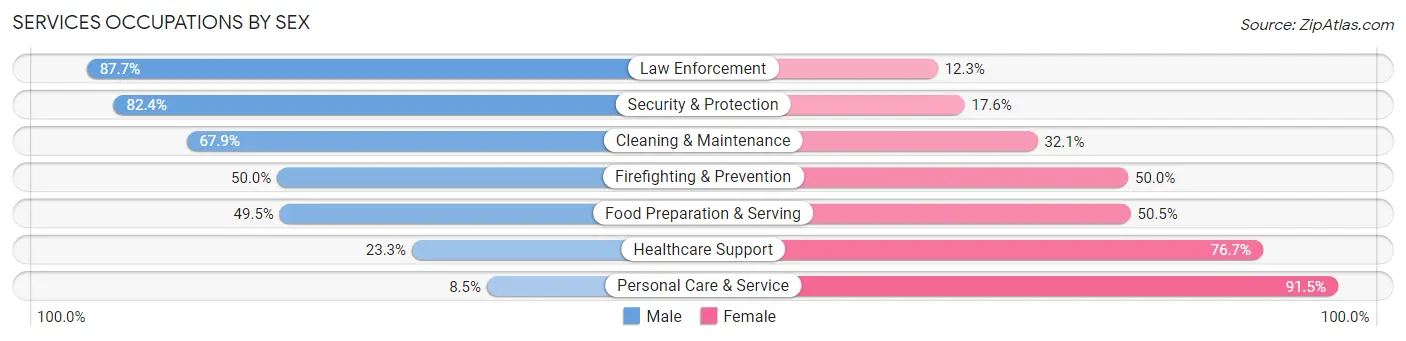
| Occupation | Male | Female |
| Healthcare Support | 93 (23.3%) | 306 (76.7%) |
| Security & Protection | 514 (82.4%) | 110 (17.6%) |
| Firefighting & Prevention | 44 (50.0%) | 44 (50.0%) |
| Law Enforcement | 470 (87.7%) | 66 (12.3%) |
| Food Preparation & Serving | 342 (49.5%) | 349 (50.5%) |
| Cleaning & Maintenance | 532 (67.9%) | 251 (32.1%) |
| Personal Care & Service | 26 (8.5%) | 281 (91.5%) |
| Total (Category) | 1,507 (53.7%) | 1,297 (46.3%) |
| Total (Overall) | 8,008 (55.9%) | 6,320 (44.1%) |
Sales and Office Occupations
The most common Sales and Office occupations in Tazewell County are Office & Administration (1,680 | 11.7%), and Sales & Related (1,667 | 11.6%).

Sales and Office Occupations by Sex
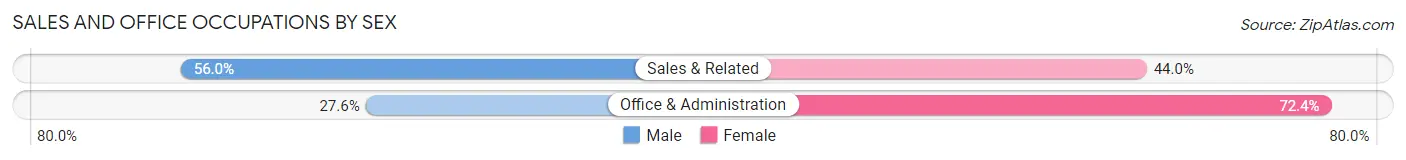
| Occupation | Male | Female |
| Sales & Related | 933 (56.0%) | 734 (44.0%) |
| Office & Administration | 463 (27.6%) | 1,217 (72.4%) |
| Total (Category) | 1,396 (41.7%) | 1,951 (58.3%) |
| Total (Overall) | 8,008 (55.9%) | 6,320 (44.1%) |
Natural Resources, Construction and Maintenance Occupations
The most common Natural Resources, Construction and Maintenance occupations in Tazewell County are Construction & Extraction (840 | 5.9%), Installation, Maintenance & Repair (481 | 3.4%), and Farming, Fishing & Forestry (64 | 0.4%).

Natural Resources, Construction and Maintenance Occupations by Sex

| Occupation | Male | Female |
| Farming, Fishing & Forestry | 64 (100.0%) | 0 (0.0%) |
| Construction & Extraction | 827 (98.5%) | 13 (1.5%) |
| Installation, Maintenance & Repair | 464 (96.5%) | 17 (3.5%) |
| Total (Category) | 1,355 (97.8%) | 30 (2.2%) |
| Total (Overall) | 8,008 (55.9%) | 6,320 (44.1%) |
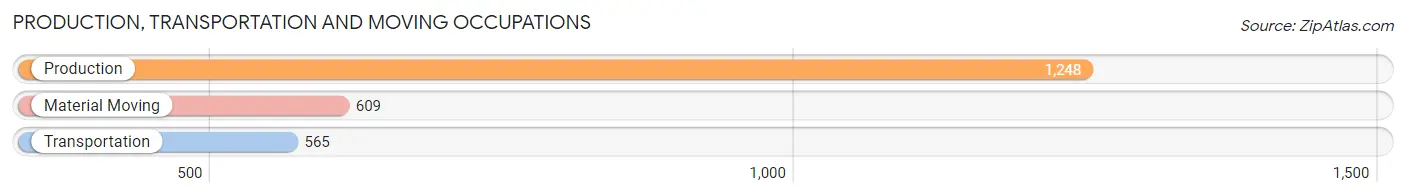
Production, Transportation and Moving Occupations
The most common Production, Transportation and Moving occupations in Tazewell County are Production (1,248 | 8.7%), Material Moving (609 | 4.3%), and Transportation (565 | 3.9%).
Production, Transportation and Moving Occupations by Sex
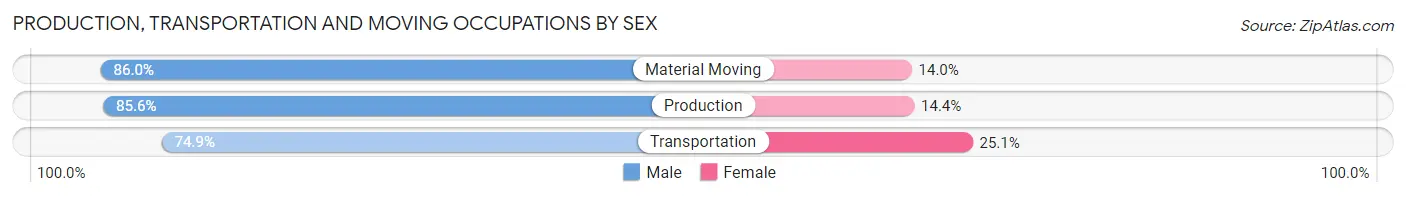
| Occupation | Male | Female |
| Production | 1,068 (85.6%) | 180 (14.4%) |
| Transportation | 423 (74.9%) | 142 (25.1%) |
| Material Moving | 524 (86.0%) | 85 (14.0%) |
| Total (Category) | 2,015 (83.2%) | 407 (16.8%) |
| Total (Overall) | 8,008 (55.9%) | 6,320 (44.1%) |
Employment Industries by Sex in Tazewell County
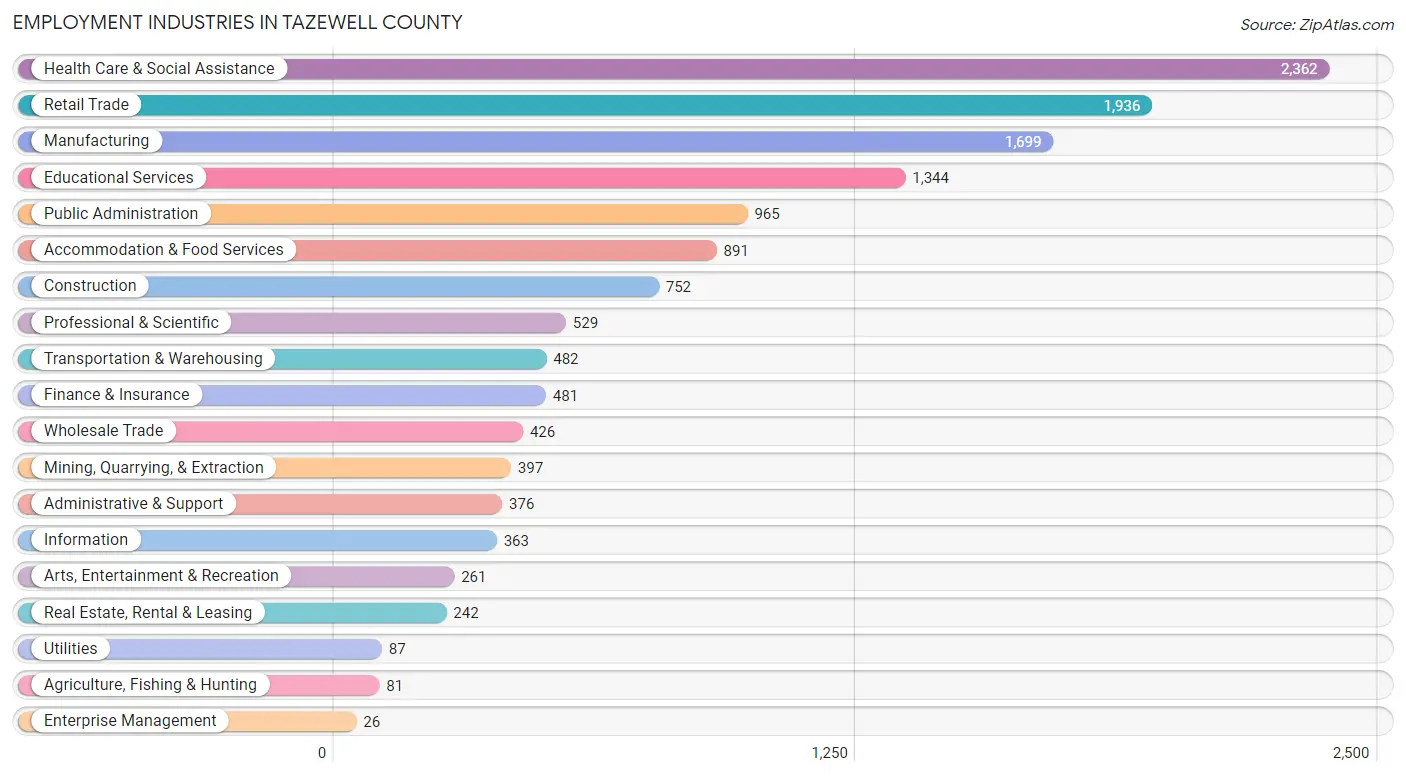
Employment Industries in Tazewell County
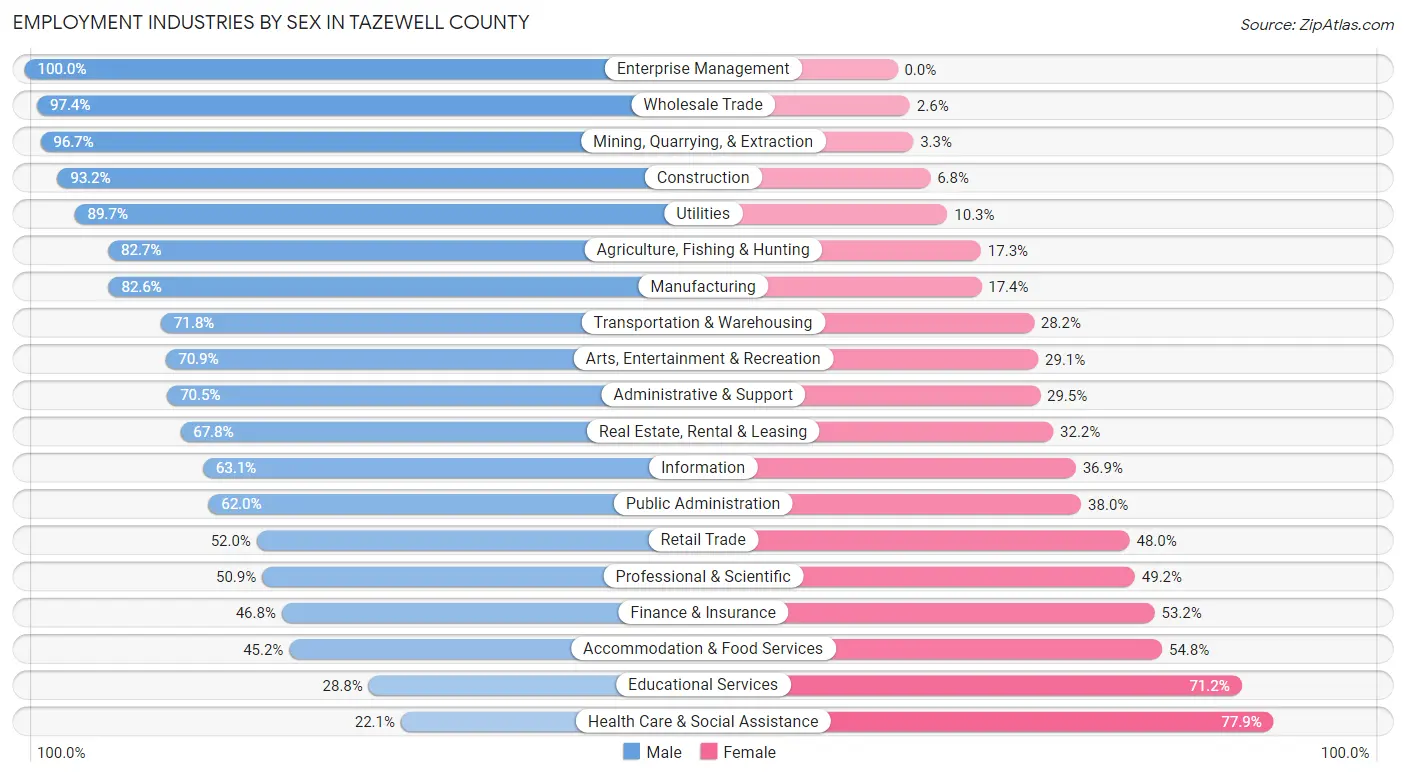
The major employment industries in Tazewell County include Health Care & Social Assistance (2,362 | 16.5%), Retail Trade (1,936 | 13.5%), Manufacturing (1,699 | 11.9%), Educational Services (1,344 | 9.4%), and Public Administration (965 | 6.7%).
Employment Industries by Sex in Tazewell County
The Tazewell County industries that see more men than women are Enterprise Management (100.0%), Wholesale Trade (97.4%), and Mining, Quarrying, & Extraction (96.7%), whereas the industries that tend to have a higher number of women are Health Care & Social Assistance (77.9%), Educational Services (71.2%), and Accommodation & Food Services (54.8%).
| Industry | Male | Female |
| Agriculture, Fishing & Hunting | 67 (82.7%) | 14 (17.3%) |
| Mining, Quarrying, & Extraction | 384 (96.7%) | 13 (3.3%) |
| Construction | 701 (93.2%) | 51 (6.8%) |
| Manufacturing | 1,404 (82.6%) | 295 (17.4%) |
| Wholesale Trade | 415 (97.4%) | 11 (2.6%) |
| Retail Trade | 1,006 (52.0%) | 930 (48.0%) |
| Transportation & Warehousing | 346 (71.8%) | 136 (28.2%) |
| Utilities | 78 (89.7%) | 9 (10.3%) |
| Information | 229 (63.1%) | 134 (36.9%) |
| Finance & Insurance | 225 (46.8%) | 256 (53.2%) |
| Real Estate, Rental & Leasing | 164 (67.8%) | 78 (32.2%) |
| Professional & Scientific | 269 (50.8%) | 260 (49.1%) |
| Enterprise Management | 26 (100.0%) | 0 (0.0%) |
| Administrative & Support | 265 (70.5%) | 111 (29.5%) |
| Educational Services | 387 (28.8%) | 957 (71.2%) |
| Health Care & Social Assistance | 523 (22.1%) | 1,839 (77.9%) |
| Arts, Entertainment & Recreation | 185 (70.9%) | 76 (29.1%) |
| Accommodation & Food Services | 403 (45.2%) | 488 (54.8%) |
| Public Administration | 598 (62.0%) | 367 (38.0%) |
| Total | 8,008 (55.9%) | 6,320 (44.1%) |
Education in Tazewell County
School Enrollment in Tazewell County
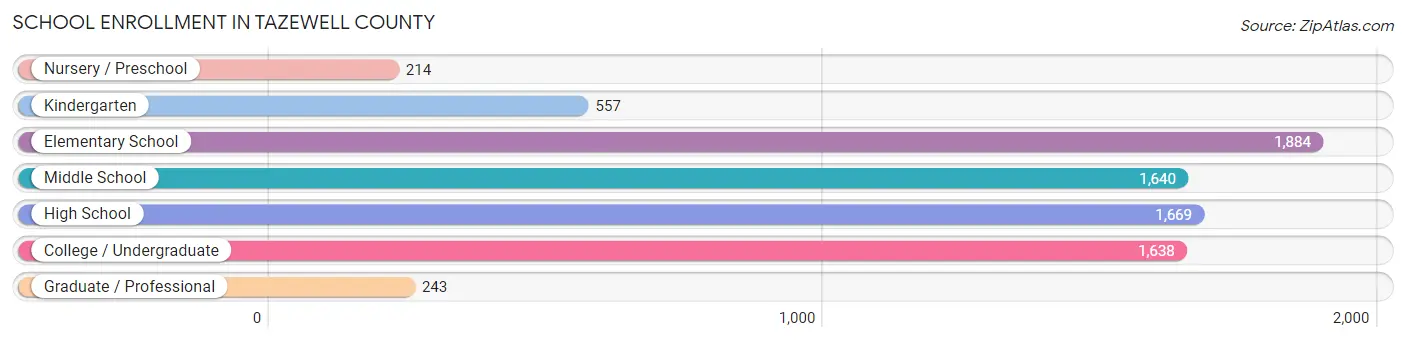
The most common levels of schooling among the 7,845 students in Tazewell County are elementary school (1,884 | 24.0%), high school (1,669 | 21.3%), and middle school (1,640 | 20.9%).
| School Level | # Students | % Students |
| Nursery / Preschool | 214 | 2.7% |
| Kindergarten | 557 | 7.1% |
| Elementary School | 1,884 | 24.0% |
| Middle School | 1,640 | 20.9% |
| High School | 1,669 | 21.3% |
| College / Undergraduate | 1,638 | 20.9% |
| Graduate / Professional | 243 | 3.1% |
| Total | 7,845 | 100.0% |
School Enrollment by Age by Funding Source in Tazewell County
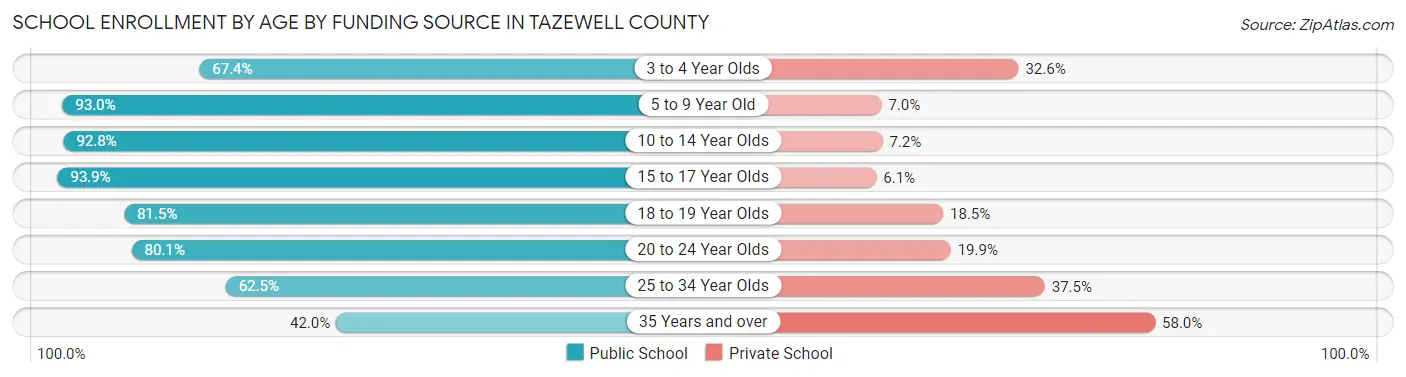
Out of a total of 7,845 students who are enrolled in schools in Tazewell County, 1,083 (13.8%) attend a private institution, while the remaining 6,762 (86.2%) are enrolled in public schools. The age group of 35 years and over has the highest likelihood of being enrolled in private schools, with 286 (58.0% in the age bracket) enrolled. Conversely, the age group of 15 to 17 year olds has the lowest likelihood of being enrolled in a private school, with 1,265 (93.9% in the age bracket) attending a public institution.
| Age Bracket | Public School | Private School |
| 3 to 4 Year Olds | 116 (67.4%) | 56 (32.6%) |
| 5 to 9 Year Old | 2,048 (93.0%) | 155 (7.0%) |
| 10 to 14 Year Olds | 1,897 (92.8%) | 148 (7.2%) |
| 15 to 17 Year Olds | 1,265 (93.9%) | 82 (6.1%) |
| 18 to 19 Year Olds | 550 (81.5%) | 125 (18.5%) |
| 20 to 24 Year Olds | 502 (80.1%) | 125 (19.9%) |
| 25 to 34 Year Olds | 177 (62.5%) | 106 (37.5%) |
| 35 Years and over | 207 (42.0%) | 286 (58.0%) |
| Total | 6,762 (86.2%) | 1,083 (13.8%) |
Educational Attainment by Field of Study in Tazewell County
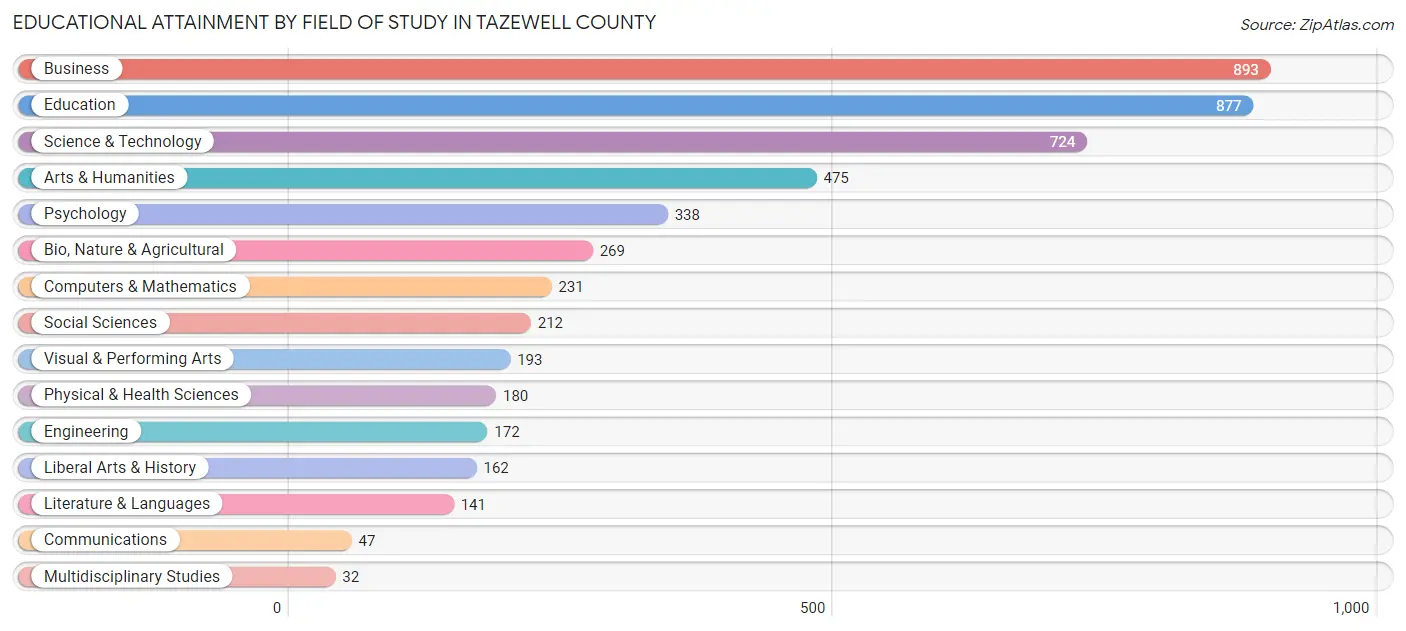
Business (893 | 18.0%), education (877 | 17.7%), science & technology (724 | 14.6%), arts & humanities (475 | 9.6%), and psychology (338 | 6.8%) are the most common fields of study among 4,946 individuals in Tazewell County who have obtained a bachelor's degree or higher.
| Field of Study | # Graduates | % Graduates |
| Computers & Mathematics | 231 | 4.7% |
| Bio, Nature & Agricultural | 269 | 5.4% |
| Physical & Health Sciences | 180 | 3.6% |
| Psychology | 338 | 6.8% |
| Social Sciences | 212 | 4.3% |
| Engineering | 172 | 3.5% |
| Multidisciplinary Studies | 32 | 0.6% |
| Science & Technology | 724 | 14.6% |
| Business | 893 | 18.0% |
| Education | 877 | 17.7% |
| Literature & Languages | 141 | 2.9% |
| Liberal Arts & History | 162 | 3.3% |
| Visual & Performing Arts | 193 | 3.9% |
| Communications | 47 | 0.9% |
| Arts & Humanities | 475 | 9.6% |
| Total | 4,946 | 100.0% |
Transportation & Commute in Tazewell County
Vehicle Availability by Sex in Tazewell County
The most prevalent vehicle ownership categories in Tazewell County are males with 2 vehicles (2,988, accounting for 37.7%) and females with 2 vehicles (2,102, making up 48.8%).
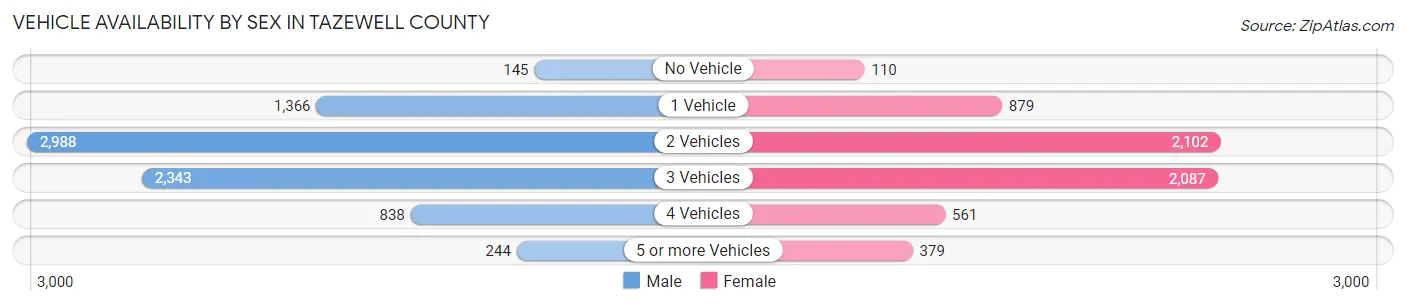
| Vehicles Available | Male | Female |
| No Vehicle | 145 (1.8%) | 110 (1.8%) |
| 1 Vehicle | 1,366 (17.2%) | 879 (14.4%) |
| 2 Vehicles | 2,988 (37.7%) | 2,102 (34.4%) |
| 3 Vehicles | 2,343 (29.6%) | 2,087 (34.1%) |
| 4 Vehicles | 838 (10.6%) | 561 (9.2%) |
| 5 or more Vehicles | 244 (3.1%) | 379 (6.2%) |
| Total | 7,924 (100.0%) | 6,118 (100.0%) |
Commute Time in Tazewell County
The most frequently occuring commute durations in Tazewell County are 20 to 24 minutes (2,071 commuters, 15.3%), 5 to 9 minutes (2,060 commuters, 15.2%), and 15 to 19 minutes (1,909 commuters, 14.1%).
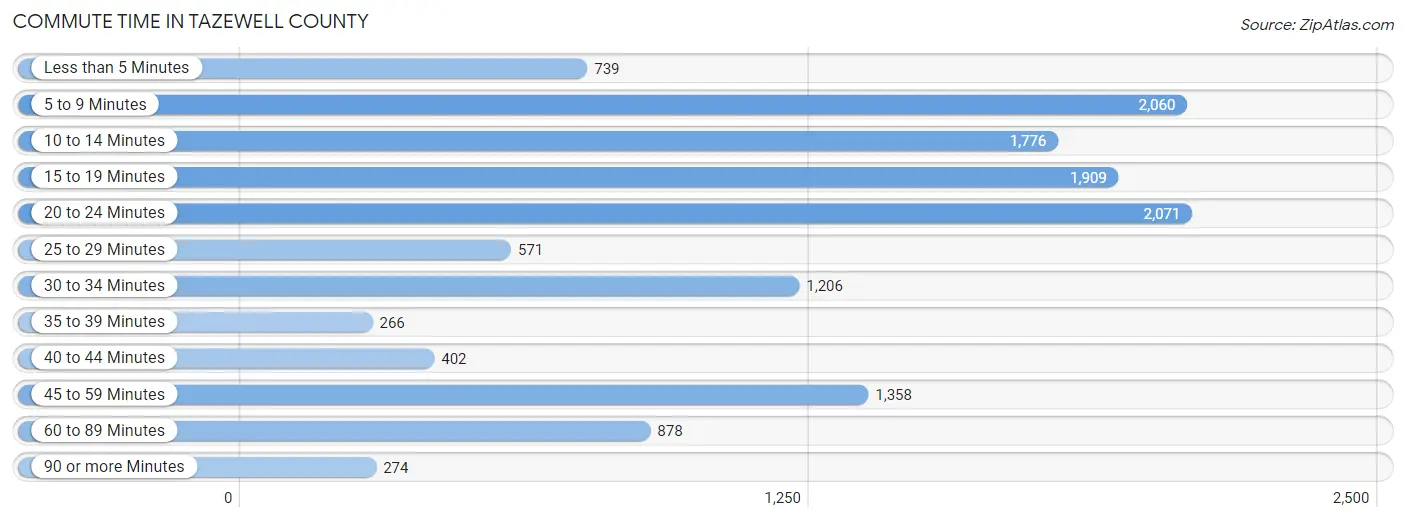
| Commute Time | # Commuters | % Commuters |
| Less than 5 Minutes | 739 | 5.5% |
| 5 to 9 Minutes | 2,060 | 15.2% |
| 10 to 14 Minutes | 1,776 | 13.2% |
| 15 to 19 Minutes | 1,909 | 14.1% |
| 20 to 24 Minutes | 2,071 | 15.3% |
| 25 to 29 Minutes | 571 | 4.2% |
| 30 to 34 Minutes | 1,206 | 8.9% |
| 35 to 39 Minutes | 266 | 2.0% |
| 40 to 44 Minutes | 402 | 3.0% |
| 45 to 59 Minutes | 1,358 | 10.1% |
| 60 to 89 Minutes | 878 | 6.5% |
| 90 or more Minutes | 274 | 2.0% |
Commute Time by Sex in Tazewell County
The most common commute times in Tazewell County are 5 to 9 minutes (1,179 commuters, 15.3%) for males and 20 to 24 minutes (1,076 commuters, 18.5%) for females.
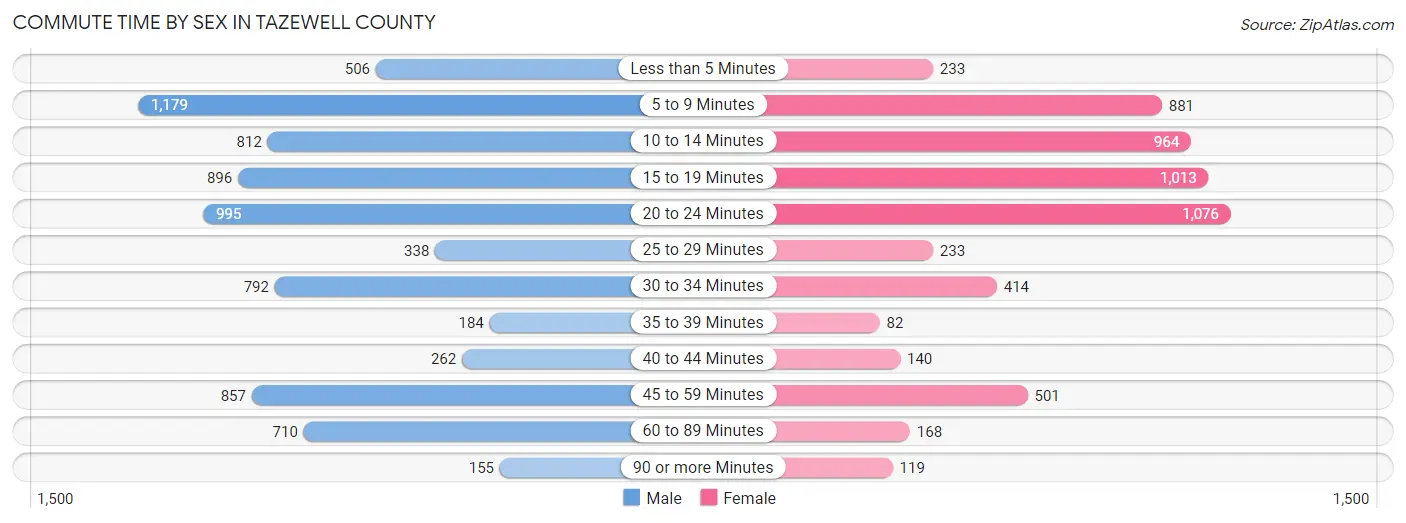
| Commute Time | Male | Female |
| Less than 5 Minutes | 506 (6.6%) | 233 (4.0%) |
| 5 to 9 Minutes | 1,179 (15.3%) | 881 (15.1%) |
| 10 to 14 Minutes | 812 (10.6%) | 964 (16.6%) |
| 15 to 19 Minutes | 896 (11.7%) | 1,013 (17.4%) |
| 20 to 24 Minutes | 995 (13.0%) | 1,076 (18.5%) |
| 25 to 29 Minutes | 338 (4.4%) | 233 (4.0%) |
| 30 to 34 Minutes | 792 (10.3%) | 414 (7.1%) |
| 35 to 39 Minutes | 184 (2.4%) | 82 (1.4%) |
| 40 to 44 Minutes | 262 (3.4%) | 140 (2.4%) |
| 45 to 59 Minutes | 857 (11.2%) | 501 (8.6%) |
| 60 to 89 Minutes | 710 (9.2%) | 168 (2.9%) |
| 90 or more Minutes | 155 (2.0%) | 119 (2.0%) |
Time of Departure to Work by Sex in Tazewell County
The most frequent times of departure to work in Tazewell County are 7:00 AM to 7:29 AM (1,260, 16.4%) for males and 7:30 AM to 7:59 AM (997, 17.1%) for females.
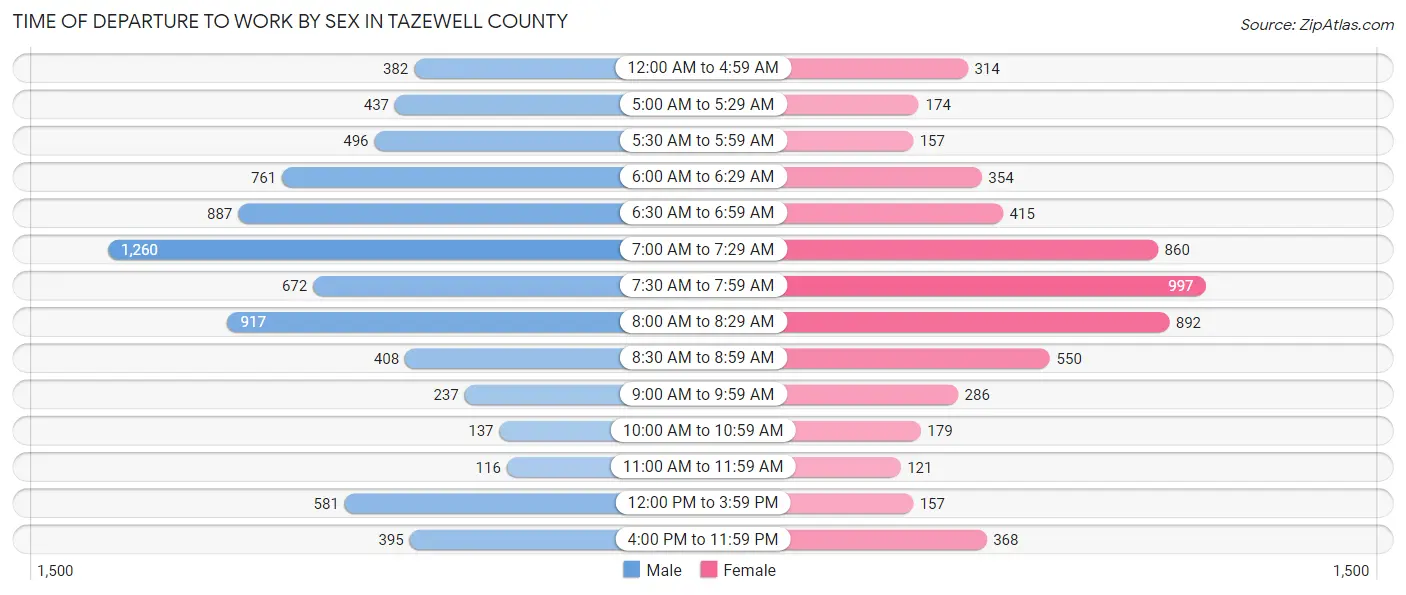
| Time of Departure | Male | Female |
| 12:00 AM to 4:59 AM | 382 (5.0%) | 314 (5.4%) |
| 5:00 AM to 5:29 AM | 437 (5.7%) | 174 (3.0%) |
| 5:30 AM to 5:59 AM | 496 (6.5%) | 157 (2.7%) |
| 6:00 AM to 6:29 AM | 761 (9.9%) | 354 (6.1%) |
| 6:30 AM to 6:59 AM | 887 (11.5%) | 415 (7.1%) |
| 7:00 AM to 7:29 AM | 1,260 (16.4%) | 860 (14.8%) |
| 7:30 AM to 7:59 AM | 672 (8.7%) | 997 (17.1%) |
| 8:00 AM to 8:29 AM | 917 (11.9%) | 892 (15.3%) |
| 8:30 AM to 8:59 AM | 408 (5.3%) | 550 (9.4%) |
| 9:00 AM to 9:59 AM | 237 (3.1%) | 286 (4.9%) |
| 10:00 AM to 10:59 AM | 137 (1.8%) | 179 (3.1%) |
| 11:00 AM to 11:59 AM | 116 (1.5%) | 121 (2.1%) |
| 12:00 PM to 3:59 PM | 581 (7.6%) | 157 (2.7%) |
| 4:00 PM to 11:59 PM | 395 (5.1%) | 368 (6.3%) |
| Total | 7,686 (100.0%) | 5,824 (100.0%) |
Housing Occupancy in Tazewell County
Occupancy by Ownership in Tazewell County
Of the total 15,800 dwellings in Tazewell County, owner-occupied units account for 11,476 (72.6%), while renter-occupied units make up 4,324 (27.4%).
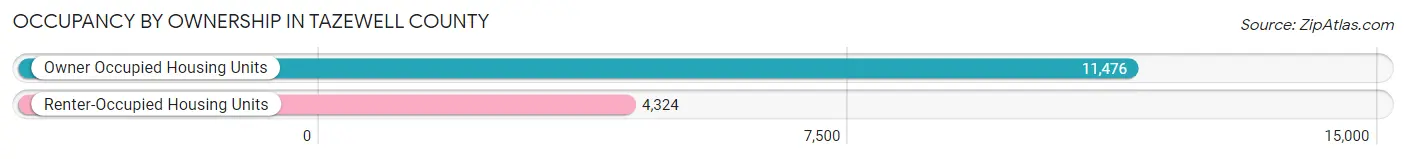
| Occupancy | # Housing Units | % Housing Units |
| Owner Occupied Housing Units | 11,476 | 72.6% |
| Renter-Occupied Housing Units | 4,324 | 27.4% |
| Total Occupied Housing Units | 15,800 | 100.0% |
Occupancy by Household Size in Tazewell County
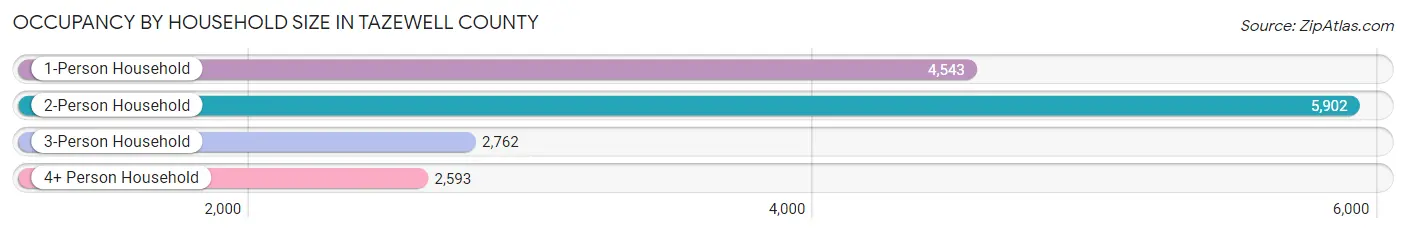
| Household Size | # Housing Units | % Housing Units |
| 1-Person Household | 4,543 | 28.7% |
| 2-Person Household | 5,902 | 37.3% |
| 3-Person Household | 2,762 | 17.5% |
| 4+ Person Household | 2,593 | 16.4% |
| Total Housing Units | 15,800 | 100.0% |
Occupancy by Ownership by Household Size in Tazewell County
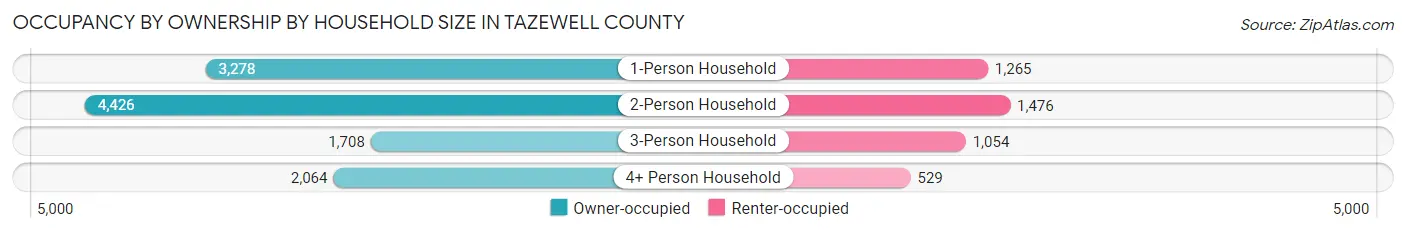
| Household Size | Owner-occupied | Renter-occupied |
| 1-Person Household | 3,278 (72.2%) | 1,265 (27.9%) |
| 2-Person Household | 4,426 (75.0%) | 1,476 (25.0%) |
| 3-Person Household | 1,708 (61.8%) | 1,054 (38.2%) |
| 4+ Person Household | 2,064 (79.6%) | 529 (20.4%) |
| Total Housing Units | 11,476 (72.6%) | 4,324 (27.4%) |
Occupancy by Educational Attainment in Tazewell County
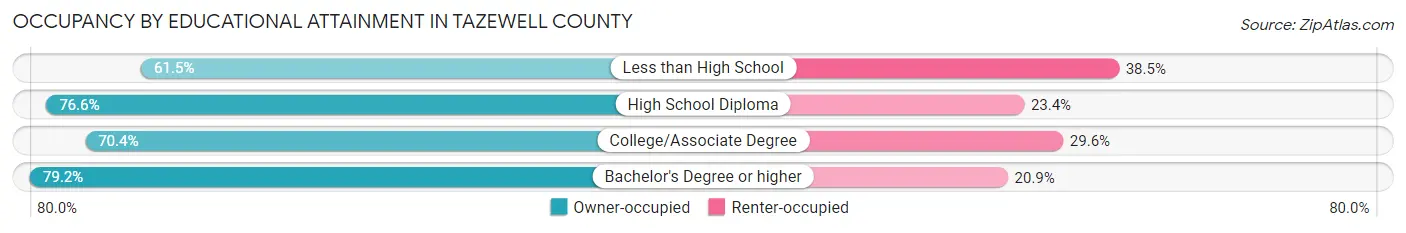
| Household Size | Owner-occupied | Renter-occupied |
| Less than High School | 1,329 (61.5%) | 831 (38.5%) |
| High School Diploma | 4,206 (76.6%) | 1,288 (23.4%) |
| College/Associate Degree | 4,066 (70.4%) | 1,711 (29.6%) |
| Bachelor's Degree or higher | 1,875 (79.1%) | 494 (20.8%) |
Occupancy by Age of Householder in Tazewell County
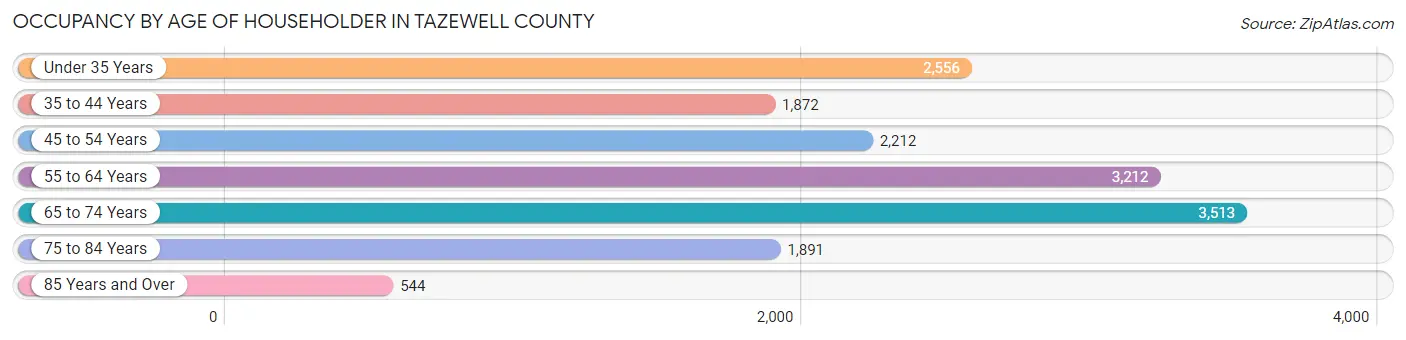
| Age Bracket | # Households | % Households |
| Under 35 Years | 2,556 | 16.2% |
| 35 to 44 Years | 1,872 | 11.8% |
| 45 to 54 Years | 2,212 | 14.0% |
| 55 to 64 Years | 3,212 | 20.3% |
| 65 to 74 Years | 3,513 | 22.2% |
| 75 to 84 Years | 1,891 | 12.0% |
| 85 Years and Over | 544 | 3.4% |
| Total | 15,800 | 100.0% |
Housing Finances in Tazewell County
Median Income by Occupancy in Tazewell County
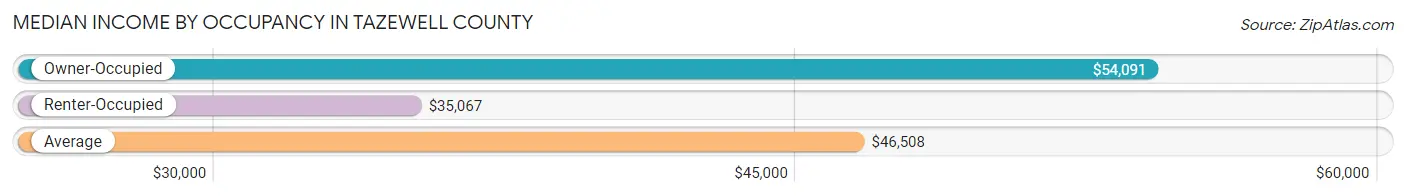
| Occupancy Type | # Households | Median Income |
| Owner-Occupied | 11,476 (72.6%) | $54,091 |
| Renter-Occupied | 4,324 (27.4%) | $35,067 |
| Average | 15,800 (100.0%) | $46,508 |
Occupancy by Householder Income Bracket in Tazewell County
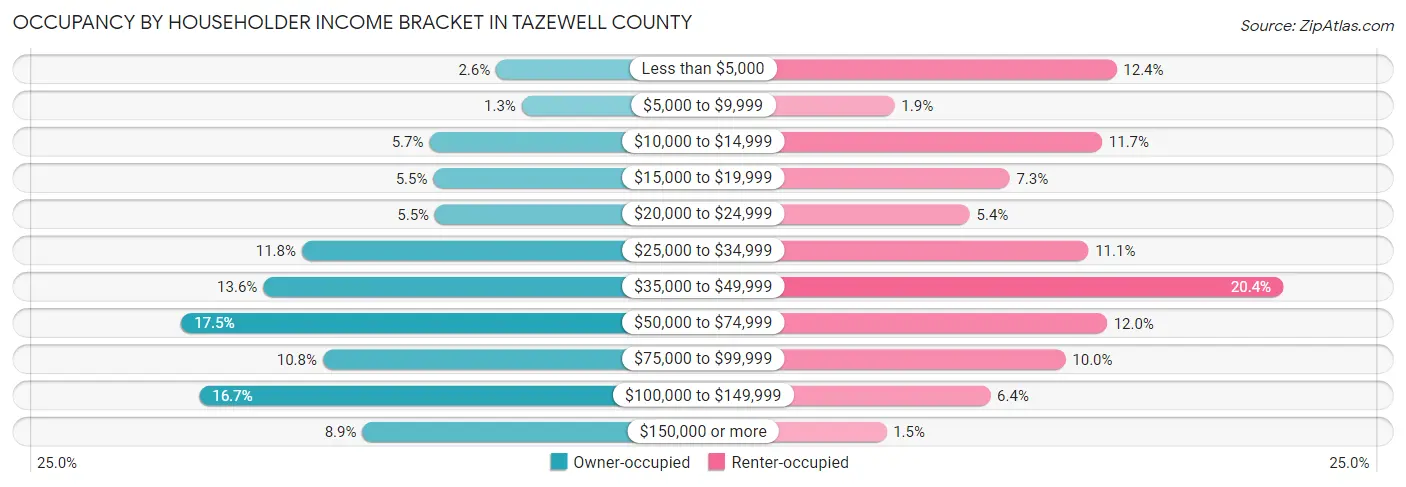
| Income Bracket | Owner-occupied | Renter-occupied |
| Less than $5,000 | 293 (2.5%) | 537 (12.4%) |
| $5,000 to $9,999 | 153 (1.3%) | 80 (1.8%) |
| $10,000 to $14,999 | 658 (5.7%) | 507 (11.7%) |
| $15,000 to $19,999 | 636 (5.5%) | 317 (7.3%) |
| $20,000 to $24,999 | 627 (5.5%) | 235 (5.4%) |
| $25,000 to $34,999 | 1,354 (11.8%) | 479 (11.1%) |
| $35,000 to $49,999 | 1,565 (13.6%) | 880 (20.3%) |
| $50,000 to $74,999 | 2,013 (17.5%) | 517 (12.0%) |
| $75,000 to $99,999 | 1,239 (10.8%) | 432 (10.0%) |
| $100,000 to $149,999 | 1,914 (16.7%) | 277 (6.4%) |
| $150,000 or more | 1,024 (8.9%) | 63 (1.5%) |
| Total | 11,476 (100.0%) | 4,324 (100.0%) |
Monthly Housing Cost Tiers in Tazewell County
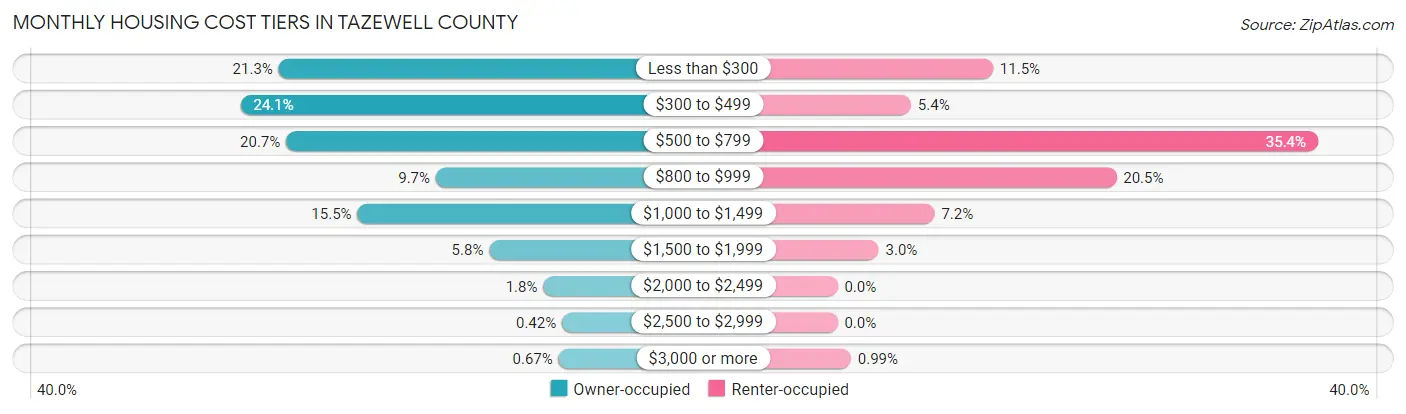
| Monthly Cost | Owner-occupied | Renter-occupied |
| Less than $300 | 2,443 (21.3%) | 495 (11.5%) |
| $300 to $499 | 2,767 (24.1%) | 234 (5.4%) |
| $500 to $799 | 2,380 (20.7%) | 1,530 (35.4%) |
| $800 to $999 | 1,114 (9.7%) | 888 (20.5%) |
| $1,000 to $1,499 | 1,778 (15.5%) | 309 (7.1%) |
| $1,500 to $1,999 | 663 (5.8%) | 131 (3.0%) |
| $2,000 to $2,499 | 206 (1.8%) | 0 (0.0%) |
| $2,500 to $2,999 | 48 (0.4%) | 0 (0.0%) |
| $3,000 or more | 77 (0.7%) | 43 (1.0%) |
| Total | 11,476 (100.0%) | 4,324 (100.0%) |
Physical Housing Characteristics in Tazewell County
Housing Structures in Tazewell County
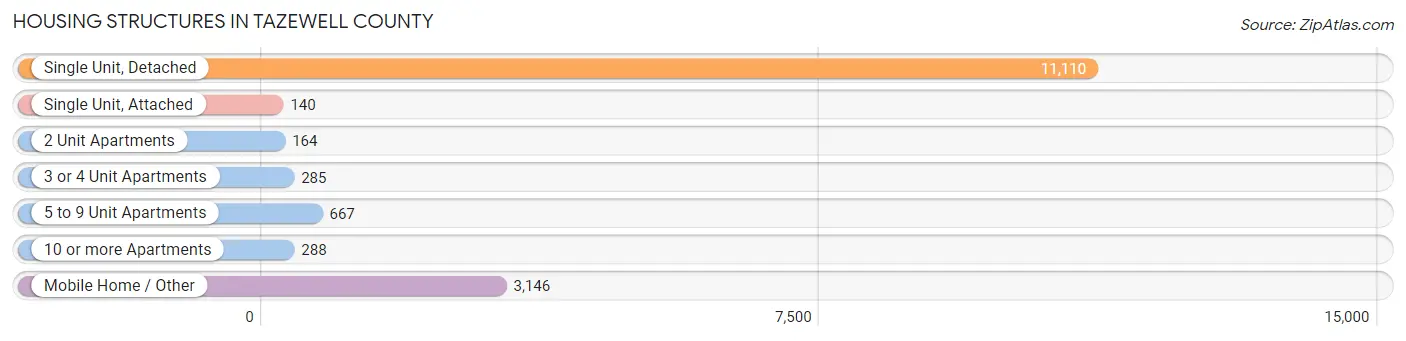
| Structure Type | # Housing Units | % Housing Units |
| Single Unit, Detached | 11,110 | 70.3% |
| Single Unit, Attached | 140 | 0.9% |
| 2 Unit Apartments | 164 | 1.0% |
| 3 or 4 Unit Apartments | 285 | 1.8% |
| 5 to 9 Unit Apartments | 667 | 4.2% |
| 10 or more Apartments | 288 | 1.8% |
| Mobile Home / Other | 3,146 | 19.9% |
| Total | 15,800 | 100.0% |
Housing Structures by Occupancy in Tazewell County
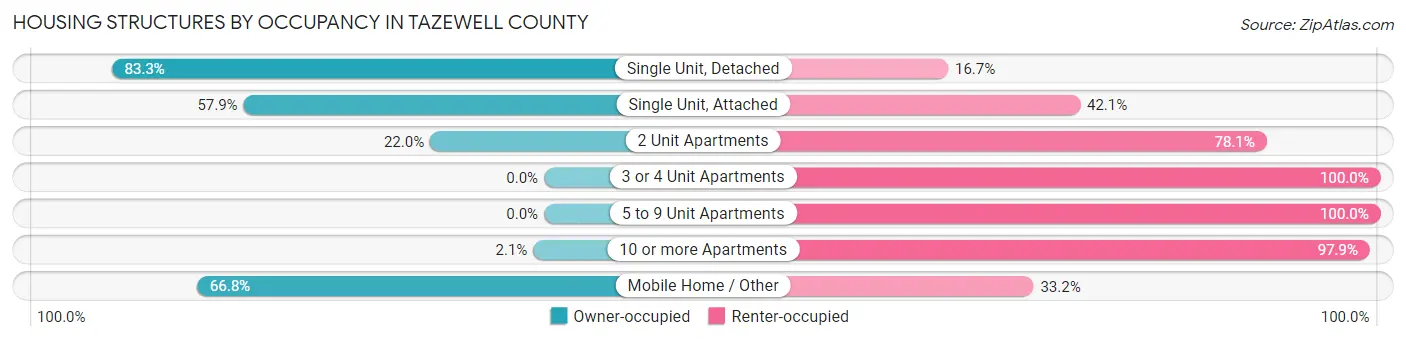
| Structure Type | Owner-occupied | Renter-occupied |
| Single Unit, Detached | 9,251 (83.3%) | 1,859 (16.7%) |
| Single Unit, Attached | 81 (57.9%) | 59 (42.1%) |
| 2 Unit Apartments | 36 (22.0%) | 128 (78.0%) |
| 3 or 4 Unit Apartments | 0 (0.0%) | 285 (100.0%) |
| 5 to 9 Unit Apartments | 0 (0.0%) | 667 (100.0%) |
| 10 or more Apartments | 6 (2.1%) | 282 (97.9%) |
| Mobile Home / Other | 2,102 (66.8%) | 1,044 (33.2%) |
| Total | 11,476 (72.6%) | 4,324 (27.4%) |
Housing Structures by Number of Rooms in Tazewell County
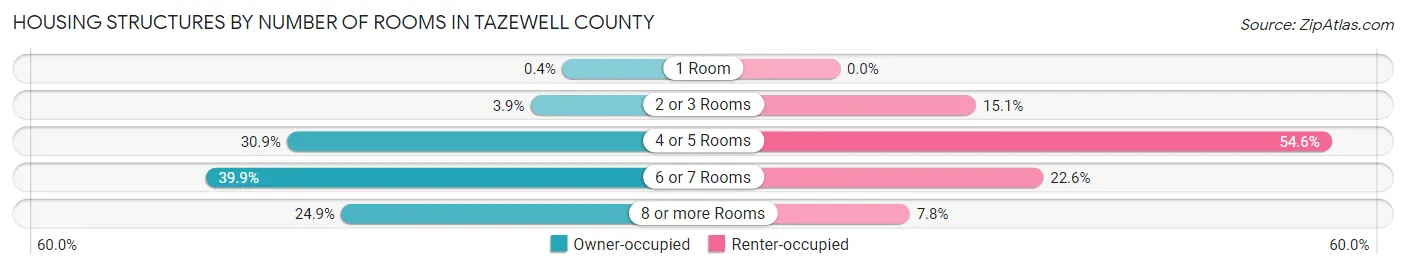
| Number of Rooms | Owner-occupied | Renter-occupied |
| 1 Room | 46 (0.4%) | 0 (0.0%) |
| 2 or 3 Rooms | 445 (3.9%) | 654 (15.1%) |
| 4 or 5 Rooms | 3,547 (30.9%) | 2,359 (54.6%) |
| 6 or 7 Rooms | 4,581 (39.9%) | 976 (22.6%) |
| 8 or more Rooms | 2,857 (24.9%) | 335 (7.7%) |
| Total | 11,476 (100.0%) | 4,324 (100.0%) |
Housing Structure by Heating Type in Tazewell County
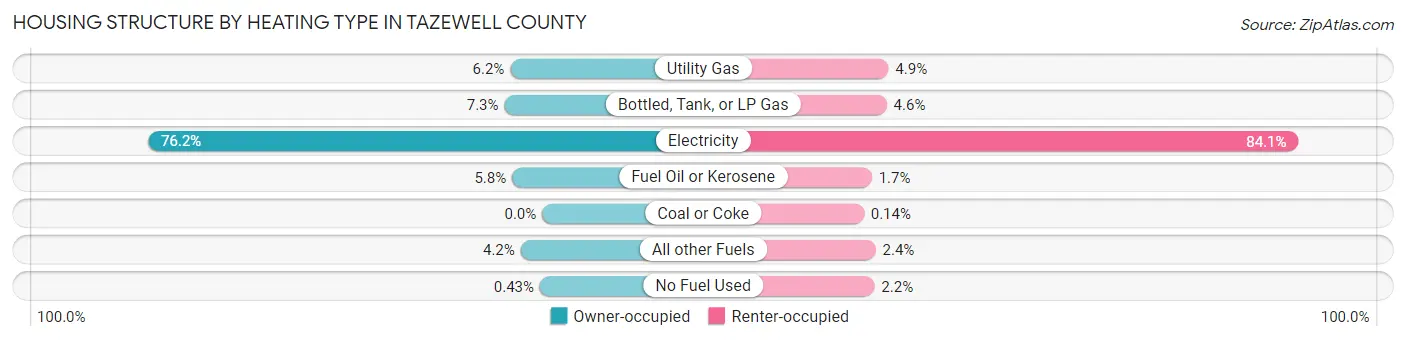
| Heating Type | Owner-occupied | Renter-occupied |
| Utility Gas | 707 (6.2%) | 212 (4.9%) |
| Bottled, Tank, or LP Gas | 837 (7.3%) | 197 (4.6%) |
| Electricity | 8,740 (76.2%) | 3,637 (84.1%) |
| Fuel Oil or Kerosene | 667 (5.8%) | 72 (1.7%) |
| Coal or Coke | 0 (0.0%) | 6 (0.1%) |
| All other Fuels | 476 (4.2%) | 105 (2.4%) |
| No Fuel Used | 49 (0.4%) | 95 (2.2%) |
| Total | 11,476 (100.0%) | 4,324 (100.0%) |
Household Vehicle Usage in Tazewell County
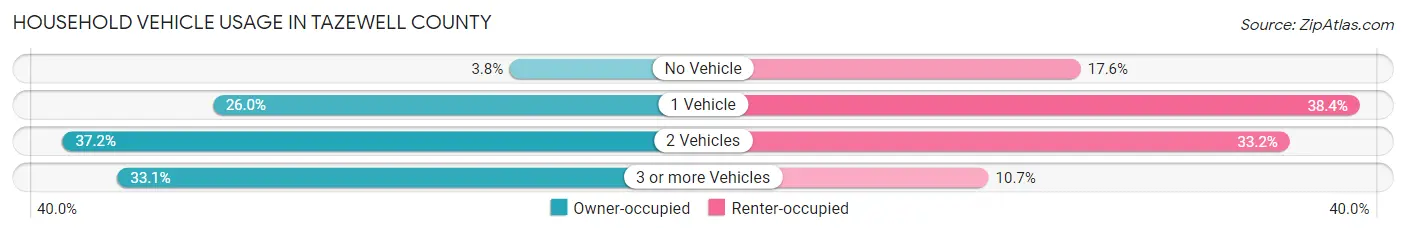
| Vehicles per Household | Owner-occupied | Renter-occupied |
| No Vehicle | 438 (3.8%) | 762 (17.6%) |
| 1 Vehicle | 2,978 (26.0%) | 1,662 (38.4%) |
| 2 Vehicles | 4,265 (37.2%) | 1,436 (33.2%) |
| 3 or more Vehicles | 3,795 (33.1%) | 464 (10.7%) |
| Total | 11,476 (100.0%) | 4,324 (100.0%) |
Real Estate & Mortgages in Tazewell County
Real Estate and Mortgage Overview in Tazewell County
| Characteristic | Without Mortgage | With Mortgage |
| Housing Units | 7,159 | 4,317 |
| Median Property Value | $99,600 | $131,400 |
| Median Household Income | $44,599 | $488 |
| Monthly Housing Costs | $377 | $48 |
| Real Estate Taxes | $643 | $137 |
Property Value by Mortgage Status in Tazewell County
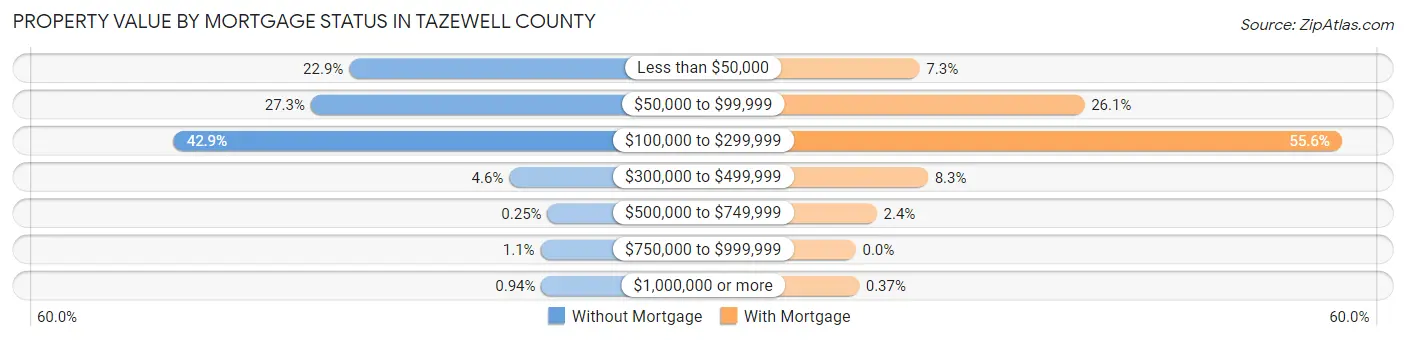
| Property Value | Without Mortgage | With Mortgage |
| Less than $50,000 | 1,640 (22.9%) | 315 (7.3%) |
| $50,000 to $99,999 | 1,954 (27.3%) | 1,128 (26.1%) |
| $100,000 to $299,999 | 3,074 (42.9%) | 2,398 (55.5%) |
| $300,000 to $499,999 | 331 (4.6%) | 356 (8.3%) |
| $500,000 to $749,999 | 18 (0.3%) | 104 (2.4%) |
| $750,000 to $999,999 | 75 (1.1%) | 0 (0.0%) |
| $1,000,000 or more | 67 (0.9%) | 16 (0.4%) |
| Total | 7,159 (100.0%) | 4,317 (100.0%) |
Household Income by Mortgage Status in Tazewell County
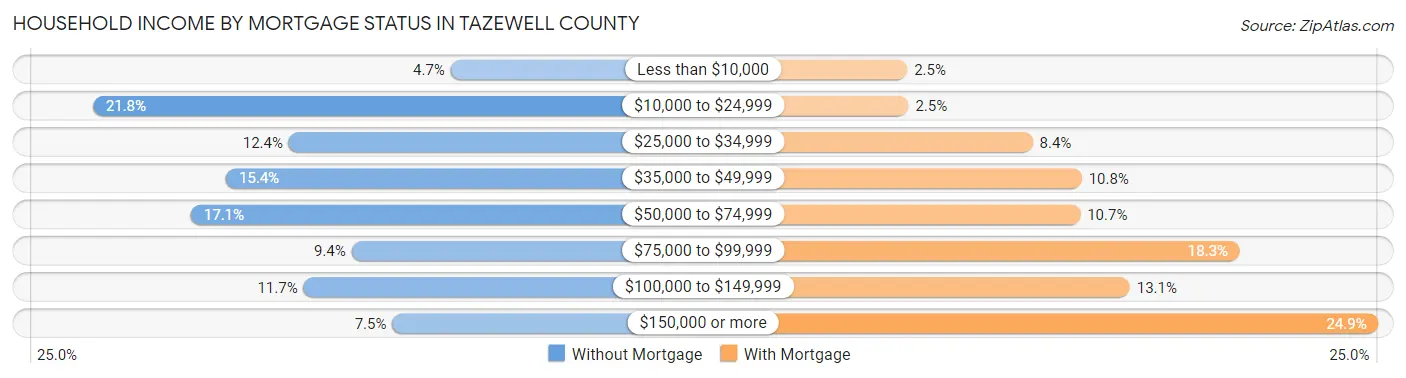
| Household Income | Without Mortgage | With Mortgage |
| Less than $10,000 | 337 (4.7%) | 106 (2.5%) |
| $10,000 to $24,999 | 1,557 (21.7%) | 109 (2.5%) |
| $25,000 to $34,999 | 889 (12.4%) | 364 (8.4%) |
| $35,000 to $49,999 | 1,103 (15.4%) | 465 (10.8%) |
| $50,000 to $74,999 | 1,223 (17.1%) | 462 (10.7%) |
| $75,000 to $99,999 | 675 (9.4%) | 790 (18.3%) |
| $100,000 to $149,999 | 839 (11.7%) | 564 (13.1%) |
| $150,000 or more | 536 (7.5%) | 1,075 (24.9%) |
| Total | 7,159 (100.0%) | 4,317 (100.0%) |
Property Value to Household Income Ratio in Tazewell County
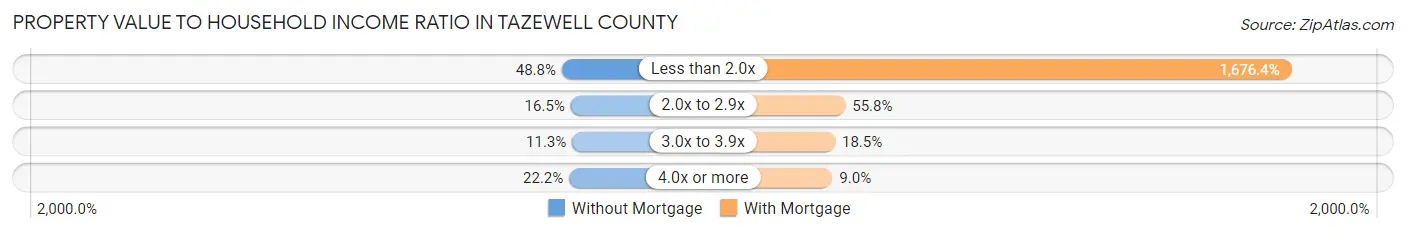
| Value-to-Income Ratio | Without Mortgage | With Mortgage |
| Less than 2.0x | 3,490 (48.7%) | 72,368 (1,676.4%) |
| 2.0x to 2.9x | 1,184 (16.5%) | 2,409 (55.8%) |
| 3.0x to 3.9x | 808 (11.3%) | 798 (18.5%) |
| 4.0x or more | 1,591 (22.2%) | 387 (9.0%) |
| Total | 7,159 (100.0%) | 4,317 (100.0%) |
Real Estate Taxes by Mortgage Status in Tazewell County

| Property Taxes | Without Mortgage | With Mortgage |
| Less than $800 | 4,495 (62.8%) | 72 (1.7%) |
| $800 to $1,499 | 1,510 (21.1%) | 1,944 (45.0%) |
| $800 to $1,499 | 859 (12.0%) | 1,504 (34.8%) |
| Total | 7,159 (100.0%) | 4,317 (100.0%) |
Health & Disability in Tazewell County
Health Insurance Coverage by Age in Tazewell County
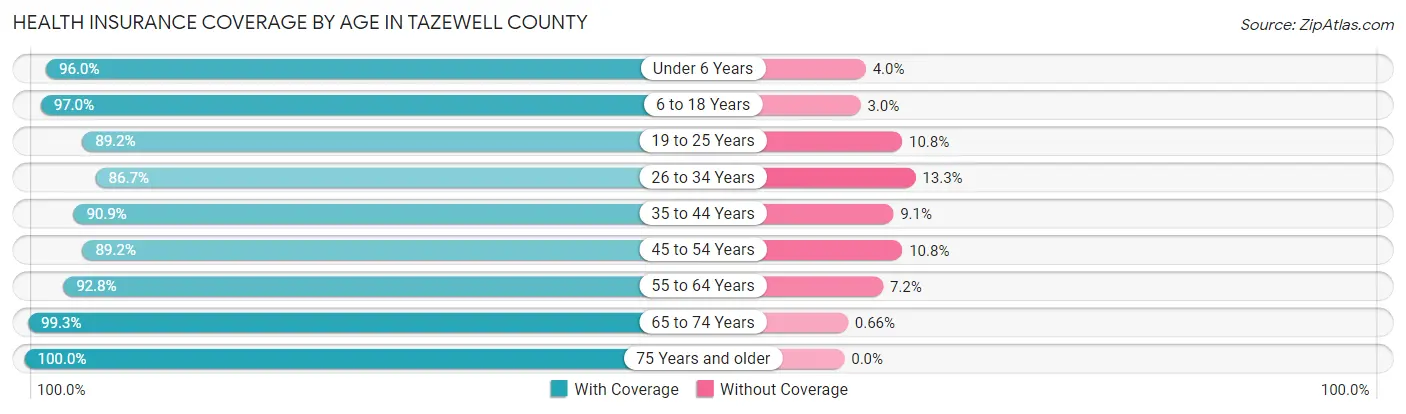
| Age Bracket | With Coverage | Without Coverage |
| Under 6 Years | 2,184 (96.0%) | 91 (4.0%) |
| 6 to 18 Years | 5,969 (97.0%) | 186 (3.0%) |
| 19 to 25 Years | 2,751 (89.2%) | 332 (10.8%) |
| 26 to 34 Years | 3,226 (86.7%) | 493 (13.3%) |
| 35 to 44 Years | 4,055 (90.9%) | 407 (9.1%) |
| 45 to 54 Years | 4,271 (89.2%) | 517 (10.8%) |
| 55 to 64 Years | 5,210 (92.8%) | 405 (7.2%) |
| 65 to 74 Years | 5,405 (99.3%) | 36 (0.7%) |
| 75 Years and older | 3,565 (100.0%) | 0 (0.0%) |
| Total | 36,636 (93.7%) | 2,467 (6.3%) |
Health Insurance Coverage by Citizenship Status in Tazewell County

| Citizenship Status | With Coverage | Without Coverage |
| Native Born | 2,184 (96.0%) | 91 (4.0%) |
| Foreign Born, Citizen | 5,969 (97.0%) | 186 (3.0%) |
| Foreign Born, not a Citizen | 2,751 (89.2%) | 332 (10.8%) |
Health Insurance Coverage by Household Income in Tazewell County
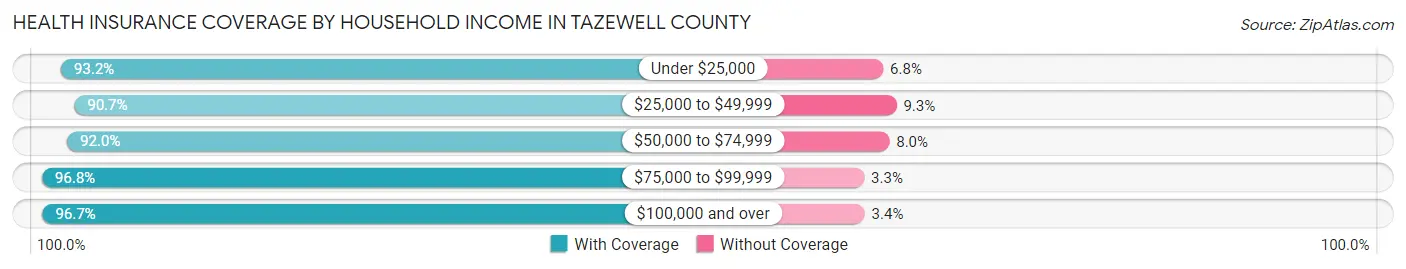
| Household Income | With Coverage | Without Coverage |
| Under $25,000 | 6,490 (93.2%) | 474 (6.8%) |
| $25,000 to $49,999 | 9,103 (90.7%) | 935 (9.3%) |
| $50,000 to $74,999 | 6,371 (92.0%) | 551 (8.0%) |
| $75,000 to $99,999 | 4,377 (96.8%) | 147 (3.3%) |
| $100,000 and over | 10,060 (96.7%) | 349 (3.4%) |
Public vs Private Health Insurance Coverage by Age in Tazewell County
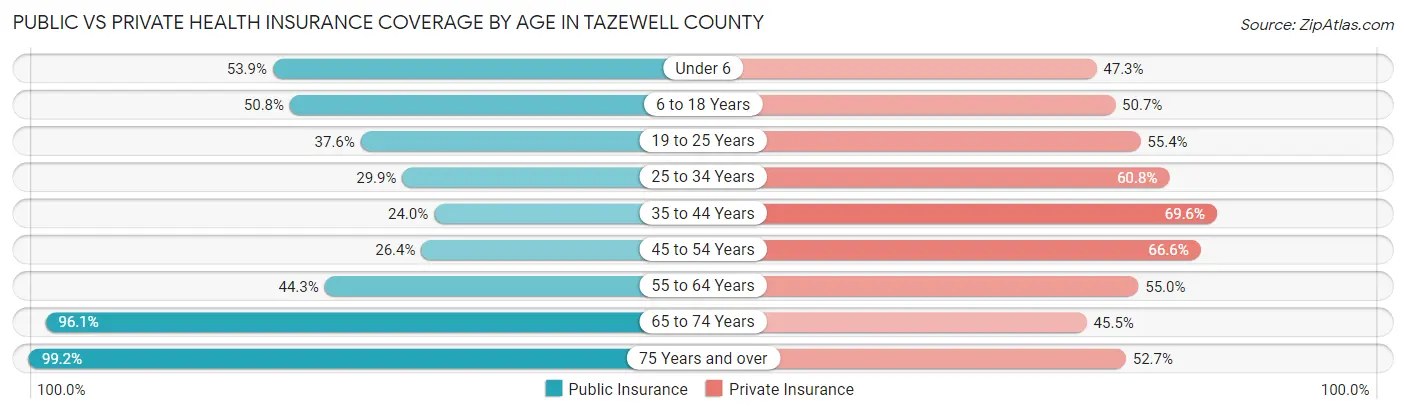
| Age Bracket | Public Insurance | Private Insurance |
| Under 6 | 1,227 (53.9%) | 1,075 (47.2%) |
| 6 to 18 Years | 3,124 (50.8%) | 3,123 (50.7%) |
| 19 to 25 Years | 1,160 (37.6%) | 1,709 (55.4%) |
| 25 to 34 Years | 1,112 (29.9%) | 2,260 (60.8%) |
| 35 to 44 Years | 1,071 (24.0%) | 3,106 (69.6%) |
| 45 to 54 Years | 1,262 (26.4%) | 3,189 (66.6%) |
| 55 to 64 Years | 2,489 (44.3%) | 3,090 (55.0%) |
| 65 to 74 Years | 5,231 (96.1%) | 2,473 (45.5%) |
| 75 Years and over | 3,537 (99.2%) | 1,879 (52.7%) |
| Total | 20,213 (51.7%) | 21,904 (56.0%) |
Disability Status by Sex by Age in Tazewell County
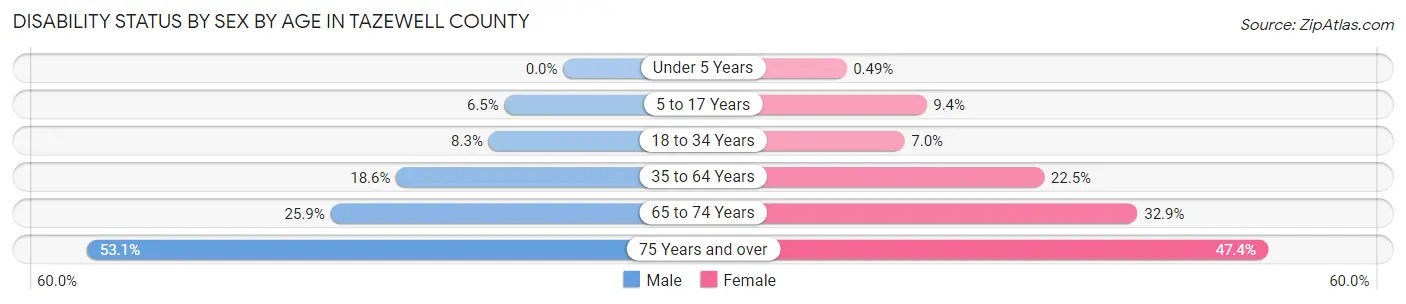
| Age Bracket | Male | Female |
| Under 5 Years | 0 (0.0%) | 5 (0.5%) |
| 5 to 17 Years | 212 (6.5%) | 259 (9.4%) |
| 18 to 34 Years | 301 (8.3%) | 256 (7.0%) |
| 35 to 64 Years | 1,338 (18.6%) | 1,727 (22.5%) |
| 65 to 74 Years | 681 (25.9%) | 926 (32.9%) |
| 75 Years and over | 761 (53.1%) | 1,011 (47.4%) |
Disability Class by Sex by Age in Tazewell County
Disability Class: Hearing Difficulty
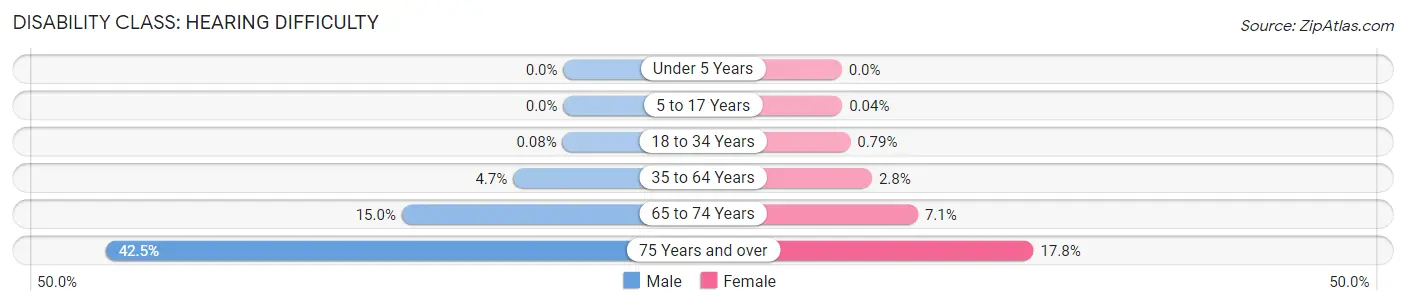
| Age Bracket | Male | Female |
| Under 5 Years | 0 (0.0%) | 0 (0.0%) |
| 5 to 17 Years | 0 (0.0%) | 1 (0.0%) |
| 18 to 34 Years | 3 (0.1%) | 29 (0.8%) |
| 35 to 64 Years | 336 (4.7%) | 215 (2.8%) |
| 65 to 74 Years | 394 (15.0%) | 199 (7.1%) |
| 75 Years and over | 609 (42.5%) | 379 (17.8%) |
Disability Class: Vision Difficulty
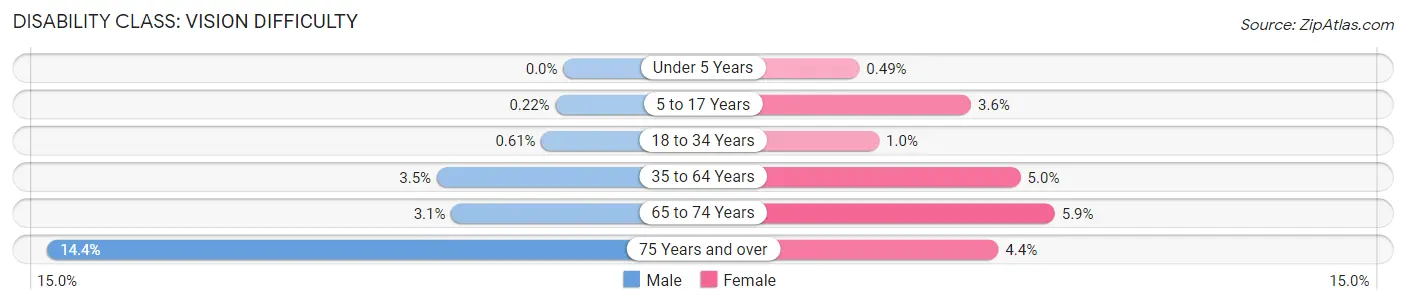
| Age Bracket | Male | Female |
| Under 5 Years | 0 (0.0%) | 5 (0.5%) |
| 5 to 17 Years | 7 (0.2%) | 99 (3.6%) |
| 18 to 34 Years | 22 (0.6%) | 38 (1.0%) |
| 35 to 64 Years | 253 (3.5%) | 382 (5.0%) |
| 65 to 74 Years | 82 (3.1%) | 167 (5.9%) |
| 75 Years and over | 206 (14.4%) | 93 (4.4%) |
Disability Class: Cognitive Difficulty
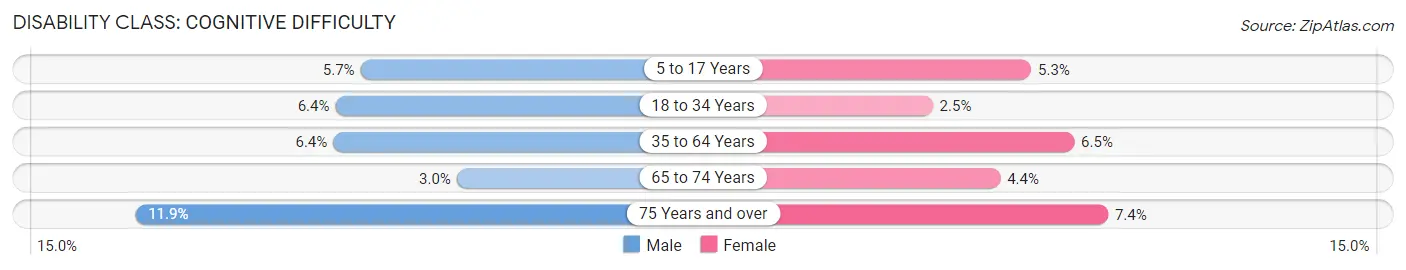
| Age Bracket | Male | Female |
| 5 to 17 Years | 183 (5.7%) | 145 (5.3%) |
| 18 to 34 Years | 230 (6.4%) | 93 (2.5%) |
| 35 to 64 Years | 461 (6.4%) | 496 (6.5%) |
| 65 to 74 Years | 78 (3.0%) | 124 (4.4%) |
| 75 Years and over | 171 (11.9%) | 158 (7.4%) |
Disability Class: Ambulatory Difficulty
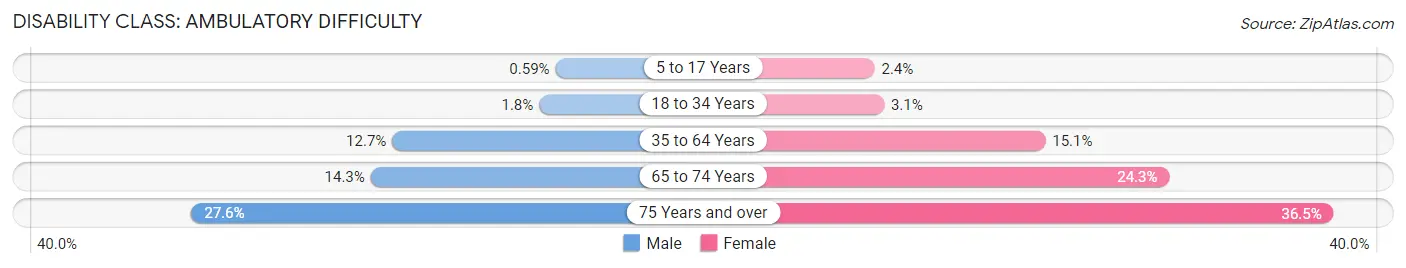
| Age Bracket | Male | Female |
| 5 to 17 Years | 19 (0.6%) | 67 (2.4%) |
| 18 to 34 Years | 65 (1.8%) | 115 (3.1%) |
| 35 to 64 Years | 914 (12.7%) | 1,159 (15.1%) |
| 65 to 74 Years | 376 (14.3%) | 684 (24.3%) |
| 75 Years and over | 396 (27.6%) | 778 (36.5%) |
Disability Class: Self-Care Difficulty
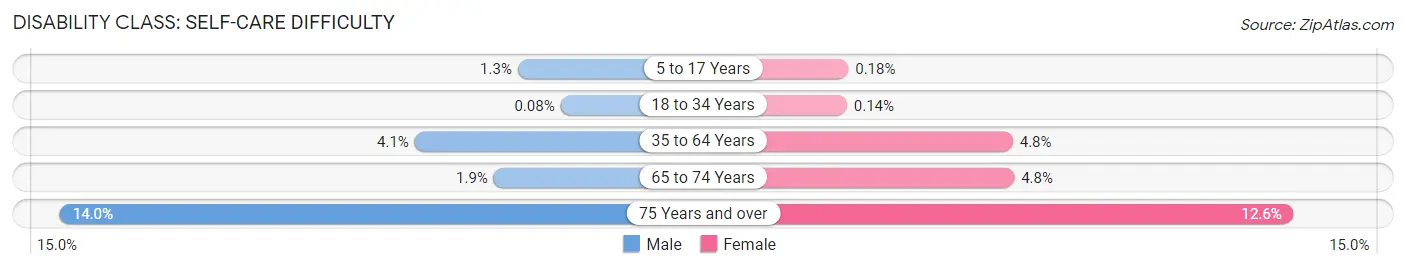
| Age Bracket | Male | Female |
| 5 to 17 Years | 41 (1.3%) | 5 (0.2%) |
| 18 to 34 Years | 3 (0.1%) | 5 (0.1%) |
| 35 to 64 Years | 298 (4.1%) | 365 (4.8%) |
| 65 to 74 Years | 51 (1.9%) | 135 (4.8%) |
| 75 Years and over | 201 (14.0%) | 268 (12.6%) |
Technology Access in Tazewell County
Computing Device Access in Tazewell County
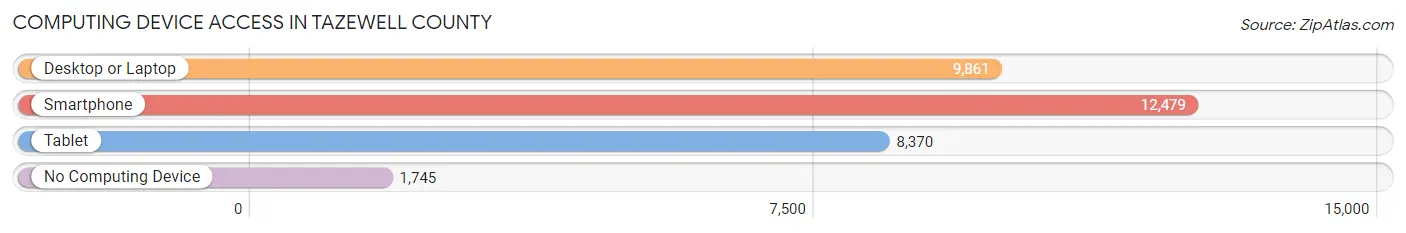
| Device Type | # Households | % Households |
| Desktop or Laptop | 9,861 | 62.4% |
| Smartphone | 12,479 | 79.0% |
| Tablet | 8,370 | 53.0% |
| No Computing Device | 1,745 | 11.0% |
| Total | 15,800 | 100.0% |
Internet Access in Tazewell County
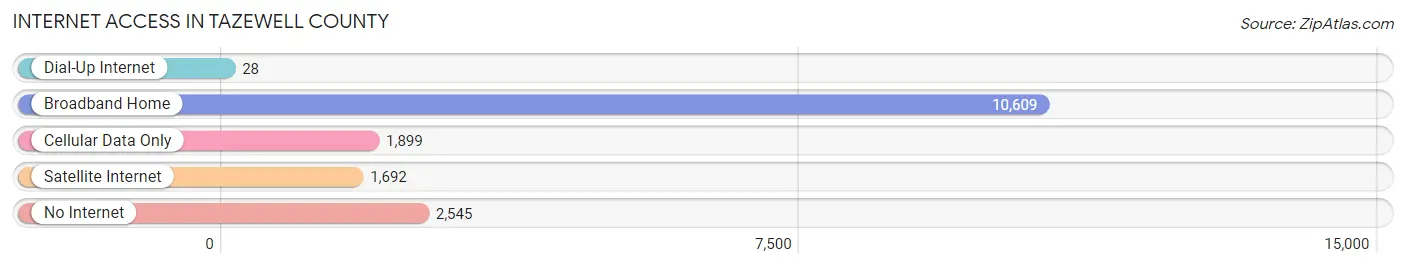
| Internet Type | # Households | % Households |
| Dial-Up Internet | 28 | 0.2% |
| Broadband Home | 10,609 | 67.1% |
| Cellular Data Only | 1,899 | 12.0% |
| Satellite Internet | 1,692 | 10.7% |
| No Internet | 2,545 | 16.1% |
| Total | 15,800 | 100.0% |
Tazewell County Summary
Tazewell County, Virginia is located in the southwestern part of the state and is part of the Appalachian Mountains region. It is bordered by Russell County to the north, Buchanan County to the east, McDowell County, West Virginia to the south, and Wyoming County, West Virginia to the west. The county seat is Tazewell, and the county is named after Henry Tazewell, a U.S. Senator from Virginia.
History
Tazewell County was formed in 1799 from parts of Russell and Wythe counties. The county was named after Henry Tazewell, a U.S. Senator from Virginia. The county was originally part of the Cherokee Nation, and the first European settlers arrived in the area in the late 1700s. The county was home to several Native American tribes, including the Cherokee, Shawnee, and Catawba.
The county was an important center of the coal mining industry in the late 19th and early 20th centuries. The county was also home to several iron furnaces, which were used to produce iron and steel products. The county was also home to several railroads, which connected the county to other parts of Virginia and the rest of the country.
Geography
Tazewell County is located in the southwestern part of Virginia and is part of the Appalachian Mountains region. The county is bordered by Russell County to the north, Buchanan County to the east, McDowell County, West Virginia to the south, and Wyoming County, West Virginia to the west. The county has a total area of 437 square miles, of which 434 square miles is land and 3 square miles is water.
The county is home to several mountain ranges, including the Blue Ridge Mountains, the Allegheny Mountains, and the Appalachian Mountains. The county is also home to several rivers, including the Clinch River, the New River, and the Bluestone River.
Economy
Tazewell County has a diverse economy, with a mix of agriculture, manufacturing, and tourism. The county is home to several large employers, including the Tazewell County Public Schools, the Tazewell County Sheriff's Office, and the Tazewell County Health Department.
Agriculture is an important part of the county's economy, with the county being home to several large farms. The county is also home to several manufacturing companies, including the Tazewell County Manufacturing Company, which produces furniture, and the Tazewell County Textile Company, which produces clothing.
Tourism is also an important part of the county's economy, with the county being home to several popular attractions, including the Tazewell County Museum, the Tazewell County Historical Society, and the Tazewell County Fairgrounds.
Demographics
As of the 2010 census, Tazewell County had a population of 45,078. The racial makeup of the county was 94.3% White, 3.3% Black or African American, 0.3% Native American, 0.3% Asian, 0.1% Pacific Islander, 0.7% from other races, and 1.0% from two or more races. Hispanic or Latino of any race were 1.7% of the population.
The median income for a household in the county was $35,945, and the median income for a family was $41,945. The per capita income for the county was $17,845. About 15.2% of the population was below the poverty line.
Tazewell County is a rural county with a mix of agriculture, manufacturing, and tourism. The county is home to several large employers, and the county's economy is supported by agriculture, manufacturing, and tourism. The county is also home to several popular attractions, and the population is diverse, with a mix of races and ethnicities.
Common Questions
What is Per Capita Income in Tazewell County?
Per Capita income in Tazewell County is $27,327.
What is the Median Family Income in Tazewell County?
Median Family Income in Tazewell County is $59,904.
What is the Median Household income in Tazewell County?
Median Household Income in Tazewell County is $46,508.
What is Income or Wage Gap in Tazewell County?
Income or Wage Gap in Tazewell County is 27.9%.
Women in Tazewell County earn 72.1 cents for every dollar earned by a man.
What is Family Income Deficit in Tazewell County?
Family Income Deficit in Tazewell County is $11,561.
Families that are below poverty line in Tazewell County earn $11,561 less on average than the poverty threshold level.
What is Inequality or Gini Index in Tazewell County?
Inequality or Gini Index in Tazewell County is 0.47.
What is the Total Population of Tazewell County?
Total Population of Tazewell County is 40,392.
What is the Total Male Population of Tazewell County?
Total Male Population of Tazewell County is 20,128.
What is the Total Female Population of Tazewell County?
Total Female Population of Tazewell County is 20,264.
What is the Ratio of Males per 100 Females in Tazewell County?
There are 99.33 Males per 100 Females in Tazewell County.
What is the Ratio of Females per 100 Males in Tazewell County?
There are 100.68 Females per 100 Males in Tazewell County.
What is the Median Population Age in Tazewell County?
Median Population Age in Tazewell County is 44.6 Years.
What is the Average Family Size in Tazewell County
Average Family Size in Tazewell County is 3.0 People.
What is the Average Household Size in Tazewell County
Average Household Size in Tazewell County is 2.5 People.
How Large is the Labor Force in Tazewell County?
There are 15,214 People in the Labor Forcein in Tazewell County.
What is the Percentage of People in the Labor Force in Tazewell County?
45.6% of People are in the Labor Force in Tazewell County.
What is the Unemployment Rate in Tazewell County?
Unemployment Rate in Tazewell County is 5.7%.