Surry County, VA Map & Demographics
Surry County Map
Surry County Overview
$36,497
PER CAPITA INCOME
$85,750
AVG FAMILY INCOME
$68,655
AVG HOUSEHOLD INCOME
43.9%
WAGE / INCOME GAP [ % ]
56.1¢/ $1
WAGE / INCOME GAP [ $ ]
0.42
INEQUALITY / GINI INDEX
6,546
TOTAL POPULATION
3,285
MALE POPULATION
3,261
FEMALE POPULATION
100.74
MALES / 100 FEMALES
99.27
FEMALES / 100 MALES
50.5
MEDIAN AGE
2.9
AVG FAMILY SIZE
2.4
AVG HOUSEHOLD SIZE
3,358
LABOR FORCE [ PEOPLE ]
60.4%
PERCENT IN LABOR FORCE
6.0%
UNEMPLOYMENT RATE
Surry County Area Codes
Income in Surry County
Income Overview in Surry County
Per Capita Income in Surry County is $36,497, while median incomes of families and households are $85,750 and $68,655 respectively.
| Characteristic | Number | Measure |
| Per Capita Income | 6,546 | $36,497 |
| Median Family Income | 1,903 | $85,750 |
| Mean Family Income | 1,903 | $98,082 |
| Median Household Income | 2,745 | $68,655 |
| Mean Household Income | 2,745 | $83,680 |
| Income Deficit | 1,903 | $0 |
| Wage / Income Gap (%) | 6,546 | 43.95% |
| Wage / Income Gap ($) | 6,546 | 56.05¢ per $1 |
| Gini / Inequality Index | 6,546 | 0.42 |
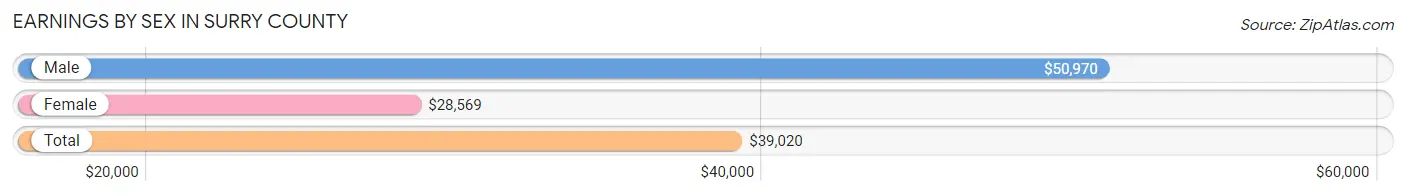
Earnings by Sex in Surry County
Average Earnings in Surry County are $39,020, $50,970 for men and $28,569 for women, a difference of 44.0%.
| Sex | Number | Average Earnings |
| Male | 1,751 (50.4%) | $50,970 |
| Female | 1,725 (49.6%) | $28,569 |
| Total | 3,476 (100.0%) | $39,020 |
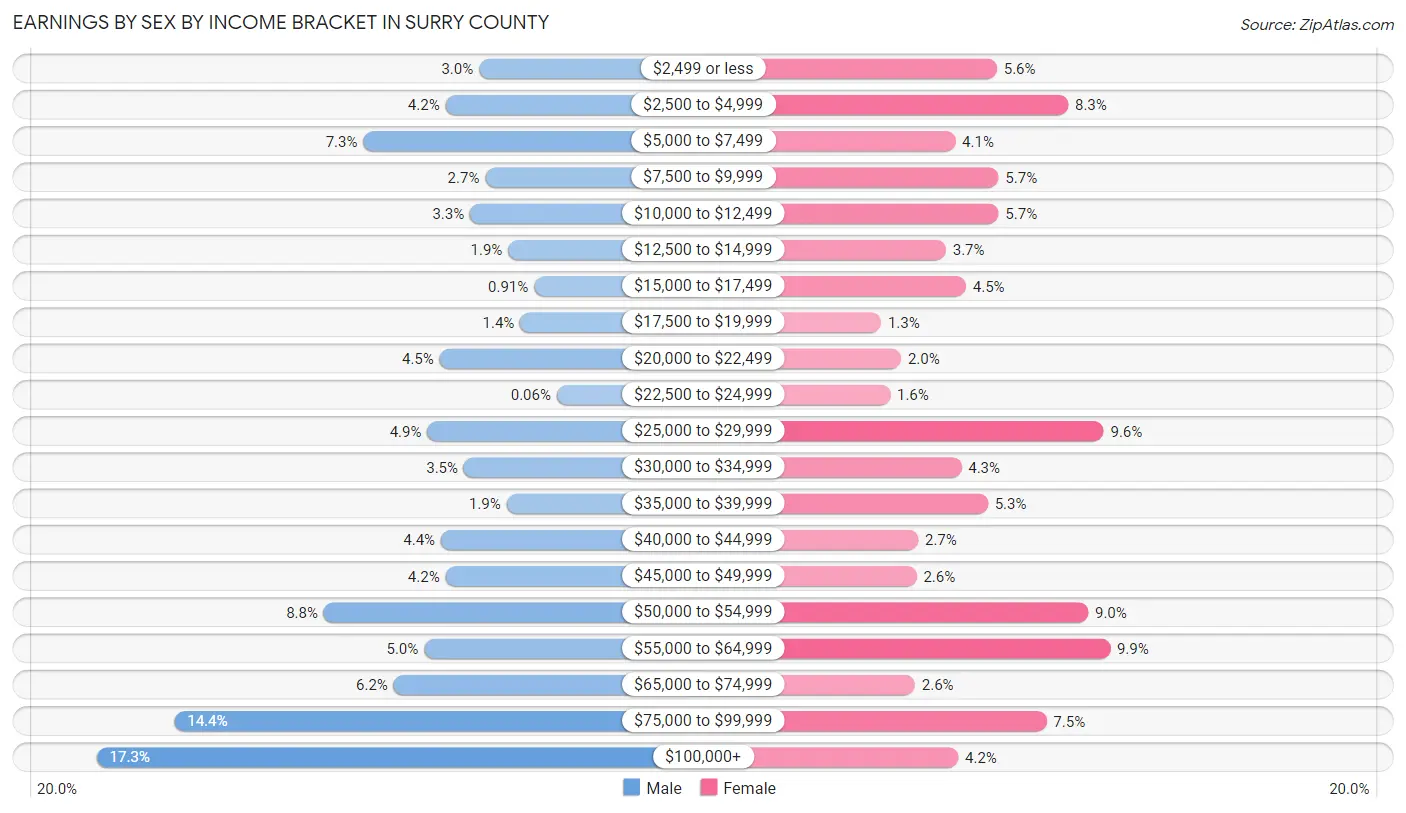
Earnings by Sex by Income Bracket in Surry County
The most common earnings brackets in Surry County are $100,000+ for men (303 | 17.3%) and $55,000 to $64,999 for women (170 | 9.9%).
| Income | Male | Female |
| $2,499 or less | 52 (3.0%) | 97 (5.6%) |
| $2,500 to $4,999 | 74 (4.2%) | 143 (8.3%) |
| $5,000 to $7,499 | 128 (7.3%) | 70 (4.1%) |
| $7,500 to $9,999 | 48 (2.7%) | 98 (5.7%) |
| $10,000 to $12,499 | 58 (3.3%) | 98 (5.7%) |
| $12,500 to $14,999 | 33 (1.9%) | 64 (3.7%) |
| $15,000 to $17,499 | 16 (0.9%) | 77 (4.5%) |
| $17,500 to $19,999 | 25 (1.4%) | 22 (1.3%) |
| $20,000 to $22,499 | 78 (4.4%) | 35 (2.0%) |
| $22,500 to $24,999 | 1 (0.1%) | 28 (1.6%) |
| $25,000 to $29,999 | 86 (4.9%) | 166 (9.6%) |
| $30,000 to $34,999 | 62 (3.5%) | 74 (4.3%) |
| $35,000 to $39,999 | 34 (1.9%) | 91 (5.3%) |
| $40,000 to $44,999 | 77 (4.4%) | 46 (2.7%) |
| $45,000 to $49,999 | 74 (4.2%) | 45 (2.6%) |
| $50,000 to $54,999 | 154 (8.8%) | 156 (9.0%) |
| $55,000 to $64,999 | 88 (5.0%) | 170 (9.9%) |
| $65,000 to $74,999 | 108 (6.2%) | 44 (2.5%) |
| $75,000 to $99,999 | 252 (14.4%) | 129 (7.5%) |
| $100,000+ | 303 (17.3%) | 72 (4.2%) |
| Total | 1,751 (100.0%) | 1,725 (100.0%) |
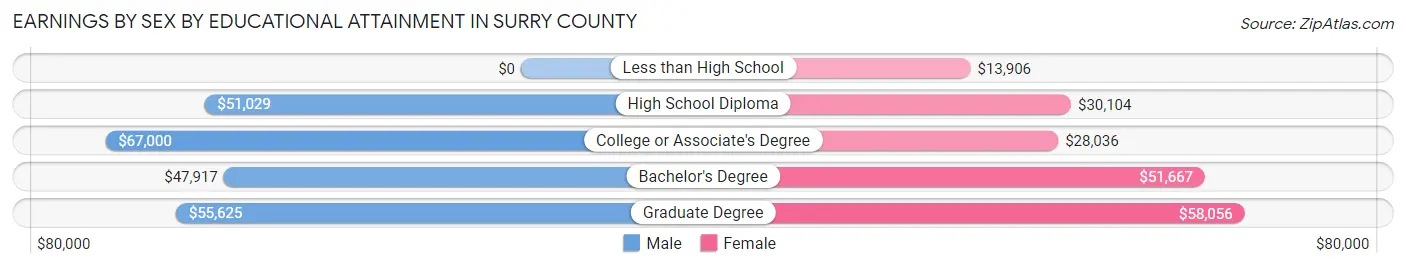
Earnings by Sex by Educational Attainment in Surry County
Average earnings in Surry County are $53,990 for men and $36,348 for women, a difference of 32.7%. Men with an educational attainment of college or associate's degree enjoy the highest average annual earnings of $67,000, while those with bachelor's degree education earn the least with $47,917. Women with an educational attainment of graduate degree earn the most with the average annual earnings of $58,056, while those with less than high school education have the smallest earnings of $13,906.
| Educational Attainment | Male Income | Female Income |
| Less than High School | - | - |
| High School Diploma | $51,029 | $30,104 |
| College or Associate's Degree | $67,000 | $28,036 |
| Bachelor's Degree | $47,917 | $51,667 |
| Graduate Degree | $55,625 | $58,056 |
| Total | $53,990 | $36,348 |
Family Income in Surry County
Family Income Brackets in Surry County
According to the Surry County family income data, there are 383 families falling into the $50,000 to $74,999 income range, which is the most common income bracket and makes up 20.1% of all families. Conversely, the $25,000 to $34,999 income bracket is the least frequent group with only 42 families (2.2%) belonging to this category.
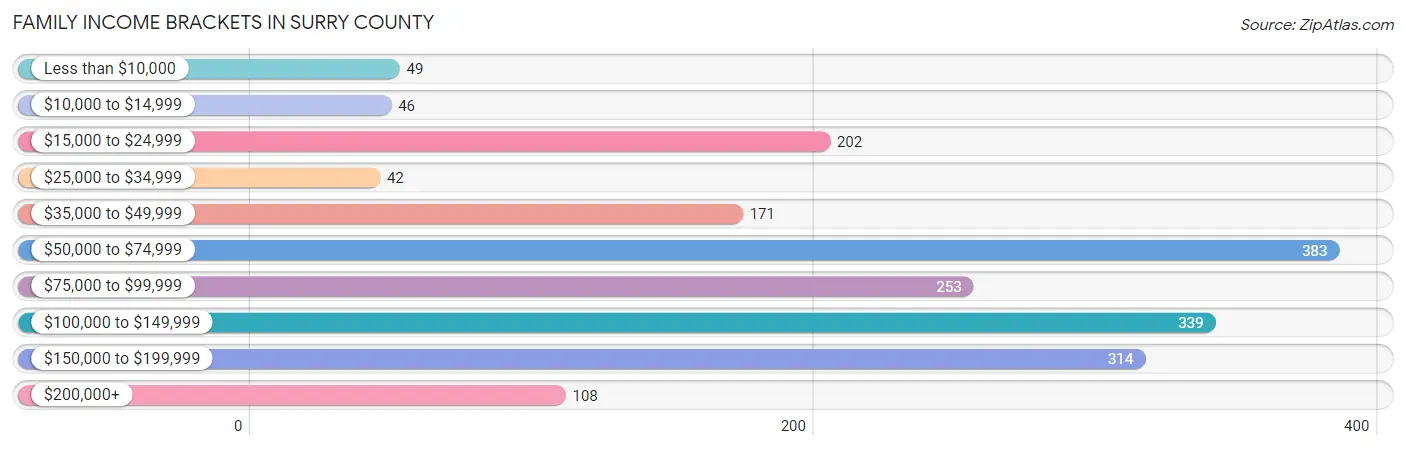
| Income Bracket | # Families | % Families |
| Less than $10,000 | 49 | 2.6% |
| $10,000 to $14,999 | 46 | 2.4% |
| $15,000 to $24,999 | 202 | 10.6% |
| $25,000 to $34,999 | 42 | 2.2% |
| $35,000 to $49,999 | 171 | 9.0% |
| $50,000 to $74,999 | 383 | 20.1% |
| $75,000 to $99,999 | 253 | 13.3% |
| $100,000 to $149,999 | 339 | 17.8% |
| $150,000 to $199,999 | 314 | 16.5% |
| $200,000+ | 108 | 5.7% |
Family Income by Famaliy Size in Surry County
4-person families (245 | 12.9%) account for the highest median family income in Surry County with $100,142 per family, while 2-person families (1,020 | 53.6%) have the highest median income of $36,938 per family member.
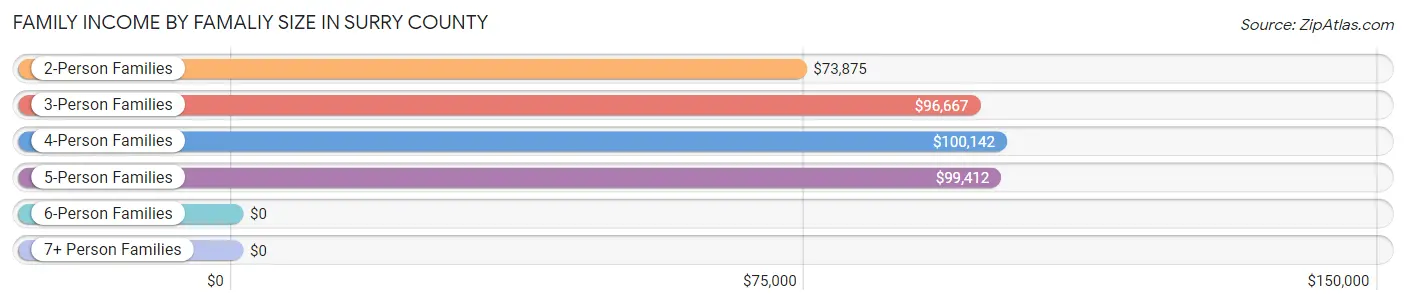
| Income Bracket | # Families | Median Income |
| 2-Person Families | 1,020 (53.6%) | $73,875 |
| 3-Person Families | 522 (27.4%) | $96,667 |
| 4-Person Families | 245 (12.9%) | $100,142 |
| 5-Person Families | 74 (3.9%) | $99,412 |
| 6-Person Families | 6 (0.3%) | $0 |
| 7+ Person Families | 36 (1.9%) | $0 |
| Total | 1,903 (100.0%) | $85,750 |
Family Income by Number of Earners in Surry County
The median family income in Surry County is $85,750, with families comprising 3+ earners (186) having the highest median family income of $154,306, while families with 1 earner (475) have the lowest median family income of $43,807, accounting for 9.8% and 25.0% of families, respectively.
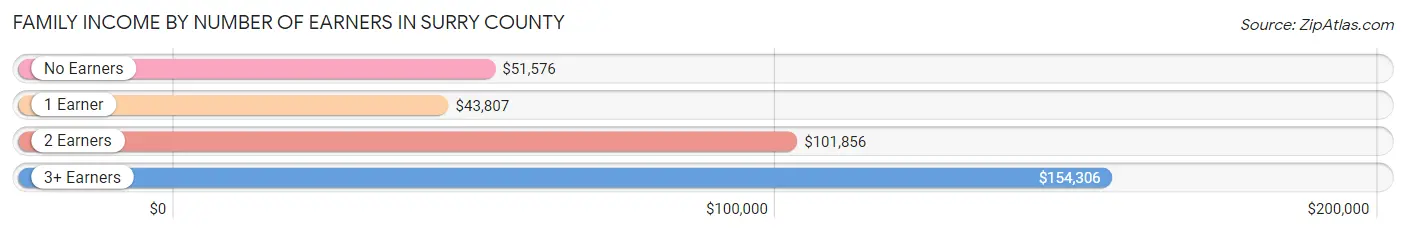
| Number of Earners | # Families | Median Income |
| No Earners | 461 (24.2%) | $51,576 |
| 1 Earner | 475 (25.0%) | $43,807 |
| 2 Earners | 781 (41.0%) | $101,856 |
| 3+ Earners | 186 (9.8%) | $154,306 |
| Total | 1,903 (100.0%) | $85,750 |
Household Income in Surry County
Household Income Brackets in Surry County
With 505 households falling in the category, the $100,000 to $149,999 income range is the most frequent in Surry County, accounting for 18.4% of all households. In contrast, only 88 households (3.2%) fall into the less than $10,000 income bracket, making it the least populous group.
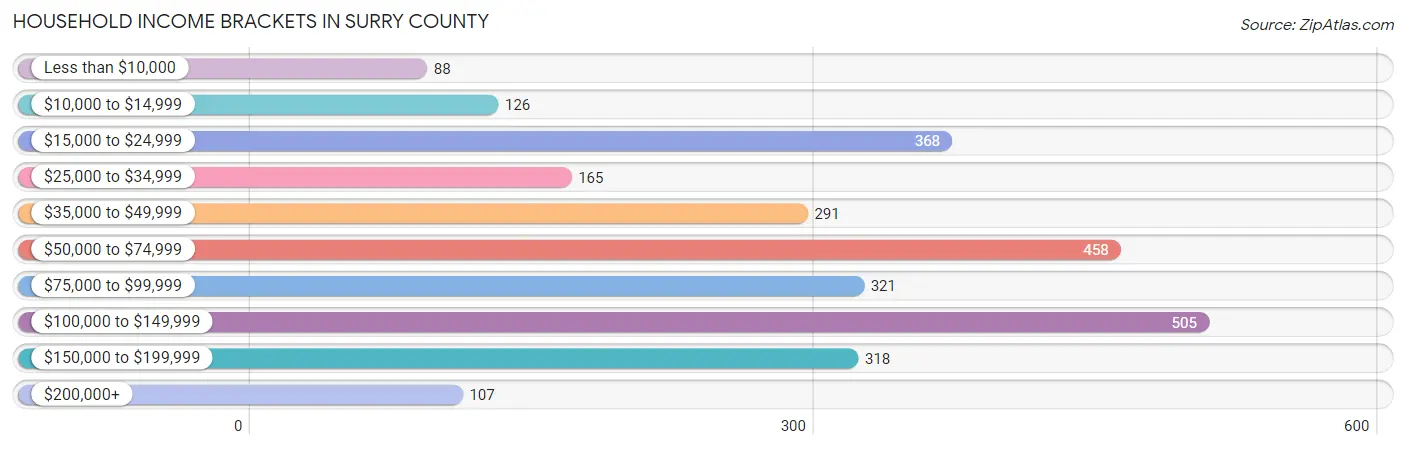
| Income Bracket | # Households | % Households |
| Less than $10,000 | 88 | 3.2% |
| $10,000 to $14,999 | 126 | 4.6% |
| $15,000 to $24,999 | 368 | 13.4% |
| $25,000 to $34,999 | 165 | 6.0% |
| $35,000 to $49,999 | 291 | 10.6% |
| $50,000 to $74,999 | 458 | 16.7% |
| $75,000 to $99,999 | 321 | 11.7% |
| $100,000 to $149,999 | 505 | 18.4% |
| $150,000 to $199,999 | 318 | 11.6% |
| $200,000+ | 107 | 3.9% |
Household Income by Householder Age in Surry County
The median household income in Surry County is $68,655, with the highest median household income of $100,198 found in the 25 to 44 years age bracket for the primary householder. A total of 546 households (19.9%) fall into this category. Meanwhile, the 15 to 24 years age bracket for the primary householder has the lowest median household income of $0, with 63 households (2.3%) in this group.
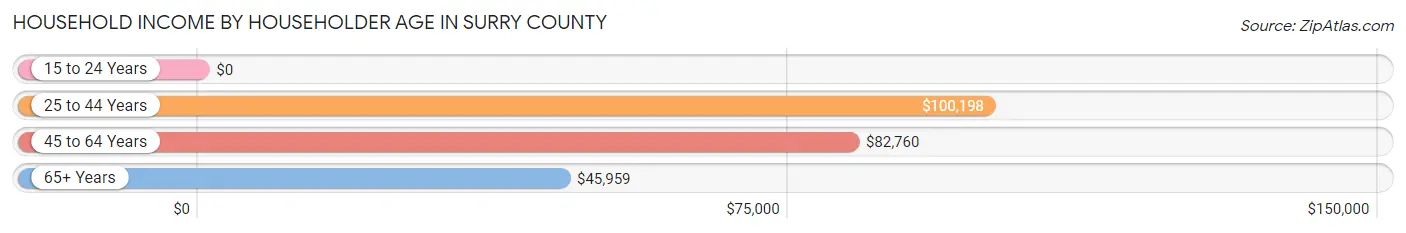
| Income Bracket | # Households | Median Income |
| 15 to 24 Years | 63 (2.3%) | $0 |
| 25 to 44 Years | 546 (19.9%) | $100,198 |
| 45 to 64 Years | 1,121 (40.8%) | $82,760 |
| 65+ Years | 1,015 (37.0%) | $45,959 |
| Total | 2,745 (100.0%) | $68,655 |
Poverty in Surry County
Income Below Poverty by Sex and Age in Surry County
With 10.6% poverty level for males and 16.2% for females among the residents of Surry County, 5 year old males and 5 year old females are the most vulnerable to poverty, with 24 males (42.9%) and 1 females (100.0%) in their respective age groups living below the poverty level.
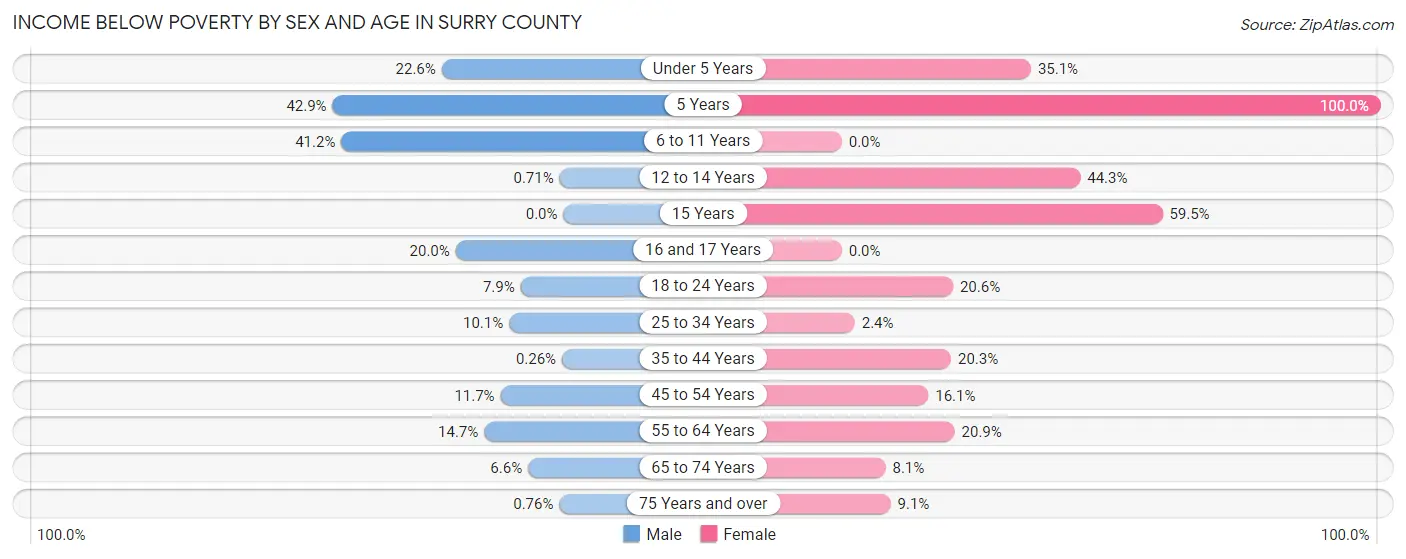
| Age Bracket | Male | Female |
| Under 5 Years | 40 (22.6%) | 46 (35.1%) |
| 5 Years | 24 (42.9%) | 1 (100.0%) |
| 6 to 11 Years | 47 (41.2%) | 0 (0.0%) |
| 12 to 14 Years | 1 (0.7%) | 58 (44.3%) |
| 15 Years | 0 (0.0%) | 25 (59.5%) |
| 16 and 17 Years | 11 (20.0%) | 0 (0.0%) |
| 18 to 24 Years | 15 (7.9%) | 58 (20.6%) |
| 25 to 34 Years | 40 (10.1%) | 7 (2.4%) |
| 35 to 44 Years | 1 (0.3%) | 57 (20.3%) |
| 45 to 54 Years | 39 (11.7%) | 69 (16.1%) |
| 55 to 64 Years | 94 (14.7%) | 133 (20.9%) |
| 65 to 74 Years | 32 (6.6%) | 39 (8.1%) |
| 75 Years and over | 2 (0.8%) | 31 (9.1%) |
| Total | 346 (10.6%) | 524 (16.2%) |
Income Above Poverty by Sex and Age in Surry County
According to the poverty statistics in Surry County, males aged 15 years and females aged 6 to 11 years are the age groups that are most secure financially, with 100.0% of males and 100.0% of females in these age groups living above the poverty line.
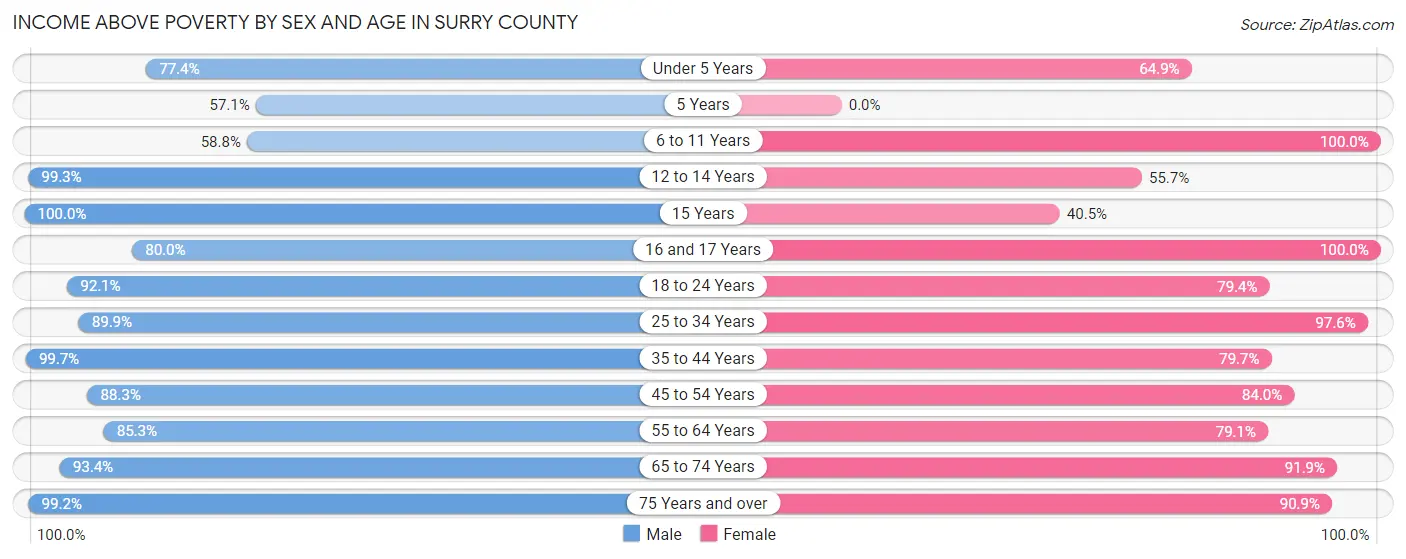
| Age Bracket | Male | Female |
| Under 5 Years | 137 (77.4%) | 85 (64.9%) |
| 5 Years | 32 (57.1%) | 0 (0.0%) |
| 6 to 11 Years | 67 (58.8%) | 130 (100.0%) |
| 12 to 14 Years | 139 (99.3%) | 73 (55.7%) |
| 15 Years | 35 (100.0%) | 17 (40.5%) |
| 16 and 17 Years | 44 (80.0%) | 66 (100.0%) |
| 18 to 24 Years | 174 (92.1%) | 223 (79.4%) |
| 25 to 34 Years | 357 (89.9%) | 283 (97.6%) |
| 35 to 44 Years | 390 (99.7%) | 224 (79.7%) |
| 45 to 54 Years | 295 (88.3%) | 361 (84.0%) |
| 55 to 64 Years | 545 (85.3%) | 502 (79.1%) |
| 65 to 74 Years | 456 (93.4%) | 441 (91.9%) |
| 75 Years and over | 260 (99.2%) | 311 (90.9%) |
| Total | 2,931 (89.4%) | 2,716 (83.8%) |
Income Below Poverty Among Married-Couple Families in Surry County
The poverty statistics for married-couple families in Surry County show that 5.9% or 81 of the total 1,379 families live below the poverty line. Families with no children have the highest poverty rate of 7.6%, comprising of 74 families. On the other hand, families with 5 or more children have the lowest poverty rate of 0.0%, which includes 0 families.
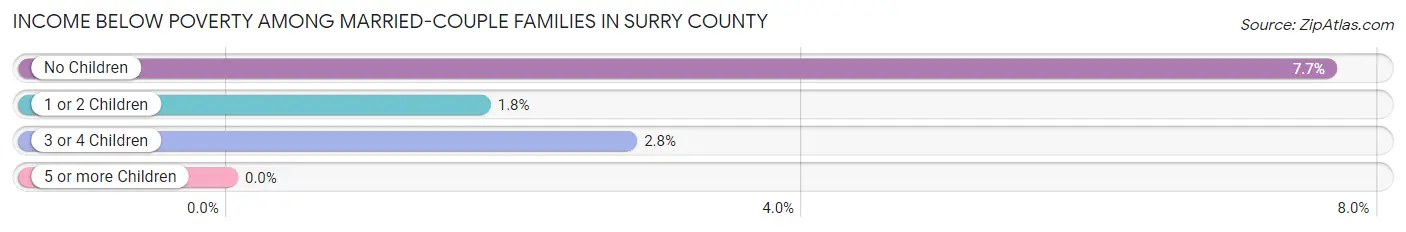
| Children | Above Poverty | Below Poverty |
| No Children | 893 (92.3%) | 74 (7.6%) |
| 1 or 2 Children | 334 (98.2%) | 6 (1.8%) |
| 3 or 4 Children | 35 (97.2%) | 1 (2.8%) |
| 5 or more Children | 36 (100.0%) | 0 (0.0%) |
| Total | 1,298 (94.1%) | 81 (5.9%) |
Income Below Poverty Among Single-Parent Households in Surry County
According to the poverty data in Surry County, 1.1% or 1 single-father households and 27.9% or 122 single-mother households are living below the poverty line. Among single-father households, those with no children have the highest poverty rate, with 1 households (1.9%) experiencing poverty. Likewise, among single-mother households, those with 1 or 2 children have the highest poverty rate, with 106 households (44.7%) falling below the poverty line.
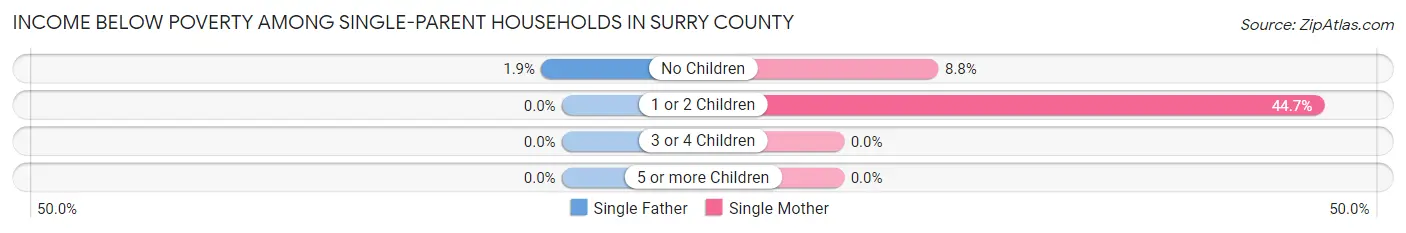
| Children | Single Father | Single Mother |
| No Children | 1 (1.9%) | 16 (8.8%) |
| 1 or 2 Children | 0 (0.0%) | 106 (44.7%) |
| 3 or 4 Children | 0 (0.0%) | 0 (0.0%) |
| 5 or more Children | 0 (0.0%) | 0 (0.0%) |
| Total | 1 (1.1%) | 122 (27.9%) |
Income Below Poverty Among Married-Couple vs Single-Parent Households in Surry County
The poverty data for Surry County shows that 81 of the married-couple family households (5.9%) and 123 of the single-parent households (23.5%) are living below the poverty level. Within the married-couple family households, those with no children have the highest poverty rate, with 74 households (7.6%) falling below the poverty line. Among the single-parent households, those with 1 or 2 children have the highest poverty rate, with 106 household (39.3%) living below poverty.
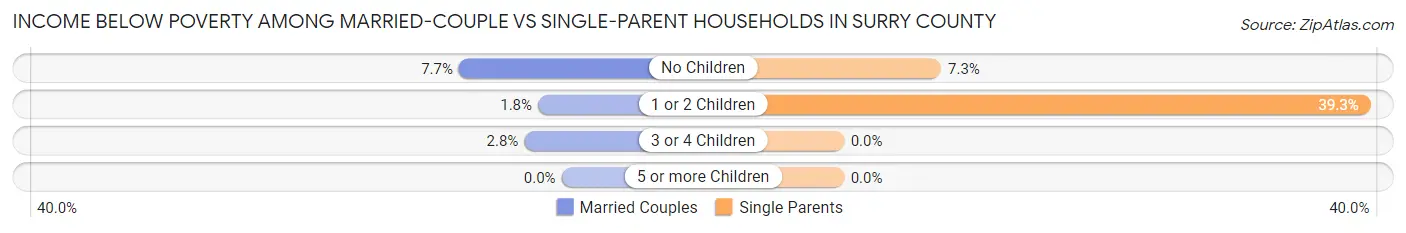
| Children | Married-Couple Families | Single-Parent Households |
| No Children | 74 (7.6%) | 17 (7.3%) |
| 1 or 2 Children | 6 (1.8%) | 106 (39.3%) |
| 3 or 4 Children | 1 (2.8%) | 0 (0.0%) |
| 5 or more Children | 0 (0.0%) | 0 (0.0%) |
| Total | 81 (5.9%) | 123 (23.5%) |
Race in Surry County
The most populous races in Surry County are White / Caucasian (3,622 | 55.3%), Black / African American (2,728 | 41.7%), and Hispanic or Latino (185 | 2.8%).
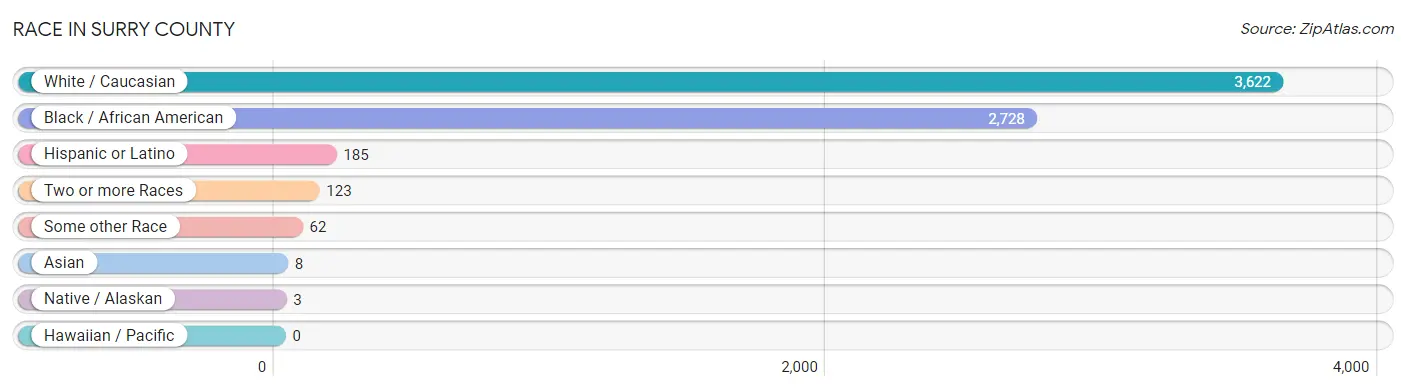
| Race | # Population | % Population |
| Asian | 8 | 0.1% |
| Black / African American | 2,728 | 41.7% |
| Hawaiian / Pacific | 0 | 0.0% |
| Hispanic or Latino | 185 | 2.8% |
| Native / Alaskan | 3 | 0.1% |
| White / Caucasian | 3,622 | 55.3% |
| Two or more Races | 123 | 1.9% |
| Some other Race | 62 | 0.9% |
| Total | 6,546 | 100.0% |
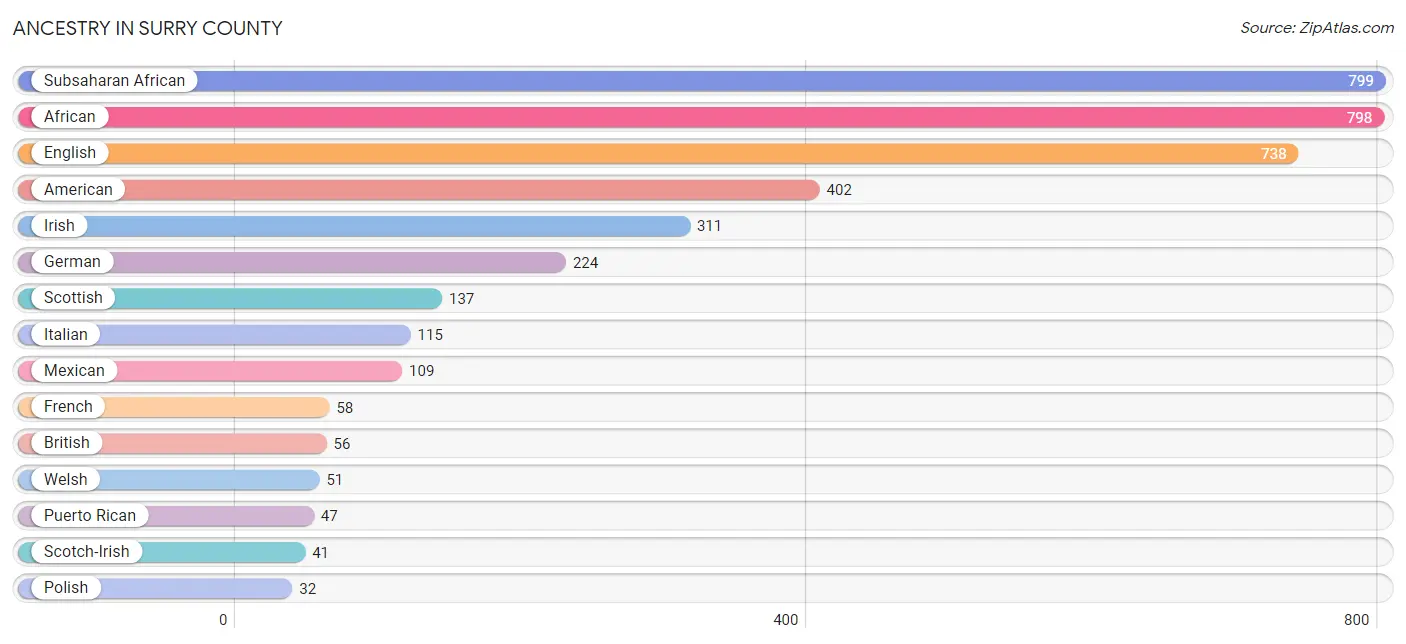
Ancestry in Surry County
The most populous ancestries reported in Surry County are Subsaharan African (799 | 12.2%), African (798 | 12.2%), English (738 | 11.3%), American (402 | 6.1%), and Irish (311 | 4.8%), together accounting for 46.6% of all Surry County residents.
| Ancestry | # Population | % Population |
| African | 798 | 12.2% |
| American | 402 | 6.1% |
| Armenian | 11 | 0.2% |
| Austrian | 29 | 0.4% |
| Blackfeet | 18 | 0.3% |
| British | 56 | 0.9% |
| Burmese | 2 | 0.0% |
| Canadian | 8 | 0.1% |
| Cherokee | 27 | 0.4% |
| Danish | 3 | 0.1% |
| Dutch | 19 | 0.3% |
| Eastern European | 2 | 0.0% |
| Ecuadorian | 1 | 0.0% |
| English | 738 | 11.3% |
| European | 25 | 0.4% |
| Finnish | 17 | 0.3% |
| French | 58 | 0.9% |
| German | 224 | 3.4% |
| Indian (Asian) | 8 | 0.1% |
| Irish | 311 | 4.8% |
| Italian | 115 | 1.8% |
| Korean | 1 | 0.0% |
| Lithuanian | 1 | 0.0% |
| Mexican | 109 | 1.7% |
| Native Hawaiian | 16 | 0.2% |
| Nigerian | 1 | 0.0% |
| Norwegian | 8 | 0.1% |
| Polish | 32 | 0.5% |
| Puerto Rican | 47 | 0.7% |
| Russian | 15 | 0.2% |
| Scotch-Irish | 41 | 0.6% |
| Scottish | 137 | 2.1% |
| South American | 1 | 0.0% |
| Spaniard | 26 | 0.4% |
| Subsaharan African | 799 | 12.2% |
| Swedish | 14 | 0.2% |
| Welsh | 51 | 0.8% | View All 37 Rows |
Immigrants in Surry County
The most numerous immigrant groups reported in Surry County came from Europe (79 | 1.2%), England (39 | 0.6%), Northern Europe (39 | 0.6%), Germany (30 | 0.5%), and Western Europe (30 | 0.5%), together accounting for 3.3% of all Surry County residents.
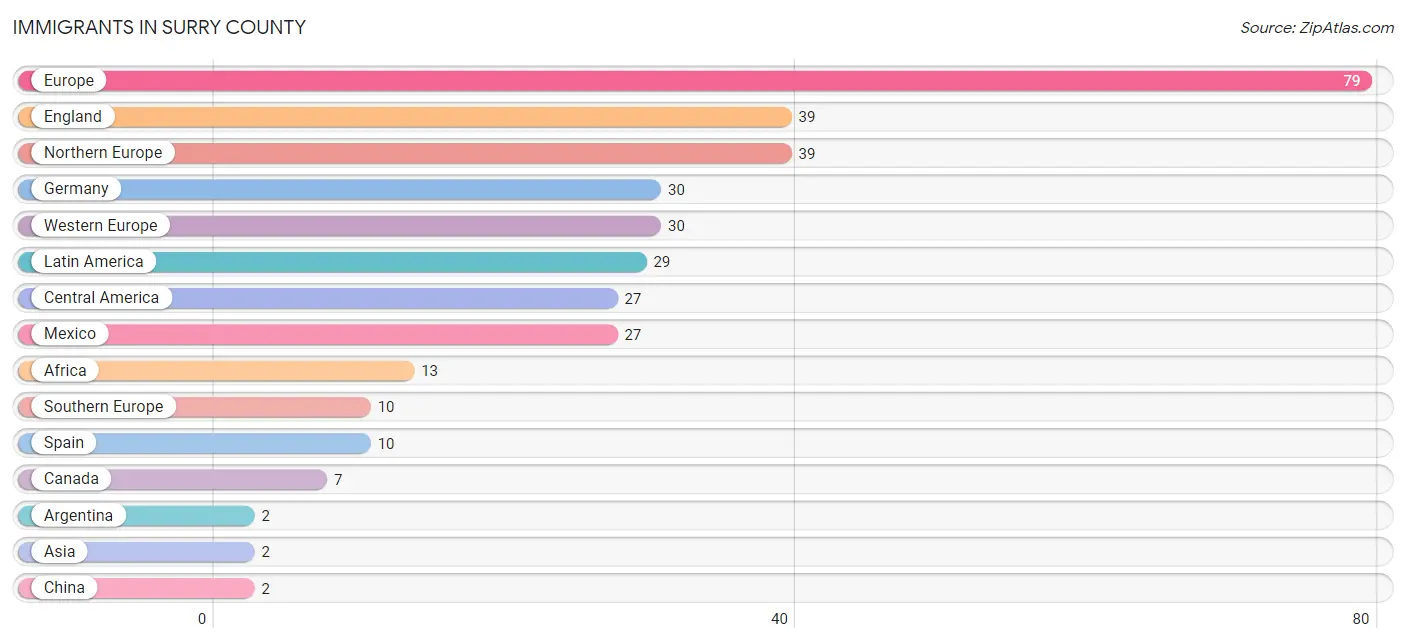
| Immigration Origin | # Population | % Population |
| Africa | 13 | 0.2% |
| Argentina | 2 | 0.0% |
| Asia | 2 | 0.0% |
| Canada | 7 | 0.1% |
| Central America | 27 | 0.4% |
| China | 2 | 0.0% |
| Eastern Asia | 2 | 0.0% |
| England | 39 | 0.6% |
| Europe | 79 | 1.2% |
| Germany | 30 | 0.5% |
| Latin America | 29 | 0.4% |
| Mexico | 27 | 0.4% |
| Northern Europe | 39 | 0.6% |
| South America | 2 | 0.0% |
| Southern Europe | 10 | 0.2% |
| Spain | 10 | 0.2% |
| Western Europe | 30 | 0.5% | View All 17 Rows |
Sex and Age in Surry County
Sex and Age in Surry County
The most populous age groups in Surry County are 60 to 64 Years (419 | 12.8%) for men and 60 to 64 Years (387 | 11.9%) for women.
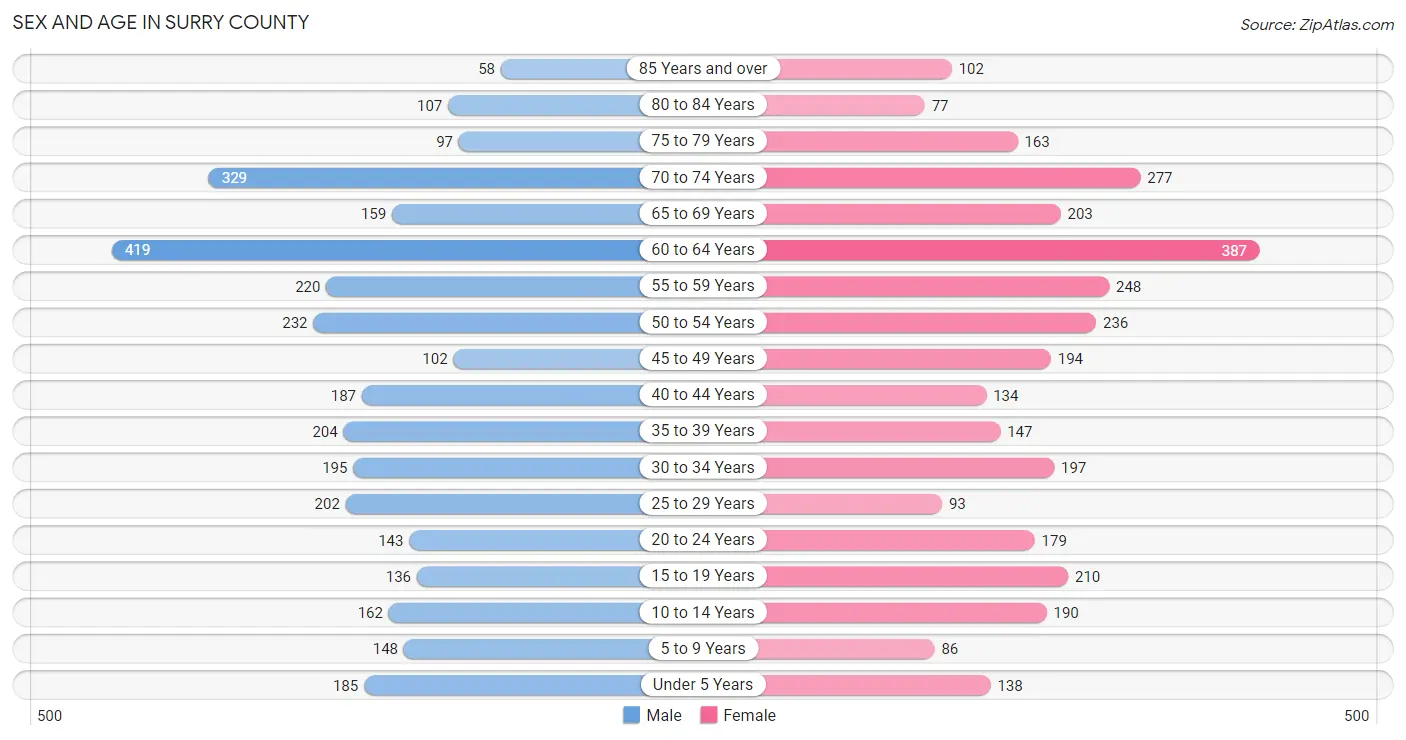
| Age Bracket | Male | Female |
| Under 5 Years | 185 (5.6%) | 138 (4.2%) |
| 5 to 9 Years | 148 (4.5%) | 86 (2.6%) |
| 10 to 14 Years | 162 (4.9%) | 190 (5.8%) |
| 15 to 19 Years | 136 (4.1%) | 210 (6.4%) |
| 20 to 24 Years | 143 (4.3%) | 179 (5.5%) |
| 25 to 29 Years | 202 (6.1%) | 93 (2.9%) |
| 30 to 34 Years | 195 (5.9%) | 197 (6.0%) |
| 35 to 39 Years | 204 (6.2%) | 147 (4.5%) |
| 40 to 44 Years | 187 (5.7%) | 134 (4.1%) |
| 45 to 49 Years | 102 (3.1%) | 194 (5.9%) |
| 50 to 54 Years | 232 (7.1%) | 236 (7.2%) |
| 55 to 59 Years | 220 (6.7%) | 248 (7.6%) |
| 60 to 64 Years | 419 (12.8%) | 387 (11.9%) |
| 65 to 69 Years | 159 (4.8%) | 203 (6.2%) |
| 70 to 74 Years | 329 (10.0%) | 277 (8.5%) |
| 75 to 79 Years | 97 (2.9%) | 163 (5.0%) |
| 80 to 84 Years | 107 (3.3%) | 77 (2.4%) |
| 85 Years and over | 58 (1.8%) | 102 (3.1%) |
| Total | 3,285 (100.0%) | 3,261 (100.0%) |
Families and Households in Surry County
Median Family Size in Surry County
The median family size in Surry County is 2.87 persons per family, with single female/mother families (437 | 23.0%) accounting for the largest median family size of 3.35 persons per family. On the other hand, single male/father families (87 | 4.6%) represent the smallest median family size with 2.13 persons per family.
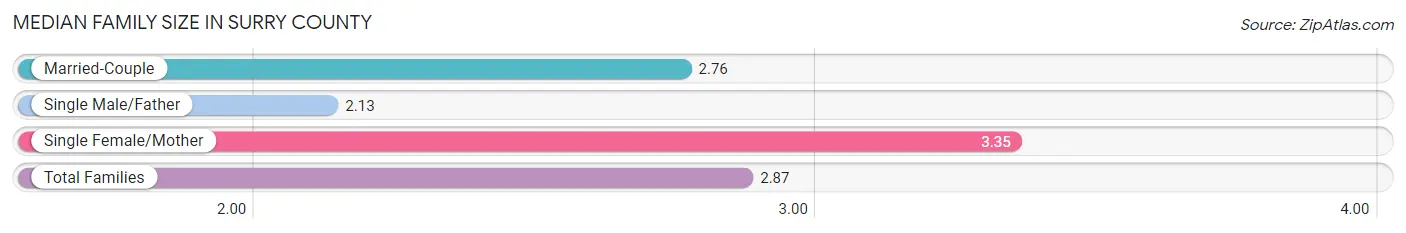
| Family Type | # Families | Family Size |
| Married-Couple | 1,379 (72.5%) | 2.76 |
| Single Male/Father | 87 (4.6%) | 2.13 |
| Single Female/Mother | 437 (23.0%) | 3.35 |
| Total Families | 1,903 (100.0%) | 2.87 |
Median Household Size in Surry County
The median household size in Surry County is 2.38 persons per household, with single female/mother households (437 | 15.9%) accounting for the largest median household size of 3.5 persons per household. non-family households (842 | 30.7%) represent the smallest median household size with 1.18 persons per household.
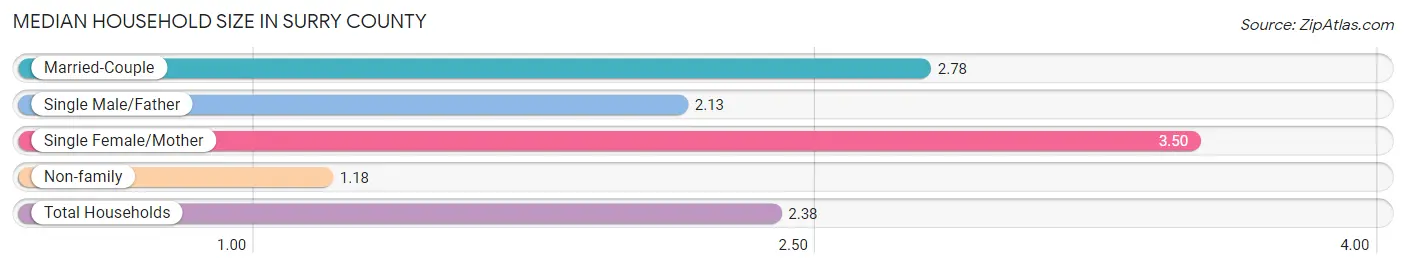
| Household Type | # Households | Household Size |
| Married-Couple | 1,379 (50.2%) | 2.78 |
| Single Male/Father | 87 (3.2%) | 2.13 |
| Single Female/Mother | 437 (15.9%) | 3.50 |
| Non-family | 842 (30.7%) | 1.18 |
| Total Households | 2,745 (100.0%) | 2.38 |
Household Size by Marriage Status in Surry County
Out of a total of 2,745 households in Surry County, 1,903 (69.3%) are family households, while 842 (30.7%) are nonfamily households. The most numerous type of family households are 2-person households, comprising 989, and the most common type of nonfamily households are 1-person households, comprising 741.
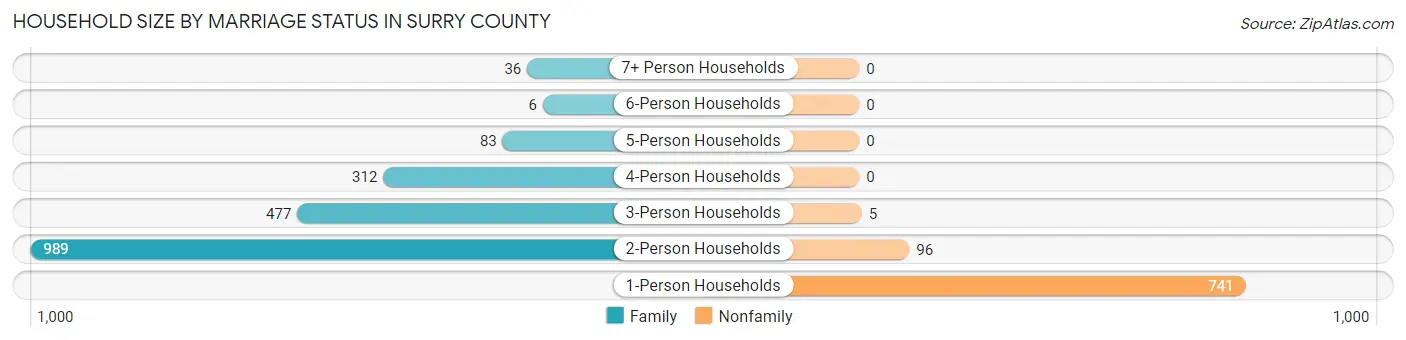
| Household Size | Family Households | Nonfamily Households |
| 1-Person Households | - | 741 (27.0%) |
| 2-Person Households | 989 (36.0%) | 96 (3.5%) |
| 3-Person Households | 477 (17.4%) | 5 (0.2%) |
| 4-Person Households | 312 (11.4%) | 0 (0.0%) |
| 5-Person Households | 83 (3.0%) | 0 (0.0%) |
| 6-Person Households | 6 (0.2%) | 0 (0.0%) |
| 7+ Person Households | 36 (1.3%) | 0 (0.0%) |
| Total | 1,903 (69.3%) | 842 (30.7%) |
Female Fertility in Surry County
Fertility by Age in Surry County
Average fertility rate in Surry County is 68.0 births per 1,000 women. Women in the age bracket of 20 to 34 years have the highest fertility rate with 147.0 births per 1,000 women. Women in the age bracket of 20 to 34 years acount for 86.3% of all women with births.
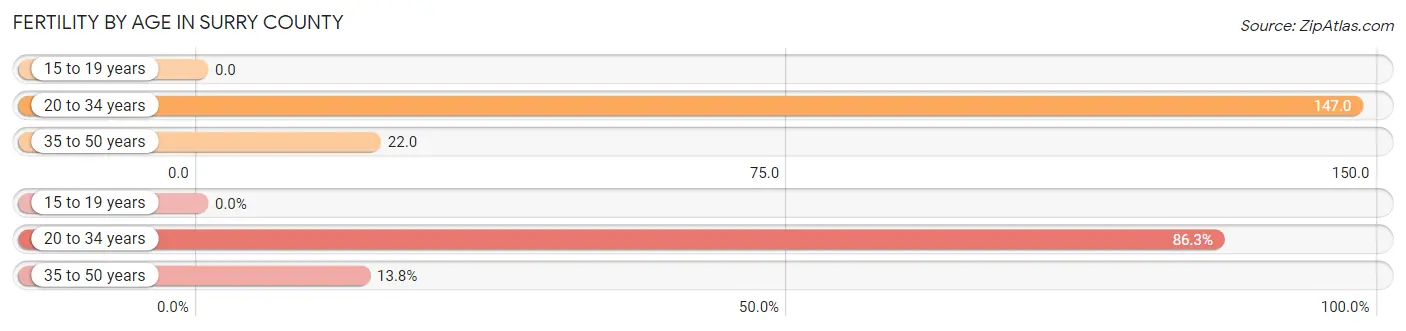
| Age Bracket | Women with Births | Births / 1,000 Women |
| 15 to 19 years | 0 (0.0%) | 0.0 |
| 20 to 34 years | 69 (86.3%) | 147.0 |
| 35 to 50 years | 11 (13.8%) | 22.0 |
| Total | 80 (100.0%) | 68.0 |
Fertility by Age by Marriage Status in Surry County
68.8% of women with births (80) in Surry County are married. The highest percentage of unmarried women with births falls into 20 to 34 years age bracket with 36.2% of them unmarried at the time of birth, while the lowest percentage of unmarried women with births belong to 35 to 50 years age bracket with 0.0% of them unmarried.
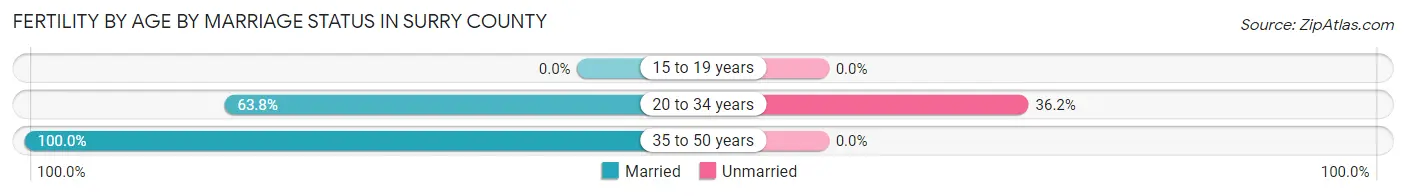
| Age Bracket | Married | Unmarried |
| 15 to 19 years | 0 (0.0%) | 0 (0.0%) |
| 20 to 34 years | 44 (63.8%) | 25 (36.2%) |
| 35 to 50 years | 11 (100.0%) | 0 (0.0%) |
| Total | 55 (68.8%) | 25 (31.2%) |
Fertility by Education in Surry County
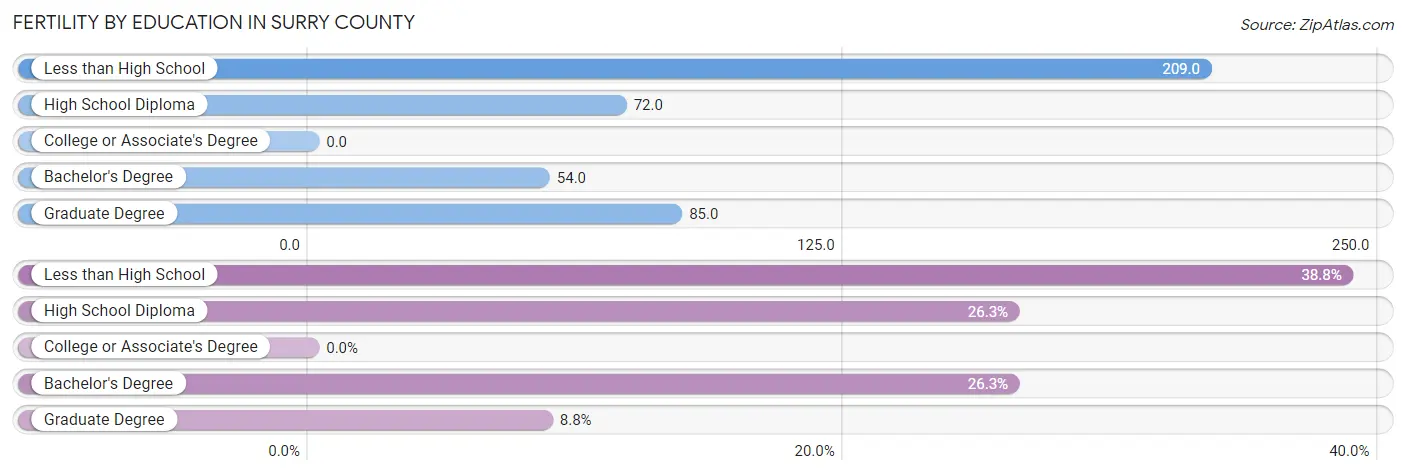
| Educational Attainment | Women with Births | Births / 1,000 Women |
| Less than High School | 31 (38.8%) | 209.0 |
| High School Diploma | 21 (26.3%) | 72.0 |
| College or Associate's Degree | 0 (0.0%) | 0.0 |
| Bachelor's Degree | 21 (26.3%) | 54.0 |
| Graduate Degree | 7 (8.7%) | 85.0 |
| Total | 80 (100.0%) | 68.0 |
Fertility by Education by Marriage Status in Surry County
31.2% of women with births in Surry County are unmarried. Women with the educational attainment of high school diploma are most likely to be married with 100.0% of them married at childbirth, while women with the educational attainment of less than high school are least likely to be married with 74.2% of them unmarried at childbirth.
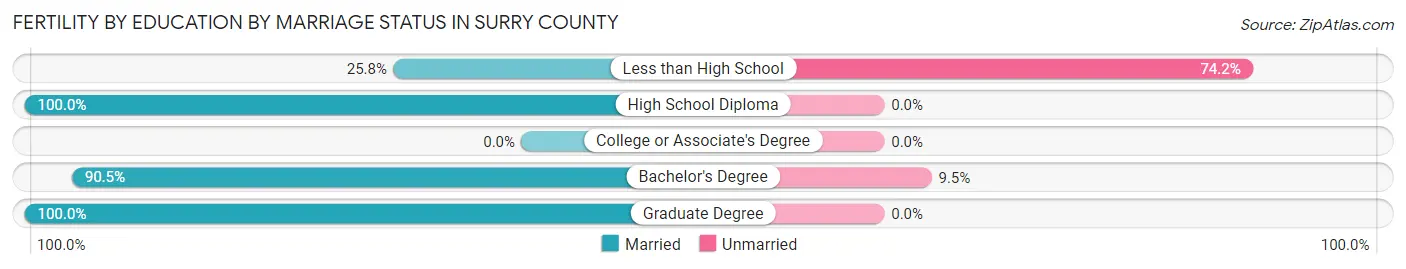
| Educational Attainment | Married | Unmarried |
| Less than High School | 8 (25.8%) | 23 (74.2%) |
| High School Diploma | 21 (100.0%) | 0 (0.0%) |
| College or Associate's Degree | 0 (0.0%) | 0 (0.0%) |
| Bachelor's Degree | 19 (90.5%) | 2 (9.5%) |
| Graduate Degree | 7 (100.0%) | 0 (0.0%) |
| Total | 55 (68.8%) | 25 (31.2%) |
Employment Characteristics in Surry County
Employment by Class of Employer in Surry County
Among the 3,069 employed individuals in Surry County, private company employees (1,888 | 61.5%), local government employees (512 | 16.7%), and state government employees (219 | 7.1%) make up the most common classes of employment.
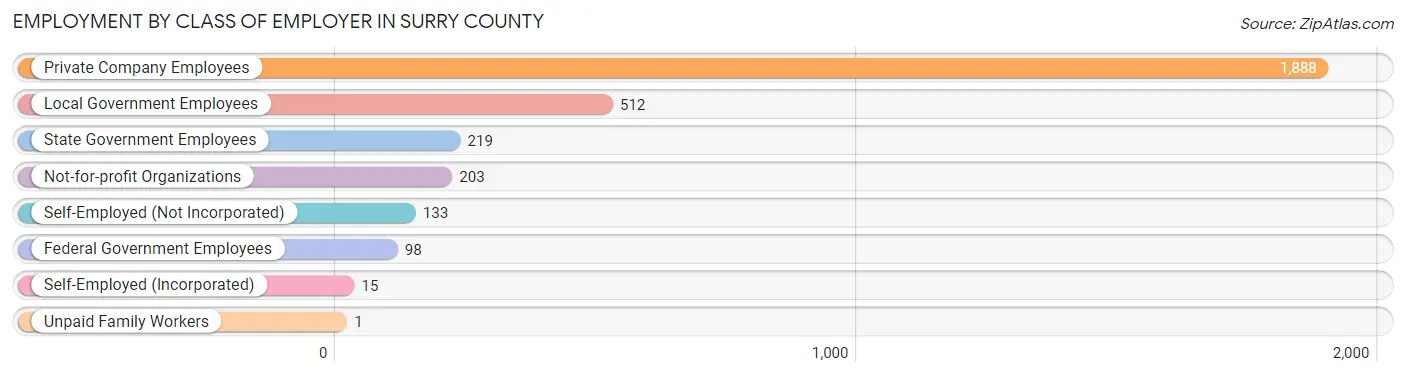
| Employer Class | # Employees | % Employees |
| Private Company Employees | 1,888 | 61.5% |
| Self-Employed (Incorporated) | 15 | 0.5% |
| Self-Employed (Not Incorporated) | 133 | 4.3% |
| Not-for-profit Organizations | 203 | 6.6% |
| Local Government Employees | 512 | 16.7% |
| State Government Employees | 219 | 7.1% |
| Federal Government Employees | 98 | 3.2% |
| Unpaid Family Workers | 1 | 0.0% |
| Total | 3,069 | 100.0% |
Employment Status by Age in Surry County
According to the labor force statistics for Surry County, out of the total population over 16 years of age (5,560), 60.4% or 3,358 individuals are in the labor force, with 6.0% or 201 of them unemployed. The age group with the highest labor force participation rate is 20 to 24 years, with 96.3% or 310 individuals in the labor force. Within the labor force, the 60 to 64 years age range has the highest percentage of unemployed individuals, with 22.6% or 105 of them being unemployed.
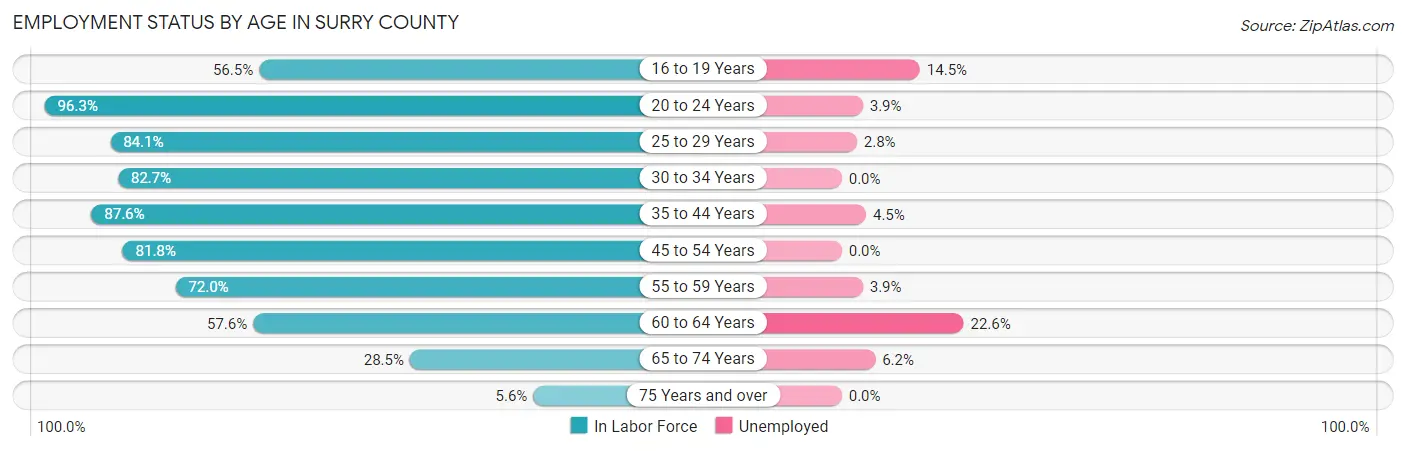
| Age Bracket | In Labor Force | Unemployed |
| 16 to 19 Years | 152 (56.5%) | 22 (14.5%) |
| 20 to 24 Years | 310 (96.3%) | 12 (3.9%) |
| 25 to 29 Years | 248 (84.1%) | 7 (2.8%) |
| 30 to 34 Years | 324 (82.7%) | 0 (0.0%) |
| 35 to 44 Years | 589 (87.6%) | 27 (4.5%) |
| 45 to 54 Years | 625 (81.8%) | 0 (0.0%) |
| 55 to 59 Years | 337 (72.0%) | 13 (3.9%) |
| 60 to 64 Years | 464 (57.6%) | 105 (22.6%) |
| 65 to 74 Years | 276 (28.5%) | 17 (6.2%) |
| 75 Years and over | 34 (5.6%) | 0 (0.0%) |
| Total | 3,358 (60.4%) | 201 (6.0%) |
Employment Status by Educational Attainment in Surry County
According to labor force statistics for Surry County, 76.2% of individuals (2,589) out of the total population between 25 and 64 years of age (3,397) are in the labor force, with 5.9% or 153 of them being unemployed. The group with the highest labor force participation rate are those with the educational attainment of bachelor's degree or higher, with 84.7% or 737 individuals in the labor force. Within the labor force, individuals with less than high school education have the highest percentage of unemployment, with 19.7% or 26 of them being unemployed.
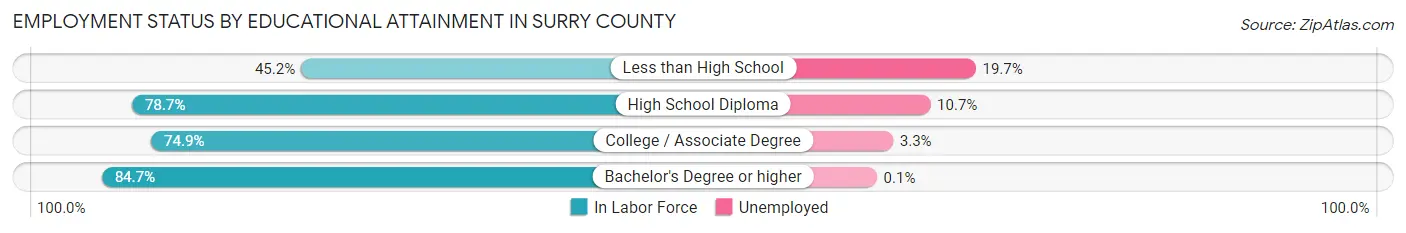
| Educational Attainment | In Labor Force | Unemployed |
| Less than High School | 132 (45.2%) | 58 (19.7%) |
| High School Diploma | 920 (78.7%) | 125 (10.7%) |
| College / Associate Degree | 798 (74.9%) | 35 (3.3%) |
| Bachelor's Degree or higher | 737 (84.7%) | 1 (0.1%) |
| Total | 2,589 (76.2%) | 200 (5.9%) |
Employment Occupations by Sex in Surry County
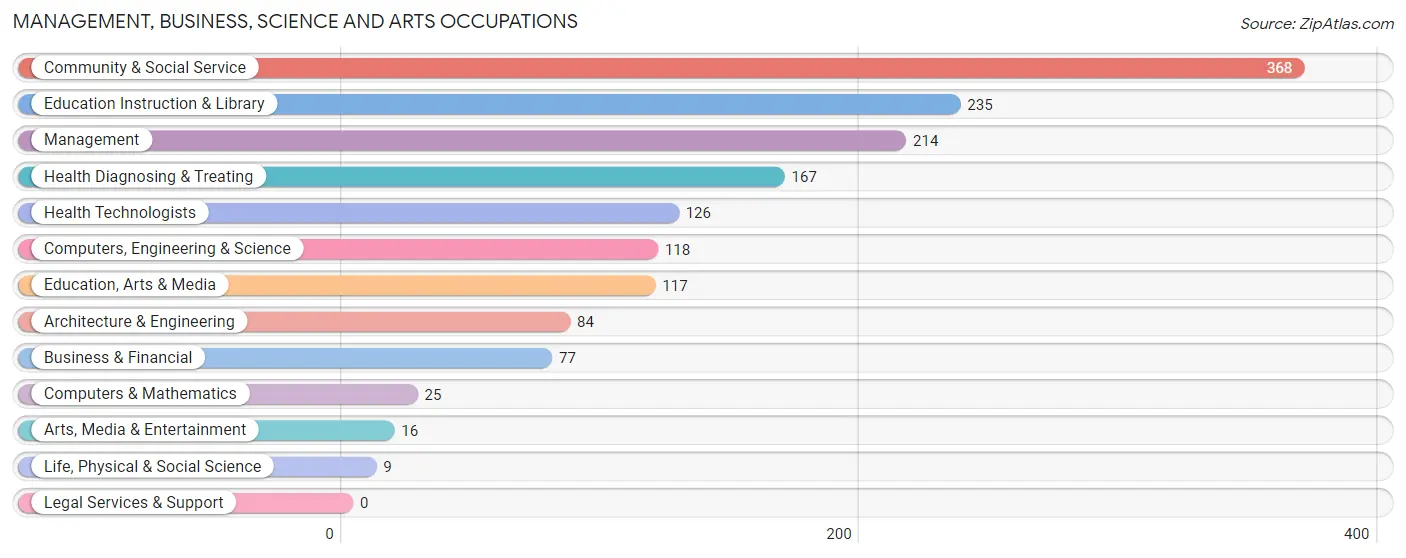
Management, Business, Science and Arts Occupations
The most common Management, Business, Science and Arts occupations in Surry County are Community & Social Service (368 | 11.7%), Education Instruction & Library (235 | 7.5%), Management (214 | 6.8%), Health Diagnosing & Treating (167 | 5.3%), and Health Technologists (126 | 4.0%).
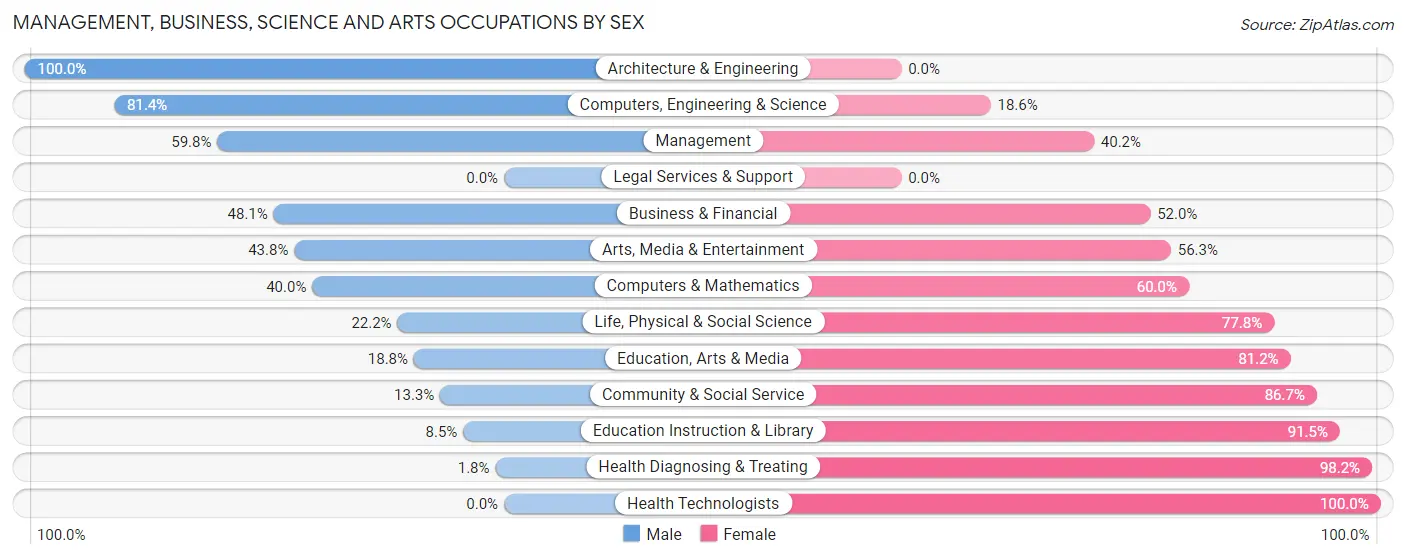
Management, Business, Science and Arts Occupations by Sex
Within the Management, Business, Science and Arts occupations in Surry County, the most male-oriented occupations are Architecture & Engineering (100.0%), Computers, Engineering & Science (81.4%), and Management (59.8%), while the most female-oriented occupations are Health Technologists (100.0%), Health Diagnosing & Treating (98.2%), and Education Instruction & Library (91.5%).
| Occupation | Male | Female |
| Management | 128 (59.8%) | 86 (40.2%) |
| Business & Financial | 37 (48.0%) | 40 (51.9%) |
| Computers, Engineering & Science | 96 (81.4%) | 22 (18.6%) |
| Computers & Mathematics | 10 (40.0%) | 15 (60.0%) |
| Architecture & Engineering | 84 (100.0%) | 0 (0.0%) |
| Life, Physical & Social Science | 2 (22.2%) | 7 (77.8%) |
| Community & Social Service | 49 (13.3%) | 319 (86.7%) |
| Education, Arts & Media | 22 (18.8%) | 95 (81.2%) |
| Legal Services & Support | 0 (0.0%) | 0 (0.0%) |
| Education Instruction & Library | 20 (8.5%) | 215 (91.5%) |
| Arts, Media & Entertainment | 7 (43.8%) | 9 (56.2%) |
| Health Diagnosing & Treating | 3 (1.8%) | 164 (98.2%) |
| Health Technologists | 0 (0.0%) | 126 (100.0%) |
| Total (Category) | 313 (33.2%) | 631 (66.8%) |
| Total (Overall) | 1,594 (50.6%) | 1,553 (49.3%) |
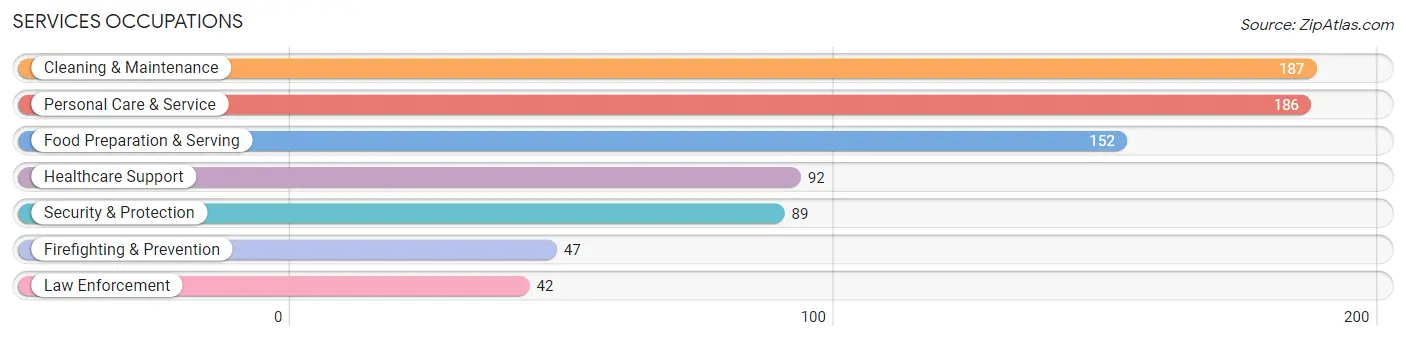
Services Occupations
The most common Services occupations in Surry County are Cleaning & Maintenance (187 | 5.9%), Personal Care & Service (186 | 5.9%), Food Preparation & Serving (152 | 4.8%), Healthcare Support (92 | 2.9%), and Security & Protection (89 | 2.8%).
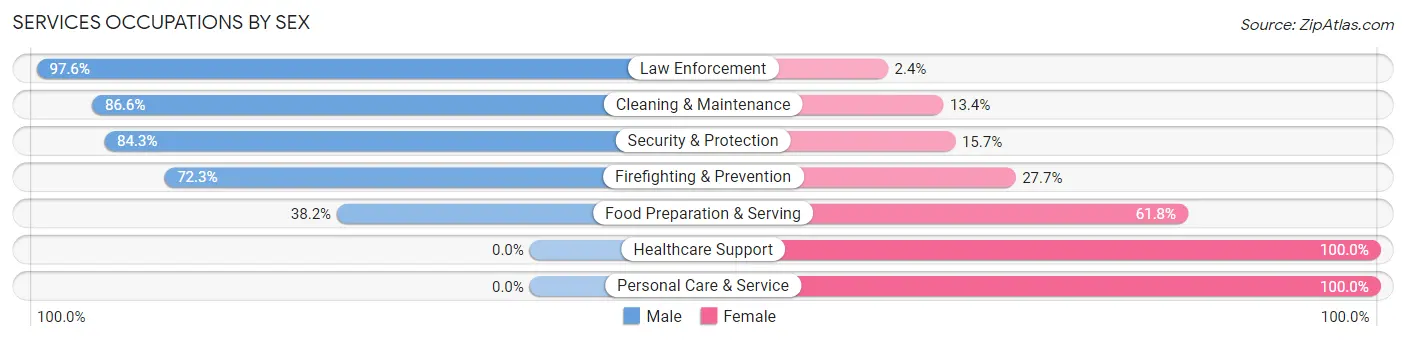
Services Occupations by Sex
Within the Services occupations in Surry County, the most male-oriented occupations are Law Enforcement (97.6%), Cleaning & Maintenance (86.6%), and Security & Protection (84.3%), while the most female-oriented occupations are Healthcare Support (100.0%), Personal Care & Service (100.0%), and Food Preparation & Serving (61.8%).
| Occupation | Male | Female |
| Healthcare Support | 0 (0.0%) | 92 (100.0%) |
| Security & Protection | 75 (84.3%) | 14 (15.7%) |
| Firefighting & Prevention | 34 (72.3%) | 13 (27.7%) |
| Law Enforcement | 41 (97.6%) | 1 (2.4%) |
| Food Preparation & Serving | 58 (38.2%) | 94 (61.8%) |
| Cleaning & Maintenance | 162 (86.6%) | 25 (13.4%) |
| Personal Care & Service | 0 (0.0%) | 186 (100.0%) |
| Total (Category) | 295 (41.8%) | 411 (58.2%) |
| Total (Overall) | 1,594 (50.6%) | 1,553 (49.3%) |
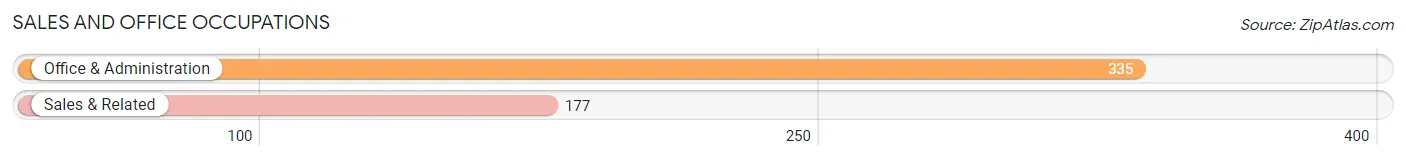
Sales and Office Occupations
The most common Sales and Office occupations in Surry County are Office & Administration (335 | 10.6%), and Sales & Related (177 | 5.6%).
Sales and Office Occupations by Sex
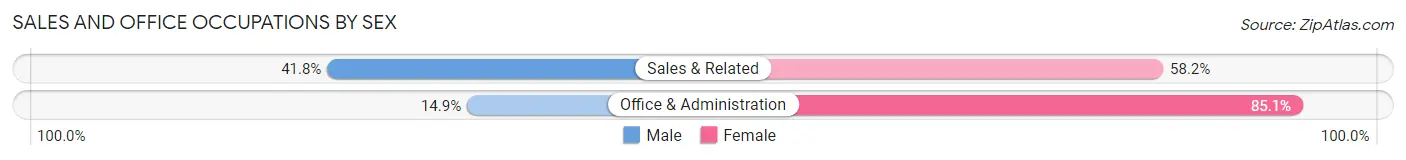
| Occupation | Male | Female |
| Sales & Related | 74 (41.8%) | 103 (58.2%) |
| Office & Administration | 50 (14.9%) | 285 (85.1%) |
| Total (Category) | 124 (24.2%) | 388 (75.8%) |
| Total (Overall) | 1,594 (50.6%) | 1,553 (49.3%) |
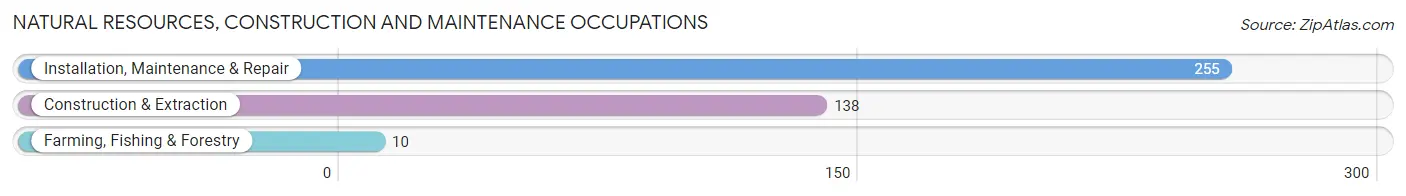
Natural Resources, Construction and Maintenance Occupations
The most common Natural Resources, Construction and Maintenance occupations in Surry County are Installation, Maintenance & Repair (255 | 8.1%), Construction & Extraction (138 | 4.4%), and Farming, Fishing & Forestry (10 | 0.3%).
Natural Resources, Construction and Maintenance Occupations by Sex
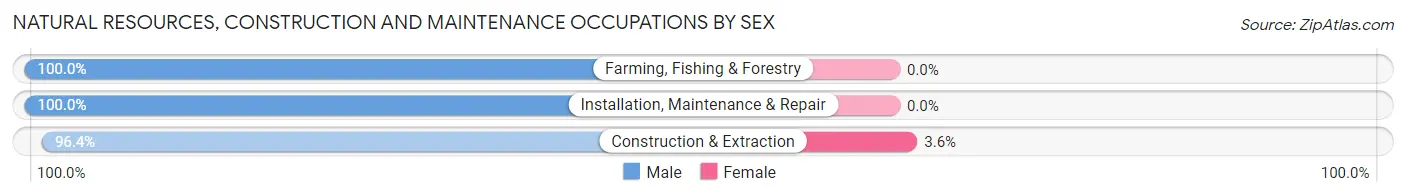
| Occupation | Male | Female |
| Farming, Fishing & Forestry | 10 (100.0%) | 0 (0.0%) |
| Construction & Extraction | 133 (96.4%) | 5 (3.6%) |
| Installation, Maintenance & Repair | 255 (100.0%) | 0 (0.0%) |
| Total (Category) | 398 (98.8%) | 5 (1.2%) |
| Total (Overall) | 1,594 (50.6%) | 1,553 (49.3%) |
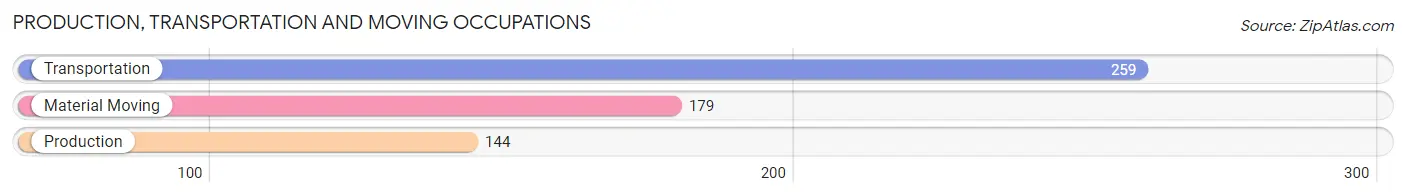
Production, Transportation and Moving Occupations
The most common Production, Transportation and Moving occupations in Surry County are Transportation (259 | 8.2%), Material Moving (179 | 5.7%), and Production (144 | 4.6%).
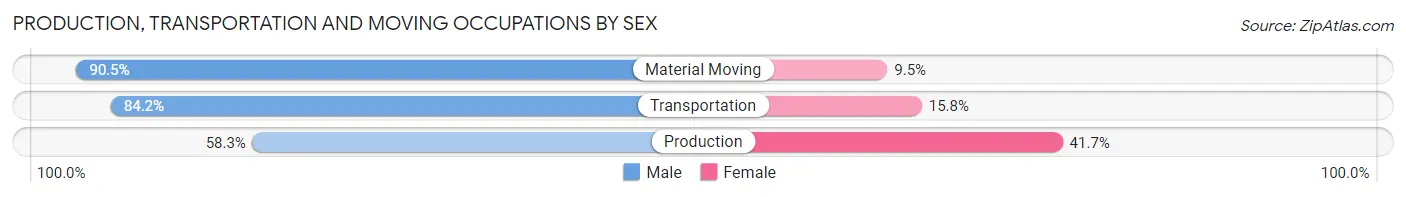
Production, Transportation and Moving Occupations by Sex
| Occupation | Male | Female |
| Production | 84 (58.3%) | 60 (41.7%) |
| Transportation | 218 (84.2%) | 41 (15.8%) |
| Material Moving | 162 (90.5%) | 17 (9.5%) |
| Total (Category) | 464 (79.7%) | 118 (20.3%) |
| Total (Overall) | 1,594 (50.6%) | 1,553 (49.3%) |
Employment Industries by Sex in Surry County
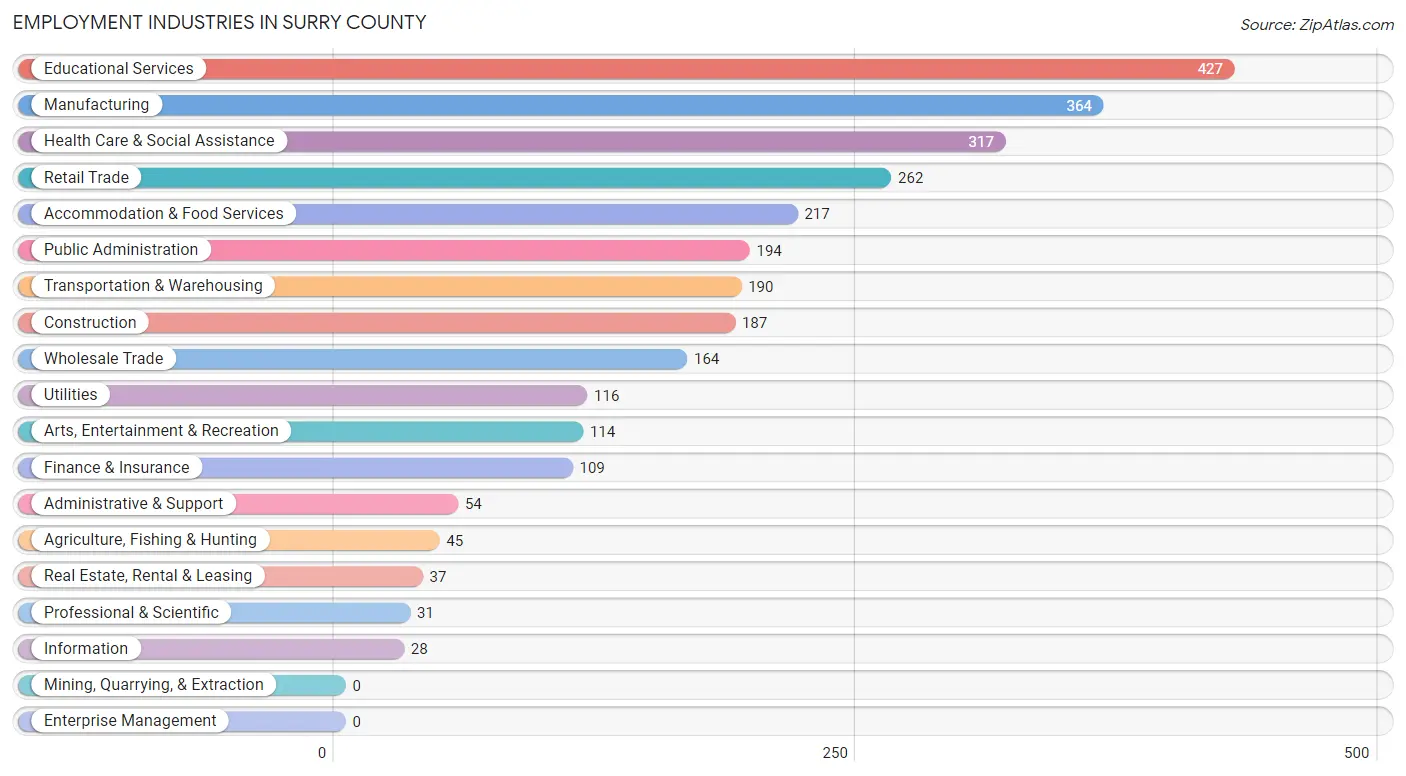
Employment Industries in Surry County
The major employment industries in Surry County include Educational Services (427 | 13.6%), Manufacturing (364 | 11.6%), Health Care & Social Assistance (317 | 10.1%), Retail Trade (262 | 8.3%), and Accommodation & Food Services (217 | 6.9%).
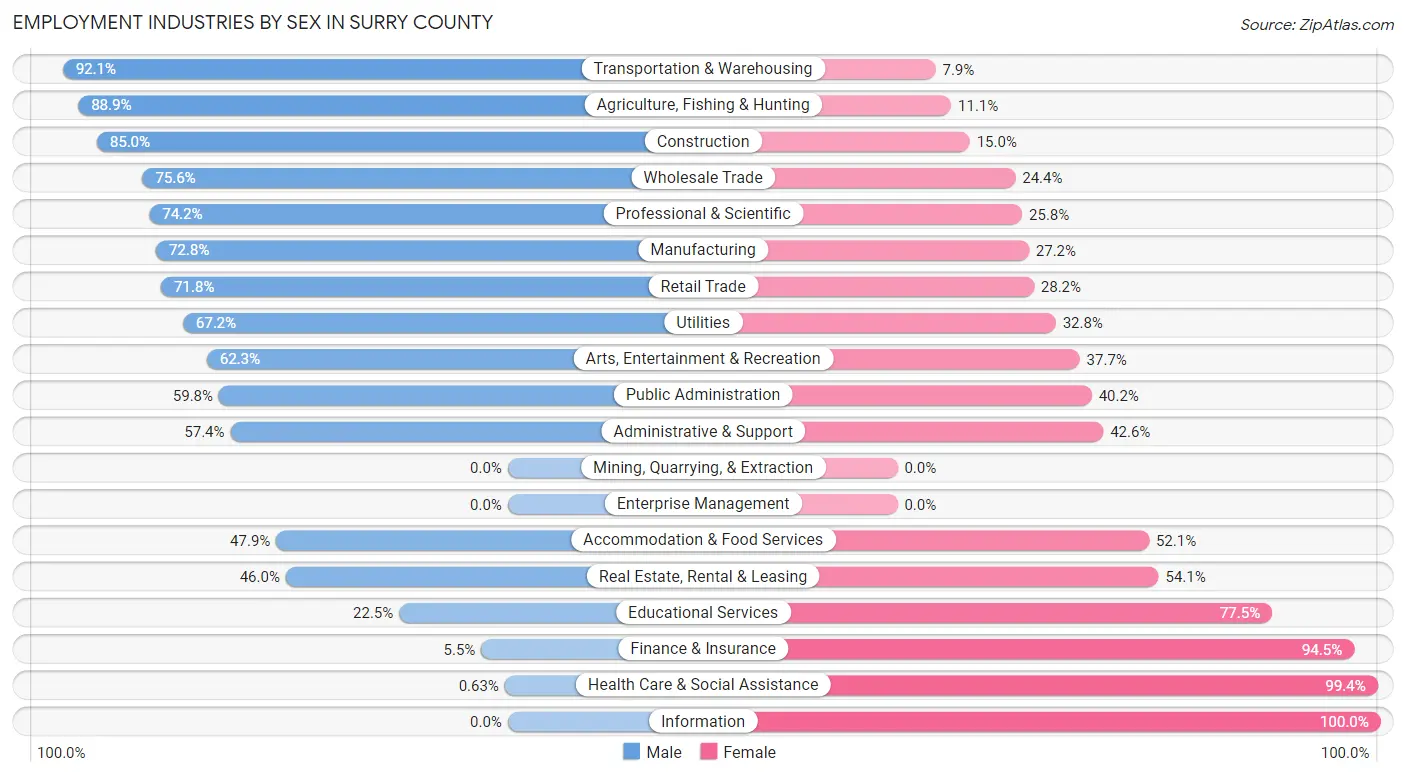
Employment Industries by Sex in Surry County
The Surry County industries that see more men than women are Transportation & Warehousing (92.1%), Agriculture, Fishing & Hunting (88.9%), and Construction (85.0%), whereas the industries that tend to have a higher number of women are Information (100.0%), Health Care & Social Assistance (99.4%), and Finance & Insurance (94.5%).
| Industry | Male | Female |
| Agriculture, Fishing & Hunting | 40 (88.9%) | 5 (11.1%) |
| Mining, Quarrying, & Extraction | 0 (0.0%) | 0 (0.0%) |
| Construction | 159 (85.0%) | 28 (15.0%) |
| Manufacturing | 265 (72.8%) | 99 (27.2%) |
| Wholesale Trade | 124 (75.6%) | 40 (24.4%) |
| Retail Trade | 188 (71.8%) | 74 (28.2%) |
| Transportation & Warehousing | 175 (92.1%) | 15 (7.9%) |
| Utilities | 78 (67.2%) | 38 (32.8%) |
| Information | 0 (0.0%) | 28 (100.0%) |
| Finance & Insurance | 6 (5.5%) | 103 (94.5%) |
| Real Estate, Rental & Leasing | 17 (46.0%) | 20 (54.0%) |
| Professional & Scientific | 23 (74.2%) | 8 (25.8%) |
| Enterprise Management | 0 (0.0%) | 0 (0.0%) |
| Administrative & Support | 31 (57.4%) | 23 (42.6%) |
| Educational Services | 96 (22.5%) | 331 (77.5%) |
| Health Care & Social Assistance | 2 (0.6%) | 315 (99.4%) |
| Arts, Entertainment & Recreation | 71 (62.3%) | 43 (37.7%) |
| Accommodation & Food Services | 104 (47.9%) | 113 (52.1%) |
| Public Administration | 116 (59.8%) | 78 (40.2%) |
| Total | 1,594 (50.6%) | 1,553 (49.3%) |
Education in Surry County
School Enrollment in Surry County
The most common levels of schooling among the 1,136 students in Surry County are middle school (367 | 32.3%), college / undergraduate (200 | 17.6%), and high school (198 | 17.4%).
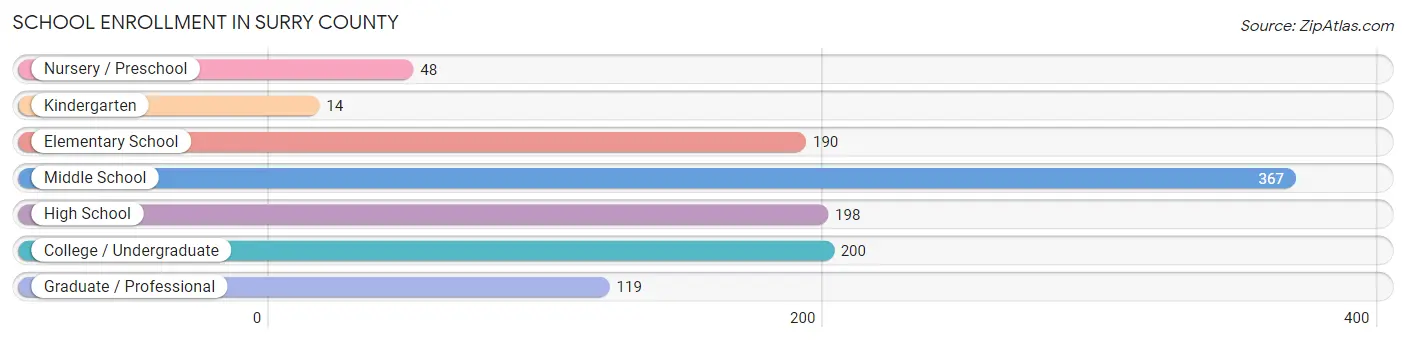
| School Level | # Students | % Students |
| Nursery / Preschool | 48 | 4.2% |
| Kindergarten | 14 | 1.2% |
| Elementary School | 190 | 16.7% |
| Middle School | 367 | 32.3% |
| High School | 198 | 17.4% |
| College / Undergraduate | 200 | 17.6% |
| Graduate / Professional | 119 | 10.5% |
| Total | 1,136 | 100.0% |
School Enrollment by Age by Funding Source in Surry County
Out of a total of 1,136 students who are enrolled in schools in Surry County, 289 (25.4%) attend a private institution, while the remaining 847 (74.6%) are enrolled in public schools. The age group of 35 years and over has the highest likelihood of being enrolled in private schools, with 116 (77.3% in the age bracket) enrolled. Conversely, the age group of 3 to 4 year olds has the lowest likelihood of being enrolled in a private school, with 19 (100.0% in the age bracket) attending a public institution.
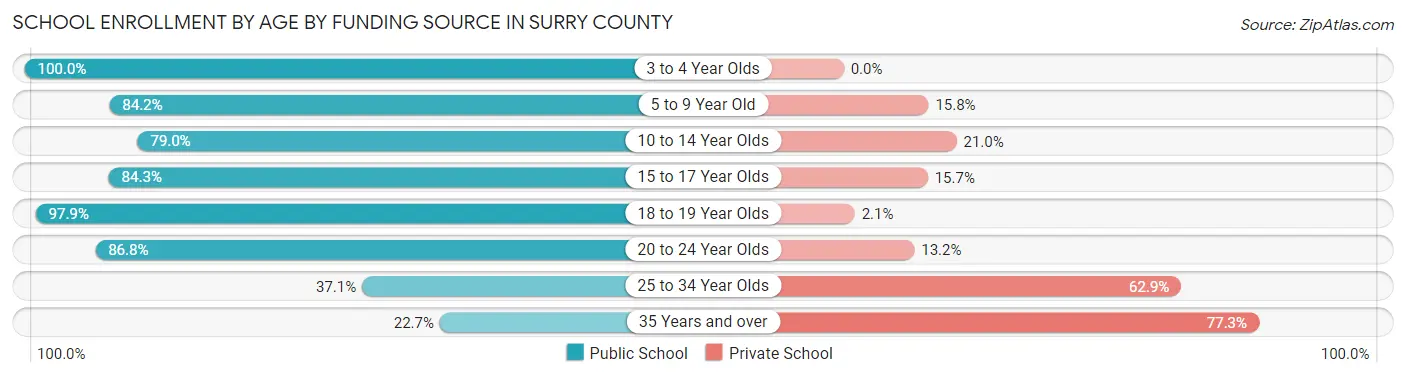
| Age Bracket | Public School | Private School |
| 3 to 4 Year Olds | 19 (100.0%) | 0 (0.0%) |
| 5 to 9 Year Old | 176 (84.2%) | 33 (15.8%) |
| 10 to 14 Year Olds | 278 (79.0%) | 74 (21.0%) |
| 15 to 17 Year Olds | 167 (84.3%) | 31 (15.7%) |
| 18 to 19 Year Olds | 95 (97.9%) | 2 (2.1%) |
| 20 to 24 Year Olds | 66 (86.8%) | 10 (13.2%) |
| 25 to 34 Year Olds | 13 (37.1%) | 22 (62.9%) |
| 35 Years and over | 34 (22.7%) | 116 (77.3%) |
| Total | 847 (74.6%) | 289 (25.4%) |
Educational Attainment by Field of Study in Surry County
Education (311 | 25.4%), science & technology (170 | 13.9%), business (150 | 12.2%), bio, nature & agricultural (116 | 9.5%), and social sciences (108 | 8.8%) are the most common fields of study among 1,226 individuals in Surry County who have obtained a bachelor's degree or higher.
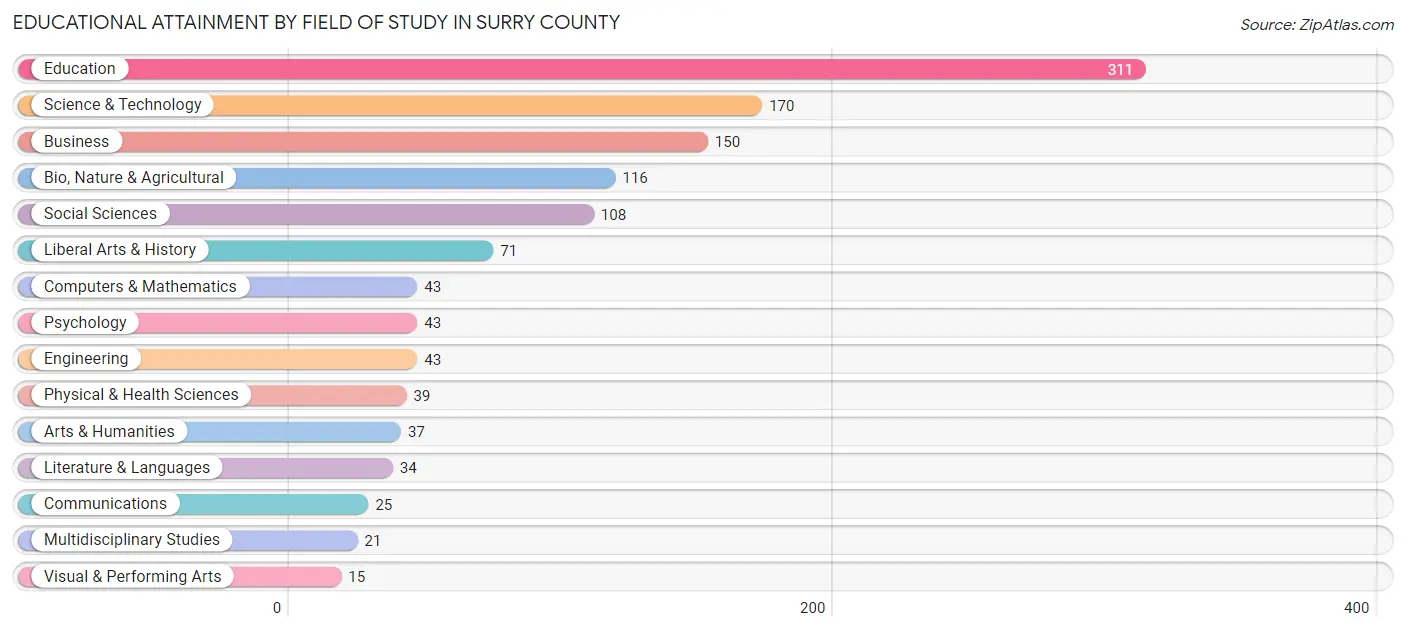
| Field of Study | # Graduates | % Graduates |
| Computers & Mathematics | 43 | 3.5% |
| Bio, Nature & Agricultural | 116 | 9.5% |
| Physical & Health Sciences | 39 | 3.2% |
| Psychology | 43 | 3.5% |
| Social Sciences | 108 | 8.8% |
| Engineering | 43 | 3.5% |
| Multidisciplinary Studies | 21 | 1.7% |
| Science & Technology | 170 | 13.9% |
| Business | 150 | 12.2% |
| Education | 311 | 25.4% |
| Literature & Languages | 34 | 2.8% |
| Liberal Arts & History | 71 | 5.8% |
| Visual & Performing Arts | 15 | 1.2% |
| Communications | 25 | 2.0% |
| Arts & Humanities | 37 | 3.0% |
| Total | 1,226 | 100.0% |
Transportation & Commute in Surry County
Vehicle Availability by Sex in Surry County
The most prevalent vehicle ownership categories in Surry County are males with 3 vehicles (477, accounting for 30.1%) and females with 3 vehicles (375, making up 32.1%).
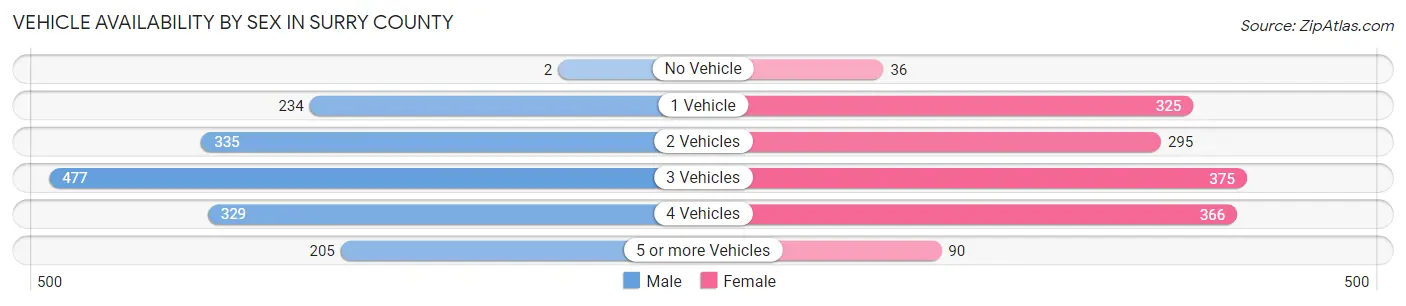
| Vehicles Available | Male | Female |
| No Vehicle | 2 (0.1%) | 36 (2.4%) |
| 1 Vehicle | 234 (14.8%) | 325 (21.9%) |
| 2 Vehicles | 335 (21.2%) | 295 (19.8%) |
| 3 Vehicles | 477 (30.1%) | 375 (25.2%) |
| 4 Vehicles | 329 (20.8%) | 366 (24.6%) |
| 5 or more Vehicles | 205 (13.0%) | 90 (6.0%) |
| Total | 1,582 (100.0%) | 1,487 (100.0%) |
Commute Time in Surry County
The most frequently occuring commute durations in Surry County are 45 to 59 minutes (645 commuters, 21.8%), 60 to 89 minutes (549 commuters, 18.6%), and 30 to 34 minutes (328 commuters, 11.1%).
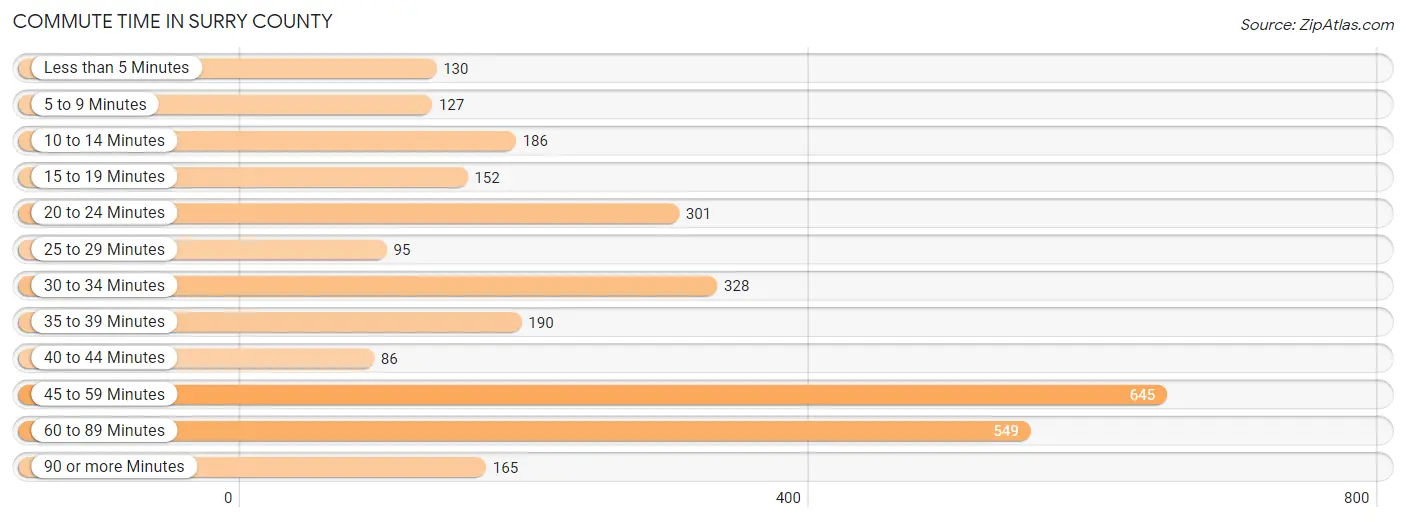
| Commute Time | # Commuters | % Commuters |
| Less than 5 Minutes | 130 | 4.4% |
| 5 to 9 Minutes | 127 | 4.3% |
| 10 to 14 Minutes | 186 | 6.3% |
| 15 to 19 Minutes | 152 | 5.1% |
| 20 to 24 Minutes | 301 | 10.2% |
| 25 to 29 Minutes | 95 | 3.2% |
| 30 to 34 Minutes | 328 | 11.1% |
| 35 to 39 Minutes | 190 | 6.4% |
| 40 to 44 Minutes | 86 | 2.9% |
| 45 to 59 Minutes | 645 | 21.8% |
| 60 to 89 Minutes | 549 | 18.6% |
| 90 or more Minutes | 165 | 5.6% |
Commute Time by Sex in Surry County
The most common commute times in Surry County are 45 to 59 minutes (407 commuters, 26.4%) for males and 60 to 89 minutes (255 commuters, 18.0%) for females.
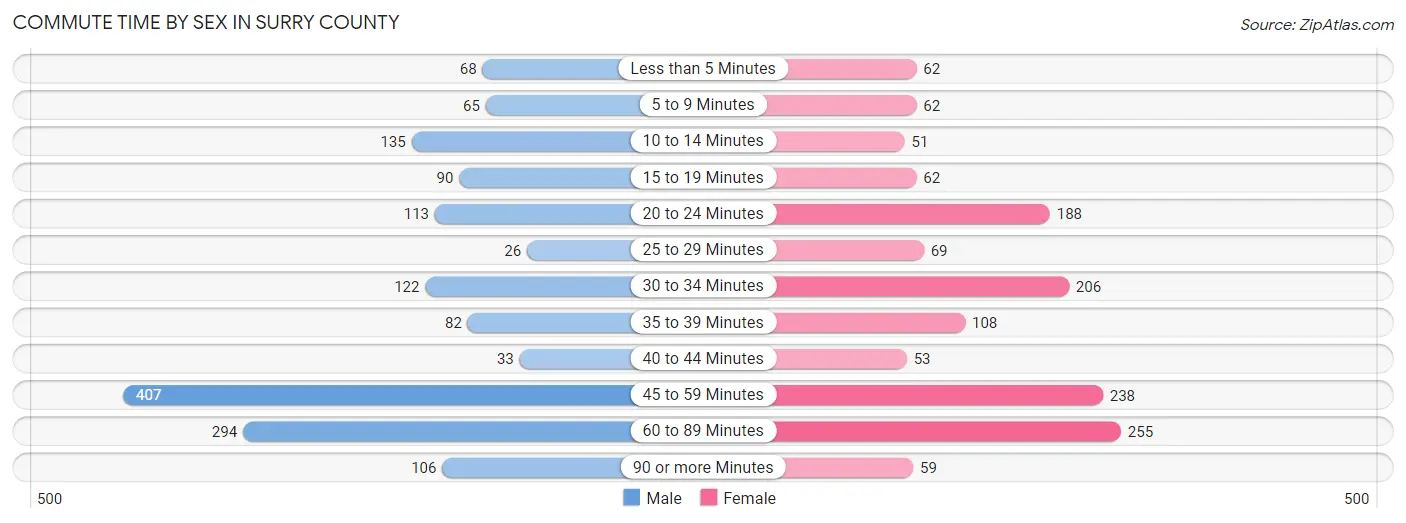
| Commute Time | Male | Female |
| Less than 5 Minutes | 68 (4.4%) | 62 (4.4%) |
| 5 to 9 Minutes | 65 (4.2%) | 62 (4.4%) |
| 10 to 14 Minutes | 135 (8.8%) | 51 (3.6%) |
| 15 to 19 Minutes | 90 (5.8%) | 62 (4.4%) |
| 20 to 24 Minutes | 113 (7.3%) | 188 (13.3%) |
| 25 to 29 Minutes | 26 (1.7%) | 69 (4.9%) |
| 30 to 34 Minutes | 122 (7.9%) | 206 (14.6%) |
| 35 to 39 Minutes | 82 (5.3%) | 108 (7.6%) |
| 40 to 44 Minutes | 33 (2.1%) | 53 (3.7%) |
| 45 to 59 Minutes | 407 (26.4%) | 238 (16.8%) |
| 60 to 89 Minutes | 294 (19.1%) | 255 (18.0%) |
| 90 or more Minutes | 106 (6.9%) | 59 (4.2%) |
Time of Departure to Work by Sex in Surry County
The most frequent times of departure to work in Surry County are 12:00 AM to 4:59 AM (258, 16.7%) for males and 6:30 AM to 6:59 AM (275, 19.5%) for females.
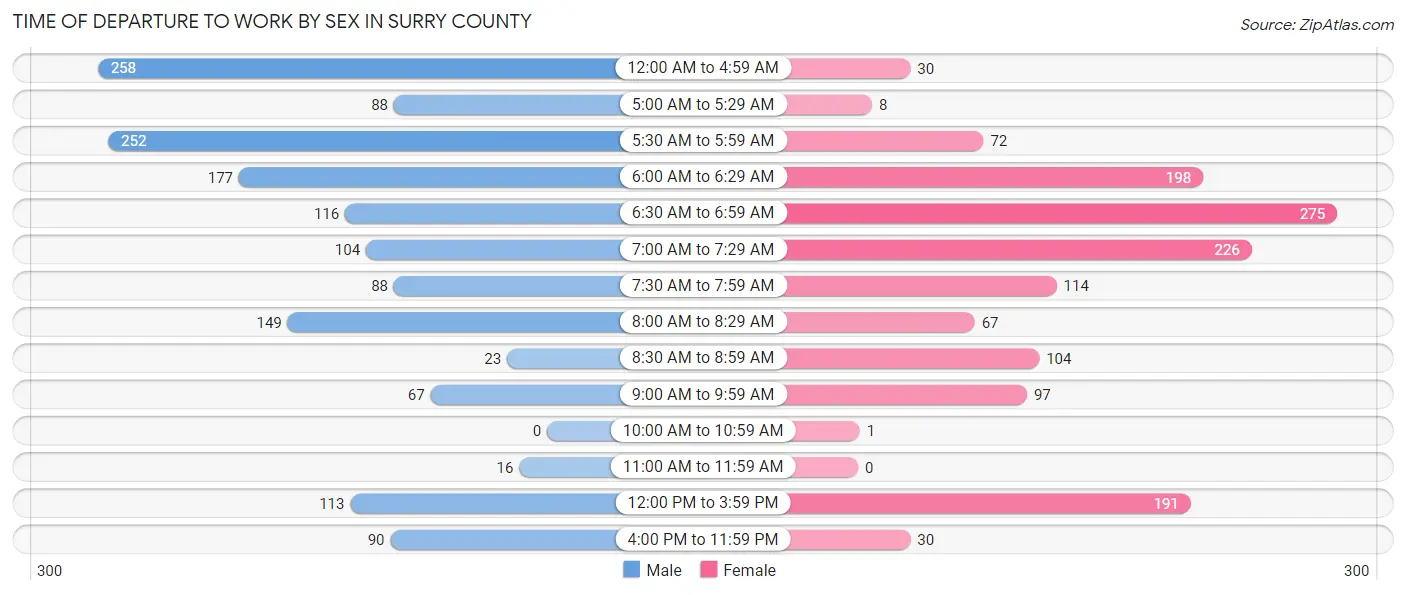
| Time of Departure | Male | Female |
| 12:00 AM to 4:59 AM | 258 (16.7%) | 30 (2.1%) |
| 5:00 AM to 5:29 AM | 88 (5.7%) | 8 (0.6%) |
| 5:30 AM to 5:59 AM | 252 (16.4%) | 72 (5.1%) |
| 6:00 AM to 6:29 AM | 177 (11.5%) | 198 (14.0%) |
| 6:30 AM to 6:59 AM | 116 (7.5%) | 275 (19.5%) |
| 7:00 AM to 7:29 AM | 104 (6.8%) | 226 (16.0%) |
| 7:30 AM to 7:59 AM | 88 (5.7%) | 114 (8.1%) |
| 8:00 AM to 8:29 AM | 149 (9.7%) | 67 (4.7%) |
| 8:30 AM to 8:59 AM | 23 (1.5%) | 104 (7.4%) |
| 9:00 AM to 9:59 AM | 67 (4.3%) | 97 (6.9%) |
| 10:00 AM to 10:59 AM | 0 (0.0%) | 1 (0.1%) |
| 11:00 AM to 11:59 AM | 16 (1.0%) | 0 (0.0%) |
| 12:00 PM to 3:59 PM | 113 (7.3%) | 191 (13.5%) |
| 4:00 PM to 11:59 PM | 90 (5.8%) | 30 (2.1%) |
| Total | 1,541 (100.0%) | 1,413 (100.0%) |
Housing Occupancy in Surry County
Occupancy by Ownership in Surry County
Of the total 2,745 dwellings in Surry County, owner-occupied units account for 2,139 (77.9%), while renter-occupied units make up 606 (22.1%).
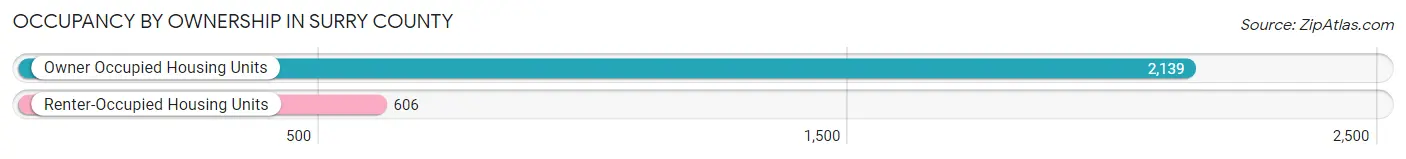
| Occupancy | # Housing Units | % Housing Units |
| Owner Occupied Housing Units | 2,139 | 77.9% |
| Renter-Occupied Housing Units | 606 | 22.1% |
| Total Occupied Housing Units | 2,745 | 100.0% |
Occupancy by Household Size in Surry County
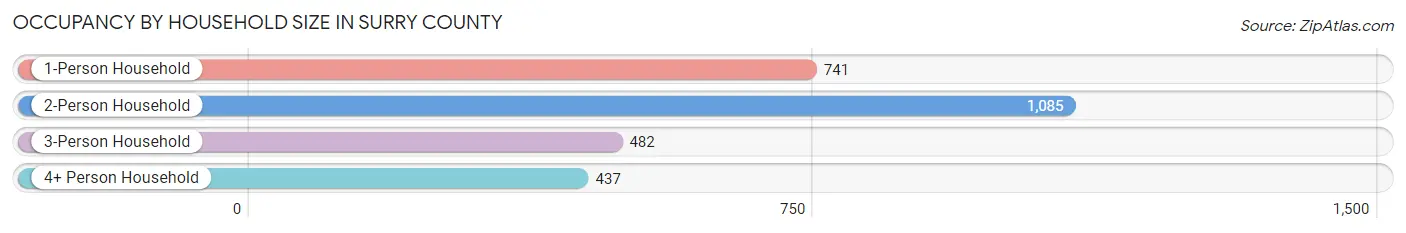
| Household Size | # Housing Units | % Housing Units |
| 1-Person Household | 741 | 27.0% |
| 2-Person Household | 1,085 | 39.5% |
| 3-Person Household | 482 | 17.6% |
| 4+ Person Household | 437 | 15.9% |
| Total Housing Units | 2,745 | 100.0% |
Occupancy by Ownership by Household Size in Surry County
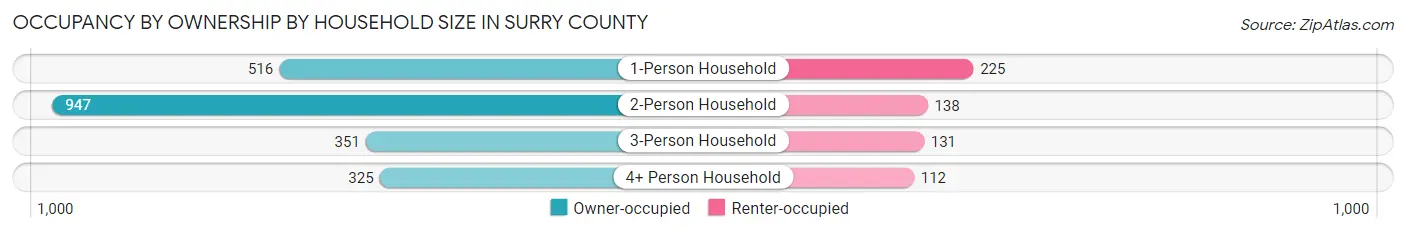
| Household Size | Owner-occupied | Renter-occupied |
| 1-Person Household | 516 (69.6%) | 225 (30.4%) |
| 2-Person Household | 947 (87.3%) | 138 (12.7%) |
| 3-Person Household | 351 (72.8%) | 131 (27.2%) |
| 4+ Person Household | 325 (74.4%) | 112 (25.6%) |
| Total Housing Units | 2,139 (77.9%) | 606 (22.1%) |
Occupancy by Educational Attainment in Surry County
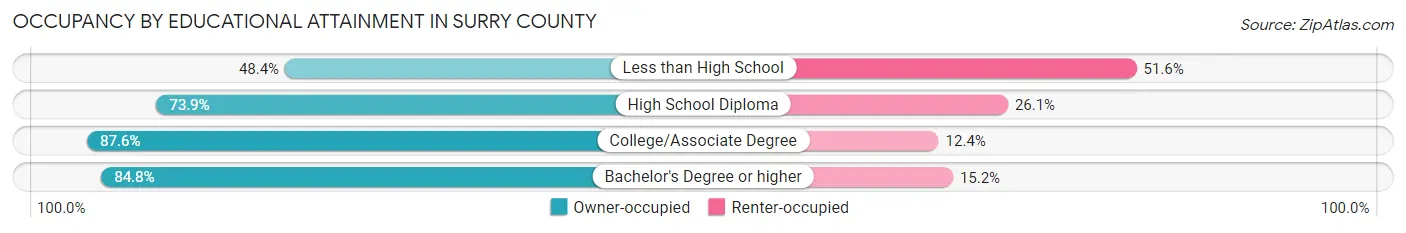
| Household Size | Owner-occupied | Renter-occupied |
| Less than High School | 179 (48.4%) | 191 (51.6%) |
| High School Diploma | 540 (73.9%) | 191 (26.1%) |
| College/Associate Degree | 813 (87.6%) | 115 (12.4%) |
| Bachelor's Degree or higher | 607 (84.8%) | 109 (15.2%) |
Occupancy by Age of Householder in Surry County
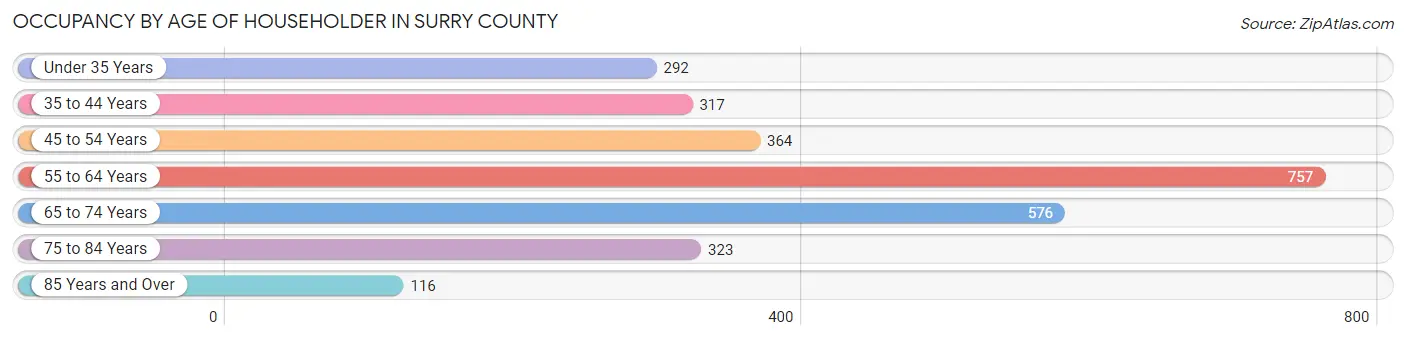
| Age Bracket | # Households | % Households |
| Under 35 Years | 292 | 10.6% |
| 35 to 44 Years | 317 | 11.6% |
| 45 to 54 Years | 364 | 13.3% |
| 55 to 64 Years | 757 | 27.6% |
| 65 to 74 Years | 576 | 21.0% |
| 75 to 84 Years | 323 | 11.8% |
| 85 Years and Over | 116 | 4.2% |
| Total | 2,745 | 100.0% |
Housing Finances in Surry County
Median Income by Occupancy in Surry County
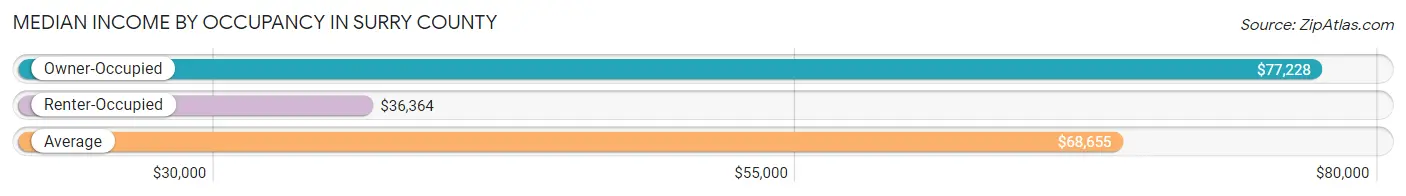
| Occupancy Type | # Households | Median Income |
| Owner-Occupied | 2,139 (77.9%) | $77,228 |
| Renter-Occupied | 606 (22.1%) | $36,364 |
| Average | 2,745 (100.0%) | $68,655 |
Occupancy by Householder Income Bracket in Surry County
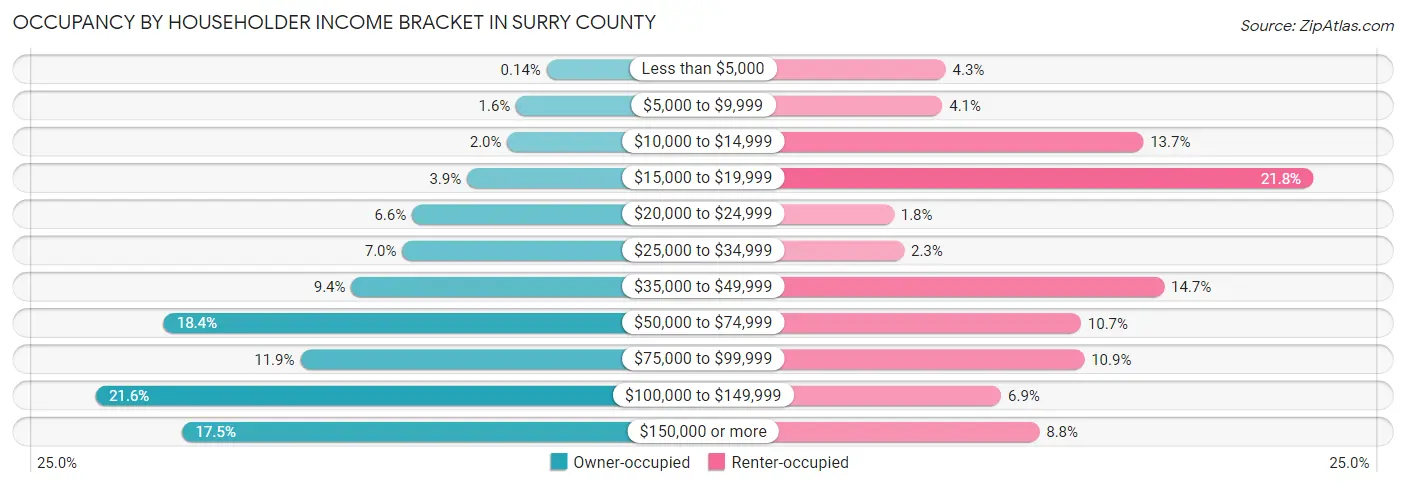
| Income Bracket | Owner-occupied | Renter-occupied |
| Less than $5,000 | 3 (0.1%) | 26 (4.3%) |
| $5,000 to $9,999 | 34 (1.6%) | 25 (4.1%) |
| $10,000 to $14,999 | 43 (2.0%) | 83 (13.7%) |
| $15,000 to $19,999 | 84 (3.9%) | 132 (21.8%) |
| $20,000 to $24,999 | 140 (6.6%) | 11 (1.8%) |
| $25,000 to $34,999 | 150 (7.0%) | 14 (2.3%) |
| $35,000 to $49,999 | 202 (9.4%) | 89 (14.7%) |
| $50,000 to $74,999 | 393 (18.4%) | 65 (10.7%) |
| $75,000 to $99,999 | 254 (11.9%) | 66 (10.9%) |
| $100,000 to $149,999 | 462 (21.6%) | 42 (6.9%) |
| $150,000 or more | 374 (17.5%) | 53 (8.7%) |
| Total | 2,139 (100.0%) | 606 (100.0%) |
Monthly Housing Cost Tiers in Surry County
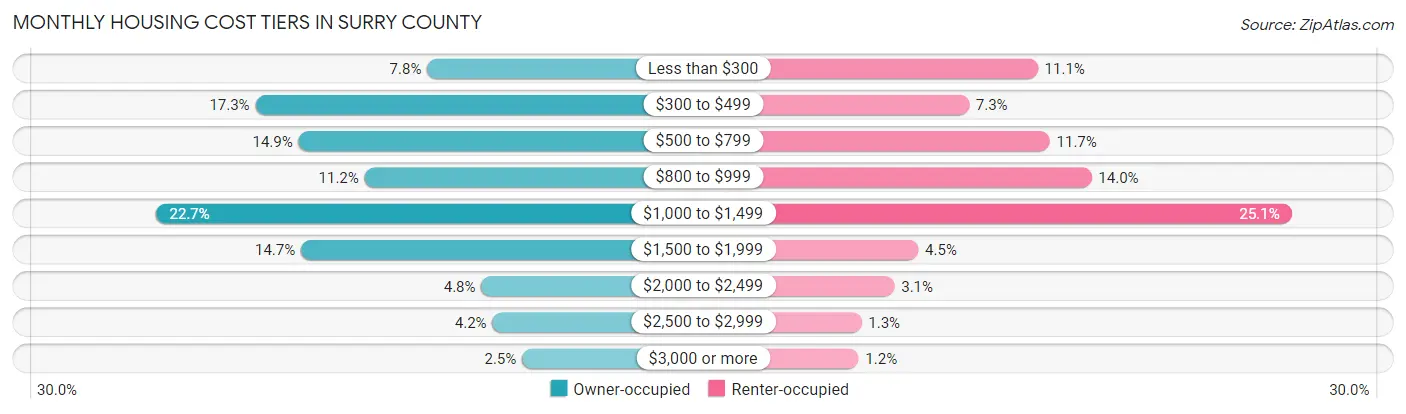
| Monthly Cost | Owner-occupied | Renter-occupied |
| Less than $300 | 166 (7.8%) | 67 (11.1%) |
| $300 to $499 | 369 (17.2%) | 44 (7.3%) |
| $500 to $799 | 318 (14.9%) | 71 (11.7%) |
| $800 to $999 | 240 (11.2%) | 85 (14.0%) |
| $1,000 to $1,499 | 486 (22.7%) | 152 (25.1%) |
| $1,500 to $1,999 | 315 (14.7%) | 27 (4.5%) |
| $2,000 to $2,499 | 102 (4.8%) | 19 (3.1%) |
| $2,500 to $2,999 | 89 (4.2%) | 8 (1.3%) |
| $3,000 or more | 54 (2.5%) | 7 (1.2%) |
| Total | 2,139 (100.0%) | 606 (100.0%) |
Physical Housing Characteristics in Surry County
Housing Structures in Surry County
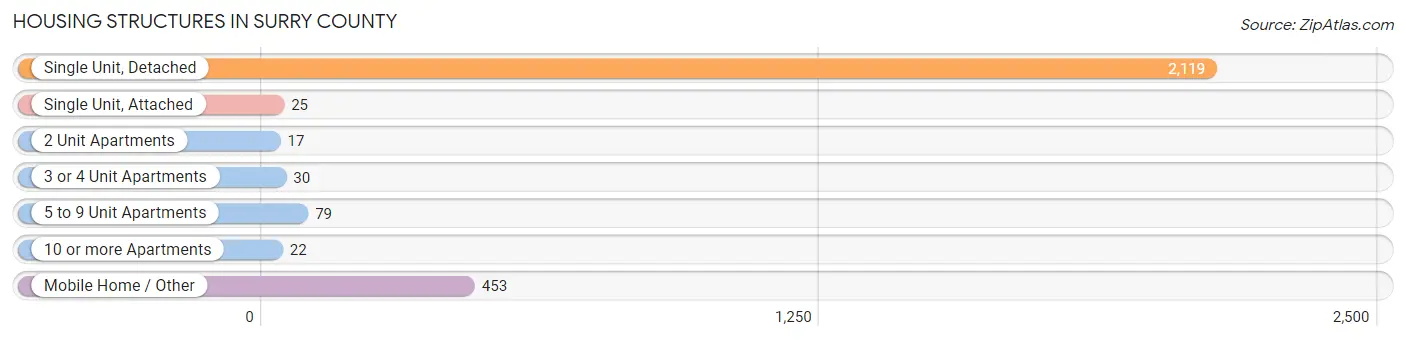
| Structure Type | # Housing Units | % Housing Units |
| Single Unit, Detached | 2,119 | 77.2% |
| Single Unit, Attached | 25 | 0.9% |
| 2 Unit Apartments | 17 | 0.6% |
| 3 or 4 Unit Apartments | 30 | 1.1% |
| 5 to 9 Unit Apartments | 79 | 2.9% |
| 10 or more Apartments | 22 | 0.8% |
| Mobile Home / Other | 453 | 16.5% |
| Total | 2,745 | 100.0% |
Housing Structures by Occupancy in Surry County
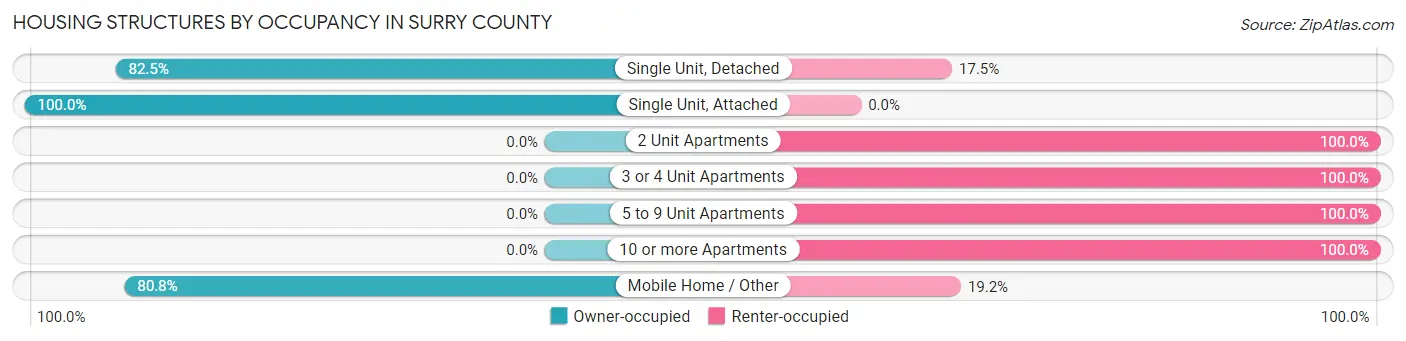
| Structure Type | Owner-occupied | Renter-occupied |
| Single Unit, Detached | 1,748 (82.5%) | 371 (17.5%) |
| Single Unit, Attached | 25 (100.0%) | 0 (0.0%) |
| 2 Unit Apartments | 0 (0.0%) | 17 (100.0%) |
| 3 or 4 Unit Apartments | 0 (0.0%) | 30 (100.0%) |
| 5 to 9 Unit Apartments | 0 (0.0%) | 79 (100.0%) |
| 10 or more Apartments | 0 (0.0%) | 22 (100.0%) |
| Mobile Home / Other | 366 (80.8%) | 87 (19.2%) |
| Total | 2,139 (77.9%) | 606 (22.1%) |
Housing Structures by Number of Rooms in Surry County
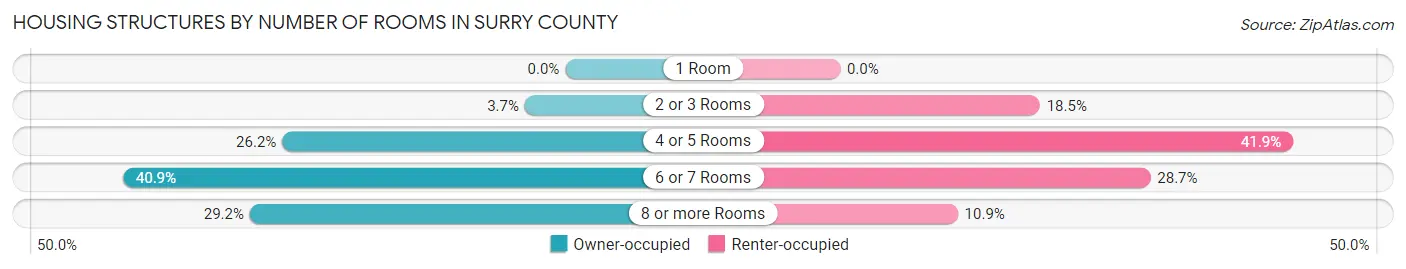
| Number of Rooms | Owner-occupied | Renter-occupied |
| 1 Room | 0 (0.0%) | 0 (0.0%) |
| 2 or 3 Rooms | 80 (3.7%) | 112 (18.5%) |
| 4 or 5 Rooms | 560 (26.2%) | 254 (41.9%) |
| 6 or 7 Rooms | 875 (40.9%) | 174 (28.7%) |
| 8 or more Rooms | 624 (29.2%) | 66 (10.9%) |
| Total | 2,139 (100.0%) | 606 (100.0%) |
Housing Structure by Heating Type in Surry County
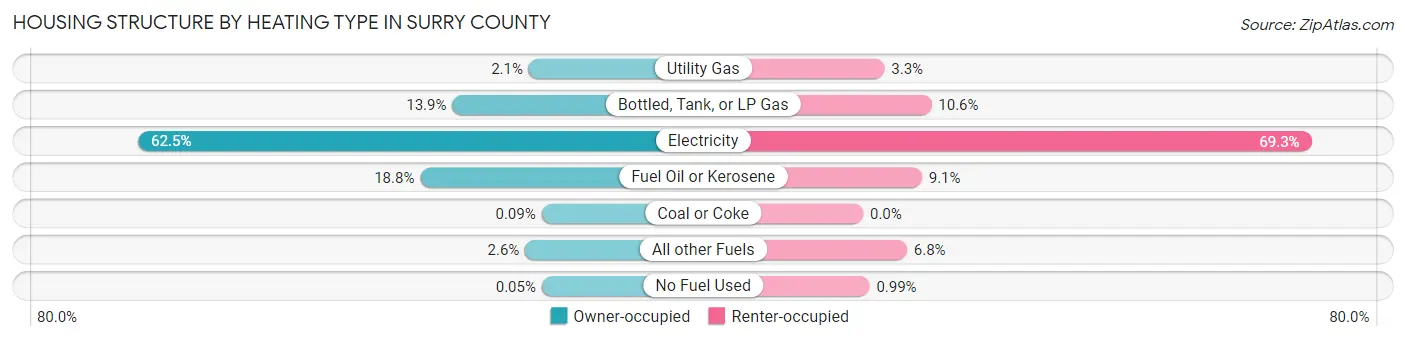
| Heating Type | Owner-occupied | Renter-occupied |
| Utility Gas | 44 (2.1%) | 20 (3.3%) |
| Bottled, Tank, or LP Gas | 297 (13.9%) | 64 (10.6%) |
| Electricity | 1,336 (62.5%) | 420 (69.3%) |
| Fuel Oil or Kerosene | 403 (18.8%) | 55 (9.1%) |
| Coal or Coke | 2 (0.1%) | 0 (0.0%) |
| All other Fuels | 56 (2.6%) | 41 (6.8%) |
| No Fuel Used | 1 (0.1%) | 6 (1.0%) |
| Total | 2,139 (100.0%) | 606 (100.0%) |
Household Vehicle Usage in Surry County
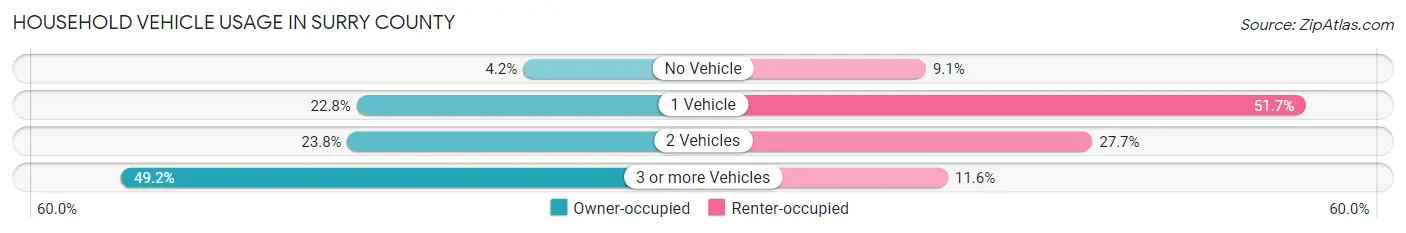
| Vehicles per Household | Owner-occupied | Renter-occupied |
| No Vehicle | 89 (4.2%) | 55 (9.1%) |
| 1 Vehicle | 488 (22.8%) | 313 (51.6%) |
| 2 Vehicles | 510 (23.8%) | 168 (27.7%) |
| 3 or more Vehicles | 1,052 (49.2%) | 70 (11.6%) |
| Total | 2,139 (100.0%) | 606 (100.0%) |
Real Estate & Mortgages in Surry County
Real Estate and Mortgage Overview in Surry County
| Characteristic | Without Mortgage | With Mortgage |
| Housing Units | 939 | 1,200 |
| Median Property Value | $234,400 | $229,800 |
| Median Household Income | $63,750 | $281 |
| Monthly Housing Costs | $439 | $54 |
| Real Estate Taxes | $1,245 | $41 |
Property Value by Mortgage Status in Surry County
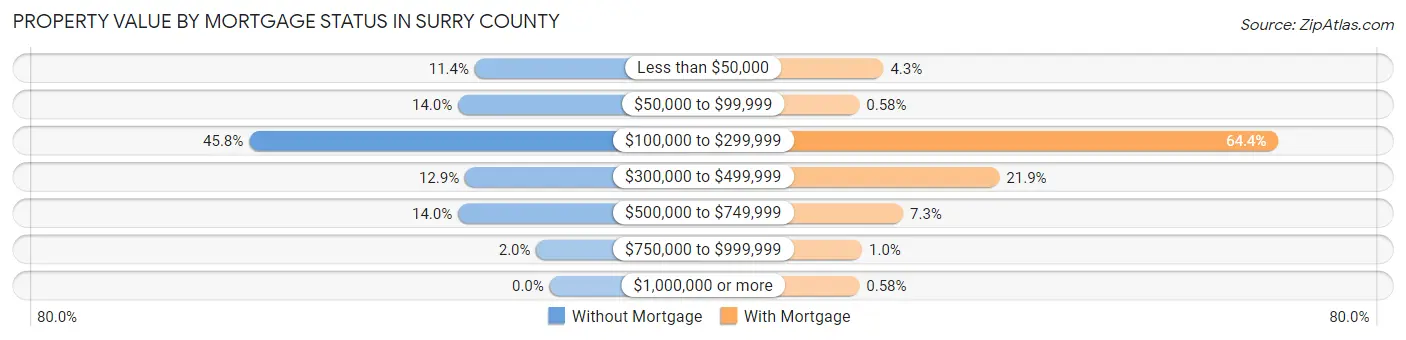
| Property Value | Without Mortgage | With Mortgage |
| Less than $50,000 | 107 (11.4%) | 51 (4.3%) |
| $50,000 to $99,999 | 131 (14.0%) | 7 (0.6%) |
| $100,000 to $299,999 | 430 (45.8%) | 773 (64.4%) |
| $300,000 to $499,999 | 121 (12.9%) | 263 (21.9%) |
| $500,000 to $749,999 | 131 (14.0%) | 87 (7.2%) |
| $750,000 to $999,999 | 19 (2.0%) | 12 (1.0%) |
| $1,000,000 or more | 0 (0.0%) | 7 (0.6%) |
| Total | 939 (100.0%) | 1,200 (100.0%) |
Household Income by Mortgage Status in Surry County
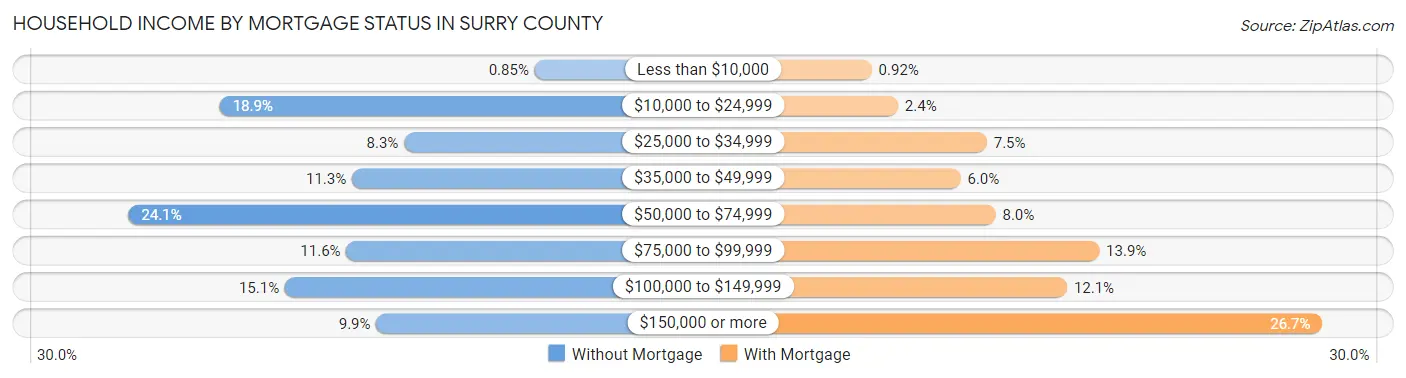
| Household Income | Without Mortgage | With Mortgage |
| Less than $10,000 | 8 (0.9%) | 11 (0.9%) |
| $10,000 to $24,999 | 177 (18.9%) | 29 (2.4%) |
| $25,000 to $34,999 | 78 (8.3%) | 90 (7.5%) |
| $35,000 to $49,999 | 106 (11.3%) | 72 (6.0%) |
| $50,000 to $74,999 | 226 (24.1%) | 96 (8.0%) |
| $75,000 to $99,999 | 109 (11.6%) | 167 (13.9%) |
| $100,000 to $149,999 | 142 (15.1%) | 145 (12.1%) |
| $150,000 or more | 93 (9.9%) | 320 (26.7%) |
| Total | 939 (100.0%) | 1,200 (100.0%) |
Property Value to Household Income Ratio in Surry County
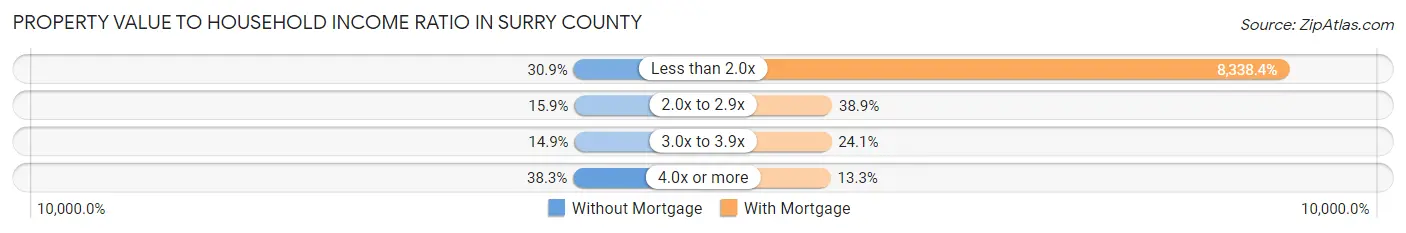
| Value-to-Income Ratio | Without Mortgage | With Mortgage |
| Less than 2.0x | 290 (30.9%) | 100,061 (8,338.4%) |
| 2.0x to 2.9x | 149 (15.9%) | 467 (38.9%) |
| 3.0x to 3.9x | 140 (14.9%) | 289 (24.1%) |
| 4.0x or more | 360 (38.3%) | 159 (13.3%) |
| Total | 939 (100.0%) | 1,200 (100.0%) |
Real Estate Taxes by Mortgage Status in Surry County
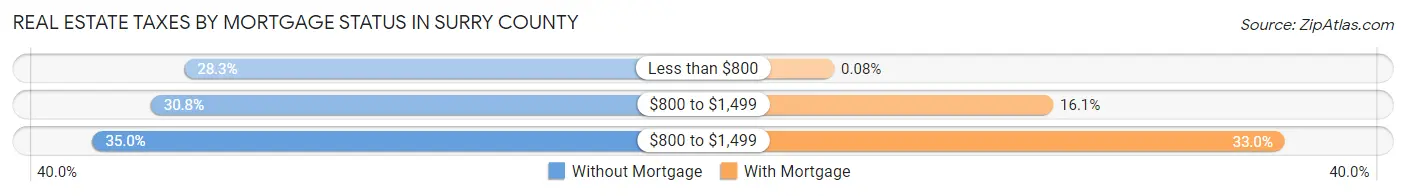
| Property Taxes | Without Mortgage | With Mortgage |
| Less than $800 | 266 (28.3%) | 1 (0.1%) |
| $800 to $1,499 | 289 (30.8%) | 193 (16.1%) |
| $800 to $1,499 | 329 (35.0%) | 396 (33.0%) |
| Total | 939 (100.0%) | 1,200 (100.0%) |
Health & Disability in Surry County
Health Insurance Coverage by Age in Surry County
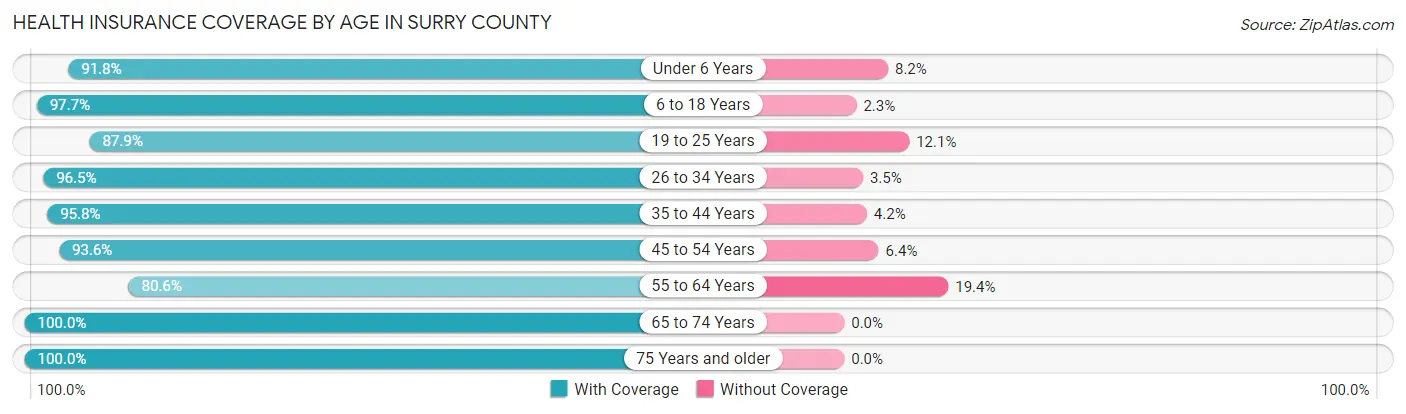
| Age Bracket | With Coverage | Without Coverage |
| Under 6 Years | 349 (91.8%) | 31 (8.2%) |
| 6 to 18 Years | 774 (97.7%) | 18 (2.3%) |
| 19 to 25 Years | 428 (87.9%) | 59 (12.1%) |
| 26 to 34 Years | 582 (96.5%) | 21 (3.5%) |
| 35 to 44 Years | 636 (95.8%) | 28 (4.2%) |
| 45 to 54 Years | 715 (93.6%) | 49 (6.4%) |
| 55 to 64 Years | 1,027 (80.6%) | 247 (19.4%) |
| 65 to 74 Years | 968 (100.0%) | 0 (0.0%) |
| 75 Years and older | 604 (100.0%) | 0 (0.0%) |
| Total | 6,083 (93.1%) | 453 (6.9%) |
Health Insurance Coverage by Citizenship Status in Surry County
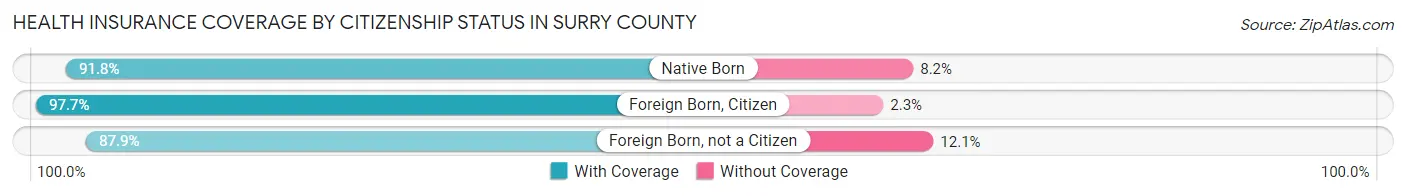
| Citizenship Status | With Coverage | Without Coverage |
| Native Born | 349 (91.8%) | 31 (8.2%) |
| Foreign Born, Citizen | 774 (97.7%) | 18 (2.3%) |
| Foreign Born, not a Citizen | 428 (87.9%) | 59 (12.1%) |
Health Insurance Coverage by Household Income in Surry County
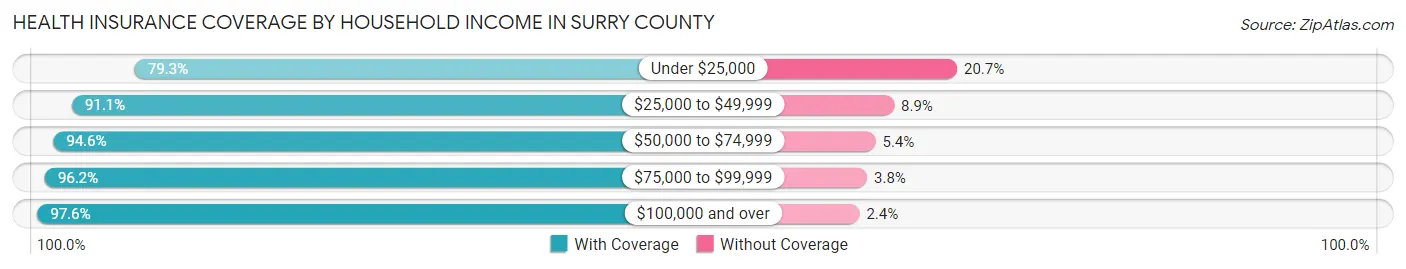
| Household Income | With Coverage | Without Coverage |
| Under $25,000 | 868 (79.3%) | 226 (20.7%) |
| $25,000 to $49,999 | 720 (91.1%) | 70 (8.9%) |
| $50,000 to $74,999 | 1,126 (94.6%) | 64 (5.4%) |
| $75,000 to $99,999 | 708 (96.2%) | 28 (3.8%) |
| $100,000 and over | 2,661 (97.6%) | 65 (2.4%) |
Public vs Private Health Insurance Coverage by Age in Surry County
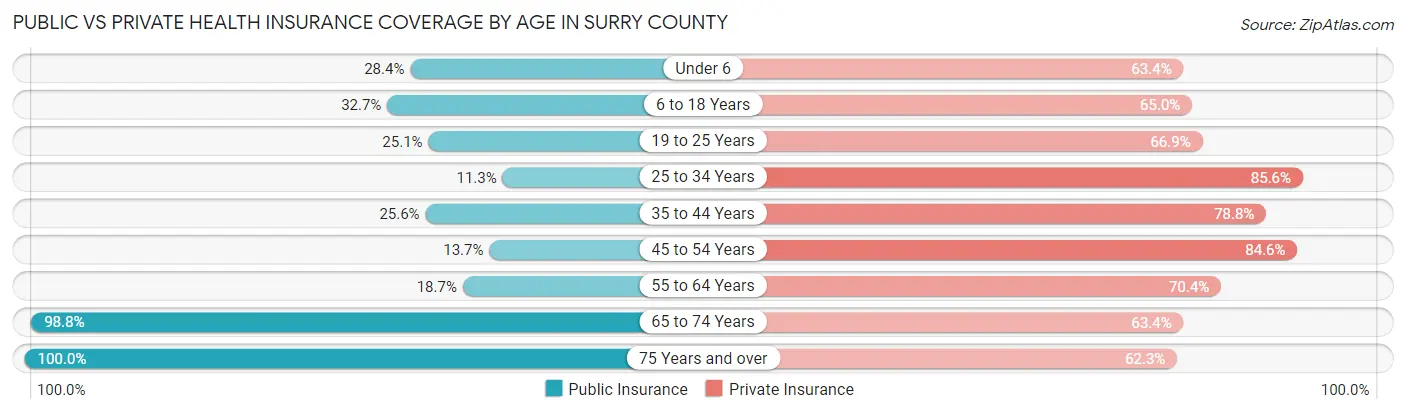
| Age Bracket | Public Insurance | Private Insurance |
| Under 6 | 108 (28.4%) | 241 (63.4%) |
| 6 to 18 Years | 259 (32.7%) | 515 (65.0%) |
| 19 to 25 Years | 122 (25.1%) | 326 (66.9%) |
| 25 to 34 Years | 68 (11.3%) | 516 (85.6%) |
| 35 to 44 Years | 170 (25.6%) | 523 (78.8%) |
| 45 to 54 Years | 105 (13.7%) | 646 (84.6%) |
| 55 to 64 Years | 238 (18.7%) | 897 (70.4%) |
| 65 to 74 Years | 956 (98.8%) | 614 (63.4%) |
| 75 Years and over | 604 (100.0%) | 376 (62.3%) |
| Total | 2,630 (40.2%) | 4,654 (71.2%) |
Disability Status by Sex by Age in Surry County
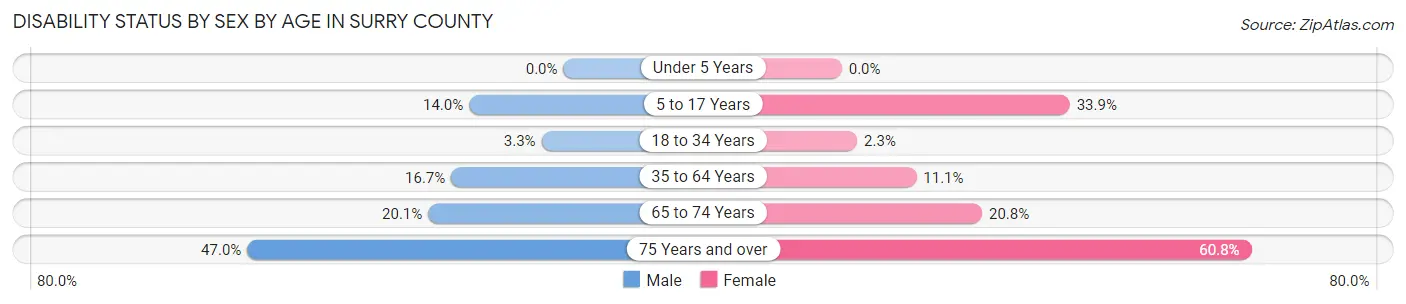
| Age Bracket | Male | Female |
| Under 5 Years | 0 (0.0%) | 0 (0.0%) |
| 5 to 17 Years | 56 (14.0%) | 130 (33.9%) |
| 18 to 34 Years | 19 (3.3%) | 13 (2.3%) |
| 35 to 64 Years | 226 (16.7%) | 149 (11.1%) |
| 65 to 74 Years | 98 (20.1%) | 100 (20.8%) |
| 75 Years and over | 123 (46.9%) | 208 (60.8%) |
Disability Class by Sex by Age in Surry County
Disability Class: Hearing Difficulty
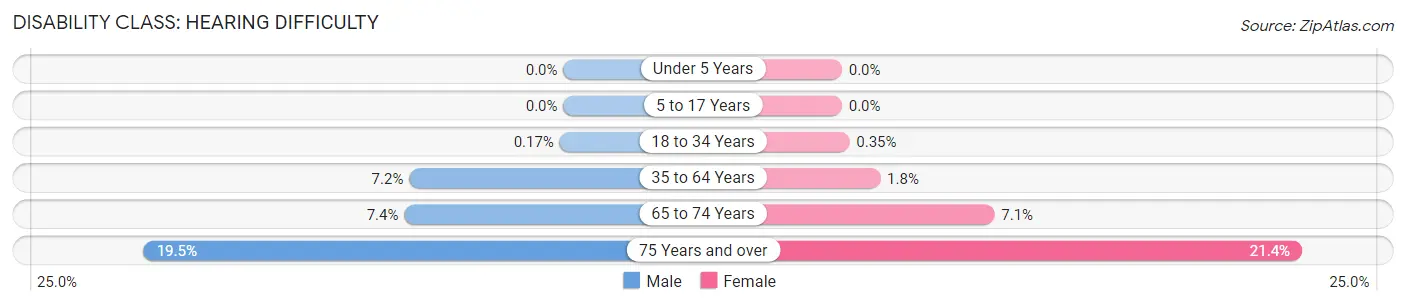
| Age Bracket | Male | Female |
| Under 5 Years | 0 (0.0%) | 0 (0.0%) |
| 5 to 17 Years | 0 (0.0%) | 0 (0.0%) |
| 18 to 34 Years | 1 (0.2%) | 2 (0.4%) |
| 35 to 64 Years | 97 (7.1%) | 24 (1.8%) |
| 65 to 74 Years | 36 (7.4%) | 34 (7.1%) |
| 75 Years and over | 51 (19.5%) | 73 (21.3%) |
Disability Class: Vision Difficulty
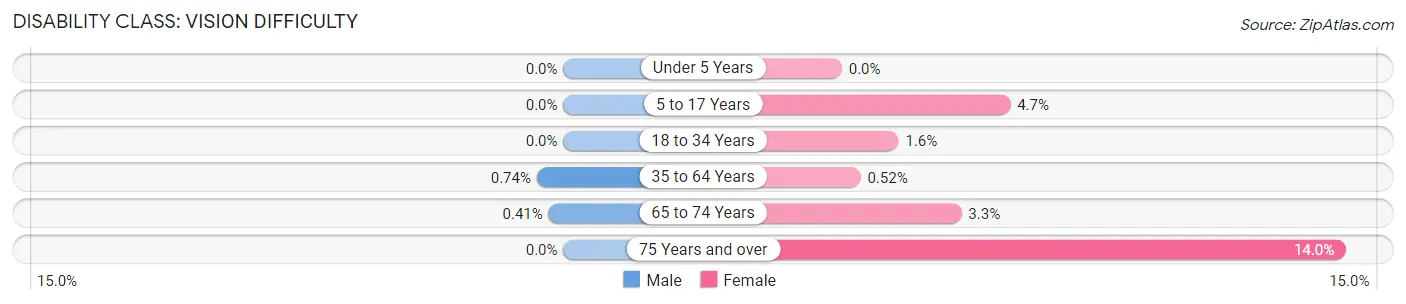
| Age Bracket | Male | Female |
| Under 5 Years | 0 (0.0%) | 0 (0.0%) |
| 5 to 17 Years | 0 (0.0%) | 18 (4.7%) |
| 18 to 34 Years | 0 (0.0%) | 9 (1.6%) |
| 35 to 64 Years | 10 (0.7%) | 7 (0.5%) |
| 65 to 74 Years | 2 (0.4%) | 16 (3.3%) |
| 75 Years and over | 0 (0.0%) | 48 (14.0%) |
Disability Class: Cognitive Difficulty
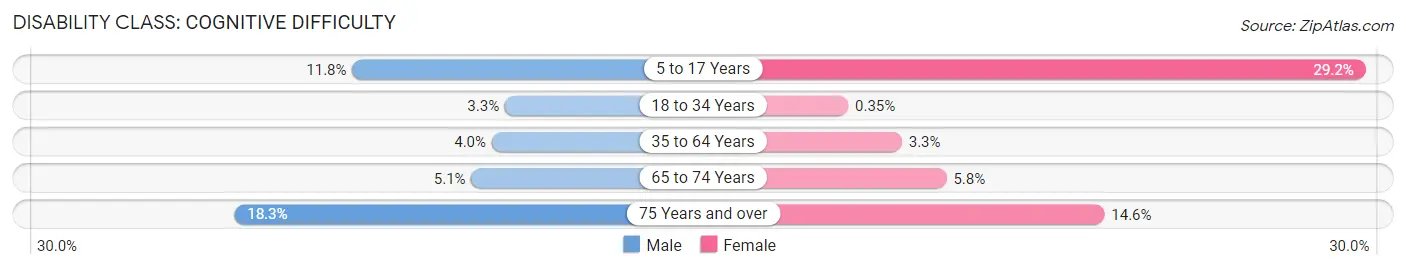
| Age Bracket | Male | Female |
| 5 to 17 Years | 47 (11.7%) | 112 (29.2%) |
| 18 to 34 Years | 19 (3.3%) | 2 (0.4%) |
| 35 to 64 Years | 54 (4.0%) | 45 (3.3%) |
| 65 to 74 Years | 25 (5.1%) | 28 (5.8%) |
| 75 Years and over | 48 (18.3%) | 50 (14.6%) |
Disability Class: Ambulatory Difficulty
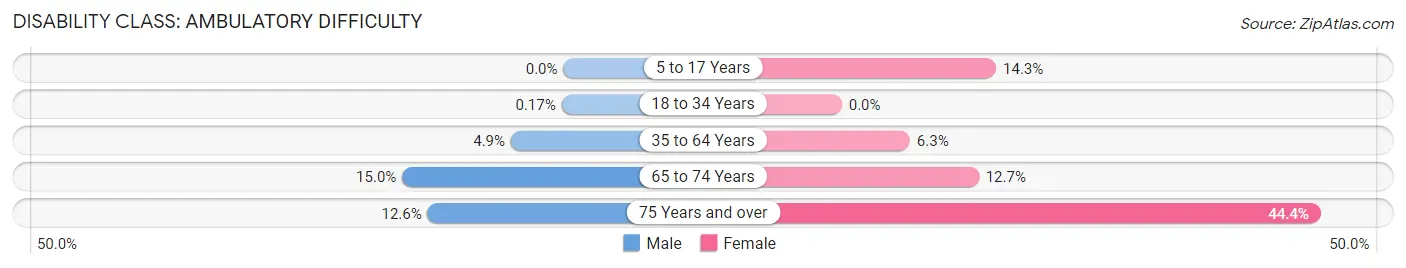
| Age Bracket | Male | Female |
| 5 to 17 Years | 0 (0.0%) | 55 (14.3%) |
| 18 to 34 Years | 1 (0.2%) | 0 (0.0%) |
| 35 to 64 Years | 66 (4.9%) | 85 (6.3%) |
| 65 to 74 Years | 73 (15.0%) | 61 (12.7%) |
| 75 Years and over | 33 (12.6%) | 152 (44.4%) |
Disability Class: Self-Care Difficulty
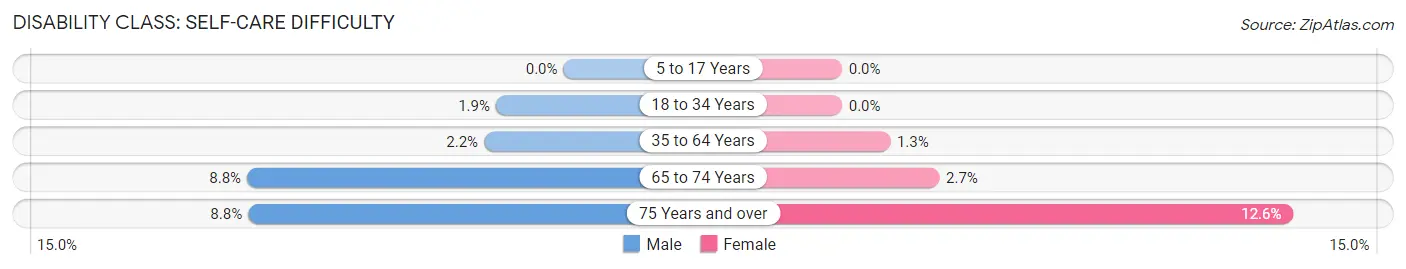
| Age Bracket | Male | Female |
| 5 to 17 Years | 0 (0.0%) | 0 (0.0%) |
| 18 to 34 Years | 11 (1.9%) | 0 (0.0%) |
| 35 to 64 Years | 30 (2.2%) | 18 (1.3%) |
| 65 to 74 Years | 43 (8.8%) | 13 (2.7%) |
| 75 Years and over | 23 (8.8%) | 43 (12.6%) |
Technology Access in Surry County
Computing Device Access in Surry County
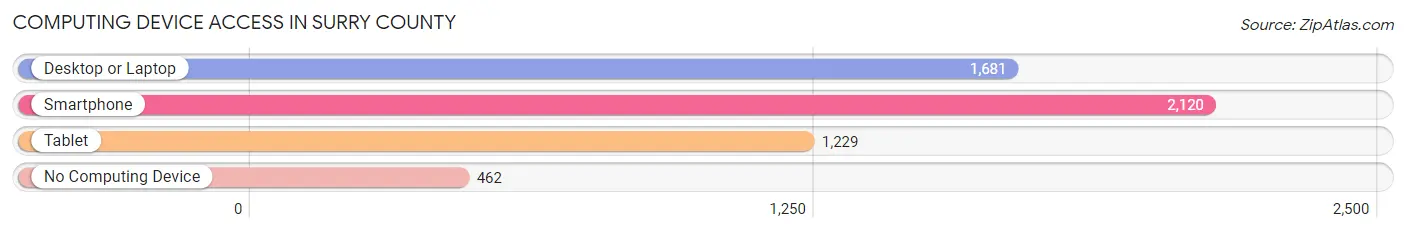
| Device Type | # Households | % Households |
| Desktop or Laptop | 1,681 | 61.2% |
| Smartphone | 2,120 | 77.2% |
| Tablet | 1,229 | 44.8% |
| No Computing Device | 462 | 16.8% |
| Total | 2,745 | 100.0% |
Internet Access in Surry County
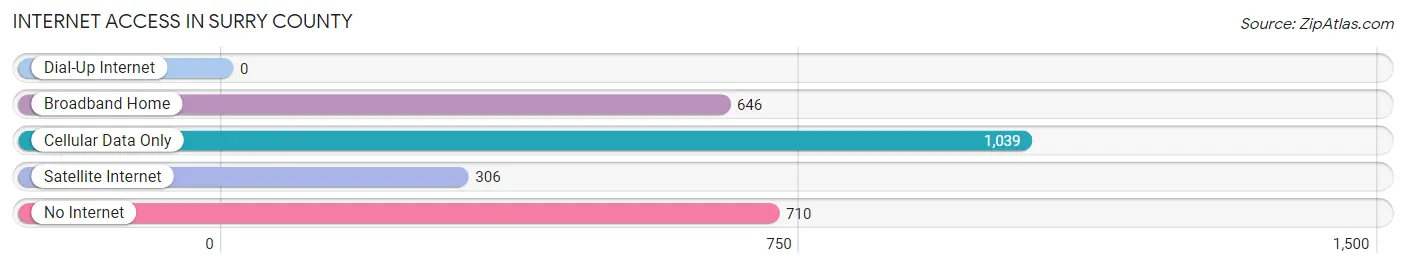
| Internet Type | # Households | % Households |
| Dial-Up Internet | 0 | 0.0% |
| Broadband Home | 646 | 23.5% |
| Cellular Data Only | 1,039 | 37.9% |
| Satellite Internet | 306 | 11.2% |
| No Internet | 710 | 25.9% |
| Total | 2,745 | 100.0% |
Surry County Summary
Surry County, Virginia is located in the southeastern corner of the state, bordered by the James River to the north and the Blackwater River to the south. It is part of the Hampton Roads metropolitan area and is home to approximately 7,000 people. The county seat is Surry, and the county is divided into two townships, Surry and Claremont.
History
Surry County was established in 1652 and is one of the oldest counties in Virginia. It was named after the English county of Surrey, and was originally part of James City County. The county was divided into two townships in 1720, and the county seat was established in Surry in 1732.
Surry County was an important center of the tobacco industry in the 18th and 19th centuries. The county was also home to several prominent families, including the Byrds, the Carters, and the Randolphs.
During the American Civil War, Surry County was the site of several battles, including the Battle of Smithfield and the Battle of Claremont. The county was also the site of the first Confederate victory in Virginia, the Battle of Big Bethel.
Geography
Surry County is located in the southeastern corner of Virginia, bordered by the James River to the north and the Blackwater River to the south. The county is divided into two townships, Surry and Claremont. The county is mostly rural, with the majority of the population living in the towns of Surry and Claremont.
The county is home to several state parks, including Chippokes Plantation State Park, Smithfield Plantation State Park, and the Surry County Historical Society Museum. The county is also home to several historic sites, including Bacon's Castle, the Bacon's Castle Courthouse, and the Surry County Courthouse.
Economy
Surry County is primarily a rural county, and the economy is largely based on agriculture. The county is home to several large farms, including the Byrd Farm, the Carter Farm, and the Randolph Farm. The county is also home to several small businesses, including restaurants, retail stores, and service providers.
The county is home to several large employers, including the Surry County Public Schools, the Surry County Sheriff's Office, and the Surry County Health Department. The county is also home to several manufacturing companies, including the Surry County Glass Company and the Surry County Furniture Company.
Demographics
As of the 2010 census, Surry County had a population of 7,058. The racial makeup of the county was 79.3% White, 17.2% African American, 0.4% Native American, 0.3% Asian, 0.1% Pacific Islander, 1.2% from other races, and 1.5% from two or more races. Hispanic or Latino of any race were 2.7% of the population.
The median income for a household in the county was $41,945, and the median income for a family was $50,945. The per capita income for the county was $20,945. About 11.2% of families and 14.2% of the population were below the poverty line, including 19.2% of those under age 18 and 11.2% of those age 65 or over.
Common Questions
What is Per Capita Income in Surry County?
Per Capita income in Surry County is $36,497.
What is the Median Family Income in Surry County?
Median Family Income in Surry County is $85,750.
What is the Median Household income in Surry County?
Median Household Income in Surry County is $68,655.
What is Income or Wage Gap in Surry County?
Income or Wage Gap in Surry County is 43.9%.
Women in Surry County earn 56.1 cents for every dollar earned by a man.
What is Inequality or Gini Index in Surry County?
Inequality or Gini Index in Surry County is 0.42.
What is the Total Population of Surry County?
Total Population of Surry County is 6,546.
What is the Total Male Population of Surry County?
Total Male Population of Surry County is 3,285.
What is the Total Female Population of Surry County?
Total Female Population of Surry County is 3,261.
What is the Ratio of Males per 100 Females in Surry County?
There are 100.74 Males per 100 Females in Surry County.
What is the Ratio of Females per 100 Males in Surry County?
There are 99.27 Females per 100 Males in Surry County.
What is the Median Population Age in Surry County?
Median Population Age in Surry County is 50.5 Years.
What is the Average Family Size in Surry County
Average Family Size in Surry County is 2.9 People.
What is the Average Household Size in Surry County
Average Household Size in Surry County is 2.4 People.
How Large is the Labor Force in Surry County?
There are 3,358 People in the Labor Forcein in Surry County.
What is the Percentage of People in the Labor Force in Surry County?
60.4% of People are in the Labor Force in Surry County.
What is the Unemployment Rate in Surry County?
Unemployment Rate in Surry County is 6.0%.