Suffolk city, VA Map & Demographics
Suffolk city Map
Suffolk city Overview
$44,004
PER CAPITA INCOME
$105,023
AVG FAMILY INCOME
$87,758
AVG HOUSEHOLD INCOME
33.7%
WAGE / INCOME GAP [ % ]
66.3¢/ $1
WAGE / INCOME GAP [ $ ]
$11,255
FAMILY INCOME DEFICIT
0.45
INEQUALITY / GINI INDEX
94,856
TOTAL POPULATION
46,381
MALE POPULATION
48,475
FEMALE POPULATION
95.68
MALES / 100 FEMALES
104.51
FEMALES / 100 MALES
38.5
MEDIAN AGE
3.1
AVG FAMILY SIZE
2.6
AVG HOUSEHOLD SIZE
49,958
LABOR FORCE [ PEOPLE ]
66.5%
PERCENT IN LABOR FORCE
6.3%
UNEMPLOYMENT RATE
Suffolk city Area Codes
Income in Suffolk city
Income Overview in Suffolk city
Per Capita Income in Suffolk city is $44,004, while median incomes of families and households are $105,023 and $87,758 respectively.
| Characteristic | Number | Measure |
| Per Capita Income | 94,856 | $44,004 |
| Median Family Income | 25,558 | $105,023 |
| Mean Family Income | 25,558 | $127,529 |
| Median Household Income | 36,318 | $87,758 |
| Mean Household Income | 36,318 | $112,379 |
| Income Deficit | 25,558 | $11,255 |
| Wage / Income Gap (%) | 94,856 | 33.65% |
| Wage / Income Gap ($) | 94,856 | 66.35¢ per $1 |
| Gini / Inequality Index | 94,856 | 0.45 |
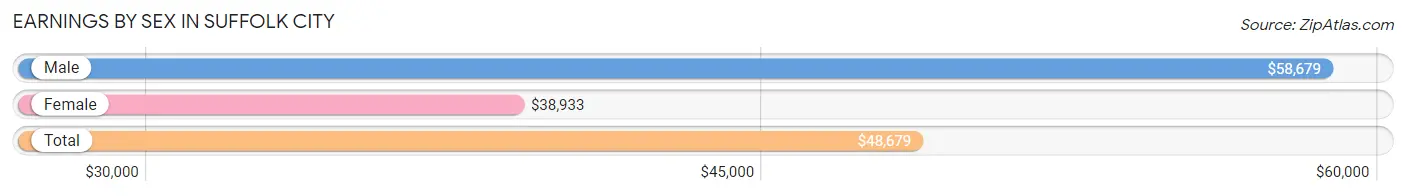
Earnings by Sex in Suffolk city
Average Earnings in Suffolk city are $48,679, $58,679 for men and $38,933 for women, a difference of 33.7%.
| Sex | Number | Average Earnings |
| Male | 26,944 (52.8%) | $58,679 |
| Female | 24,104 (47.2%) | $38,933 |
| Total | 51,048 (100.0%) | $48,679 |
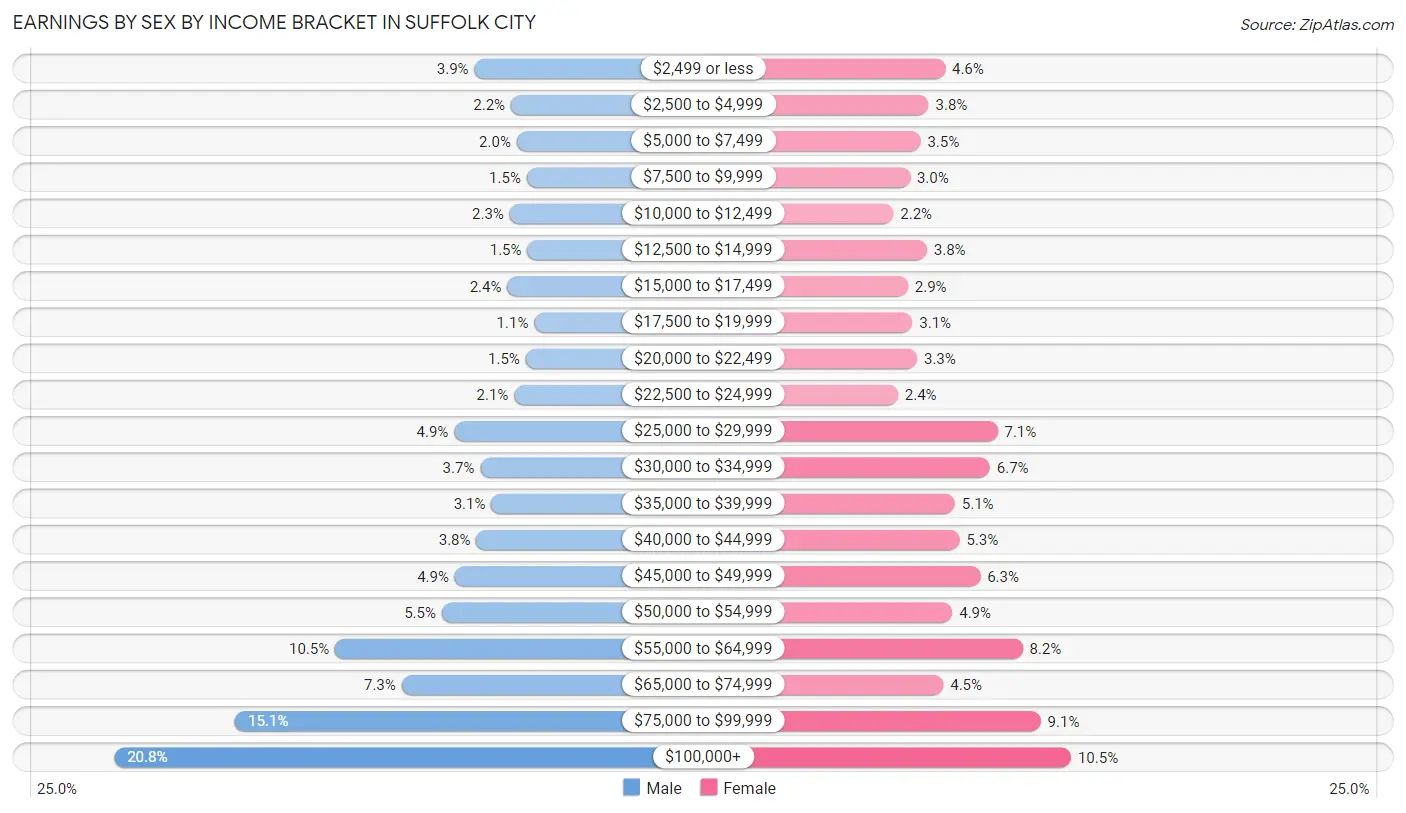
Earnings by Sex by Income Bracket in Suffolk city
The most common earnings brackets in Suffolk city are $100,000+ for men (5,604 | 20.8%) and $100,000+ for women (2,532 | 10.5%).
| Income | Male | Female |
| $2,499 or less | 1,060 (3.9%) | 1,109 (4.6%) |
| $2,500 to $4,999 | 598 (2.2%) | 924 (3.8%) |
| $5,000 to $7,499 | 526 (1.9%) | 832 (3.5%) |
| $7,500 to $9,999 | 398 (1.5%) | 714 (3.0%) |
| $10,000 to $12,499 | 615 (2.3%) | 526 (2.2%) |
| $12,500 to $14,999 | 390 (1.5%) | 903 (3.7%) |
| $15,000 to $17,499 | 644 (2.4%) | 690 (2.9%) |
| $17,500 to $19,999 | 305 (1.1%) | 740 (3.1%) |
| $20,000 to $22,499 | 412 (1.5%) | 793 (3.3%) |
| $22,500 to $24,999 | 557 (2.1%) | 576 (2.4%) |
| $25,000 to $29,999 | 1,314 (4.9%) | 1,701 (7.1%) |
| $30,000 to $34,999 | 986 (3.7%) | 1,614 (6.7%) |
| $35,000 to $39,999 | 846 (3.1%) | 1,219 (5.1%) |
| $40,000 to $44,999 | 1,034 (3.8%) | 1,273 (5.3%) |
| $45,000 to $49,999 | 1,307 (4.9%) | 1,506 (6.2%) |
| $50,000 to $54,999 | 1,471 (5.5%) | 1,190 (4.9%) |
| $55,000 to $64,999 | 2,818 (10.5%) | 1,984 (8.2%) |
| $65,000 to $74,999 | 1,979 (7.3%) | 1,090 (4.5%) |
| $75,000 to $99,999 | 4,080 (15.1%) | 2,188 (9.1%) |
| $100,000+ | 5,604 (20.8%) | 2,532 (10.5%) |
| Total | 26,944 (100.0%) | 24,104 (100.0%) |
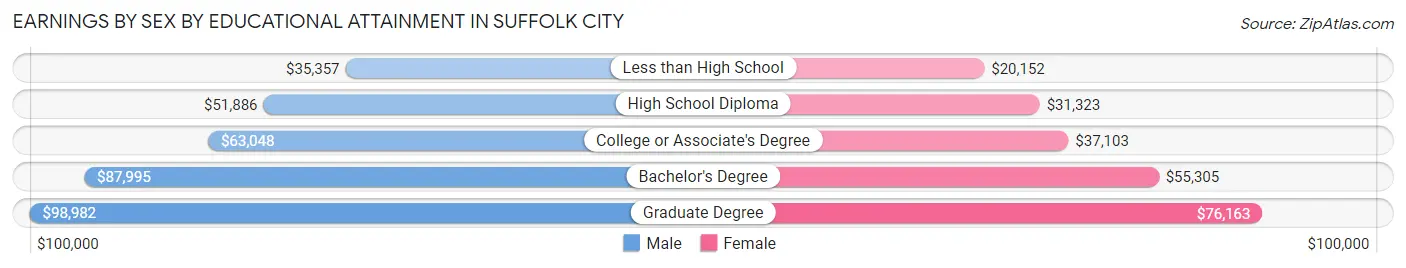
Earnings by Sex by Educational Attainment in Suffolk city
Average earnings in Suffolk city are $64,760 for men and $44,233 for women, a difference of 31.7%. Men with an educational attainment of graduate degree enjoy the highest average annual earnings of $98,982, while those with less than high school education earn the least with $35,357. Women with an educational attainment of graduate degree earn the most with the average annual earnings of $76,163, while those with less than high school education have the smallest earnings of $20,152.
| Educational Attainment | Male Income | Female Income |
| Less than High School | $35,357 | $20,152 |
| High School Diploma | $51,886 | $31,323 |
| College or Associate's Degree | $63,048 | $37,103 |
| Bachelor's Degree | $87,995 | $55,305 |
| Graduate Degree | $98,982 | $76,163 |
| Total | $64,760 | $44,233 |
Family Income in Suffolk city
Family Income Brackets in Suffolk city
According to the Suffolk city family income data, there are 6,313 families falling into the $100,000 to $149,999 income range, which is the most common income bracket and makes up 24.7% of all families. Conversely, the $10,000 to $14,999 income bracket is the least frequent group with only 409 families (1.6%) belonging to this category.
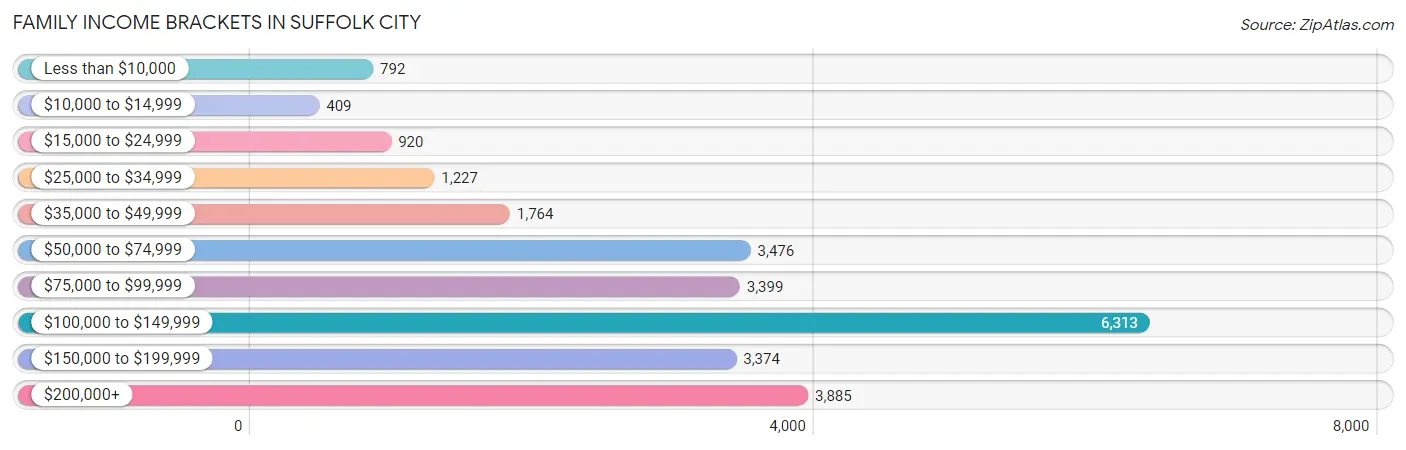
| Income Bracket | # Families | % Families |
| Less than $10,000 | 792 | 3.1% |
| $10,000 to $14,999 | 409 | 1.6% |
| $15,000 to $24,999 | 920 | 3.6% |
| $25,000 to $34,999 | 1,227 | 4.8% |
| $35,000 to $49,999 | 1,764 | 6.9% |
| $50,000 to $74,999 | 3,476 | 13.6% |
| $75,000 to $99,999 | 3,399 | 13.3% |
| $100,000 to $149,999 | 6,313 | 24.7% |
| $150,000 to $199,999 | 3,374 | 13.2% |
| $200,000+ | 3,885 | 15.2% |
Family Income by Famaliy Size in Suffolk city
7+ person families (422 | 1.7%) account for the highest median family income in Suffolk city with $128,986 per family, while 2-person families (11,444 | 44.8%) have the highest median income of $48,994 per family member.
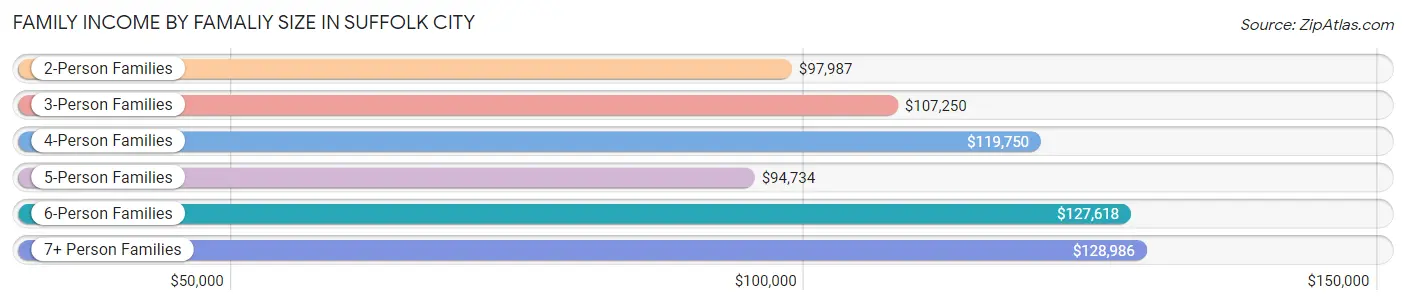
| Income Bracket | # Families | Median Income |
| 2-Person Families | 11,444 (44.8%) | $97,987 |
| 3-Person Families | 5,962 (23.3%) | $107,250 |
| 4-Person Families | 4,622 (18.1%) | $119,750 |
| 5-Person Families | 2,253 (8.8%) | $94,734 |
| 6-Person Families | 855 (3.4%) | $127,618 |
| 7+ Person Families | 422 (1.7%) | $128,986 |
| Total | 25,558 (100.0%) | $105,023 |
Family Income by Number of Earners in Suffolk city
The median family income in Suffolk city is $105,023, with families comprising 3+ earners (3,306) having the highest median family income of $152,089, while families with no earners (3,353) have the lowest median family income of $56,434, accounting for 12.9% and 13.1% of families, respectively.
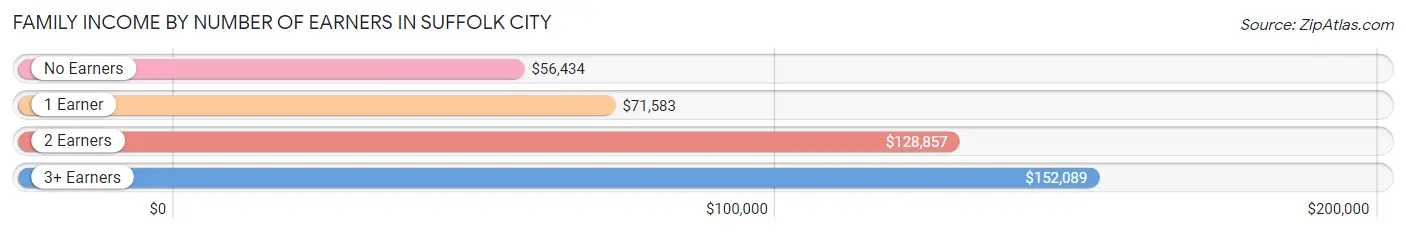
| Number of Earners | # Families | Median Income |
| No Earners | 3,353 (13.1%) | $56,434 |
| 1 Earner | 8,277 (32.4%) | $71,583 |
| 2 Earners | 10,622 (41.6%) | $128,857 |
| 3+ Earners | 3,306 (12.9%) | $152,089 |
| Total | 25,558 (100.0%) | $105,023 |
Household Income in Suffolk city
Household Income Brackets in Suffolk city
With 7,699 households falling in the category, the $100,000 to $149,999 income range is the most frequent in Suffolk city, accounting for 21.2% of all households. In contrast, only 1,162 households (3.2%) fall into the $10,000 to $14,999 income bracket, making it the least populous group.
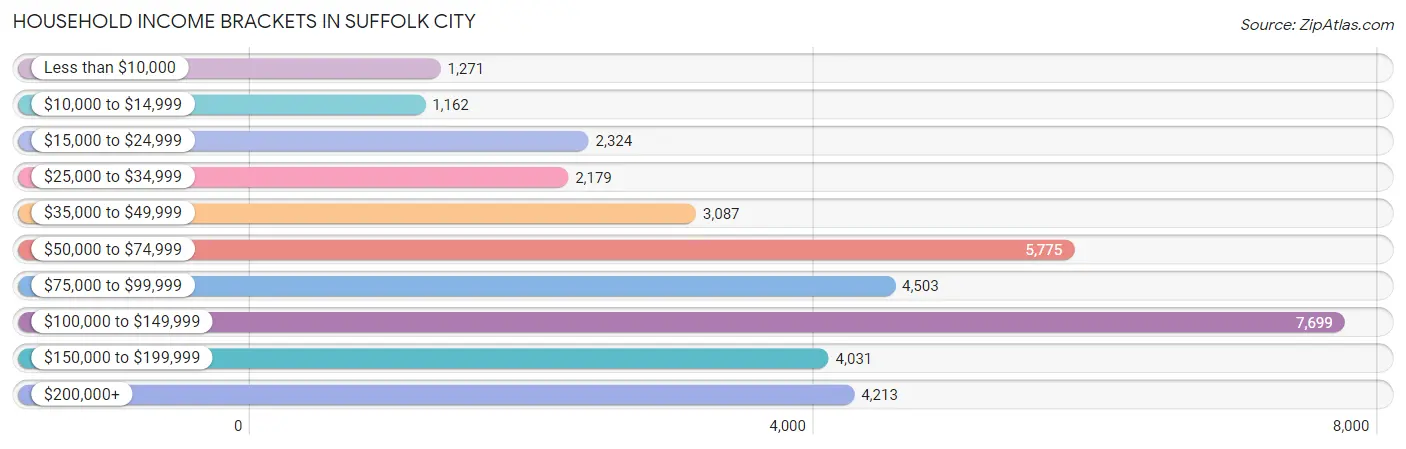
| Income Bracket | # Households | % Households |
| Less than $10,000 | 1,271 | 3.5% |
| $10,000 to $14,999 | 1,162 | 3.2% |
| $15,000 to $24,999 | 2,324 | 6.4% |
| $25,000 to $34,999 | 2,179 | 6.0% |
| $35,000 to $49,999 | 3,087 | 8.5% |
| $50,000 to $74,999 | 5,775 | 15.9% |
| $75,000 to $99,999 | 4,503 | 12.4% |
| $100,000 to $149,999 | 7,699 | 21.2% |
| $150,000 to $199,999 | 4,031 | 11.1% |
| $200,000+ | 4,213 | 11.6% |
Household Income by Householder Age in Suffolk city
The median household income in Suffolk city is $87,758, with the highest median household income of $113,544 found in the 45 to 64 years age bracket for the primary householder. A total of 14,262 households (39.3%) fall into this category. Meanwhile, the 15 to 24 years age bracket for the primary householder has the lowest median household income of $58,932, with 959 households (2.6%) in this group.
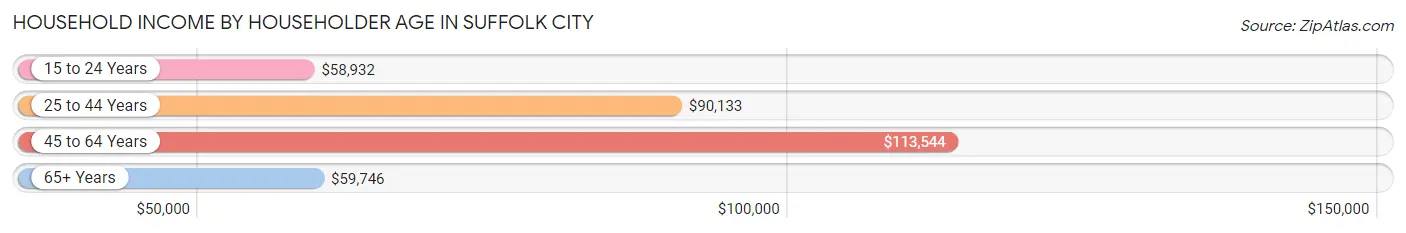
| Income Bracket | # Households | Median Income |
| 15 to 24 Years | 959 (2.6%) | $58,932 |
| 25 to 44 Years | 12,119 (33.4%) | $90,133 |
| 45 to 64 Years | 14,262 (39.3%) | $113,544 |
| 65+ Years | 8,978 (24.7%) | $59,746 |
| Total | 36,318 (100.0%) | $87,758 |
Poverty in Suffolk city
Income Below Poverty by Sex and Age in Suffolk city
With 8.1% poverty level for males and 10.7% for females among the residents of Suffolk city, under 5 year old males and 15 year old females are the most vulnerable to poverty, with 632 males (21.2%) and 156 females (24.4%) in their respective age groups living below the poverty level.
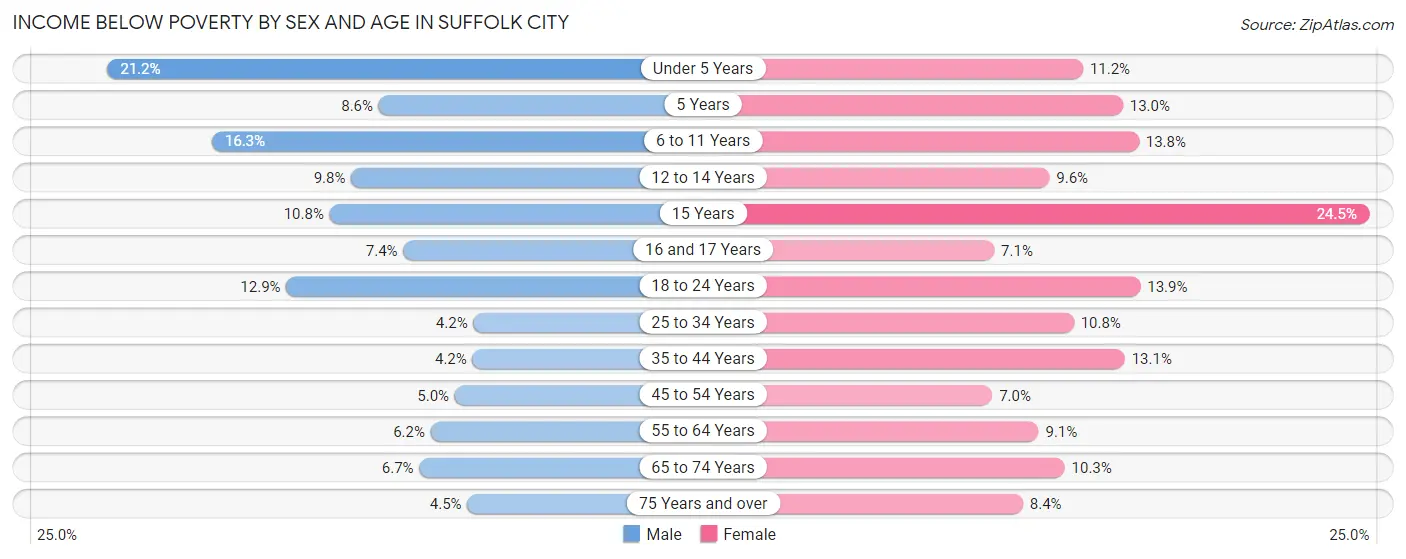
| Age Bracket | Male | Female |
| Under 5 Years | 632 (21.2%) | 328 (11.2%) |
| 5 Years | 56 (8.6%) | 75 (13.0%) |
| 6 to 11 Years | 593 (16.3%) | 476 (13.8%) |
| 12 to 14 Years | 209 (9.8%) | 192 (9.6%) |
| 15 Years | 48 (10.8%) | 156 (24.4%) |
| 16 and 17 Years | 103 (7.4%) | 91 (7.1%) |
| 18 to 24 Years | 524 (12.9%) | 510 (13.9%) |
| 25 to 34 Years | 255 (4.2%) | 695 (10.8%) |
| 35 to 44 Years | 261 (4.2%) | 845 (13.1%) |
| 45 to 54 Years | 296 (5.0%) | 447 (7.0%) |
| 55 to 64 Years | 387 (6.1%) | 600 (9.1%) |
| 65 to 74 Years | 265 (6.7%) | 452 (10.3%) |
| 75 Years and over | 95 (4.4%) | 277 (8.4%) |
| Total | 3,724 (8.1%) | 5,144 (10.7%) |
Income Above Poverty by Sex and Age in Suffolk city
According to the poverty statistics in Suffolk city, males aged 25 to 34 years and females aged 45 to 54 years are the age groups that are most secure financially, with 95.8% of males and 93.0% of females in these age groups living above the poverty line.
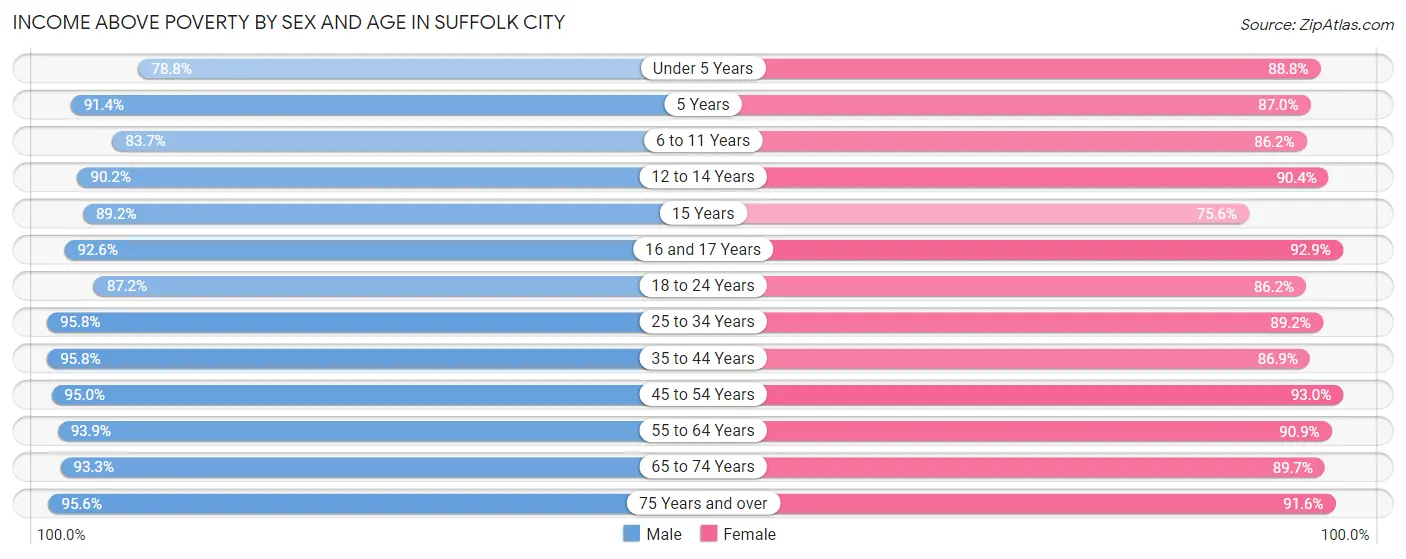
| Age Bracket | Male | Female |
| Under 5 Years | 2,355 (78.8%) | 2,603 (88.8%) |
| 5 Years | 598 (91.4%) | 500 (87.0%) |
| 6 to 11 Years | 3,043 (83.7%) | 2,979 (86.2%) |
| 12 to 14 Years | 1,915 (90.2%) | 1,802 (90.4%) |
| 15 Years | 395 (89.2%) | 482 (75.5%) |
| 16 and 17 Years | 1,286 (92.6%) | 1,196 (92.9%) |
| 18 to 24 Years | 3,555 (87.2%) | 3,171 (86.2%) |
| 25 to 34 Years | 5,865 (95.8%) | 5,763 (89.2%) |
| 35 to 44 Years | 5,933 (95.8%) | 5,589 (86.9%) |
| 45 to 54 Years | 5,585 (95.0%) | 5,953 (93.0%) |
| 55 to 64 Years | 5,907 (93.9%) | 5,971 (90.9%) |
| 65 to 74 Years | 3,701 (93.3%) | 3,918 (89.7%) |
| 75 Years and over | 2,039 (95.6%) | 3,021 (91.6%) |
| Total | 42,177 (91.9%) | 42,948 (89.3%) |
Income Below Poverty Among Married-Couple Families in Suffolk city
The poverty statistics for married-couple families in Suffolk city show that 2.5% or 461 of the total 18,569 families live below the poverty line. Families with 1 or 2 children have the highest poverty rate of 3.4%, comprising of 192 families. On the other hand, families with 5 or more children have the lowest poverty rate of 0.5%, which includes 1 families.
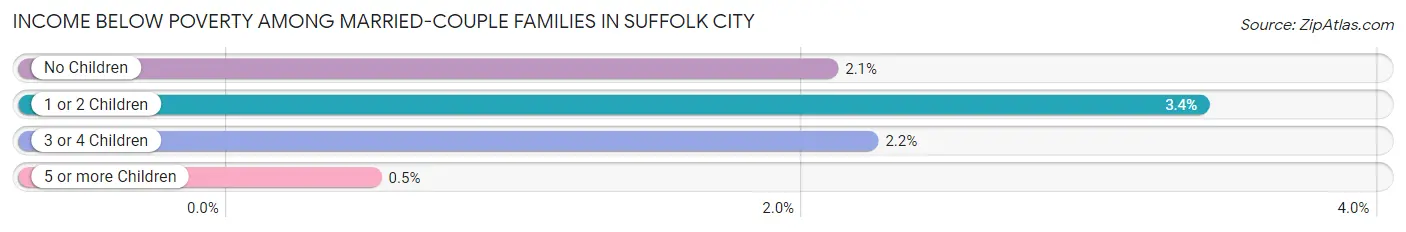
| Children | Above Poverty | Below Poverty |
| No Children | 10,712 (97.9%) | 229 (2.1%) |
| 1 or 2 Children | 5,488 (96.6%) | 192 (3.4%) |
| 3 or 4 Children | 1,708 (97.8%) | 39 (2.2%) |
| 5 or more Children | 200 (99.5%) | 1 (0.5%) |
| Total | 18,108 (97.5%) | 461 (2.5%) |
Income Below Poverty Among Single-Parent Households in Suffolk city
According to the poverty data in Suffolk city, 12.0% or 206 single-father households and 23.6% or 1,244 single-mother households are living below the poverty line. Among single-father households, those with 3 or 4 children have the highest poverty rate, with 29 households (26.4%) experiencing poverty. Likewise, among single-mother households, those with 3 or 4 children have the highest poverty rate, with 357 households (65.9%) falling below the poverty line.
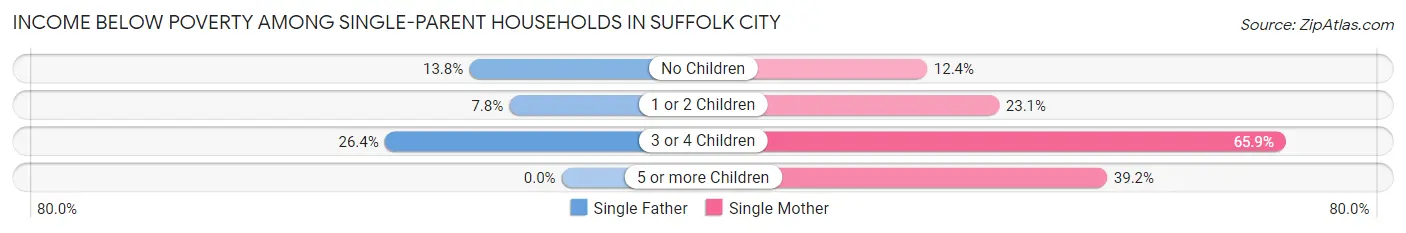
| Children | Single Father | Single Mother |
| No Children | 125 (13.8%) | 247 (12.4%) |
| 1 or 2 Children | 52 (7.8%) | 620 (23.1%) |
| 3 or 4 Children | 29 (26.4%) | 357 (65.9%) |
| 5 or more Children | 0 (0.0%) | 20 (39.2%) |
| Total | 206 (12.0%) | 1,244 (23.6%) |
Income Below Poverty Among Married-Couple vs Single-Parent Households in Suffolk city
The poverty data for Suffolk city shows that 461 of the married-couple family households (2.5%) and 1,450 of the single-parent households (20.7%) are living below the poverty level. Within the married-couple family households, those with 1 or 2 children have the highest poverty rate, with 192 households (3.4%) falling below the poverty line. Among the single-parent households, those with 3 or 4 children have the highest poverty rate, with 386 household (59.2%) living below poverty.
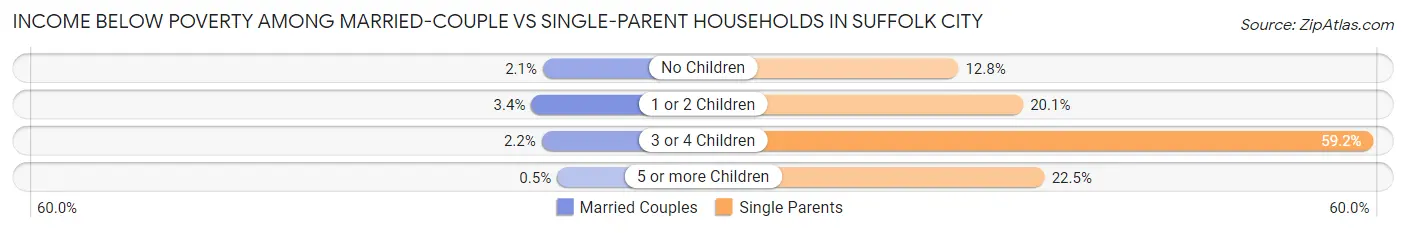
| Children | Married-Couple Families | Single-Parent Households |
| No Children | 229 (2.1%) | 372 (12.8%) |
| 1 or 2 Children | 192 (3.4%) | 672 (20.1%) |
| 3 or 4 Children | 39 (2.2%) | 386 (59.2%) |
| 5 or more Children | 1 (0.5%) | 20 (22.5%) |
| Total | 461 (2.5%) | 1,450 (20.7%) |
Race in Suffolk city
The most populous races in Suffolk city are White / Caucasian (46,146 | 48.6%), Black / African American (39,413 | 41.5%), and Two or more Races (5,583 | 5.9%).
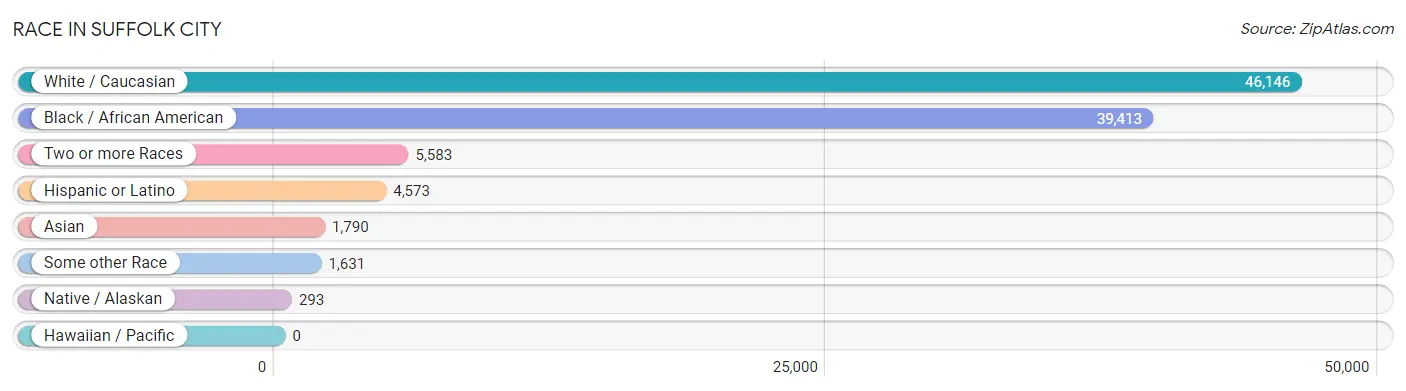
| Race | # Population | % Population |
| Asian | 1,790 | 1.9% |
| Black / African American | 39,413 | 41.5% |
| Hawaiian / Pacific | 0 | 0.0% |
| Hispanic or Latino | 4,573 | 4.8% |
| Native / Alaskan | 293 | 0.3% |
| White / Caucasian | 46,146 | 48.6% |
| Two or more Races | 5,583 | 5.9% |
| Some other Race | 1,631 | 1.7% |
| Total | 94,856 | 100.0% |
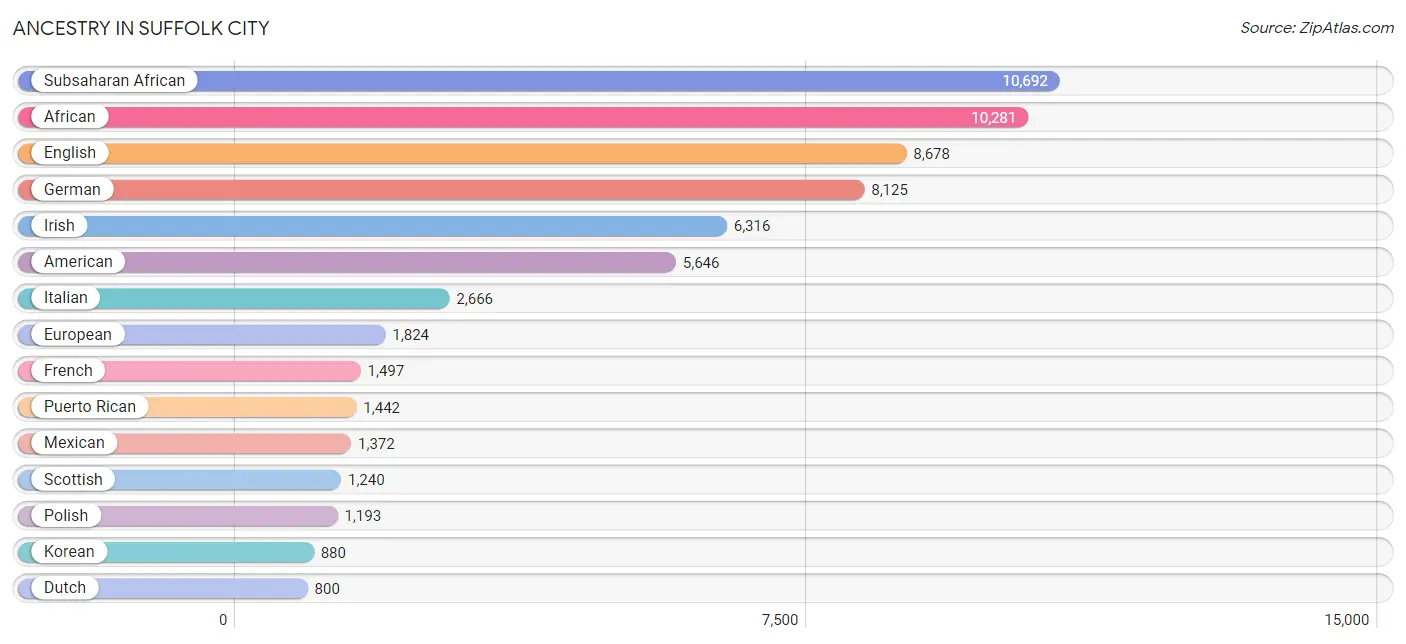
Ancestry in Suffolk city
The most populous ancestries reported in Suffolk city are Subsaharan African (10,692 | 11.3%), African (10,281 | 10.8%), English (8,678 | 9.1%), German (8,125 | 8.6%), and Irish (6,316 | 6.7%), together accounting for 46.5% of all Suffolk city residents.
| Ancestry | # Population | % Population |
| African | 10,281 | 10.8% |
| American | 5,646 | 5.9% |
| Apache | 54 | 0.1% |
| Arab | 259 | 0.3% |
| Armenian | 7 | 0.0% |
| Australian | 8 | 0.0% |
| Austrian | 34 | 0.0% |
| Barbadian | 16 | 0.0% |
| Belizean | 16 | 0.0% |
| Bhutanese | 152 | 0.2% |
| Blackfeet | 129 | 0.1% |
| Bolivian | 57 | 0.1% |
| Brazilian | 26 | 0.0% |
| British | 502 | 0.5% |
| British West Indian | 8 | 0.0% |
| Burmese | 434 | 0.5% |
| Cajun | 4 | 0.0% |
| Canadian | 77 | 0.1% |
| Cape Verdean | 14 | 0.0% |
| Celtic | 7 | 0.0% |
| Central American | 482 | 0.5% |
| Central American Indian | 54 | 0.1% |
| Cherokee | 518 | 0.5% |
| Chickasaw | 4 | 0.0% |
| Chilean | 44 | 0.1% |
| Chippewa | 5 | 0.0% |
| Choctaw | 25 | 0.0% |
| Colombian | 35 | 0.0% |
| Creek | 44 | 0.1% |
| Croatian | 21 | 0.0% |
| Cuban | 98 | 0.1% |
| Czech | 67 | 0.1% |
| Czechoslovakian | 33 | 0.0% |
| Danish | 188 | 0.2% |
| Delaware | 11 | 0.0% |
| Dominican | 493 | 0.5% |
| Dutch | 800 | 0.8% |
| Eastern European | 106 | 0.1% |
| Ecuadorian | 21 | 0.0% |
| Egyptian | 79 | 0.1% |
| English | 8,678 | 9.1% |
| Estonian | 16 | 0.0% |
| Ethiopian | 226 | 0.2% |
| European | 1,824 | 1.9% |
| Filipino | 23 | 0.0% |
| Finnish | 147 | 0.2% |
| French | 1,497 | 1.6% |
| French Canadian | 348 | 0.4% |
| German | 8,125 | 8.6% |
| Ghanaian | 86 | 0.1% |
| Greek | 297 | 0.3% |
| Guatemalan | 10 | 0.0% |
| Guyanese | 14 | 0.0% |
| Haitian | 120 | 0.1% |
| Honduran | 57 | 0.1% |
| Hungarian | 90 | 0.1% |
| Indian (Asian) | 131 | 0.1% |
| Iranian | 11 | 0.0% |
| Irish | 6,316 | 6.7% |
| Italian | 2,666 | 2.8% |
| Jamaican | 387 | 0.4% |
| Japanese | 11 | 0.0% |
| Korean | 880 | 0.9% |
| Laotian | 6 | 0.0% |
| Latvian | 7 | 0.0% |
| Lebanese | 18 | 0.0% |
| Lithuanian | 42 | 0.0% |
| Lumbee | 34 | 0.0% |
| Menominee | 4 | 0.0% |
| Mexican | 1,372 | 1.5% |
| Mexican American Indian | 255 | 0.3% |
| Moroccan | 25 | 0.0% |
| Native Hawaiian | 9 | 0.0% |
| Navajo | 5 | 0.0% |
| Nicaraguan | 73 | 0.1% |
| Nigerian | 11 | 0.0% |
| Northern European | 67 | 0.1% |
| Norwegian | 505 | 0.5% |
| Pakistani | 154 | 0.2% |
| Palestinian | 16 | 0.0% |
| Panamanian | 27 | 0.0% |
| Pennsylvania German | 102 | 0.1% |
| Peruvian | 44 | 0.1% |
| Polish | 1,193 | 1.3% |
| Portuguese | 226 | 0.2% |
| Potawatomi | 2 | 0.0% |
| Puerto Rican | 1,442 | 1.5% |
| Romanian | 35 | 0.0% |
| Russian | 179 | 0.2% |
| Salvadoran | 315 | 0.3% |
| Samoan | 26 | 0.0% |
| Scandinavian | 235 | 0.3% |
| Scotch-Irish | 750 | 0.8% |
| Scottish | 1,240 | 1.3% |
| Seminole | 24 | 0.0% |
| Sioux | 4 | 0.0% |
| Slavic | 34 | 0.0% |
| Slovak | 112 | 0.1% |
| Slovene | 10 | 0.0% |
| South African | 20 | 0.0% |
| South American | 235 | 0.3% |
| Spaniard | 138 | 0.2% |
| Spanish | 41 | 0.0% |
| Spanish American | 6 | 0.0% |
| Sri Lankan | 379 | 0.4% |
| Subsaharan African | 10,692 | 11.3% |
| Swedish | 726 | 0.8% |
| Swiss | 159 | 0.2% |
| Syrian | 104 | 0.1% |
| Thai | 378 | 0.4% |
| Trinidadian and Tobagonian | 131 | 0.1% |
| Ukrainian | 113 | 0.1% |
| Uruguayan | 34 | 0.0% |
| Vietnamese | 170 | 0.2% |
| Welsh | 544 | 0.6% |
| West Indian | 42 | 0.0% |
| Yaqui | 9 | 0.0% |
| Yugoslavian | 67 | 0.1% | View All 118 Rows |
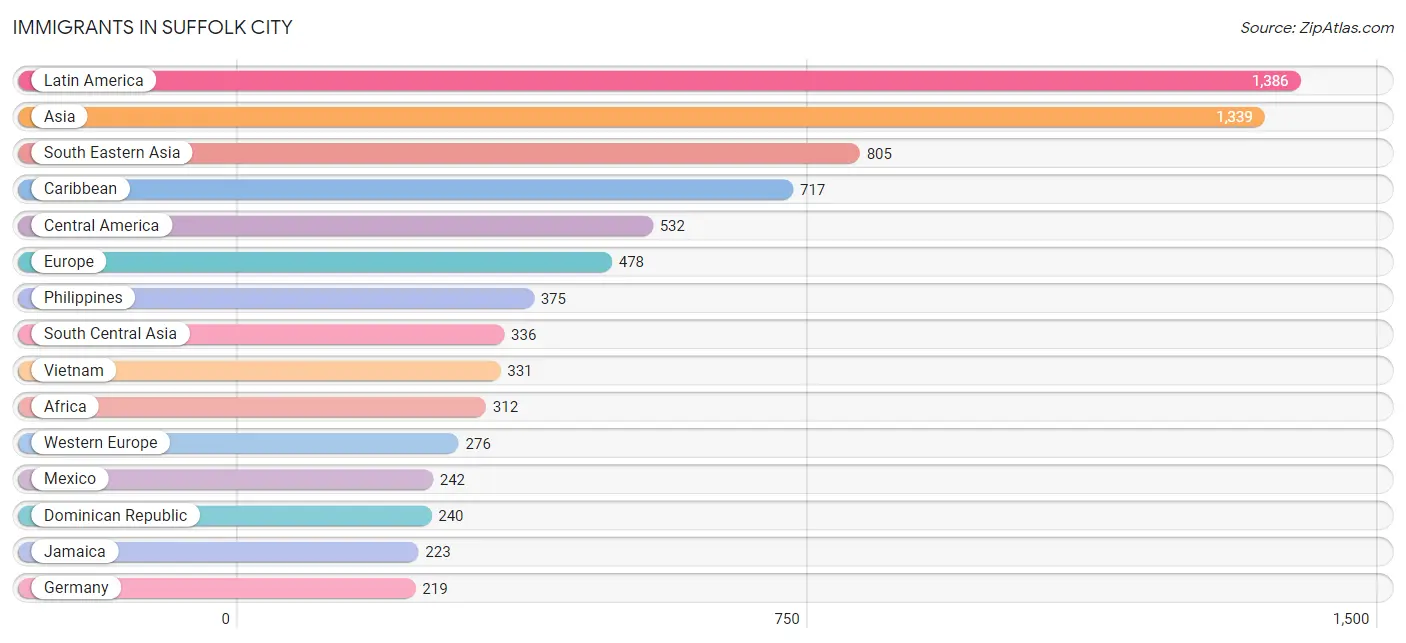
Immigrants in Suffolk city
The most numerous immigrant groups reported in Suffolk city came from Latin America (1,386 | 1.5%), Asia (1,339 | 1.4%), South Eastern Asia (805 | 0.9%), Caribbean (717 | 0.8%), and Central America (532 | 0.6%), together accounting for 5.0% of all Suffolk city residents.
| Immigration Origin | # Population | % Population |
| Afghanistan | 4 | 0.0% |
| Africa | 312 | 0.3% |
| Asia | 1,339 | 1.4% |
| Bangladesh | 170 | 0.2% |
| Barbados | 16 | 0.0% |
| Belgium | 16 | 0.0% |
| Belize | 12 | 0.0% |
| Bolivia | 37 | 0.0% |
| Brazil | 21 | 0.0% |
| Cambodia | 11 | 0.0% |
| Canada | 138 | 0.2% |
| Caribbean | 717 | 0.8% |
| Central America | 532 | 0.6% |
| China | 34 | 0.0% |
| Colombia | 18 | 0.0% |
| Cuba | 4 | 0.0% |
| Dominican Republic | 240 | 0.3% |
| Eastern Africa | 209 | 0.2% |
| Eastern Asia | 174 | 0.2% |
| Eastern Europe | 64 | 0.1% |
| Ecuador | 12 | 0.0% |
| Egypt | 28 | 0.0% |
| El Salvador | 215 | 0.2% |
| England | 41 | 0.0% |
| Ethiopia | 166 | 0.2% |
| Europe | 478 | 0.5% |
| France | 9 | 0.0% |
| Germany | 219 | 0.2% |
| Ghana | 56 | 0.1% |
| Greece | 18 | 0.0% |
| Guatemala | 10 | 0.0% |
| Guyana | 14 | 0.0% |
| Haiti | 78 | 0.1% |
| Honduras | 19 | 0.0% |
| Hong Kong | 10 | 0.0% |
| India | 55 | 0.1% |
| Iran | 9 | 0.0% |
| Iraq | 6 | 0.0% |
| Ireland | 8 | 0.0% |
| Italy | 14 | 0.0% |
| Jamaica | 223 | 0.2% |
| Japan | 43 | 0.1% |
| Jordan | 10 | 0.0% |
| Korea | 97 | 0.1% |
| Latin America | 1,386 | 1.5% |
| Lithuania | 4 | 0.0% |
| Mexico | 242 | 0.3% |
| Nepal | 33 | 0.0% |
| Netherlands | 24 | 0.0% |
| Nicaragua | 21 | 0.0% |
| Northern Africa | 28 | 0.0% |
| Northern Europe | 106 | 0.1% |
| Pakistan | 50 | 0.1% |
| Panama | 13 | 0.0% |
| Peru | 21 | 0.0% |
| Philippines | 375 | 0.4% |
| Romania | 12 | 0.0% |
| Russia | 42 | 0.0% |
| Scotland | 25 | 0.0% |
| South Africa | 19 | 0.0% |
| South America | 137 | 0.1% |
| South Central Asia | 336 | 0.4% |
| South Eastern Asia | 805 | 0.9% |
| Southern Europe | 32 | 0.0% |
| Sri Lanka | 8 | 0.0% |
| St. Vincent and the Grenadines | 37 | 0.0% |
| Switzerland | 8 | 0.0% |
| Thailand | 80 | 0.1% |
| Trinidad and Tobago | 72 | 0.1% |
| Ukraine | 6 | 0.0% |
| Uruguay | 14 | 0.0% |
| Vietnam | 331 | 0.4% |
| Western Africa | 56 | 0.1% |
| Western Asia | 24 | 0.0% |
| Western Europe | 276 | 0.3% |
| Zimbabwe | 4 | 0.0% | View All 76 Rows |
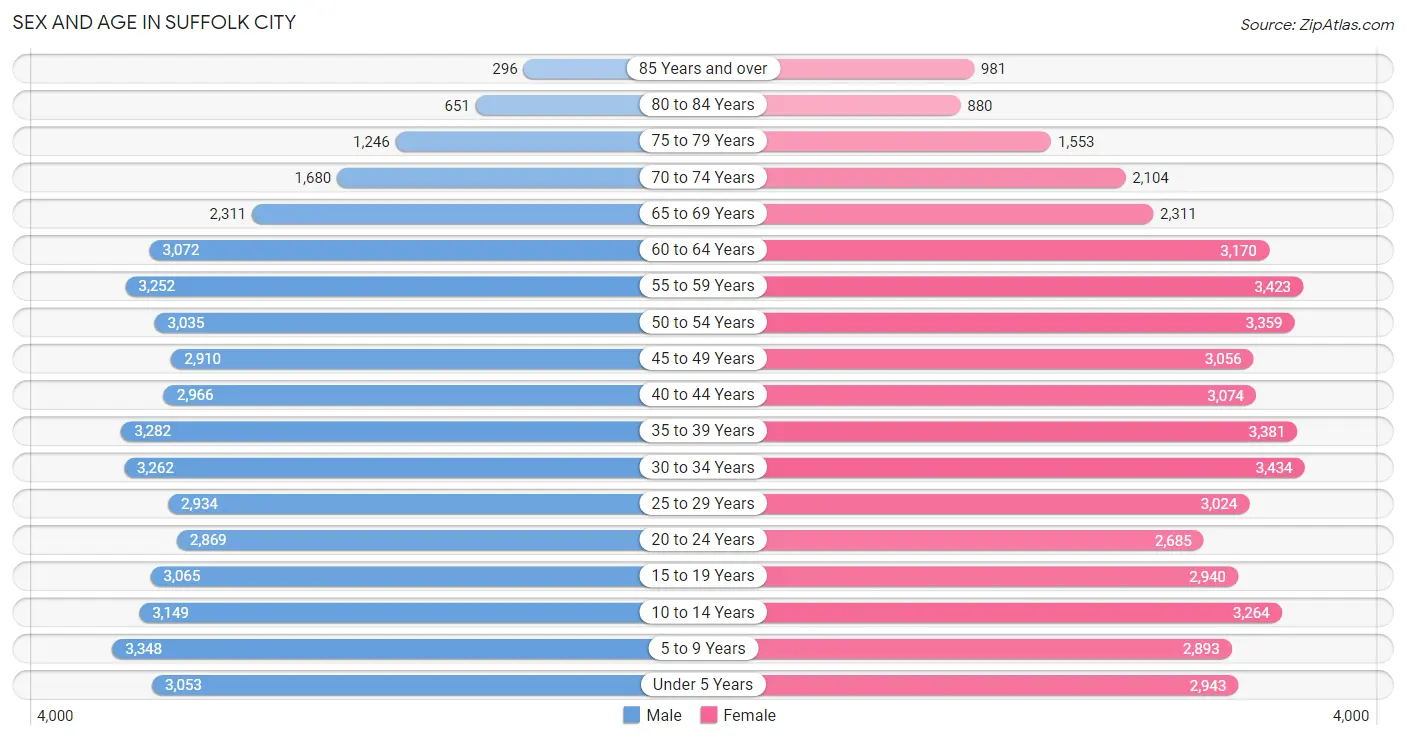
Sex and Age in Suffolk city
Sex and Age in Suffolk city
The most populous age groups in Suffolk city are 5 to 9 Years (3,348 | 7.2%) for men and 30 to 34 Years (3,434 | 7.1%) for women.
| Age Bracket | Male | Female |
| Under 5 Years | 3,053 (6.6%) | 2,943 (6.1%) |
| 5 to 9 Years | 3,348 (7.2%) | 2,893 (6.0%) |
| 10 to 14 Years | 3,149 (6.8%) | 3,264 (6.7%) |
| 15 to 19 Years | 3,065 (6.6%) | 2,940 (6.1%) |
| 20 to 24 Years | 2,869 (6.2%) | 2,685 (5.5%) |
| 25 to 29 Years | 2,934 (6.3%) | 3,024 (6.2%) |
| 30 to 34 Years | 3,262 (7.0%) | 3,434 (7.1%) |
| 35 to 39 Years | 3,282 (7.1%) | 3,381 (7.0%) |
| 40 to 44 Years | 2,966 (6.4%) | 3,074 (6.3%) |
| 45 to 49 Years | 2,910 (6.3%) | 3,056 (6.3%) |
| 50 to 54 Years | 3,035 (6.5%) | 3,359 (6.9%) |
| 55 to 59 Years | 3,252 (7.0%) | 3,423 (7.1%) |
| 60 to 64 Years | 3,072 (6.6%) | 3,170 (6.5%) |
| 65 to 69 Years | 2,311 (5.0%) | 2,311 (4.8%) |
| 70 to 74 Years | 1,680 (3.6%) | 2,104 (4.3%) |
| 75 to 79 Years | 1,246 (2.7%) | 1,553 (3.2%) |
| 80 to 84 Years | 651 (1.4%) | 880 (1.8%) |
| 85 Years and over | 296 (0.6%) | 981 (2.0%) |
| Total | 46,381 (100.0%) | 48,475 (100.0%) |
Families and Households in Suffolk city
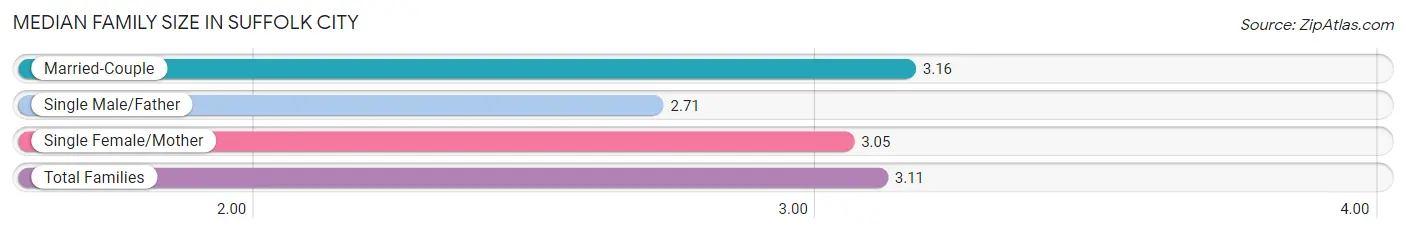
Median Family Size in Suffolk city
The median family size in Suffolk city is 3.11 persons per family, with married-couple families (18,569 | 72.7%) accounting for the largest median family size of 3.16 persons per family. On the other hand, single male/father families (1,722 | 6.7%) represent the smallest median family size with 2.71 persons per family.
| Family Type | # Families | Family Size |
| Married-Couple | 18,569 (72.7%) | 3.16 |
| Single Male/Father | 1,722 (6.7%) | 2.71 |
| Single Female/Mother | 5,267 (20.6%) | 3.05 |
| Total Families | 25,558 (100.0%) | 3.11 |
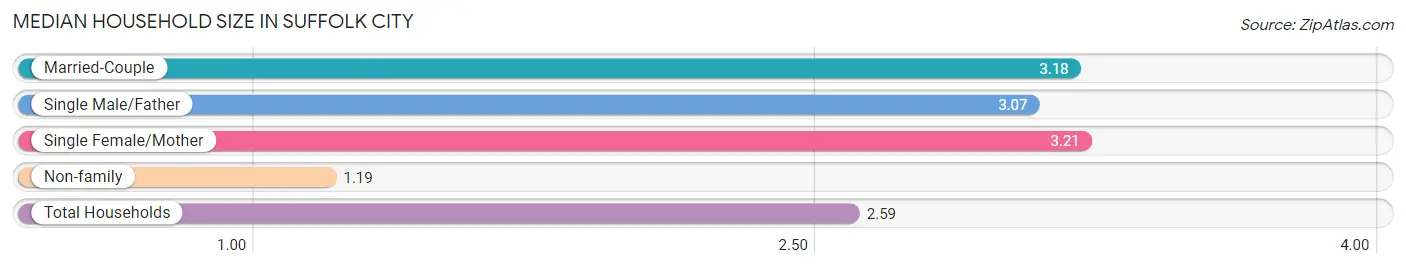
Median Household Size in Suffolk city
The median household size in Suffolk city is 2.59 persons per household, with single female/mother households (5,267 | 14.5%) accounting for the largest median household size of 3.21 persons per household. non-family households (10,760 | 29.6%) represent the smallest median household size with 1.19 persons per household.
| Household Type | # Households | Household Size |
| Married-Couple | 18,569 (51.1%) | 3.18 |
| Single Male/Father | 1,722 (4.7%) | 3.07 |
| Single Female/Mother | 5,267 (14.5%) | 3.21 |
| Non-family | 10,760 (29.6%) | 1.19 |
| Total Households | 36,318 (100.0%) | 2.59 |
Household Size by Marriage Status in Suffolk city
Out of a total of 36,318 households in Suffolk city, 25,558 (70.4%) are family households, while 10,760 (29.6%) are nonfamily households. The most numerous type of family households are 2-person households, comprising 10,753, and the most common type of nonfamily households are 1-person households, comprising 8,989.
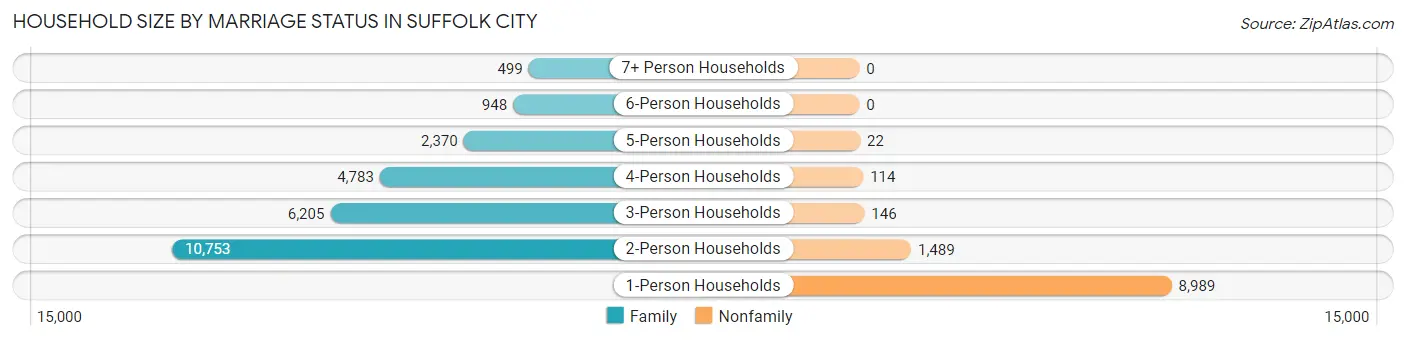
| Household Size | Family Households | Nonfamily Households |
| 1-Person Households | - | 8,989 (24.7%) |
| 2-Person Households | 10,753 (29.6%) | 1,489 (4.1%) |
| 3-Person Households | 6,205 (17.1%) | 146 (0.4%) |
| 4-Person Households | 4,783 (13.2%) | 114 (0.3%) |
| 5-Person Households | 2,370 (6.5%) | 22 (0.1%) |
| 6-Person Households | 948 (2.6%) | 0 (0.0%) |
| 7+ Person Households | 499 (1.4%) | 0 (0.0%) |
| Total | 25,558 (70.4%) | 10,760 (29.6%) |
Female Fertility in Suffolk city
Fertility by Age in Suffolk city
Average fertility rate in Suffolk city is 56.0 births per 1,000 women. Women in the age bracket of 20 to 34 years have the highest fertility rate with 107.0 births per 1,000 women. Women in the age bracket of 20 to 34 years acount for 79.2% of all women with births.
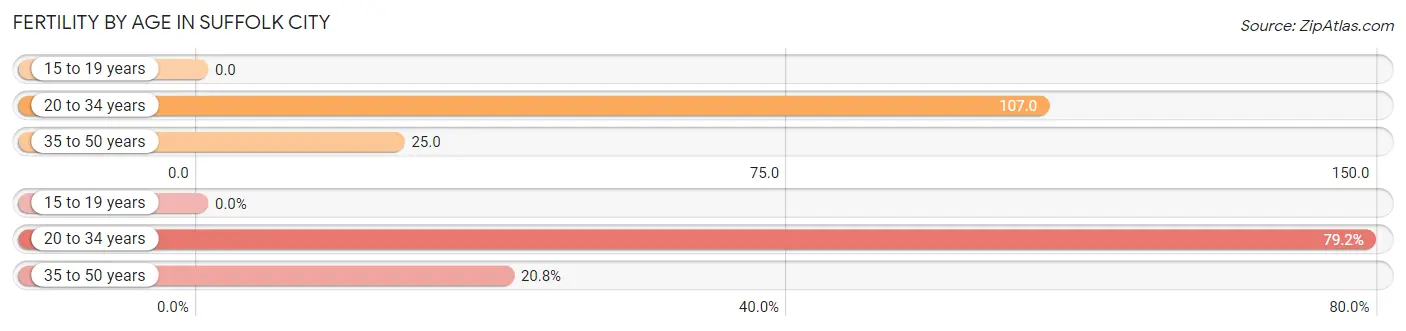
| Age Bracket | Women with Births | Births / 1,000 Women |
| 15 to 19 years | 0 (0.0%) | 0.0 |
| 20 to 34 years | 981 (79.2%) | 107.0 |
| 35 to 50 years | 257 (20.8%) | 25.0 |
| Total | 1,238 (100.0%) | 56.0 |
Fertility by Age by Marriage Status in Suffolk city
57.0% of women with births (1,238) in Suffolk city are married. The highest percentage of unmarried women with births falls into 20 to 34 years age bracket with 48.6% of them unmarried at the time of birth, while the lowest percentage of unmarried women with births belong to 35 to 50 years age bracket with 21.4% of them unmarried.
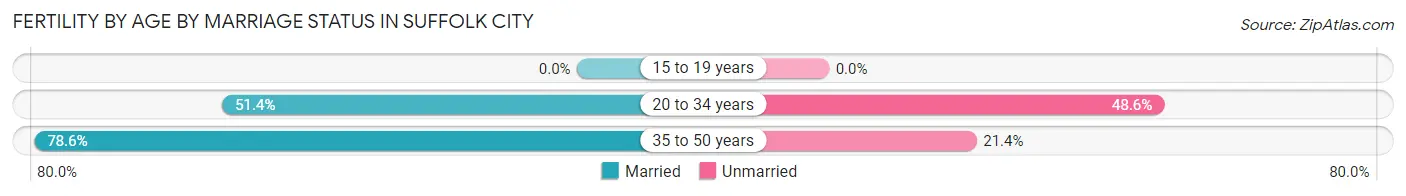
| Age Bracket | Married | Unmarried |
| 15 to 19 years | 0 (0.0%) | 0 (0.0%) |
| 20 to 34 years | 504 (51.4%) | 477 (48.6%) |
| 35 to 50 years | 202 (78.6%) | 55 (21.4%) |
| Total | 706 (57.0%) | 532 (43.0%) |
Fertility by Education in Suffolk city
Average fertility rate in Suffolk city is 56.0 births per 1,000 women. Women with the education attainment of graduate degree have the highest fertility rate of 72.0 births per 1,000 women, while women with the education attainment of less than high school have the lowest fertility at 46.0 births per 1,000 women. Women with the education attainment of college or associate's degree represent 32.6% of all women with births.
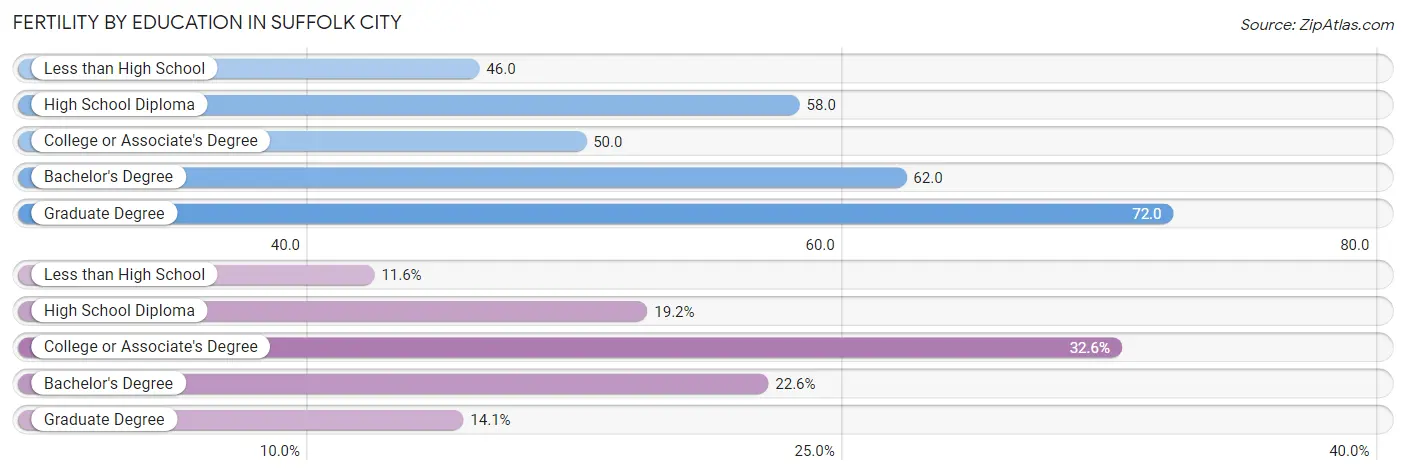
| Educational Attainment | Women with Births | Births / 1,000 Women |
| Less than High School | 143 (11.6%) | 46.0 |
| High School Diploma | 238 (19.2%) | 58.0 |
| College or Associate's Degree | 403 (32.6%) | 50.0 |
| Bachelor's Degree | 280 (22.6%) | 62.0 |
| Graduate Degree | 174 (14.1%) | 72.0 |
| Total | 1,238 (100.0%) | 56.0 |
Fertility by Education by Marriage Status in Suffolk city
43.0% of women with births in Suffolk city are unmarried. Women with the educational attainment of bachelor's degree are most likely to be married with 70.4% of them married at childbirth, while women with the educational attainment of less than high school are least likely to be married with 78.3% of them unmarried at childbirth.
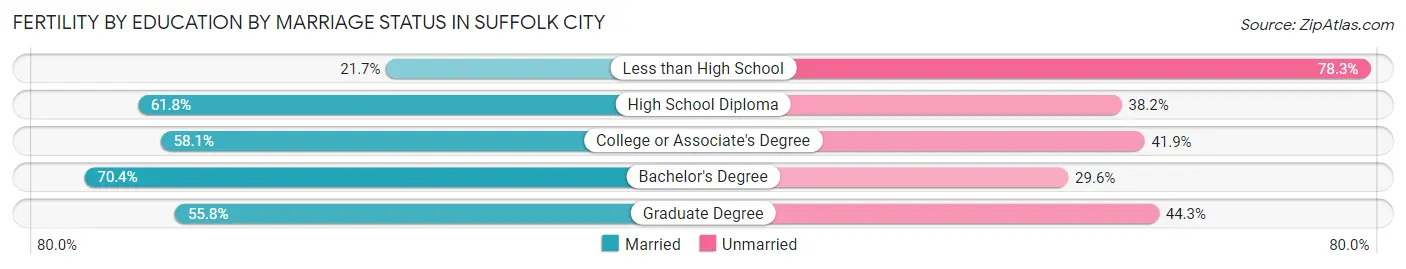
| Educational Attainment | Married | Unmarried |
| Less than High School | 31 (21.7%) | 112 (78.3%) |
| High School Diploma | 147 (61.8%) | 91 (38.2%) |
| College or Associate's Degree | 234 (58.1%) | 169 (41.9%) |
| Bachelor's Degree | 197 (70.4%) | 83 (29.6%) |
| Graduate Degree | 97 (55.7%) | 77 (44.3%) |
| Total | 706 (57.0%) | 532 (43.0%) |
Employment Characteristics in Suffolk city
Employment by Class of Employer in Suffolk city
Among the 45,875 employed individuals in Suffolk city, private company employees (26,828 | 58.5%), federal government employees (7,346 | 16.0%), and not-for-profit organizations (3,493 | 7.6%) make up the most common classes of employment.
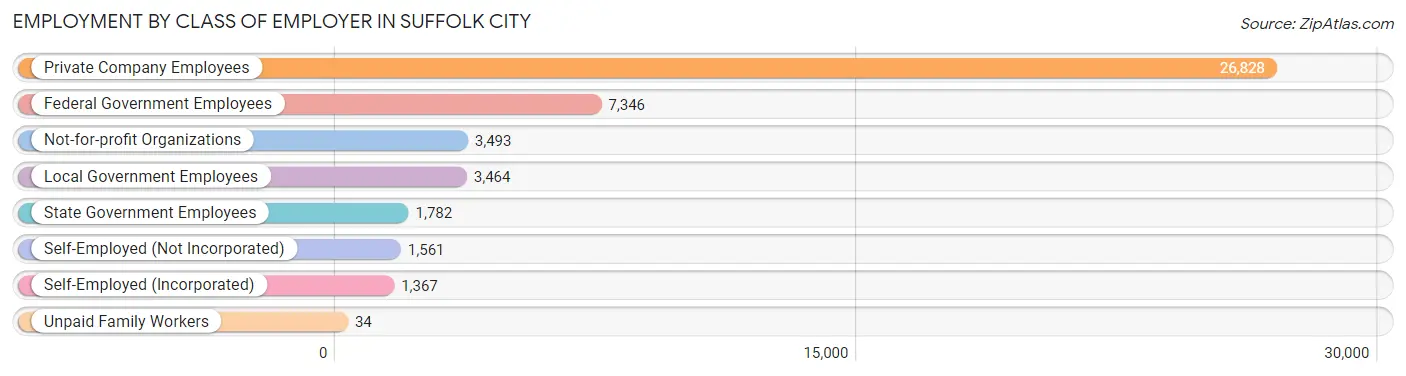
| Employer Class | # Employees | % Employees |
| Private Company Employees | 26,828 | 58.5% |
| Self-Employed (Incorporated) | 1,367 | 3.0% |
| Self-Employed (Not Incorporated) | 1,561 | 3.4% |
| Not-for-profit Organizations | 3,493 | 7.6% |
| Local Government Employees | 3,464 | 7.5% |
| State Government Employees | 1,782 | 3.9% |
| Federal Government Employees | 7,346 | 16.0% |
| Unpaid Family Workers | 34 | 0.1% |
| Total | 45,875 | 100.0% |
Employment Status by Age in Suffolk city
According to the labor force statistics for Suffolk city, out of the total population over 16 years of age (75,125), 66.5% or 49,958 individuals are in the labor force, with 6.3% or 3,147 of them unemployed. The age group with the highest labor force participation rate is 30 to 34 years, with 87.6% or 5,866 individuals in the labor force. Within the labor force, the 16 to 19 years age range has the highest percentage of unemployed individuals, with 22.7% or 477 of them being unemployed.
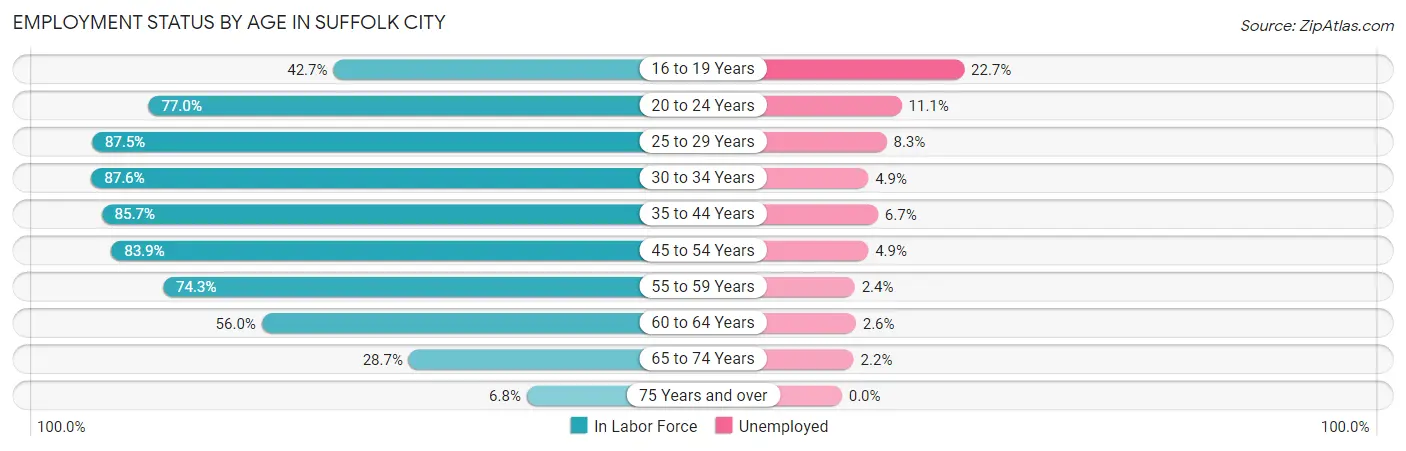
| Age Bracket | In Labor Force | Unemployed |
| 16 to 19 Years | 2,103 (42.7%) | 477 (22.7%) |
| 20 to 24 Years | 4,277 (77.0%) | 475 (11.1%) |
| 25 to 29 Years | 5,213 (87.5%) | 433 (8.3%) |
| 30 to 34 Years | 5,866 (87.6%) | 287 (4.9%) |
| 35 to 44 Years | 10,886 (85.7%) | 729 (6.7%) |
| 45 to 54 Years | 10,370 (83.9%) | 508 (4.9%) |
| 55 to 59 Years | 4,960 (74.3%) | 119 (2.4%) |
| 60 to 64 Years | 3,496 (56.0%) | 91 (2.6%) |
| 65 to 74 Years | 2,413 (28.7%) | 53 (2.2%) |
| 75 Years and over | 381 (6.8%) | 0 (0.0%) |
| Total | 49,958 (66.5%) | 3,147 (6.3%) |
Employment Status by Educational Attainment in Suffolk city
According to labor force statistics for Suffolk city, 80.5% of individuals (40,760) out of the total population between 25 and 64 years of age (50,634) are in the labor force, with 5.2% or 2,120 of them being unemployed. The group with the highest labor force participation rate are those with the educational attainment of bachelor's degree or higher, with 87.7% or 14,957 individuals in the labor force. Within the labor force, individuals with less than high school education have the highest percentage of unemployment, with 21.6% or 395 of them being unemployed.
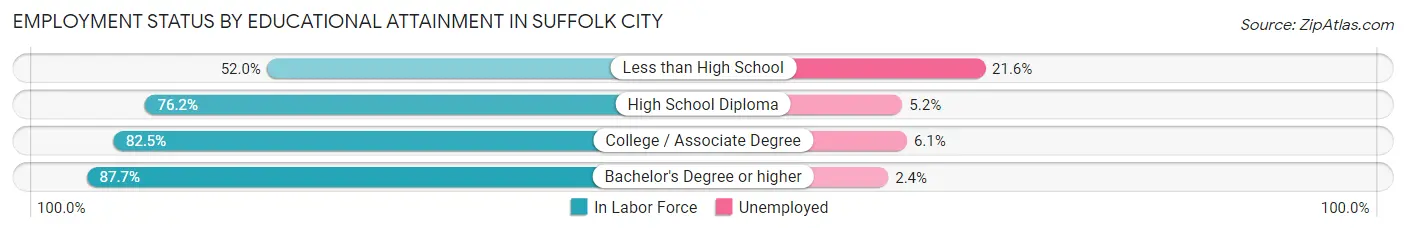
| Educational Attainment | In Labor Force | Unemployed |
| Less than High School | 1,830 (52.0%) | 760 (21.6%) |
| High School Diploma | 9,802 (76.2%) | 669 (5.2%) |
| College / Associate Degree | 14,187 (82.5%) | 1,049 (6.1%) |
| Bachelor's Degree or higher | 14,957 (87.7%) | 409 (2.4%) |
| Total | 40,760 (80.5%) | 2,633 (5.2%) |
Employment Occupations by Sex in Suffolk city
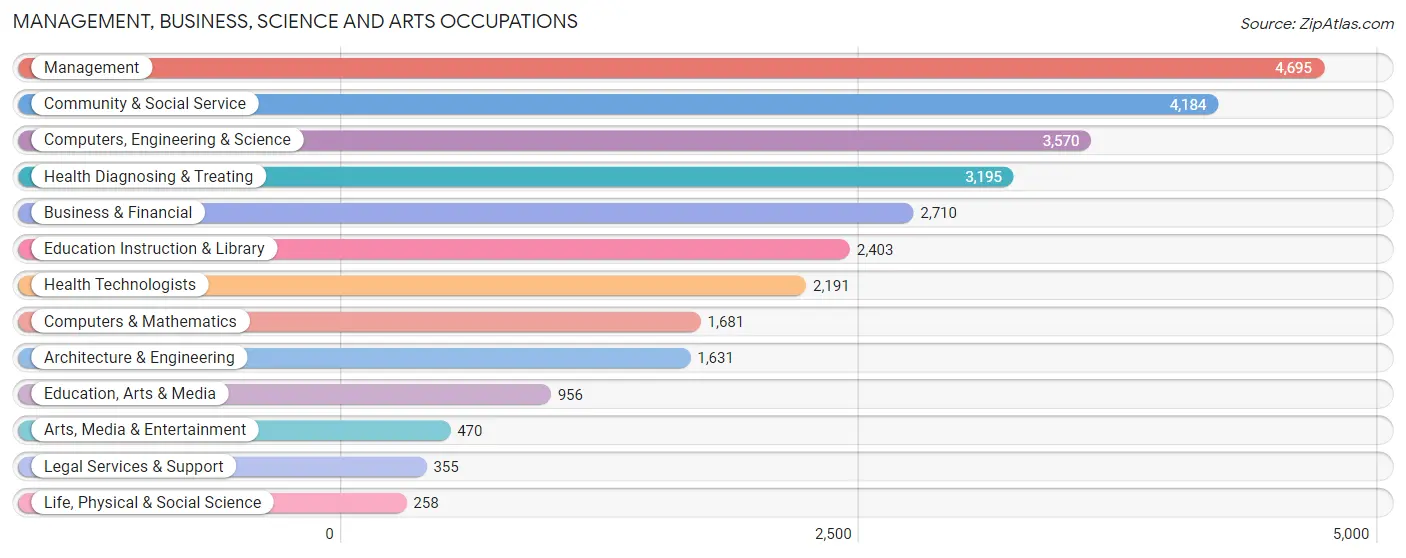
Management, Business, Science and Arts Occupations
The most common Management, Business, Science and Arts occupations in Suffolk city are Management (4,695 | 10.6%), Community & Social Service (4,184 | 9.4%), Computers, Engineering & Science (3,570 | 8.1%), Health Diagnosing & Treating (3,195 | 7.2%), and Business & Financial (2,710 | 6.1%).
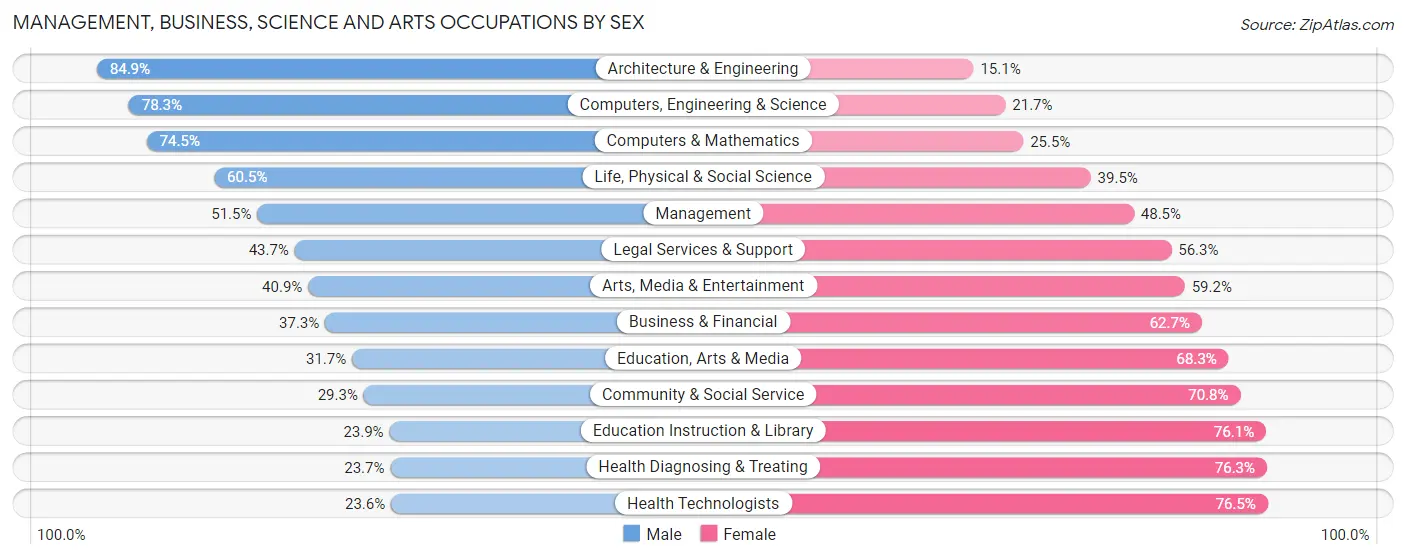
Management, Business, Science and Arts Occupations by Sex
Within the Management, Business, Science and Arts occupations in Suffolk city, the most male-oriented occupations are Architecture & Engineering (84.9%), Computers, Engineering & Science (78.3%), and Computers & Mathematics (74.5%), while the most female-oriented occupations are Health Technologists (76.4%), Health Diagnosing & Treating (76.3%), and Education Instruction & Library (76.1%).
| Occupation | Male | Female |
| Management | 2,416 (51.5%) | 2,279 (48.5%) |
| Business & Financial | 1,011 (37.3%) | 1,699 (62.7%) |
| Computers, Engineering & Science | 2,794 (78.3%) | 776 (21.7%) |
| Computers & Mathematics | 1,253 (74.5%) | 428 (25.5%) |
| Architecture & Engineering | 1,385 (84.9%) | 246 (15.1%) |
| Life, Physical & Social Science | 156 (60.5%) | 102 (39.5%) |
| Community & Social Service | 1,224 (29.2%) | 2,960 (70.8%) |
| Education, Arts & Media | 303 (31.7%) | 653 (68.3%) |
| Legal Services & Support | 155 (43.7%) | 200 (56.3%) |
| Education Instruction & Library | 574 (23.9%) | 1,829 (76.1%) |
| Arts, Media & Entertainment | 192 (40.8%) | 278 (59.2%) |
| Health Diagnosing & Treating | 758 (23.7%) | 2,437 (76.3%) |
| Health Technologists | 516 (23.5%) | 1,675 (76.4%) |
| Total (Category) | 8,203 (44.7%) | 10,151 (55.3%) |
| Total (Overall) | 22,680 (51.1%) | 21,678 (48.9%) |
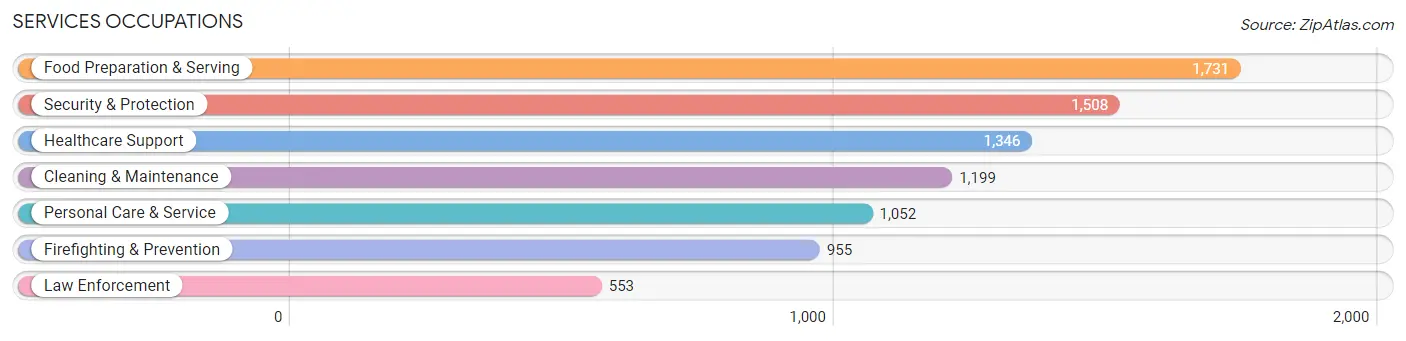
Services Occupations
The most common Services occupations in Suffolk city are Food Preparation & Serving (1,731 | 3.9%), Security & Protection (1,508 | 3.4%), Healthcare Support (1,346 | 3.0%), Cleaning & Maintenance (1,199 | 2.7%), and Personal Care & Service (1,052 | 2.4%).
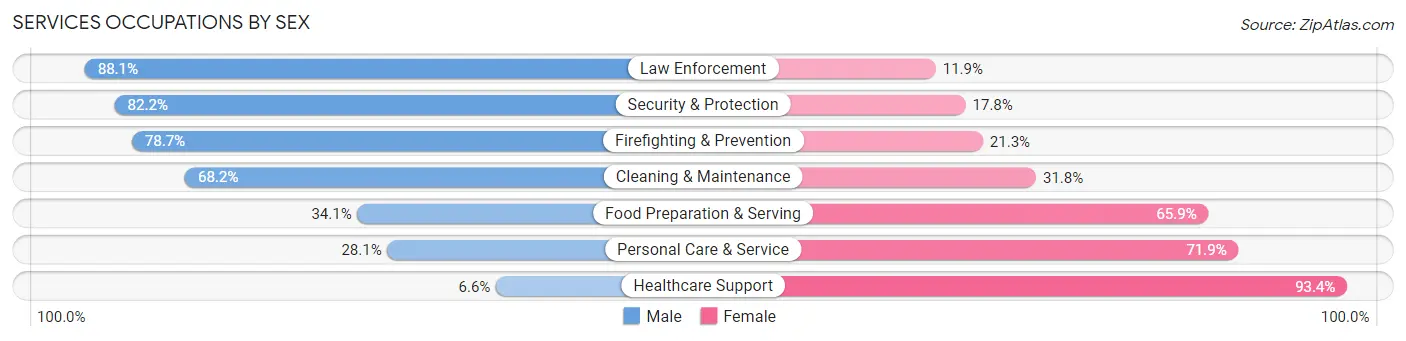
Services Occupations by Sex
Within the Services occupations in Suffolk city, the most male-oriented occupations are Law Enforcement (88.1%), Security & Protection (82.2%), and Firefighting & Prevention (78.7%), while the most female-oriented occupations are Healthcare Support (93.4%), Personal Care & Service (71.9%), and Food Preparation & Serving (65.9%).
| Occupation | Male | Female |
| Healthcare Support | 89 (6.6%) | 1,257 (93.4%) |
| Security & Protection | 1,239 (82.2%) | 269 (17.8%) |
| Firefighting & Prevention | 752 (78.7%) | 203 (21.3%) |
| Law Enforcement | 487 (88.1%) | 66 (11.9%) |
| Food Preparation & Serving | 590 (34.1%) | 1,141 (65.9%) |
| Cleaning & Maintenance | 818 (68.2%) | 381 (31.8%) |
| Personal Care & Service | 296 (28.1%) | 756 (71.9%) |
| Total (Category) | 3,032 (44.4%) | 3,804 (55.6%) |
| Total (Overall) | 22,680 (51.1%) | 21,678 (48.9%) |
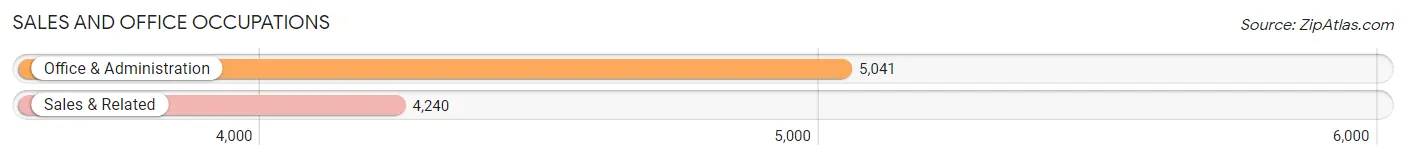
Sales and Office Occupations
The most common Sales and Office occupations in Suffolk city are Office & Administration (5,041 | 11.4%), and Sales & Related (4,240 | 9.6%).
Sales and Office Occupations by Sex
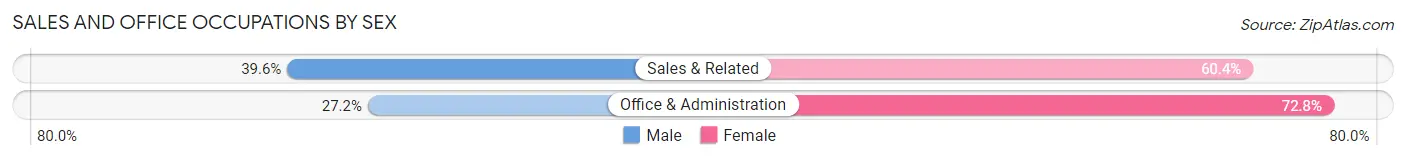
| Occupation | Male | Female |
| Sales & Related | 1,679 (39.6%) | 2,561 (60.4%) |
| Office & Administration | 1,371 (27.2%) | 3,670 (72.8%) |
| Total (Category) | 3,050 (32.9%) | 6,231 (67.1%) |
| Total (Overall) | 22,680 (51.1%) | 21,678 (48.9%) |
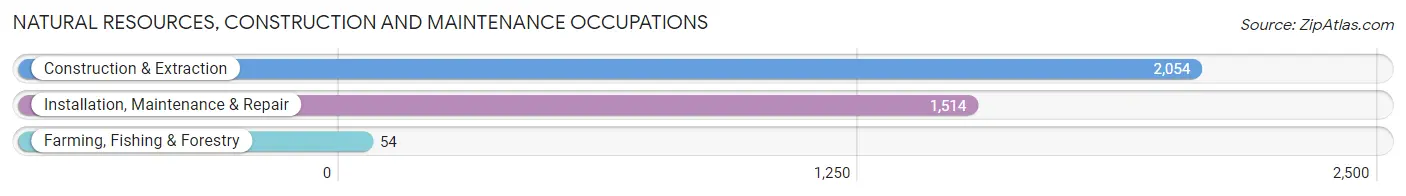
Natural Resources, Construction and Maintenance Occupations
The most common Natural Resources, Construction and Maintenance occupations in Suffolk city are Construction & Extraction (2,054 | 4.6%), Installation, Maintenance & Repair (1,514 | 3.4%), and Farming, Fishing & Forestry (54 | 0.1%).
Natural Resources, Construction and Maintenance Occupations by Sex
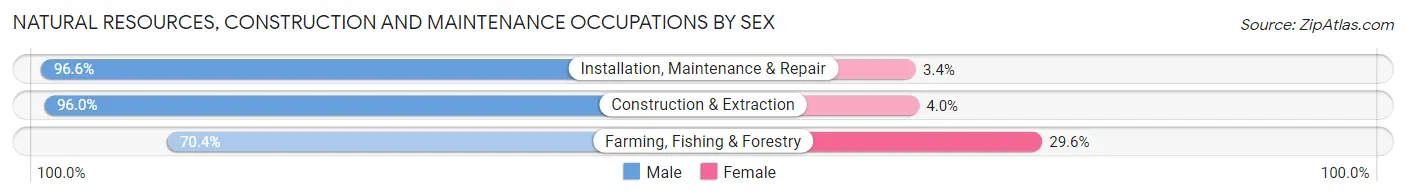
| Occupation | Male | Female |
| Farming, Fishing & Forestry | 38 (70.4%) | 16 (29.6%) |
| Construction & Extraction | 1,971 (96.0%) | 83 (4.0%) |
| Installation, Maintenance & Repair | 1,463 (96.6%) | 51 (3.4%) |
| Total (Category) | 3,472 (95.9%) | 150 (4.1%) |
| Total (Overall) | 22,680 (51.1%) | 21,678 (48.9%) |
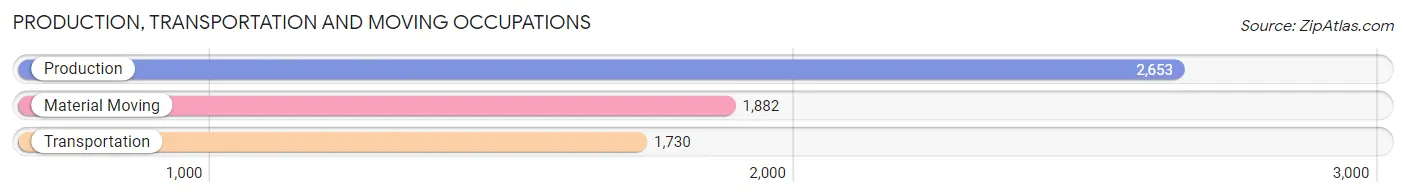
Production, Transportation and Moving Occupations
The most common Production, Transportation and Moving occupations in Suffolk city are Production (2,653 | 6.0%), Material Moving (1,882 | 4.2%), and Transportation (1,730 | 3.9%).
Production, Transportation and Moving Occupations by Sex
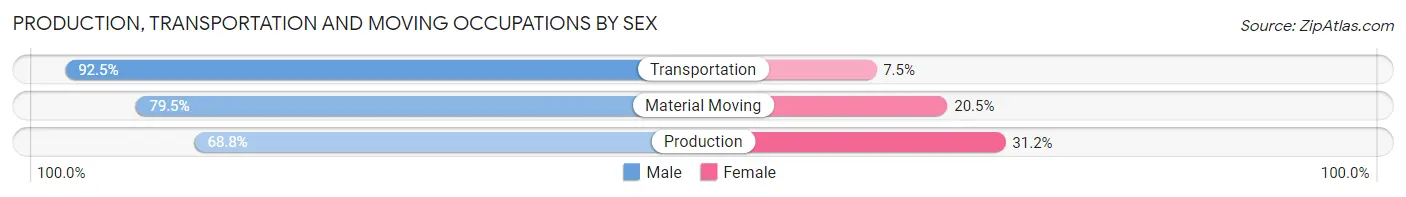
| Occupation | Male | Female |
| Production | 1,826 (68.8%) | 827 (31.2%) |
| Transportation | 1,601 (92.5%) | 129 (7.5%) |
| Material Moving | 1,496 (79.5%) | 386 (20.5%) |
| Total (Category) | 4,923 (78.6%) | 1,342 (21.4%) |
| Total (Overall) | 22,680 (51.1%) | 21,678 (48.9%) |
Employment Industries by Sex in Suffolk city
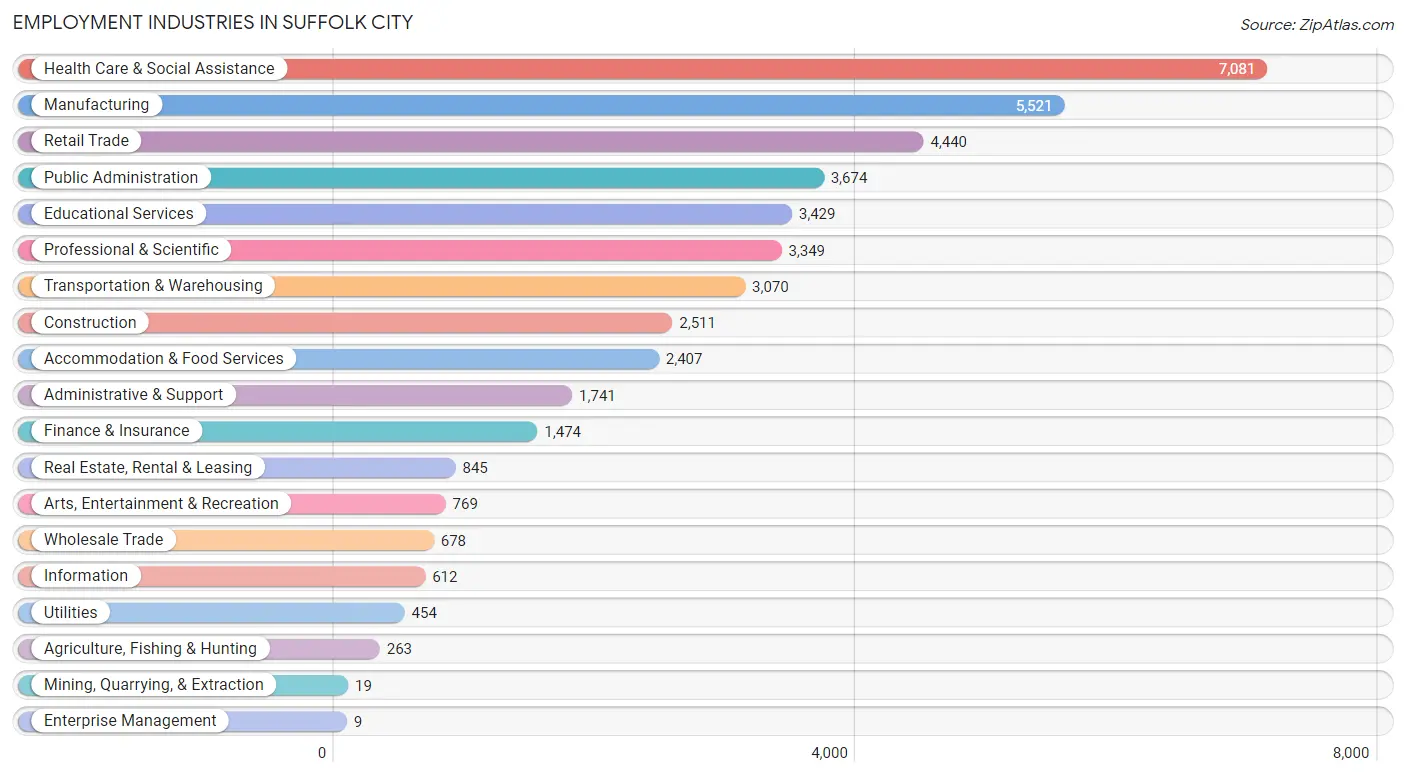
Employment Industries in Suffolk city
The major employment industries in Suffolk city include Health Care & Social Assistance (7,081 | 16.0%), Manufacturing (5,521 | 12.4%), Retail Trade (4,440 | 10.0%), Public Administration (3,674 | 8.3%), and Educational Services (3,429 | 7.7%).
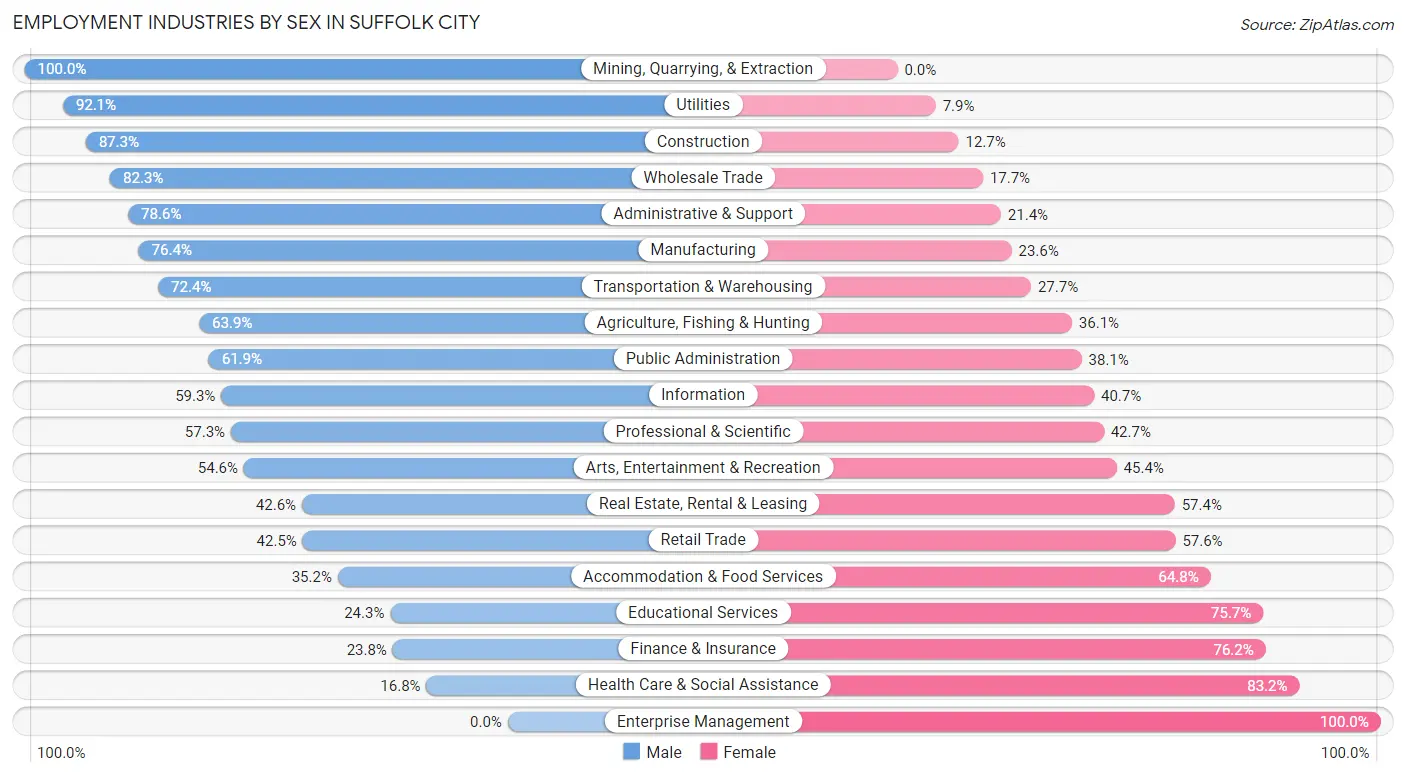
Employment Industries by Sex in Suffolk city
The Suffolk city industries that see more men than women are Mining, Quarrying, & Extraction (100.0%), Utilities (92.1%), and Construction (87.3%), whereas the industries that tend to have a higher number of women are Enterprise Management (100.0%), Health Care & Social Assistance (83.2%), and Finance & Insurance (76.2%).
| Industry | Male | Female |
| Agriculture, Fishing & Hunting | 168 (63.9%) | 95 (36.1%) |
| Mining, Quarrying, & Extraction | 19 (100.0%) | 0 (0.0%) |
| Construction | 2,193 (87.3%) | 318 (12.7%) |
| Manufacturing | 4,217 (76.4%) | 1,304 (23.6%) |
| Wholesale Trade | 558 (82.3%) | 120 (17.7%) |
| Retail Trade | 1,885 (42.4%) | 2,555 (57.6%) |
| Transportation & Warehousing | 2,221 (72.4%) | 849 (27.7%) |
| Utilities | 418 (92.1%) | 36 (7.9%) |
| Information | 363 (59.3%) | 249 (40.7%) |
| Finance & Insurance | 351 (23.8%) | 1,123 (76.2%) |
| Real Estate, Rental & Leasing | 360 (42.6%) | 485 (57.4%) |
| Professional & Scientific | 1,919 (57.3%) | 1,430 (42.7%) |
| Enterprise Management | 0 (0.0%) | 9 (100.0%) |
| Administrative & Support | 1,368 (78.6%) | 373 (21.4%) |
| Educational Services | 834 (24.3%) | 2,595 (75.7%) |
| Health Care & Social Assistance | 1,192 (16.8%) | 5,889 (83.2%) |
| Arts, Entertainment & Recreation | 420 (54.6%) | 349 (45.4%) |
| Accommodation & Food Services | 847 (35.2%) | 1,560 (64.8%) |
| Public Administration | 2,273 (61.9%) | 1,401 (38.1%) |
| Total | 22,680 (51.1%) | 21,678 (48.9%) |
Education in Suffolk city
School Enrollment in Suffolk city
The most common levels of schooling among the 23,299 students in Suffolk city are high school (5,263 | 22.6%), middle school (4,844 | 20.8%), and elementary school (4,749 | 20.4%).
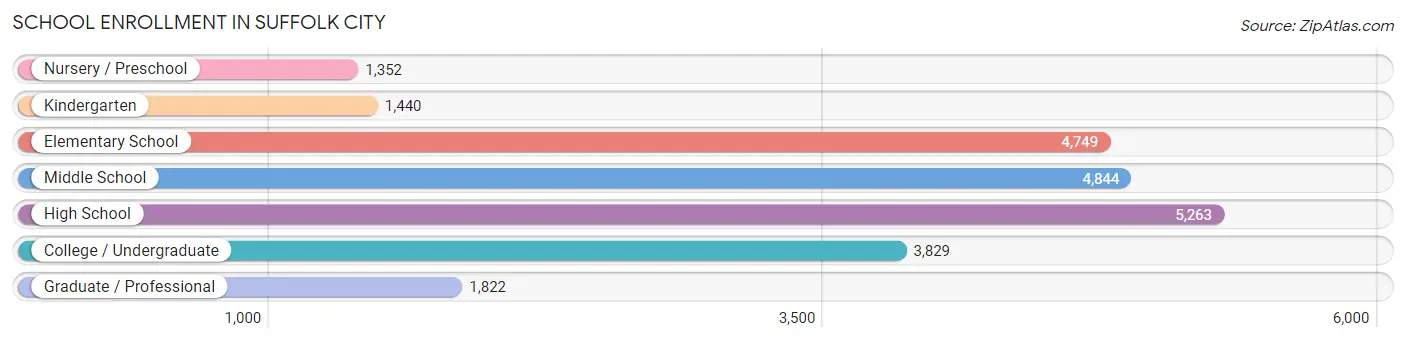
| School Level | # Students | % Students |
| Nursery / Preschool | 1,352 | 5.8% |
| Kindergarten | 1,440 | 6.2% |
| Elementary School | 4,749 | 20.4% |
| Middle School | 4,844 | 20.8% |
| High School | 5,263 | 22.6% |
| College / Undergraduate | 3,829 | 16.4% |
| Graduate / Professional | 1,822 | 7.8% |
| Total | 23,299 | 100.0% |
School Enrollment by Age by Funding Source in Suffolk city
Out of a total of 23,299 students who are enrolled in schools in Suffolk city, 4,776 (20.5%) attend a private institution, while the remaining 18,523 (79.5%) are enrolled in public schools. The age group of 3 to 4 year olds has the highest likelihood of being enrolled in private schools, with 367 (36.2% in the age bracket) enrolled. Conversely, the age group of 18 to 19 year olds has the lowest likelihood of being enrolled in a private school, with 1,275 (88.8% in the age bracket) attending a public institution.
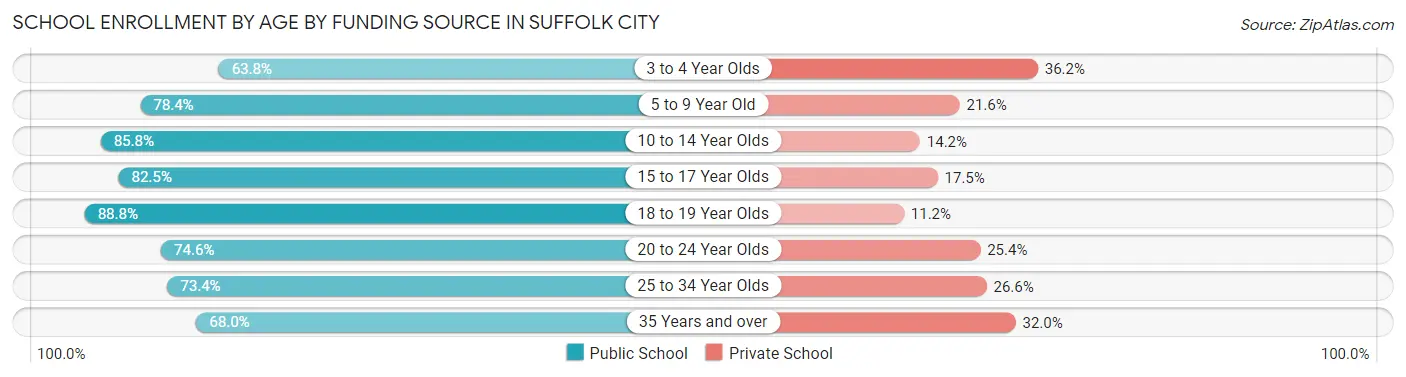
| Age Bracket | Public School | Private School |
| 3 to 4 Year Olds | 648 (63.8%) | 367 (36.2%) |
| 5 to 9 Year Old | 4,688 (78.4%) | 1,290 (21.6%) |
| 10 to 14 Year Olds | 5,263 (85.8%) | 870 (14.2%) |
| 15 to 17 Year Olds | 2,904 (82.5%) | 616 (17.5%) |
| 18 to 19 Year Olds | 1,275 (88.8%) | 161 (11.2%) |
| 20 to 24 Year Olds | 1,216 (74.6%) | 415 (25.4%) |
| 25 to 34 Year Olds | 1,153 (73.4%) | 418 (26.6%) |
| 35 Years and over | 1,370 (68.0%) | 645 (32.0%) |
| Total | 18,523 (79.5%) | 4,776 (20.5%) |
Educational Attainment by Field of Study in Suffolk city
Business (4,306 | 19.5%), education (2,596 | 11.8%), science & technology (2,529 | 11.5%), arts & humanities (2,263 | 10.3%), and engineering (1,650 | 7.5%) are the most common fields of study among 22,056 individuals in Suffolk city who have obtained a bachelor's degree or higher.
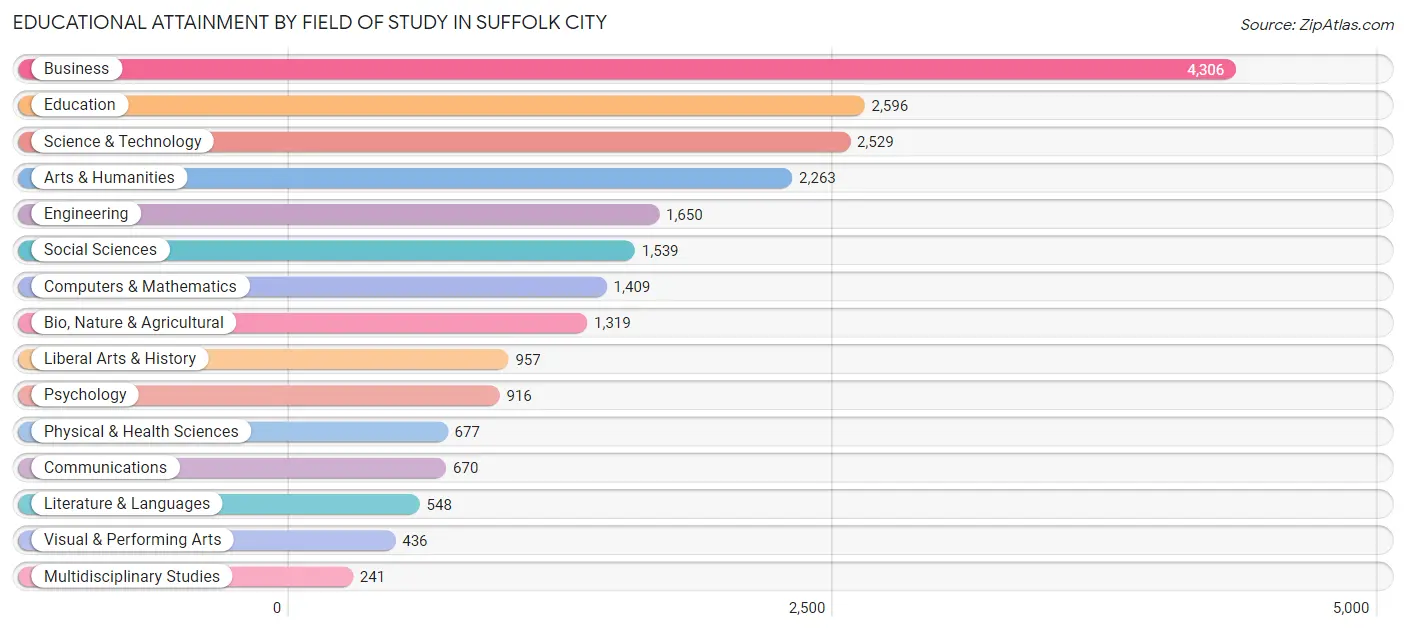
| Field of Study | # Graduates | % Graduates |
| Computers & Mathematics | 1,409 | 6.4% |
| Bio, Nature & Agricultural | 1,319 | 6.0% |
| Physical & Health Sciences | 677 | 3.1% |
| Psychology | 916 | 4.2% |
| Social Sciences | 1,539 | 7.0% |
| Engineering | 1,650 | 7.5% |
| Multidisciplinary Studies | 241 | 1.1% |
| Science & Technology | 2,529 | 11.5% |
| Business | 4,306 | 19.5% |
| Education | 2,596 | 11.8% |
| Literature & Languages | 548 | 2.5% |
| Liberal Arts & History | 957 | 4.3% |
| Visual & Performing Arts | 436 | 2.0% |
| Communications | 670 | 3.0% |
| Arts & Humanities | 2,263 | 10.3% |
| Total | 22,056 | 100.0% |
Transportation & Commute in Suffolk city
Vehicle Availability by Sex in Suffolk city
The most prevalent vehicle ownership categories in Suffolk city are males with 2 vehicles (9,865, accounting for 40.3%) and females with 2 vehicles (7,713, making up 46.2%).
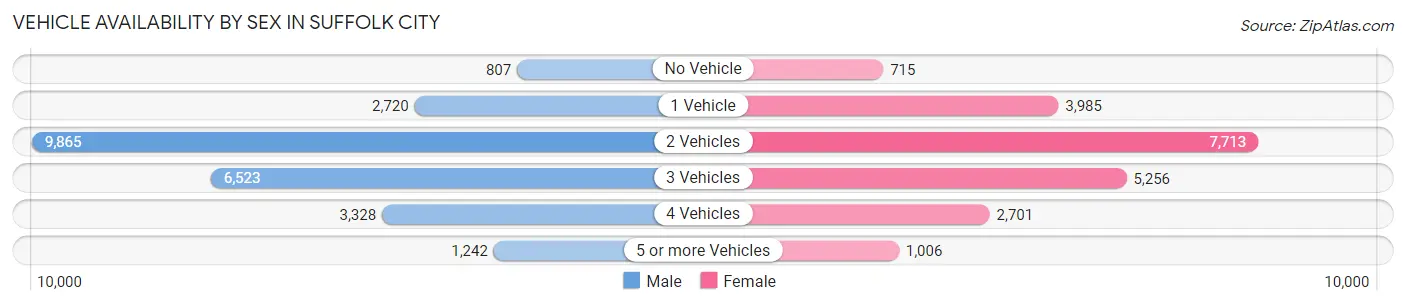
| Vehicles Available | Male | Female |
| No Vehicle | 807 (3.3%) | 715 (3.3%) |
| 1 Vehicle | 2,720 (11.1%) | 3,985 (18.6%) |
| 2 Vehicles | 9,865 (40.3%) | 7,713 (36.1%) |
| 3 Vehicles | 6,523 (26.6%) | 5,256 (24.6%) |
| 4 Vehicles | 3,328 (13.6%) | 2,701 (12.6%) |
| 5 or more Vehicles | 1,242 (5.1%) | 1,006 (4.7%) |
| Total | 24,485 (100.0%) | 21,376 (100.0%) |
Commute Time in Suffolk city
The most frequently occuring commute durations in Suffolk city are 30 to 34 minutes (6,415 commuters, 15.2%), 20 to 24 minutes (6,149 commuters, 14.6%), and 45 to 59 minutes (5,654 commuters, 13.4%).
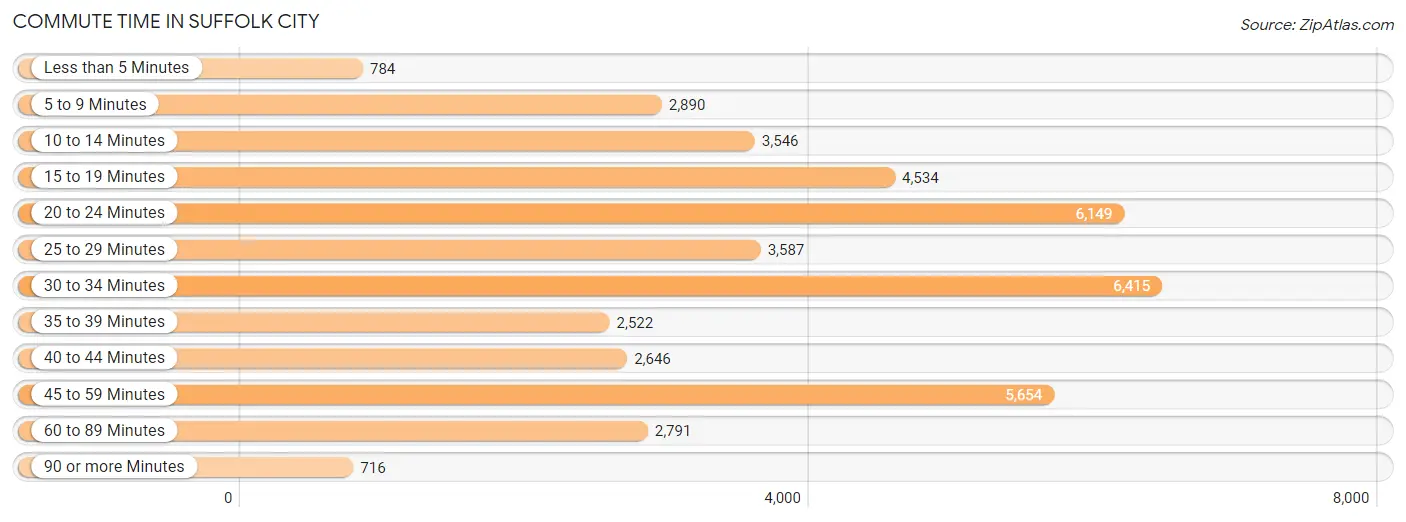
| Commute Time | # Commuters | % Commuters |
| Less than 5 Minutes | 784 | 1.9% |
| 5 to 9 Minutes | 2,890 | 6.8% |
| 10 to 14 Minutes | 3,546 | 8.4% |
| 15 to 19 Minutes | 4,534 | 10.7% |
| 20 to 24 Minutes | 6,149 | 14.6% |
| 25 to 29 Minutes | 3,587 | 8.5% |
| 30 to 34 Minutes | 6,415 | 15.2% |
| 35 to 39 Minutes | 2,522 | 6.0% |
| 40 to 44 Minutes | 2,646 | 6.3% |
| 45 to 59 Minutes | 5,654 | 13.4% |
| 60 to 89 Minutes | 2,791 | 6.6% |
| 90 or more Minutes | 716 | 1.7% |
Commute Time by Sex in Suffolk city
The most common commute times in Suffolk city are 30 to 34 minutes (3,702 commuters, 16.2%) for males and 20 to 24 minutes (2,975 commuters, 15.3%) for females.
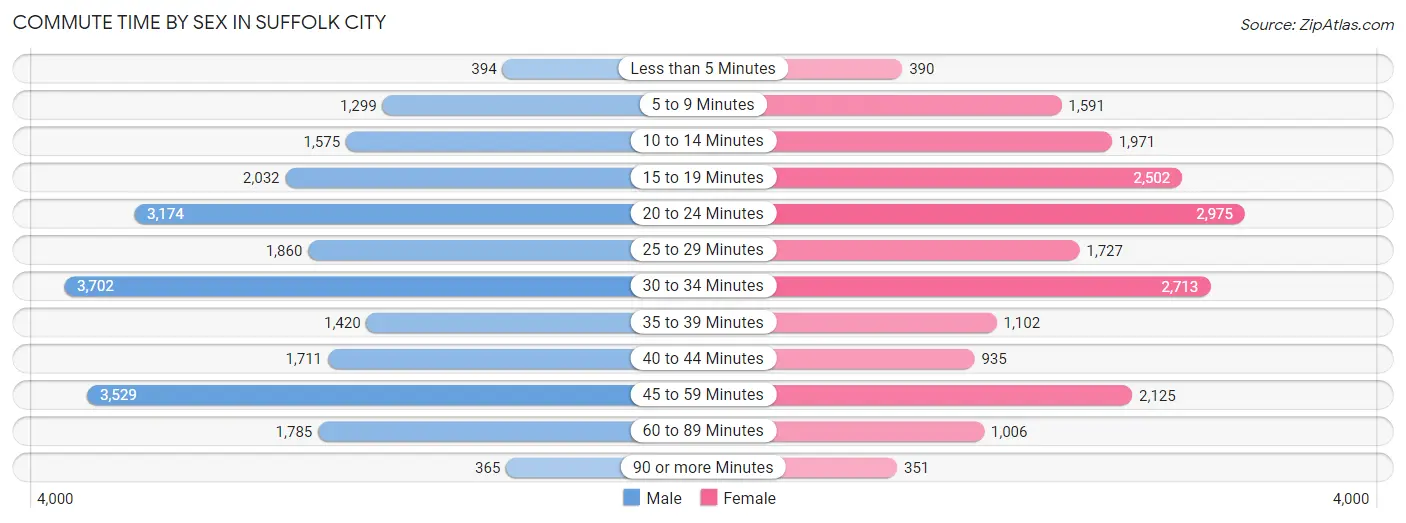
| Commute Time | Male | Female |
| Less than 5 Minutes | 394 (1.7%) | 390 (2.0%) |
| 5 to 9 Minutes | 1,299 (5.7%) | 1,591 (8.2%) |
| 10 to 14 Minutes | 1,575 (6.9%) | 1,971 (10.2%) |
| 15 to 19 Minutes | 2,032 (8.9%) | 2,502 (12.9%) |
| 20 to 24 Minutes | 3,174 (13.9%) | 2,975 (15.3%) |
| 25 to 29 Minutes | 1,860 (8.1%) | 1,727 (8.9%) |
| 30 to 34 Minutes | 3,702 (16.2%) | 2,713 (14.0%) |
| 35 to 39 Minutes | 1,420 (6.2%) | 1,102 (5.7%) |
| 40 to 44 Minutes | 1,711 (7.5%) | 935 (4.8%) |
| 45 to 59 Minutes | 3,529 (15.4%) | 2,125 (11.0%) |
| 60 to 89 Minutes | 1,785 (7.8%) | 1,006 (5.2%) |
| 90 or more Minutes | 365 (1.6%) | 351 (1.8%) |
Time of Departure to Work by Sex in Suffolk city
The most frequent times of departure to work in Suffolk city are 5:30 AM to 5:59 AM (3,065, 13.4%) for males and 7:00 AM to 7:29 AM (3,436, 17.7%) for females.
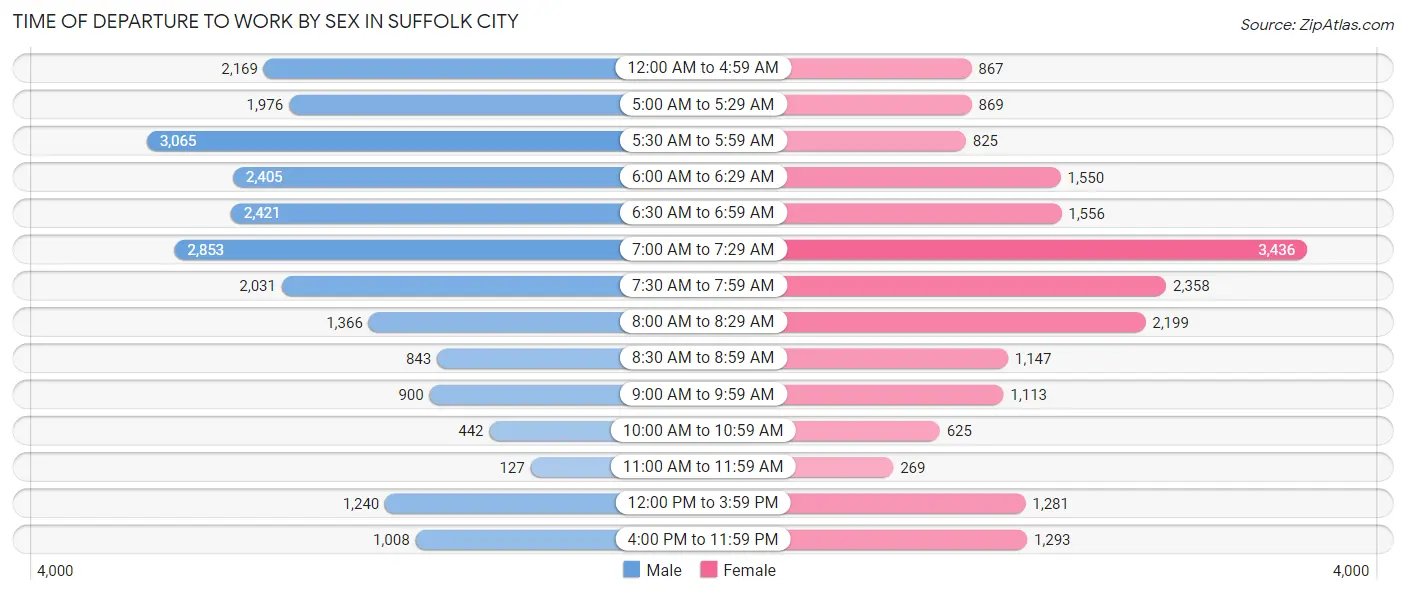
| Time of Departure | Male | Female |
| 12:00 AM to 4:59 AM | 2,169 (9.5%) | 867 (4.5%) |
| 5:00 AM to 5:29 AM | 1,976 (8.6%) | 869 (4.5%) |
| 5:30 AM to 5:59 AM | 3,065 (13.4%) | 825 (4.3%) |
| 6:00 AM to 6:29 AM | 2,405 (10.5%) | 1,550 (8.0%) |
| 6:30 AM to 6:59 AM | 2,421 (10.6%) | 1,556 (8.0%) |
| 7:00 AM to 7:29 AM | 2,853 (12.5%) | 3,436 (17.7%) |
| 7:30 AM to 7:59 AM | 2,031 (8.9%) | 2,358 (12.2%) |
| 8:00 AM to 8:29 AM | 1,366 (6.0%) | 2,199 (11.3%) |
| 8:30 AM to 8:59 AM | 843 (3.7%) | 1,147 (5.9%) |
| 9:00 AM to 9:59 AM | 900 (3.9%) | 1,113 (5.7%) |
| 10:00 AM to 10:59 AM | 442 (1.9%) | 625 (3.2%) |
| 11:00 AM to 11:59 AM | 127 (0.6%) | 269 (1.4%) |
| 12:00 PM to 3:59 PM | 1,240 (5.4%) | 1,281 (6.6%) |
| 4:00 PM to 11:59 PM | 1,008 (4.4%) | 1,293 (6.7%) |
| Total | 22,846 (100.0%) | 19,388 (100.0%) |
Housing Occupancy in Suffolk city
Occupancy by Ownership in Suffolk city
Of the total 36,318 dwellings in Suffolk city, owner-occupied units account for 25,584 (70.4%), while renter-occupied units make up 10,734 (29.6%).
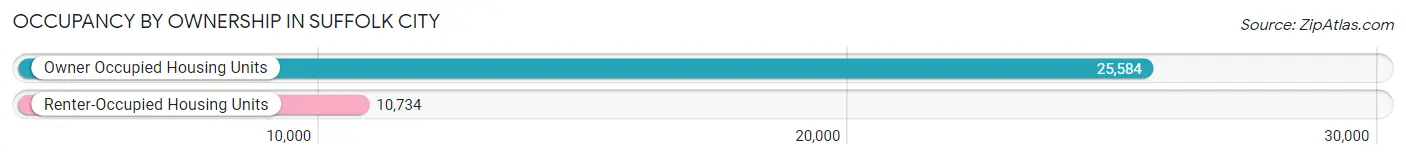
| Occupancy | # Housing Units | % Housing Units |
| Owner Occupied Housing Units | 25,584 | 70.4% |
| Renter-Occupied Housing Units | 10,734 | 29.6% |
| Total Occupied Housing Units | 36,318 | 100.0% |
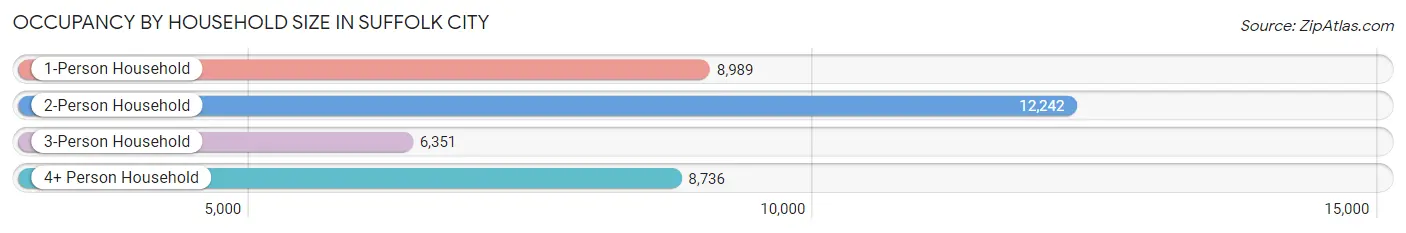
Occupancy by Household Size in Suffolk city
| Household Size | # Housing Units | % Housing Units |
| 1-Person Household | 8,989 | 24.7% |
| 2-Person Household | 12,242 | 33.7% |
| 3-Person Household | 6,351 | 17.5% |
| 4+ Person Household | 8,736 | 24.0% |
| Total Housing Units | 36,318 | 100.0% |
Occupancy by Ownership by Household Size in Suffolk city
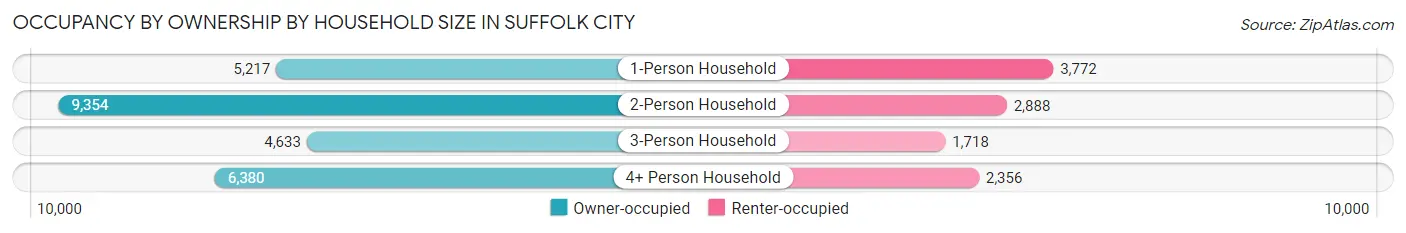
| Household Size | Owner-occupied | Renter-occupied |
| 1-Person Household | 5,217 (58.0%) | 3,772 (42.0%) |
| 2-Person Household | 9,354 (76.4%) | 2,888 (23.6%) |
| 3-Person Household | 4,633 (73.0%) | 1,718 (27.1%) |
| 4+ Person Household | 6,380 (73.0%) | 2,356 (27.0%) |
| Total Housing Units | 25,584 (70.4%) | 10,734 (29.6%) |
Occupancy by Educational Attainment in Suffolk city
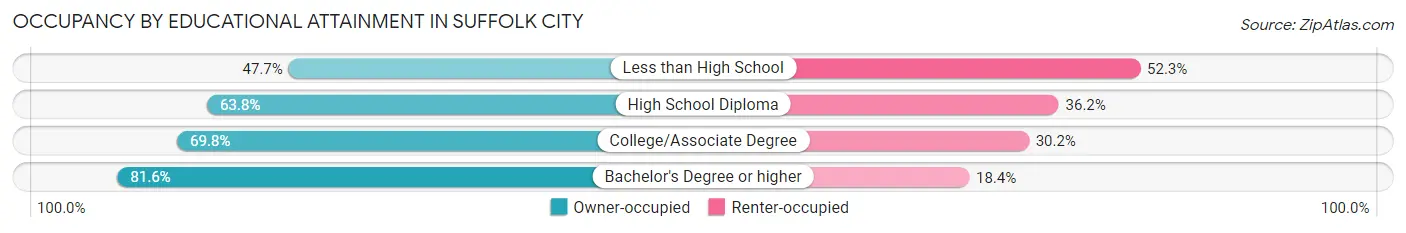
| Household Size | Owner-occupied | Renter-occupied |
| Less than High School | 1,575 (47.7%) | 1,729 (52.3%) |
| High School Diploma | 5,392 (63.8%) | 3,055 (36.2%) |
| College/Associate Degree | 8,419 (69.8%) | 3,649 (30.2%) |
| Bachelor's Degree or higher | 10,198 (81.6%) | 2,301 (18.4%) |
Occupancy by Age of Householder in Suffolk city
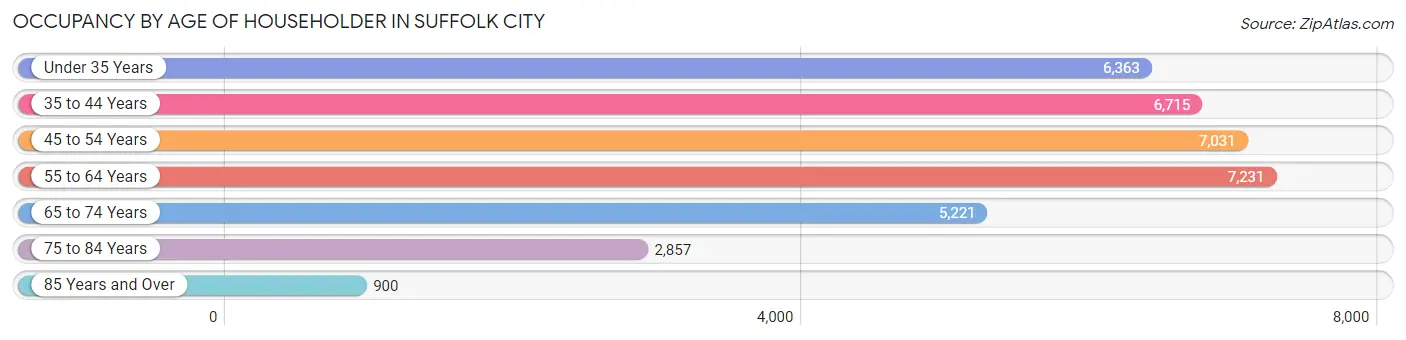
| Age Bracket | # Households | % Households |
| Under 35 Years | 6,363 | 17.5% |
| 35 to 44 Years | 6,715 | 18.5% |
| 45 to 54 Years | 7,031 | 19.4% |
| 55 to 64 Years | 7,231 | 19.9% |
| 65 to 74 Years | 5,221 | 14.4% |
| 75 to 84 Years | 2,857 | 7.9% |
| 85 Years and Over | 900 | 2.5% |
| Total | 36,318 | 100.0% |
Housing Finances in Suffolk city
Median Income by Occupancy in Suffolk city
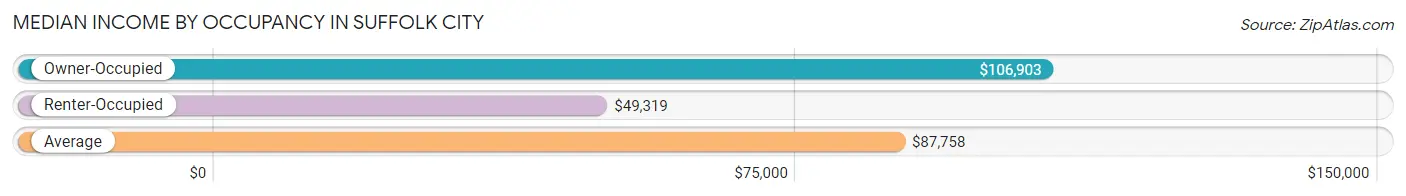
| Occupancy Type | # Households | Median Income |
| Owner-Occupied | 25,584 (70.4%) | $106,903 |
| Renter-Occupied | 10,734 (29.6%) | $49,319 |
| Average | 36,318 (100.0%) | $87,758 |
Occupancy by Householder Income Bracket in Suffolk city
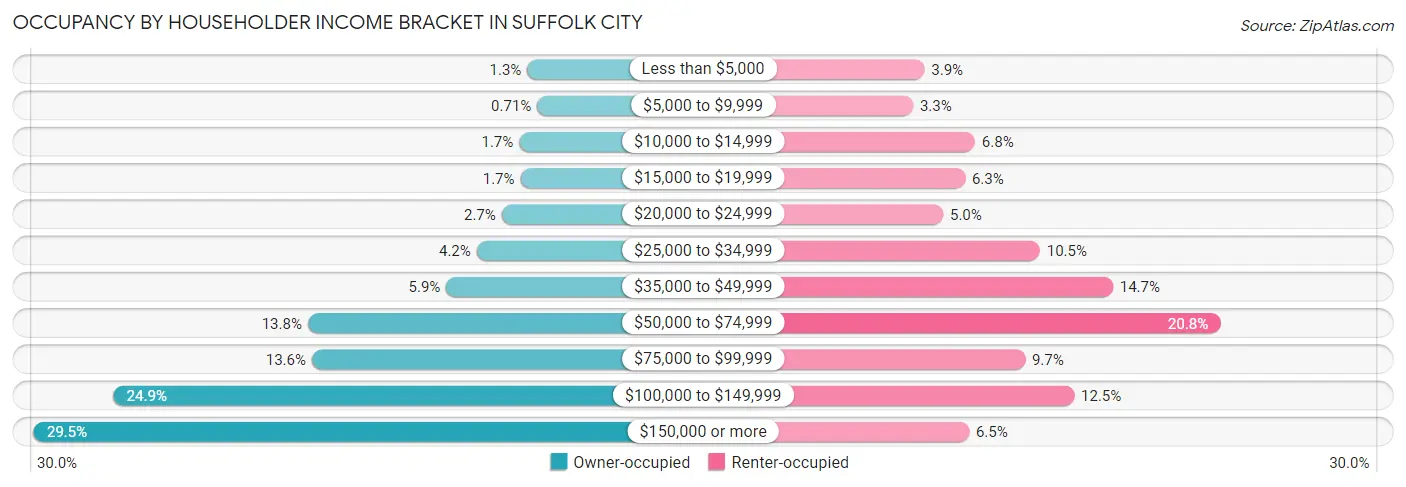
| Income Bracket | Owner-occupied | Renter-occupied |
| Less than $5,000 | 328 (1.3%) | 422 (3.9%) |
| $5,000 to $9,999 | 181 (0.7%) | 352 (3.3%) |
| $10,000 to $14,999 | 446 (1.7%) | 732 (6.8%) |
| $15,000 to $19,999 | 426 (1.7%) | 671 (6.2%) |
| $20,000 to $24,999 | 700 (2.7%) | 537 (5.0%) |
| $25,000 to $34,999 | 1,067 (4.2%) | 1,130 (10.5%) |
| $35,000 to $49,999 | 1,513 (5.9%) | 1,578 (14.7%) |
| $50,000 to $74,999 | 3,536 (13.8%) | 2,236 (20.8%) |
| $75,000 to $99,999 | 3,476 (13.6%) | 1,039 (9.7%) |
| $100,000 to $149,999 | 6,372 (24.9%) | 1,341 (12.5%) |
| $150,000 or more | 7,539 (29.5%) | 696 (6.5%) |
| Total | 25,584 (100.0%) | 10,734 (100.0%) |
Monthly Housing Cost Tiers in Suffolk city
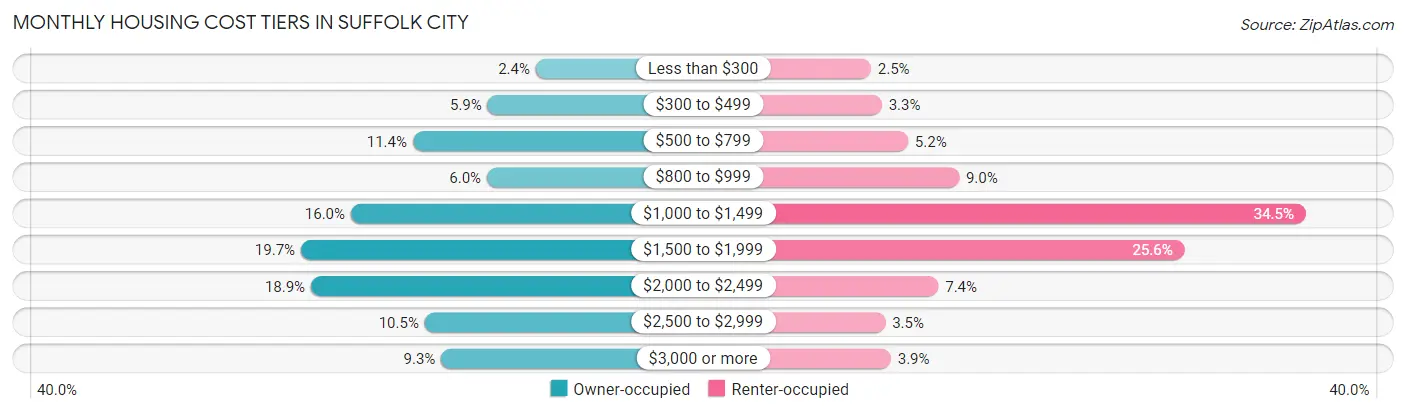
| Monthly Cost | Owner-occupied | Renter-occupied |
| Less than $300 | 600 (2.4%) | 264 (2.5%) |
| $300 to $499 | 1,510 (5.9%) | 350 (3.3%) |
| $500 to $799 | 2,920 (11.4%) | 557 (5.2%) |
| $800 to $999 | 1,522 (5.9%) | 961 (8.9%) |
| $1,000 to $1,499 | 4,087 (16.0%) | 3,702 (34.5%) |
| $1,500 to $1,999 | 5,028 (19.7%) | 2,744 (25.6%) |
| $2,000 to $2,499 | 4,838 (18.9%) | 798 (7.4%) |
| $2,500 to $2,999 | 2,695 (10.5%) | 378 (3.5%) |
| $3,000 or more | 2,384 (9.3%) | 422 (3.9%) |
| Total | 25,584 (100.0%) | 10,734 (100.0%) |
Physical Housing Characteristics in Suffolk city
Housing Structures in Suffolk city
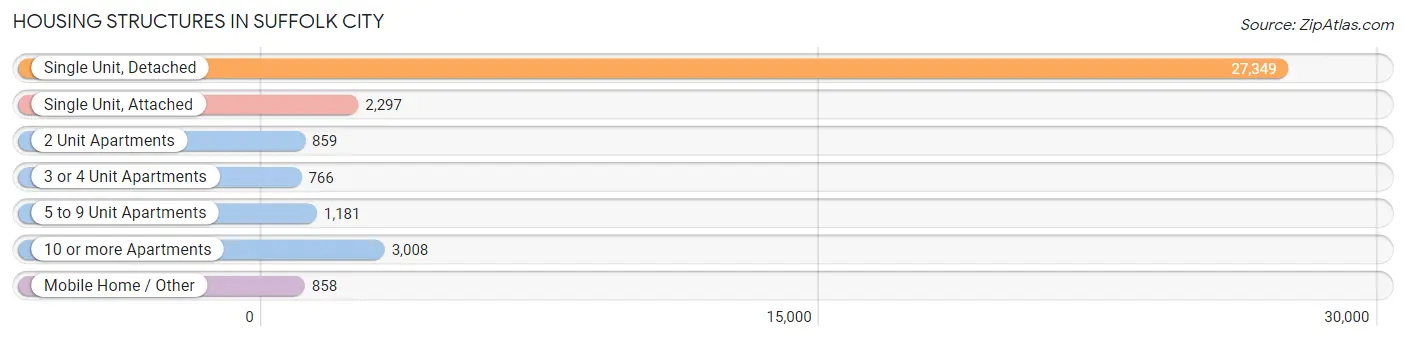
| Structure Type | # Housing Units | % Housing Units |
| Single Unit, Detached | 27,349 | 75.3% |
| Single Unit, Attached | 2,297 | 6.3% |
| 2 Unit Apartments | 859 | 2.4% |
| 3 or 4 Unit Apartments | 766 | 2.1% |
| 5 to 9 Unit Apartments | 1,181 | 3.3% |
| 10 or more Apartments | 3,008 | 8.3% |
| Mobile Home / Other | 858 | 2.4% |
| Total | 36,318 | 100.0% |
Housing Structures by Occupancy in Suffolk city
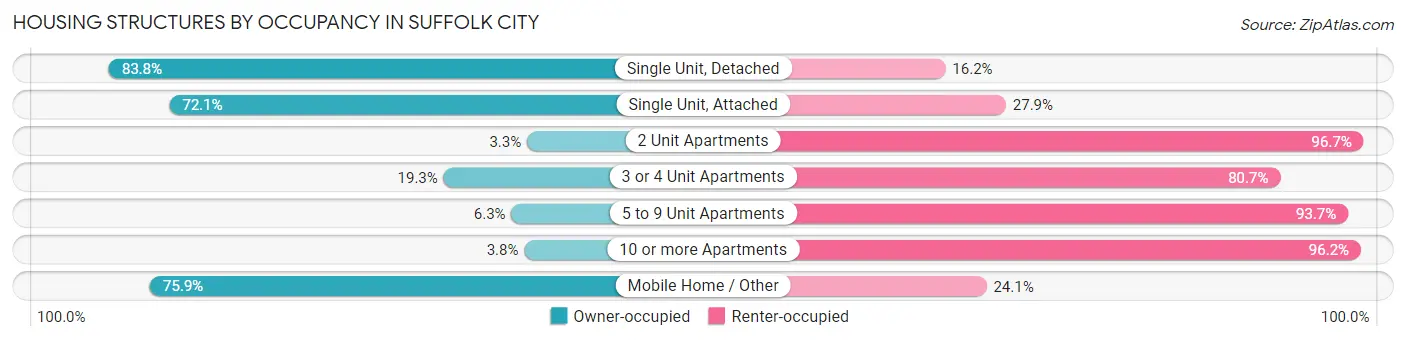
| Structure Type | Owner-occupied | Renter-occupied |
| Single Unit, Detached | 22,912 (83.8%) | 4,437 (16.2%) |
| Single Unit, Attached | 1,657 (72.1%) | 640 (27.9%) |
| 2 Unit Apartments | 28 (3.3%) | 831 (96.7%) |
| 3 or 4 Unit Apartments | 148 (19.3%) | 618 (80.7%) |
| 5 to 9 Unit Apartments | 74 (6.3%) | 1,107 (93.7%) |
| 10 or more Apartments | 114 (3.8%) | 2,894 (96.2%) |
| Mobile Home / Other | 651 (75.9%) | 207 (24.1%) |
| Total | 25,584 (70.4%) | 10,734 (29.6%) |
Housing Structures by Number of Rooms in Suffolk city
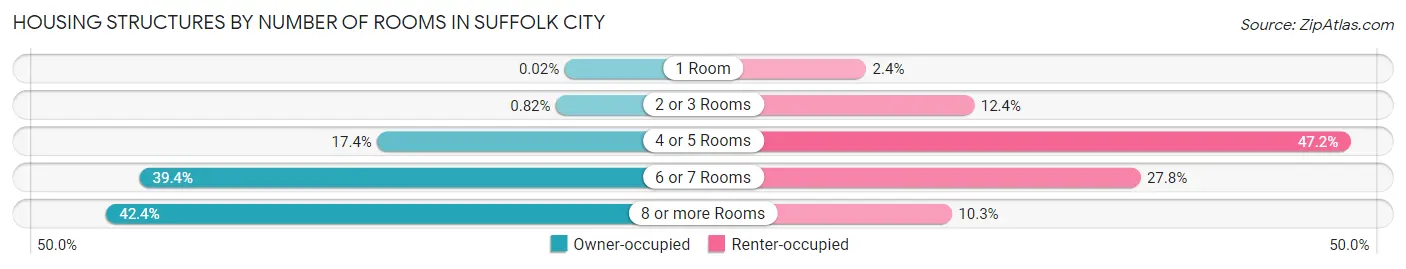
| Number of Rooms | Owner-occupied | Renter-occupied |
| 1 Room | 6 (0.0%) | 256 (2.4%) |
| 2 or 3 Rooms | 211 (0.8%) | 1,329 (12.4%) |
| 4 or 5 Rooms | 4,439 (17.3%) | 5,063 (47.2%) |
| 6 or 7 Rooms | 10,071 (39.4%) | 2,979 (27.8%) |
| 8 or more Rooms | 10,857 (42.4%) | 1,107 (10.3%) |
| Total | 25,584 (100.0%) | 10,734 (100.0%) |
Housing Structure by Heating Type in Suffolk city
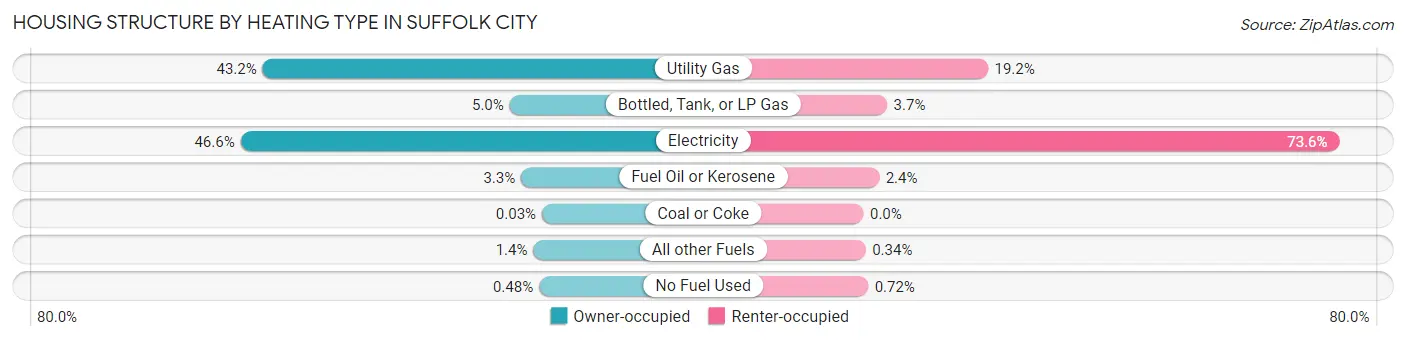
| Heating Type | Owner-occupied | Renter-occupied |
| Utility Gas | 11,056 (43.2%) | 2,065 (19.2%) |
| Bottled, Tank, or LP Gas | 1,285 (5.0%) | 392 (3.6%) |
| Electricity | 11,931 (46.6%) | 7,903 (73.6%) |
| Fuel Oil or Kerosene | 833 (3.3%) | 260 (2.4%) |
| Coal or Coke | 7 (0.0%) | 0 (0.0%) |
| All other Fuels | 348 (1.4%) | 37 (0.3%) |
| No Fuel Used | 124 (0.5%) | 77 (0.7%) |
| Total | 25,584 (100.0%) | 10,734 (100.0%) |
Household Vehicle Usage in Suffolk city
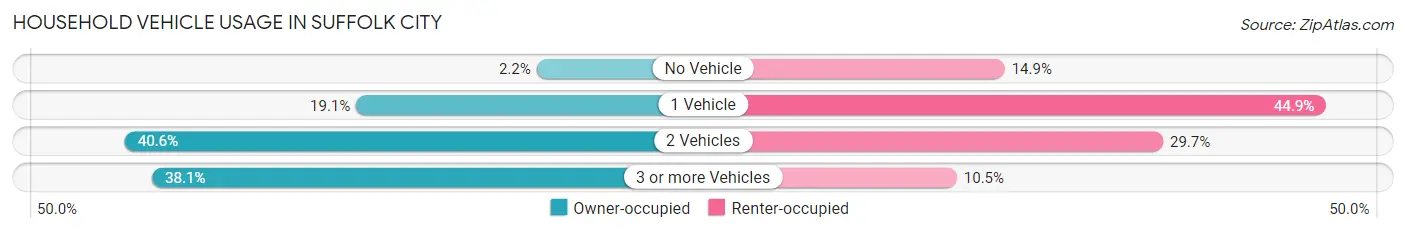
| Vehicles per Household | Owner-occupied | Renter-occupied |
| No Vehicle | 566 (2.2%) | 1,602 (14.9%) |
| 1 Vehicle | 4,874 (19.1%) | 4,822 (44.9%) |
| 2 Vehicles | 10,398 (40.6%) | 3,188 (29.7%) |
| 3 or more Vehicles | 9,746 (38.1%) | 1,122 (10.4%) |
| Total | 25,584 (100.0%) | 10,734 (100.0%) |
Real Estate & Mortgages in Suffolk city
Real Estate and Mortgage Overview in Suffolk city
| Characteristic | Without Mortgage | With Mortgage |
| Housing Units | 6,477 | 19,107 |
| Median Property Value | $273,500 | $324,300 |
| Median Household Income | $69,694 | $6,316 |
| Monthly Housing Costs | $644 | $2,384 |
| Real Estate Taxes | $2,800 | $809 |
Property Value by Mortgage Status in Suffolk city
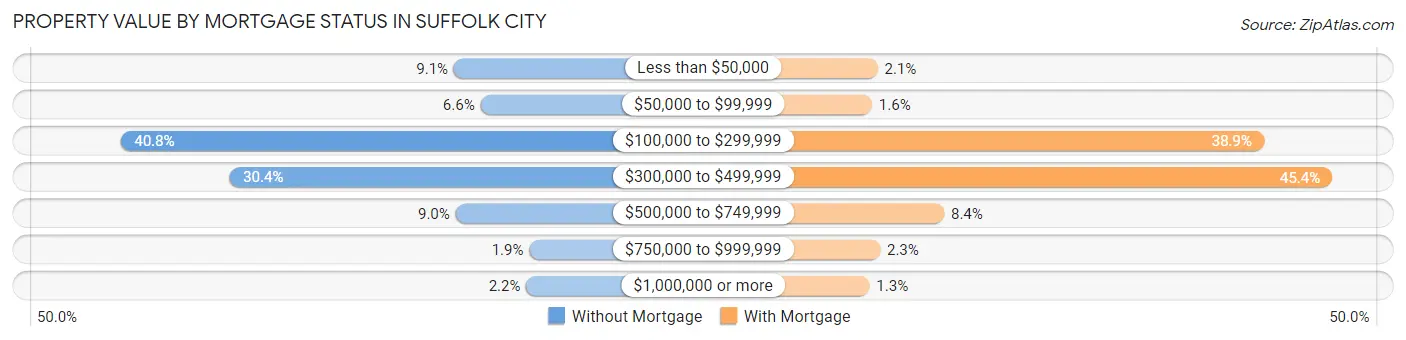
| Property Value | Without Mortgage | With Mortgage |
| Less than $50,000 | 590 (9.1%) | 401 (2.1%) |
| $50,000 to $99,999 | 426 (6.6%) | 298 (1.6%) |
| $100,000 to $299,999 | 2,642 (40.8%) | 7,428 (38.9%) |
| $300,000 to $499,999 | 1,970 (30.4%) | 8,671 (45.4%) |
| $500,000 to $749,999 | 580 (8.9%) | 1,611 (8.4%) |
| $750,000 to $999,999 | 125 (1.9%) | 446 (2.3%) |
| $1,000,000 or more | 144 (2.2%) | 252 (1.3%) |
| Total | 6,477 (100.0%) | 19,107 (100.0%) |
Household Income by Mortgage Status in Suffolk city
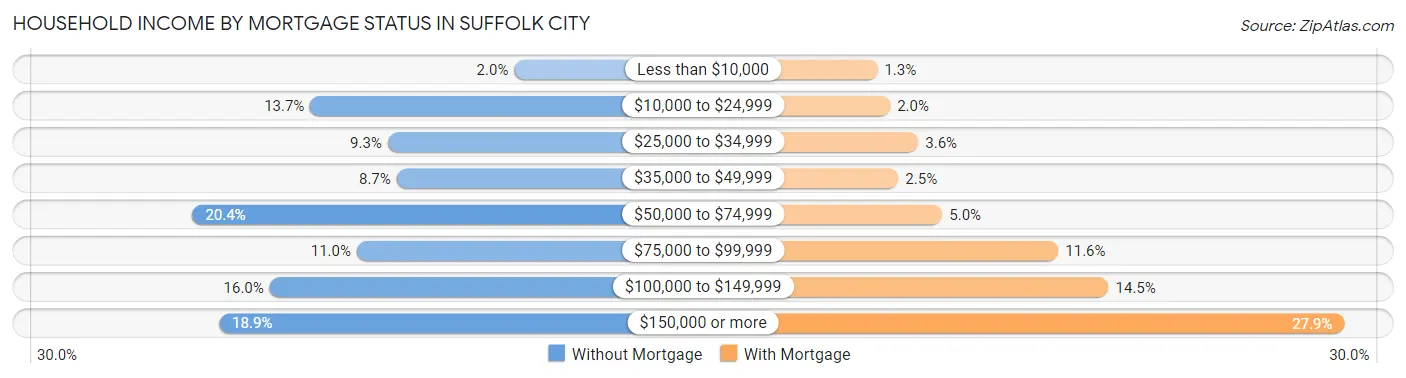
| Household Income | Without Mortgage | With Mortgage |
| Less than $10,000 | 131 (2.0%) | 238 (1.3%) |
| $10,000 to $24,999 | 886 (13.7%) | 378 (2.0%) |
| $25,000 to $34,999 | 599 (9.2%) | 686 (3.6%) |
| $35,000 to $49,999 | 566 (8.7%) | 468 (2.5%) |
| $50,000 to $74,999 | 1,322 (20.4%) | 947 (5.0%) |
| $75,000 to $99,999 | 714 (11.0%) | 2,214 (11.6%) |
| $100,000 to $149,999 | 1,036 (16.0%) | 2,762 (14.5%) |
| $150,000 or more | 1,223 (18.9%) | 5,336 (27.9%) |
| Total | 6,477 (100.0%) | 19,107 (100.0%) |
Property Value to Household Income Ratio in Suffolk city
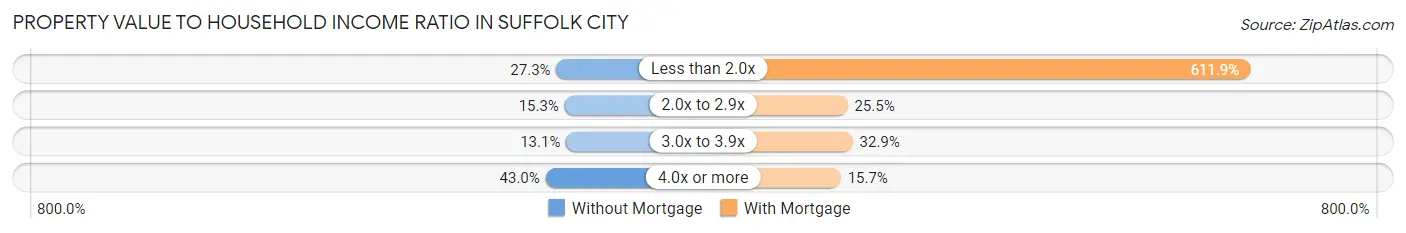
| Value-to-Income Ratio | Without Mortgage | With Mortgage |
| Less than 2.0x | 1,769 (27.3%) | 116,912 (611.9%) |
| 2.0x to 2.9x | 991 (15.3%) | 4,873 (25.5%) |
| 3.0x to 3.9x | 846 (13.1%) | 6,290 (32.9%) |
| 4.0x or more | 2,787 (43.0%) | 2,991 (15.7%) |
| Total | 6,477 (100.0%) | 19,107 (100.0%) |
Real Estate Taxes by Mortgage Status in Suffolk city
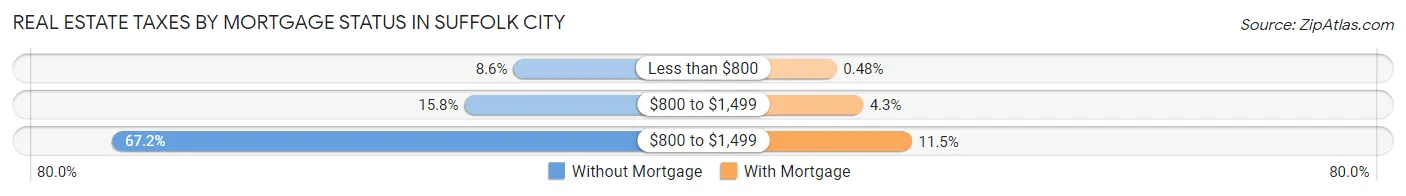
| Property Taxes | Without Mortgage | With Mortgage |
| Less than $800 | 556 (8.6%) | 92 (0.5%) |
| $800 to $1,499 | 1,020 (15.8%) | 830 (4.3%) |
| $800 to $1,499 | 4,353 (67.2%) | 2,193 (11.5%) |
| Total | 6,477 (100.0%) | 19,107 (100.0%) |
Health & Disability in Suffolk city
Health Insurance Coverage by Age in Suffolk city
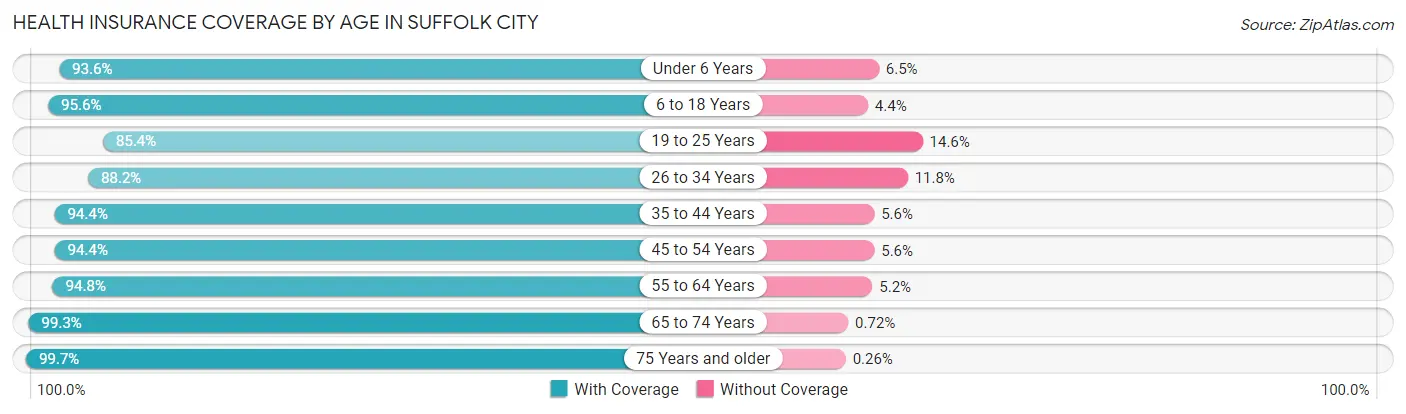
| Age Bracket | With Coverage | Without Coverage |
| Under 6 Years | 6,772 (93.5%) | 467 (6.5%) |
| 6 to 18 Years | 15,762 (95.6%) | 726 (4.4%) |
| 19 to 25 Years | 6,218 (85.4%) | 1,063 (14.6%) |
| 26 to 34 Years | 9,284 (88.2%) | 1,244 (11.8%) |
| 35 to 44 Years | 10,905 (94.4%) | 644 (5.6%) |
| 45 to 54 Years | 11,363 (94.4%) | 673 (5.6%) |
| 55 to 64 Years | 12,121 (94.8%) | 669 (5.2%) |
| 65 to 74 Years | 8,276 (99.3%) | 60 (0.7%) |
| 75 Years and older | 5,418 (99.7%) | 14 (0.3%) |
| Total | 86,119 (93.9%) | 5,560 (6.1%) |
Health Insurance Coverage by Citizenship Status in Suffolk city
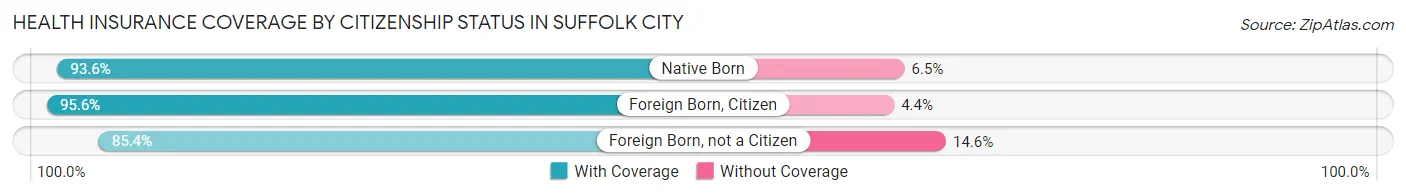
| Citizenship Status | With Coverage | Without Coverage |
| Native Born | 6,772 (93.5%) | 467 (6.5%) |
| Foreign Born, Citizen | 15,762 (95.6%) | 726 (4.4%) |
| Foreign Born, not a Citizen | 6,218 (85.4%) | 1,063 (14.6%) |
Health Insurance Coverage by Household Income in Suffolk city
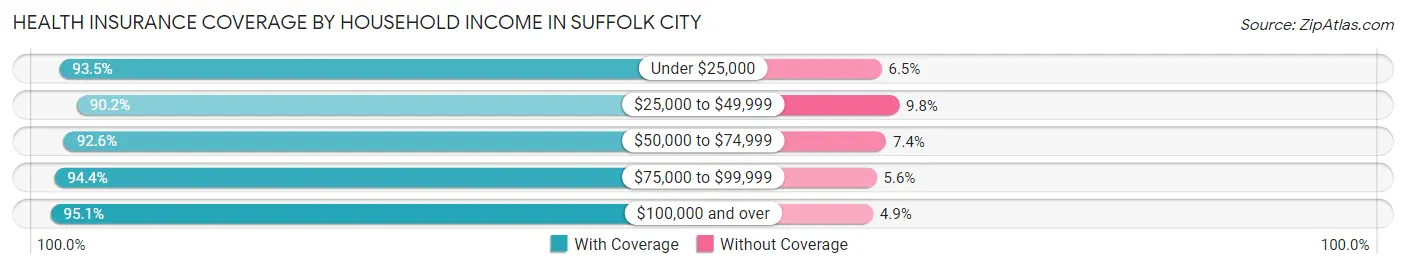
| Household Income | With Coverage | Without Coverage |
| Under $25,000 | 8,171 (93.5%) | 569 (6.5%) |
| $25,000 to $49,999 | 9,573 (90.2%) | 1,040 (9.8%) |
| $50,000 to $74,999 | 12,025 (92.6%) | 955 (7.4%) |
| $75,000 to $99,999 | 11,739 (94.4%) | 694 (5.6%) |
| $100,000 and over | 44,489 (95.1%) | 2,285 (4.9%) |
Public vs Private Health Insurance Coverage by Age in Suffolk city
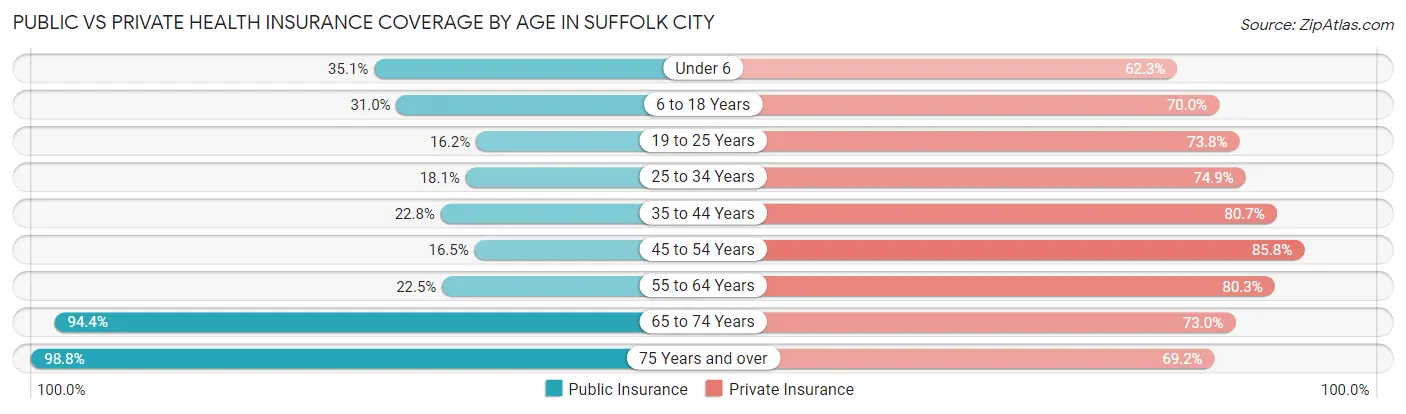
| Age Bracket | Public Insurance | Private Insurance |
| Under 6 | 2,542 (35.1%) | 4,507 (62.3%) |
| 6 to 18 Years | 5,108 (31.0%) | 11,542 (70.0%) |
| 19 to 25 Years | 1,180 (16.2%) | 5,371 (73.8%) |
| 25 to 34 Years | 1,909 (18.1%) | 7,890 (74.9%) |
| 35 to 44 Years | 2,630 (22.8%) | 9,319 (80.7%) |
| 45 to 54 Years | 1,985 (16.5%) | 10,325 (85.8%) |
| 55 to 64 Years | 2,877 (22.5%) | 10,273 (80.3%) |
| 65 to 74 Years | 7,872 (94.4%) | 6,084 (73.0%) |
| 75 Years and over | 5,364 (98.8%) | 3,757 (69.2%) |
| Total | 31,467 (34.3%) | 69,068 (75.3%) |
Disability Status by Sex by Age in Suffolk city
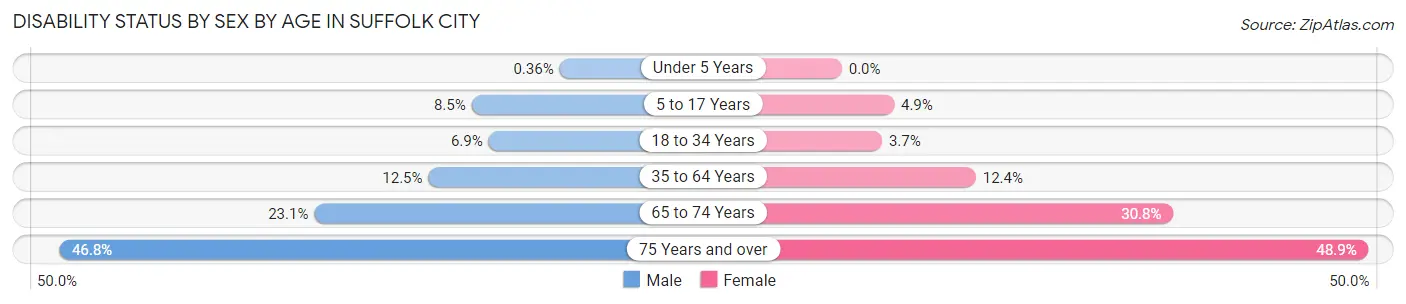
| Age Bracket | Male | Female |
| Under 5 Years | 11 (0.4%) | 0 (0.0%) |
| 5 to 17 Years | 710 (8.5%) | 392 (4.9%) |
| 18 to 34 Years | 643 (6.9%) | 368 (3.7%) |
| 35 to 64 Years | 2,153 (12.5%) | 2,388 (12.4%) |
| 65 to 74 Years | 917 (23.1%) | 1,344 (30.8%) |
| 75 Years and over | 999 (46.8%) | 1,612 (48.9%) |
Disability Class by Sex by Age in Suffolk city
Disability Class: Hearing Difficulty
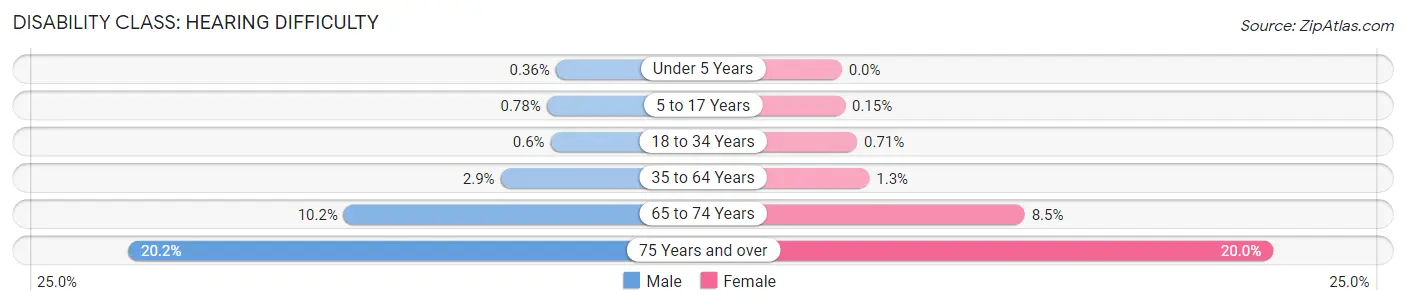
| Age Bracket | Male | Female |
| Under 5 Years | 11 (0.4%) | 0 (0.0%) |
| 5 to 17 Years | 65 (0.8%) | 12 (0.2%) |
| 18 to 34 Years | 56 (0.6%) | 70 (0.7%) |
| 35 to 64 Years | 502 (2.9%) | 245 (1.3%) |
| 65 to 74 Years | 404 (10.2%) | 371 (8.5%) |
| 75 Years and over | 431 (20.2%) | 660 (20.0%) |
Disability Class: Vision Difficulty
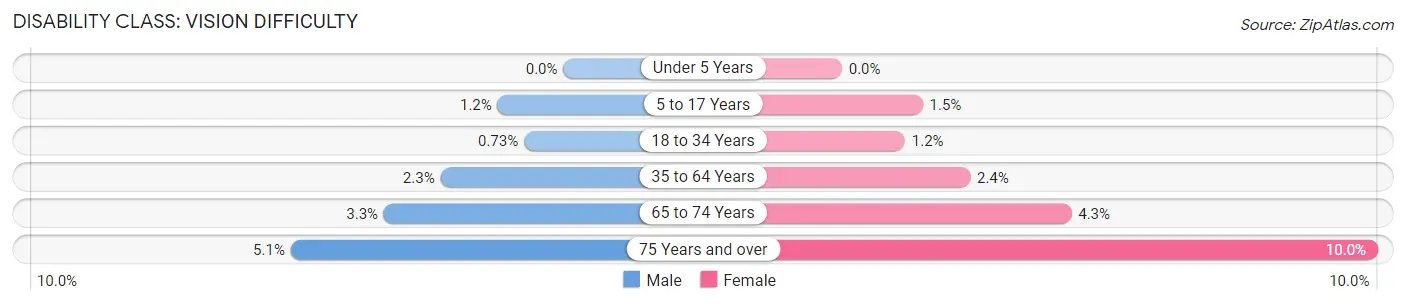
| Age Bracket | Male | Female |
| Under 5 Years | 0 (0.0%) | 0 (0.0%) |
| 5 to 17 Years | 102 (1.2%) | 121 (1.5%) |
| 18 to 34 Years | 68 (0.7%) | 115 (1.2%) |
| 35 to 64 Years | 392 (2.3%) | 456 (2.4%) |
| 65 to 74 Years | 132 (3.3%) | 186 (4.3%) |
| 75 Years and over | 108 (5.1%) | 328 (10.0%) |
Disability Class: Cognitive Difficulty
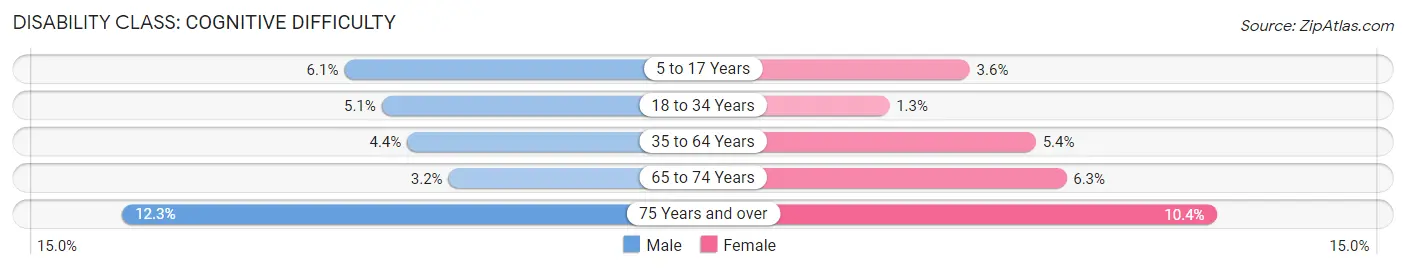
| Age Bracket | Male | Female |
| 5 to 17 Years | 508 (6.1%) | 288 (3.6%) |
| 18 to 34 Years | 469 (5.1%) | 130 (1.3%) |
| 35 to 64 Years | 748 (4.3%) | 1,037 (5.4%) |
| 65 to 74 Years | 127 (3.2%) | 273 (6.2%) |
| 75 Years and over | 262 (12.3%) | 344 (10.4%) |
Disability Class: Ambulatory Difficulty
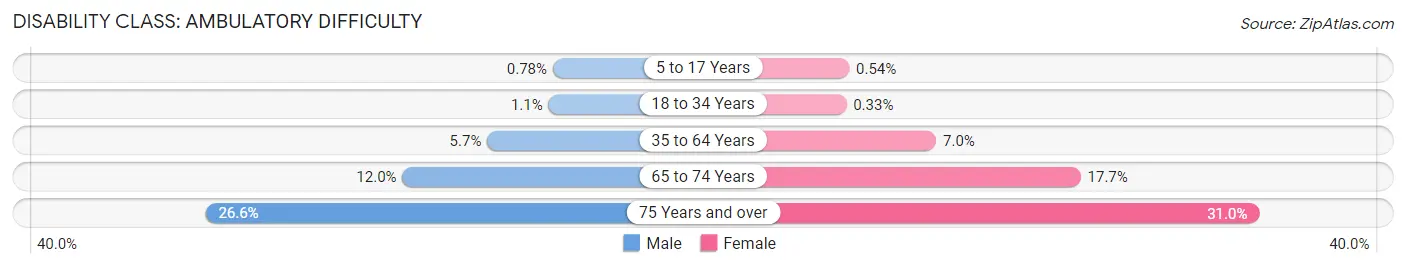
| Age Bracket | Male | Female |
| 5 to 17 Years | 65 (0.8%) | 44 (0.5%) |
| 18 to 34 Years | 102 (1.1%) | 33 (0.3%) |
| 35 to 64 Years | 971 (5.7%) | 1,344 (7.0%) |
| 65 to 74 Years | 474 (11.9%) | 775 (17.7%) |
| 75 Years and over | 567 (26.6%) | 1,022 (31.0%) |
Disability Class: Self-Care Difficulty
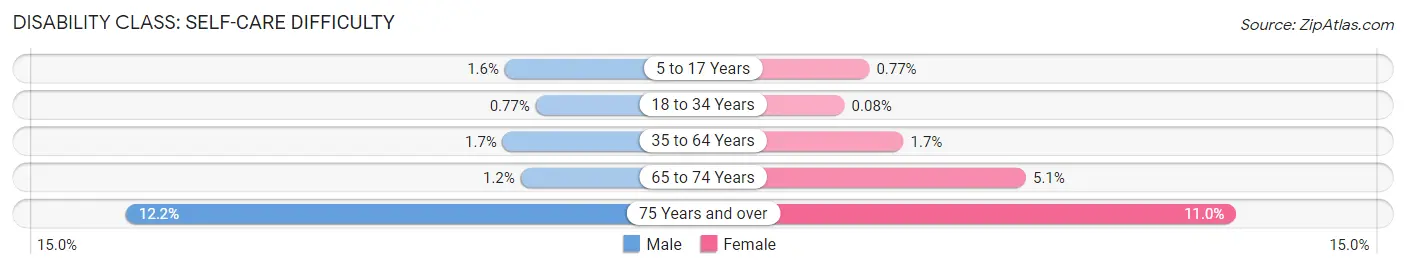
| Age Bracket | Male | Female |
| 5 to 17 Years | 136 (1.6%) | 62 (0.8%) |
| 18 to 34 Years | 71 (0.8%) | 8 (0.1%) |
| 35 to 64 Years | 290 (1.7%) | 331 (1.7%) |
| 65 to 74 Years | 47 (1.2%) | 224 (5.1%) |
| 75 Years and over | 260 (12.2%) | 362 (11.0%) |
Technology Access in Suffolk city
Computing Device Access in Suffolk city
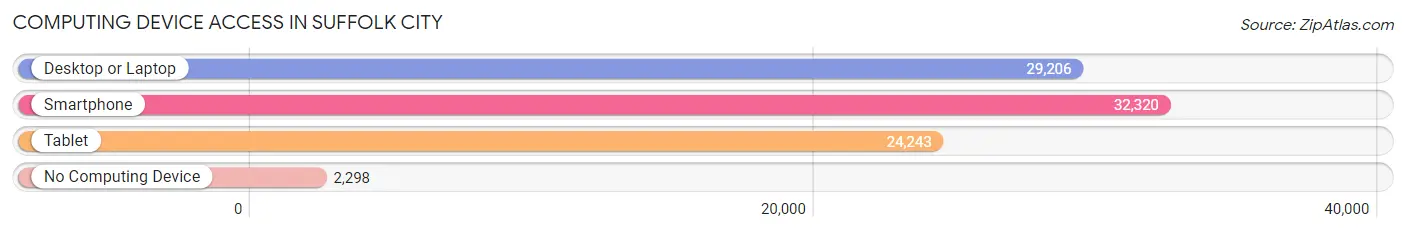
| Device Type | # Households | % Households |
| Desktop or Laptop | 29,206 | 80.4% |
| Smartphone | 32,320 | 89.0% |
| Tablet | 24,243 | 66.7% |
| No Computing Device | 2,298 | 6.3% |
| Total | 36,318 | 100.0% |
Internet Access in Suffolk city
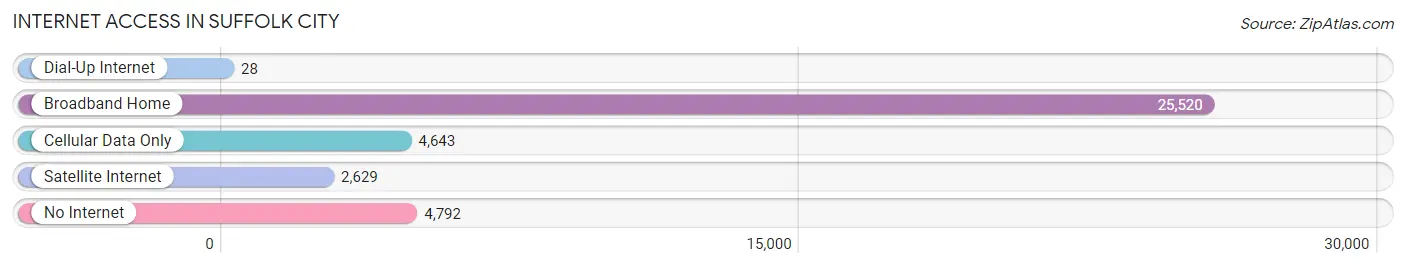
| Internet Type | # Households | % Households |
| Dial-Up Internet | 28 | 0.1% |
| Broadband Home | 25,520 | 70.3% |
| Cellular Data Only | 4,643 | 12.8% |
| Satellite Internet | 2,629 | 7.2% |
| No Internet | 4,792 | 13.2% |
| Total | 36,318 | 100.0% |
Suffolk city Summary
Suffolk City, Virginia is a city located in the Hampton Roads region of southeastern Virginia. It is the largest city in the region and the fourth largest city in the state. The city is situated on the Nansemond River, which is a tributary of the James River. Suffolk is located in the heart of the Hampton Roads metropolitan area, which is home to over 1.7 million people.
History
Suffolk was founded in 1742 by English colonists. The city was named after the county of Suffolk in England. The city was originally part of Nansemond County, which was created in 1646. In 1750, the city was incorporated as a town and in 1808, it was incorporated as a city.
During the American Revolution, Suffolk was a major port for the British. The city was also the site of several battles during the Civil War. In 1862, the Battle of Suffolk was fought in the city. The Union forces were victorious and the city remained in Union hands for the remainder of the war.
In the late 19th century, Suffolk became an important center for the peanut industry. The city was home to several peanut processing plants and was known as the “Peanut Capital of the World.”
Geography
Suffolk is located in southeastern Virginia, in the Hampton Roads region. The city is situated on the Nansemond River, which is a tributary of the James River. The city is bordered by the cities of Chesapeake to the north, Portsmouth to the east, and Virginia Beach to the south.
The city has a total area of 57.2 square miles, of which 55.2 square miles is land and 2.0 square miles is water. The city is located in a humid subtropical climate zone, with hot, humid summers and mild winters.
Economy
Suffolk’s economy is largely based on the service industry. The city is home to several large employers, including Sentara Healthcare, Dollar Tree, and the U.S. Navy. The city is also home to several large manufacturing companies, including Smithfield Foods, which is the largest pork producer in the world.
The city is also home to several large retail centers, including the Harbour View Shopping Center and the Suffolk Shopping Center. The city is also home to several large educational institutions, including Old Dominion University and Tidewater Community College.
Demographics
As of the 2010 census, the population of Suffolk was 84,585. The city has a population density of 1,500 people per square mile. The racial makeup of the city is 63.3% White, 28.2% African American, 0.5% Native American, 2.2% Asian, 0.1% Pacific Islander, 3.2% from other races, and 2.7% from two or more races.
The median household income in Suffolk is $50,845, and the median family income is $60,945. The city has a poverty rate of 13.3%. The city’s population is well-educated, with 37.2% of the population having a bachelor’s degree or higher.
Conclusion
Suffolk City, Virginia is a city located in the Hampton Roads region of southeastern Virginia. It is the largest city in the region and the fourth largest city in the state. The city is situated on the Nansemond River, which is a tributary of the James River. Suffolk is home to several large employers, including Sentara Healthcare, Dollar Tree, and the U.S. Navy. The city’s economy is largely based on the service industry, and the city is home to several large retail centers and educational institutions. The population of Suffolk is 84,585, and the city has a population density of 1,500 people per square mile. The median household income in Suffolk is $50,845, and the median family income is $60,945. The city has a poverty rate of 13.3%.
Common Questions
What is Per Capita Income in Suffolk city?
Per Capita income in Suffolk city is $44,004.
What is the Median Family Income in Suffolk city?
Median Family Income in Suffolk city is $105,023.
What is the Median Household income in Suffolk city?
Median Household Income in Suffolk city is $87,758.
What is Income or Wage Gap in Suffolk city?
Income or Wage Gap in Suffolk city is 33.7%.
Women in Suffolk city earn 66.3 cents for every dollar earned by a man.
What is Family Income Deficit in Suffolk city?
Family Income Deficit in Suffolk city is $11,255.
Families that are below poverty line in Suffolk city earn $11,255 less on average than the poverty threshold level.
What is Inequality or Gini Index in Suffolk city?
Inequality or Gini Index in Suffolk city is 0.45.
What is the Total Population of Suffolk city?
Total Population of Suffolk city is 94,856.
What is the Total Male Population of Suffolk city?
Total Male Population of Suffolk city is 46,381.
What is the Total Female Population of Suffolk city?
Total Female Population of Suffolk city is 48,475.
What is the Ratio of Males per 100 Females in Suffolk city?
There are 95.68 Males per 100 Females in Suffolk city.
What is the Ratio of Females per 100 Males in Suffolk city?
There are 104.51 Females per 100 Males in Suffolk city.
What is the Median Population Age in Suffolk city?
Median Population Age in Suffolk city is 38.5 Years.
What is the Average Family Size in Suffolk city
Average Family Size in Suffolk city is 3.1 People.
What is the Average Household Size in Suffolk city
Average Household Size in Suffolk city is 2.6 People.
How Large is the Labor Force in Suffolk city?
There are 49,958 People in the Labor Forcein in Suffolk city.
What is the Percentage of People in the Labor Force in Suffolk city?
66.5% of People are in the Labor Force in Suffolk city.
What is the Unemployment Rate in Suffolk city?
Unemployment Rate in Suffolk city is 6.3%.