Stafford County, VA Map & Demographics
Stafford County Map
Stafford County Overview
$48,971
PER CAPITA INCOME
$141,167
AVG FAMILY INCOME
$128,036
AVG HOUSEHOLD INCOME
41.3%
WAGE / INCOME GAP [ % ]
58.7¢/ $1
WAGE / INCOME GAP [ $ ]
$9,455
FAMILY INCOME DEFICIT
0.38
INEQUALITY / GINI INDEX
157,606
TOTAL POPULATION
79,848
MALE POPULATION
77,758
FEMALE POPULATION
102.69
MALES / 100 FEMALES
97.38
FEMALES / 100 MALES
36.4
MEDIAN AGE
3.5
AVG FAMILY SIZE
3.1
AVG HOUSEHOLD SIZE
83,688
LABOR FORCE [ PEOPLE ]
69.0%
PERCENT IN LABOR FORCE
3.9%
UNEMPLOYMENT RATE
Stafford County Area Codes
Income in Stafford County
Income Overview in Stafford County
Per Capita Income in Stafford County is $48,971, while median incomes of families and households are $141,167 and $128,036 respectively.
| Characteristic | Number | Measure |
| Per Capita Income | 157,606 | $48,971 |
| Median Family Income | 39,295 | $141,167 |
| Mean Family Income | 39,295 | $160,549 |
| Median Household Income | 50,313 | $128,036 |
| Mean Household Income | 50,313 | $148,272 |
| Income Deficit | 39,295 | $9,455 |
| Wage / Income Gap (%) | 157,606 | 41.33% |
| Wage / Income Gap ($) | 157,606 | 58.67¢ per $1 |
| Gini / Inequality Index | 157,606 | 0.38 |
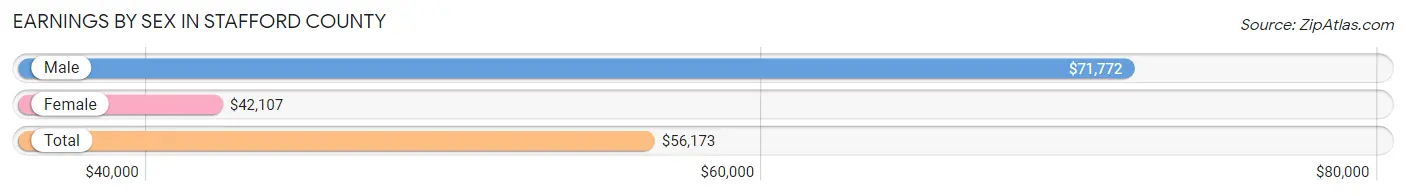
Earnings by Sex in Stafford County
Average Earnings in Stafford County are $56,173, $71,772 for men and $42,107 for women, a difference of 41.3%.
| Sex | Number | Average Earnings |
| Male | 47,873 (55.1%) | $71,772 |
| Female | 39,019 (44.9%) | $42,107 |
| Total | 86,892 (100.0%) | $56,173 |
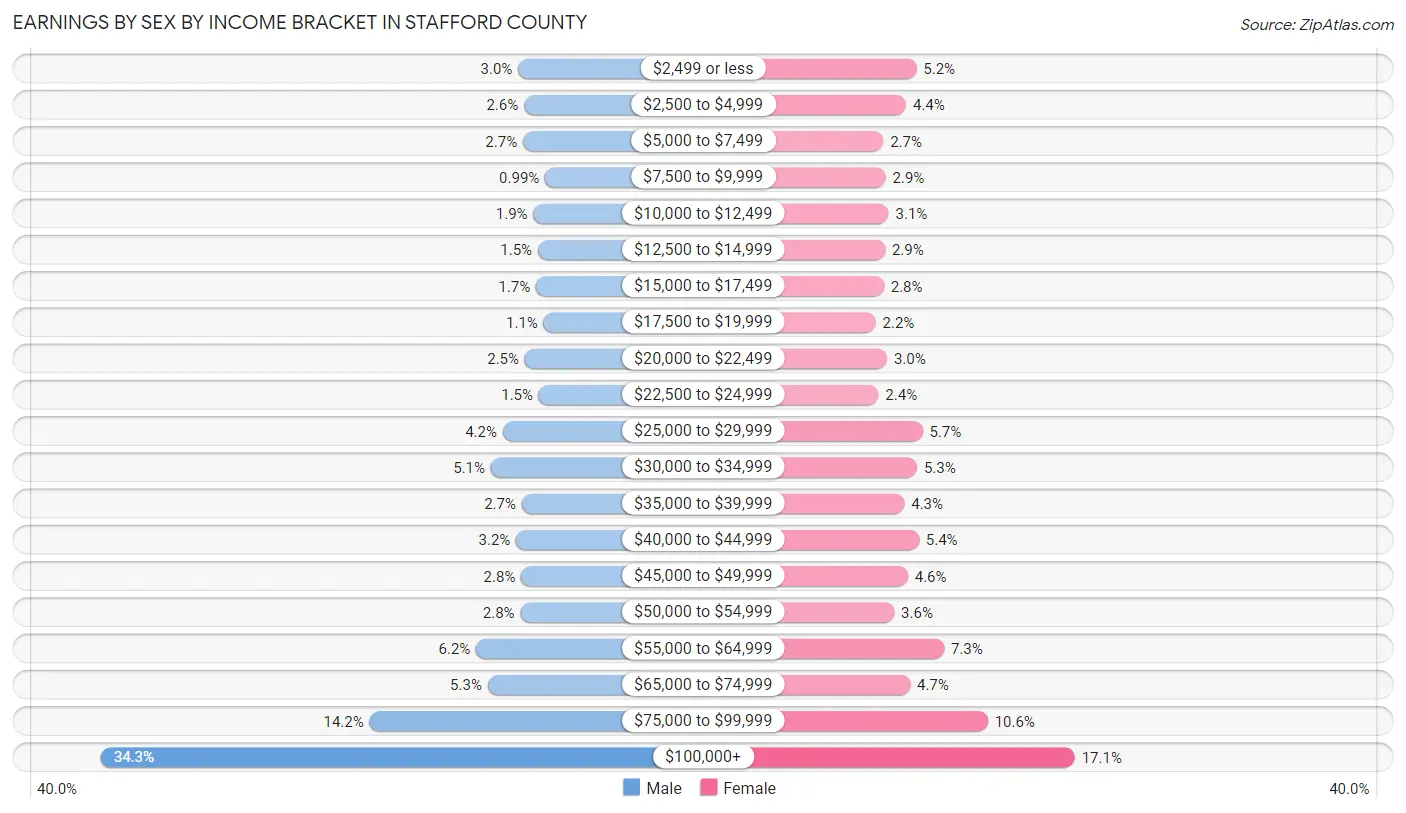
Earnings by Sex by Income Bracket in Stafford County
The most common earnings brackets in Stafford County are $100,000+ for men (16,416 | 34.3%) and $100,000+ for women (6,664 | 17.1%).
| Income | Male | Female |
| $2,499 or less | 1,439 (3.0%) | 2,031 (5.2%) |
| $2,500 to $4,999 | 1,232 (2.6%) | 1,731 (4.4%) |
| $5,000 to $7,499 | 1,271 (2.6%) | 1,065 (2.7%) |
| $7,500 to $9,999 | 472 (1.0%) | 1,135 (2.9%) |
| $10,000 to $12,499 | 897 (1.9%) | 1,221 (3.1%) |
| $12,500 to $14,999 | 734 (1.5%) | 1,116 (2.9%) |
| $15,000 to $17,499 | 799 (1.7%) | 1,081 (2.8%) |
| $17,500 to $19,999 | 525 (1.1%) | 842 (2.2%) |
| $20,000 to $22,499 | 1,201 (2.5%) | 1,175 (3.0%) |
| $22,500 to $24,999 | 699 (1.5%) | 924 (2.4%) |
| $25,000 to $29,999 | 1,993 (4.2%) | 2,213 (5.7%) |
| $30,000 to $34,999 | 2,424 (5.1%) | 2,053 (5.3%) |
| $35,000 to $39,999 | 1,311 (2.7%) | 1,680 (4.3%) |
| $40,000 to $44,999 | 1,511 (3.2%) | 2,107 (5.4%) |
| $45,000 to $49,999 | 1,333 (2.8%) | 1,783 (4.6%) |
| $50,000 to $54,999 | 1,360 (2.8%) | 1,386 (3.5%) |
| $55,000 to $64,999 | 2,951 (6.2%) | 2,840 (7.3%) |
| $65,000 to $74,999 | 2,531 (5.3%) | 1,851 (4.7%) |
| $75,000 to $99,999 | 6,774 (14.1%) | 4,121 (10.6%) |
| $100,000+ | 16,416 (34.3%) | 6,664 (17.1%) |
| Total | 47,873 (100.0%) | 39,019 (100.0%) |
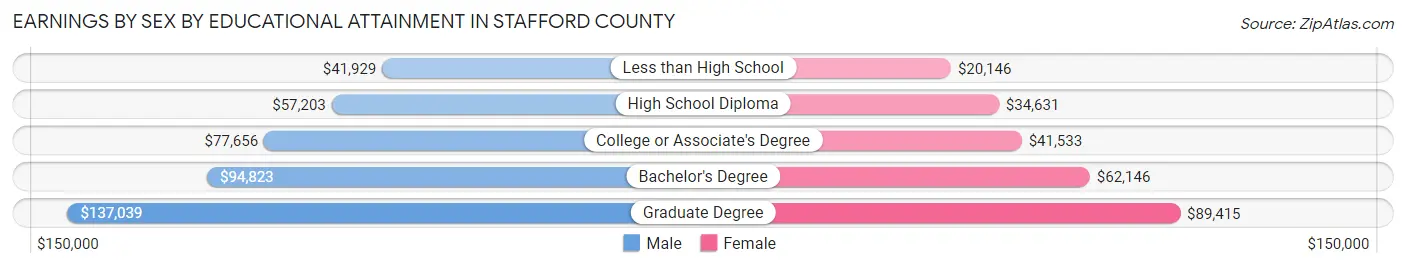
Earnings by Sex by Educational Attainment in Stafford County
Average earnings in Stafford County are $82,458 for men and $49,969 for women, a difference of 39.4%. Men with an educational attainment of graduate degree enjoy the highest average annual earnings of $137,039, while those with less than high school education earn the least with $41,929. Women with an educational attainment of graduate degree earn the most with the average annual earnings of $89,415, while those with less than high school education have the smallest earnings of $20,146.
| Educational Attainment | Male Income | Female Income |
| Less than High School | $41,929 | $20,146 |
| High School Diploma | $57,203 | $34,631 |
| College or Associate's Degree | $77,656 | $41,533 |
| Bachelor's Degree | $94,823 | $62,146 |
| Graduate Degree | $137,039 | $89,415 |
| Total | $82,458 | $49,969 |
Family Income in Stafford County
Family Income Brackets in Stafford County
According to the Stafford County family income data, there are 10,924 families falling into the $200,000+ income range, which is the most common income bracket and makes up 27.8% of all families. Conversely, the $10,000 to $14,999 income bracket is the least frequent group with only 196 families (0.5%) belonging to this category.
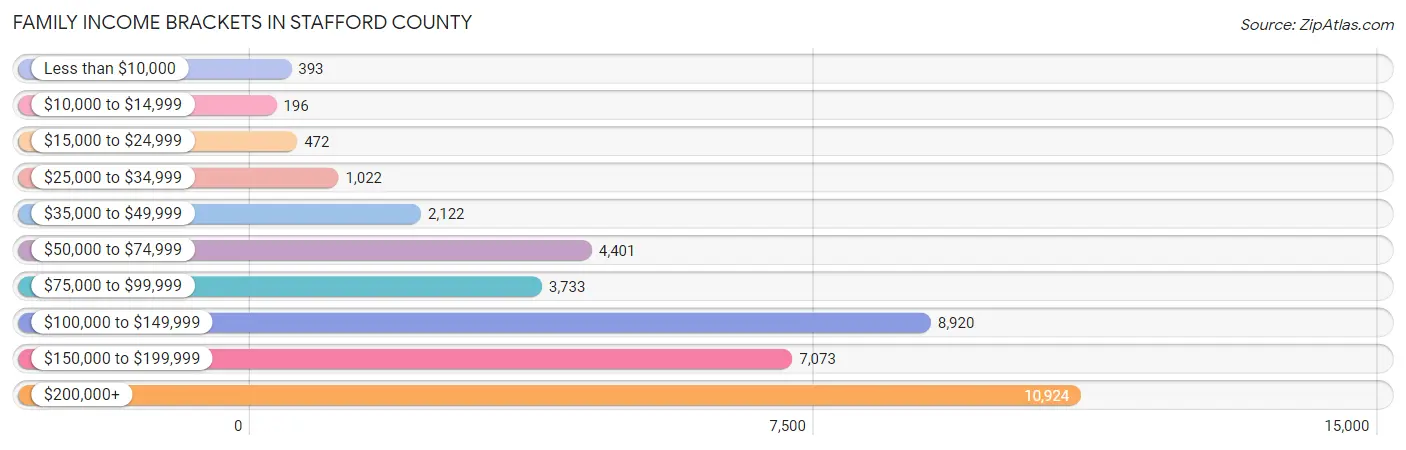
| Income Bracket | # Families | % Families |
| Less than $10,000 | 393 | 1.0% |
| $10,000 to $14,999 | 196 | 0.5% |
| $15,000 to $24,999 | 472 | 1.2% |
| $25,000 to $34,999 | 1,022 | 2.6% |
| $35,000 to $49,999 | 2,122 | 5.4% |
| $50,000 to $74,999 | 4,401 | 11.2% |
| $75,000 to $99,999 | 3,733 | 9.5% |
| $100,000 to $149,999 | 8,920 | 22.7% |
| $150,000 to $199,999 | 7,073 | 18.0% |
| $200,000+ | 10,924 | 27.8% |
Family Income by Famaliy Size in Stafford County
5-person families (4,511 | 11.5%) account for the highest median family income in Stafford County with $158,750 per family, while 2-person families (13,858 | 35.3%) have the highest median income of $63,935 per family member.
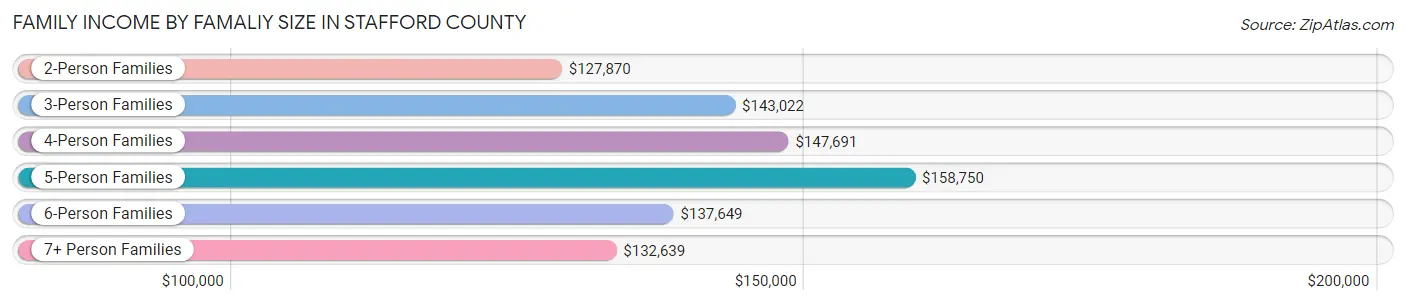
| Income Bracket | # Families | Median Income |
| 2-Person Families | 13,858 (35.3%) | $127,870 |
| 3-Person Families | 9,174 (23.4%) | $143,022 |
| 4-Person Families | 8,696 (22.1%) | $147,691 |
| 5-Person Families | 4,511 (11.5%) | $158,750 |
| 6-Person Families | 2,159 (5.5%) | $137,649 |
| 7+ Person Families | 897 (2.3%) | $132,639 |
| Total | 39,295 (100.0%) | $141,167 |
Family Income by Number of Earners in Stafford County
The median family income in Stafford County is $141,167, with families comprising 3+ earners (6,118) having the highest median family income of $206,435, while families with no earners (3,670) have the lowest median family income of $79,667, accounting for 15.6% and 9.3% of families, respectively.
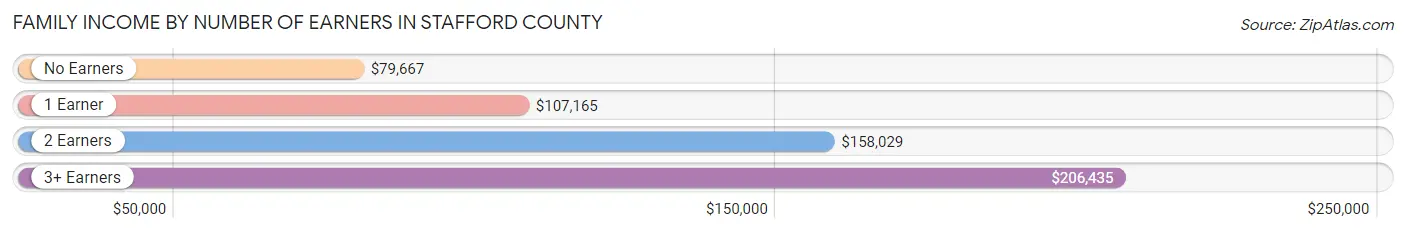
| Number of Earners | # Families | Median Income |
| No Earners | 3,670 (9.3%) | $79,667 |
| 1 Earner | 11,621 (29.6%) | $107,165 |
| 2 Earners | 17,886 (45.5%) | $158,029 |
| 3+ Earners | 6,118 (15.6%) | $206,435 |
| Total | 39,295 (100.0%) | $141,167 |
Household Income in Stafford County
Household Income Brackets in Stafford County
With 12,075 households falling in the category, the $200,000+ income range is the most frequent in Stafford County, accounting for 24.0% of all households. In contrast, only 403 households (0.8%) fall into the $10,000 to $14,999 income bracket, making it the least populous group.
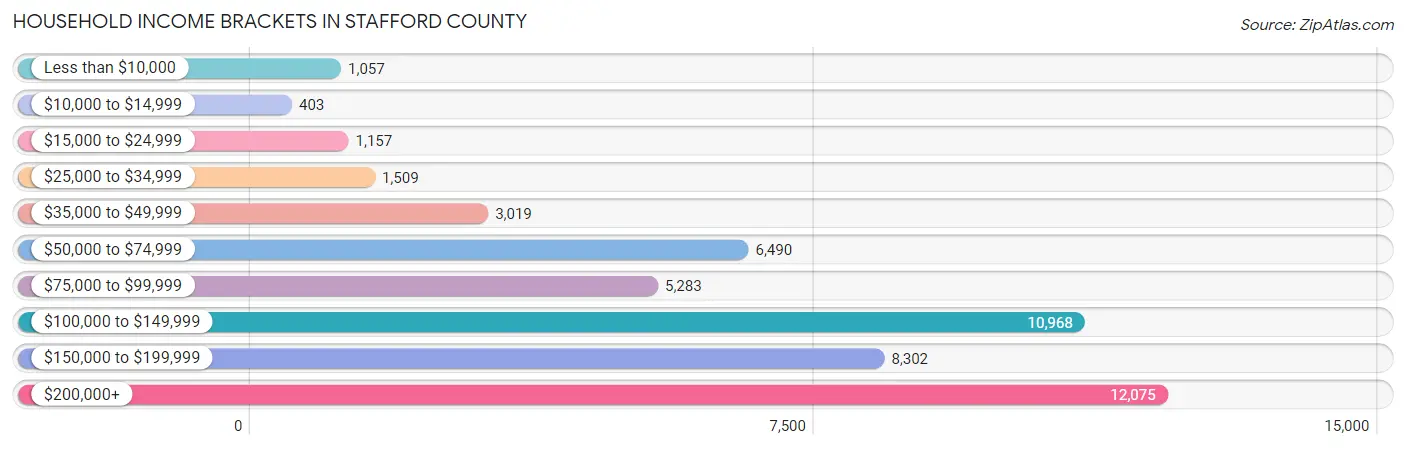
| Income Bracket | # Households | % Households |
| Less than $10,000 | 1,057 | 2.1% |
| $10,000 to $14,999 | 403 | 0.8% |
| $15,000 to $24,999 | 1,157 | 2.3% |
| $25,000 to $34,999 | 1,509 | 3.0% |
| $35,000 to $49,999 | 3,019 | 6.0% |
| $50,000 to $74,999 | 6,490 | 12.9% |
| $75,000 to $99,999 | 5,283 | 10.5% |
| $100,000 to $149,999 | 10,968 | 21.8% |
| $150,000 to $199,999 | 8,302 | 16.5% |
| $200,000+ | 12,075 | 24.0% |
Household Income by Householder Age in Stafford County
The median household income in Stafford County is $128,036, with the highest median household income of $164,735 found in the 45 to 64 years age bracket for the primary householder. A total of 21,870 households (43.5%) fall into this category. Meanwhile, the 15 to 24 years age bracket for the primary householder has the lowest median household income of $53,718, with 1,038 households (2.1%) in this group.
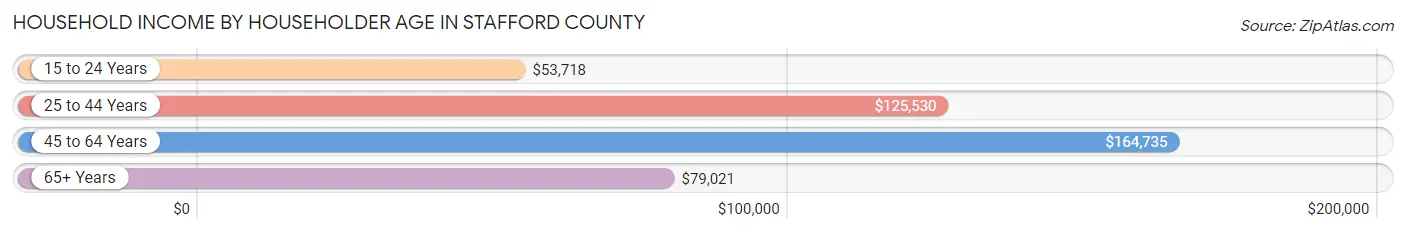
| Income Bracket | # Households | Median Income |
| 15 to 24 Years | 1,038 (2.1%) | $53,718 |
| 25 to 44 Years | 18,006 (35.8%) | $125,530 |
| 45 to 64 Years | 21,870 (43.5%) | $164,735 |
| 65+ Years | 9,399 (18.7%) | $79,021 |
| Total | 50,313 (100.0%) | $128,036 |
Poverty in Stafford County
Income Below Poverty by Sex and Age in Stafford County
With 4.4% poverty level for males and 6.3% for females among the residents of Stafford County, 15 year old males and 18 to 24 year old females are the most vulnerable to poverty, with 142 males (11.5%) and 767 females (11.5%) in their respective age groups living below the poverty level.
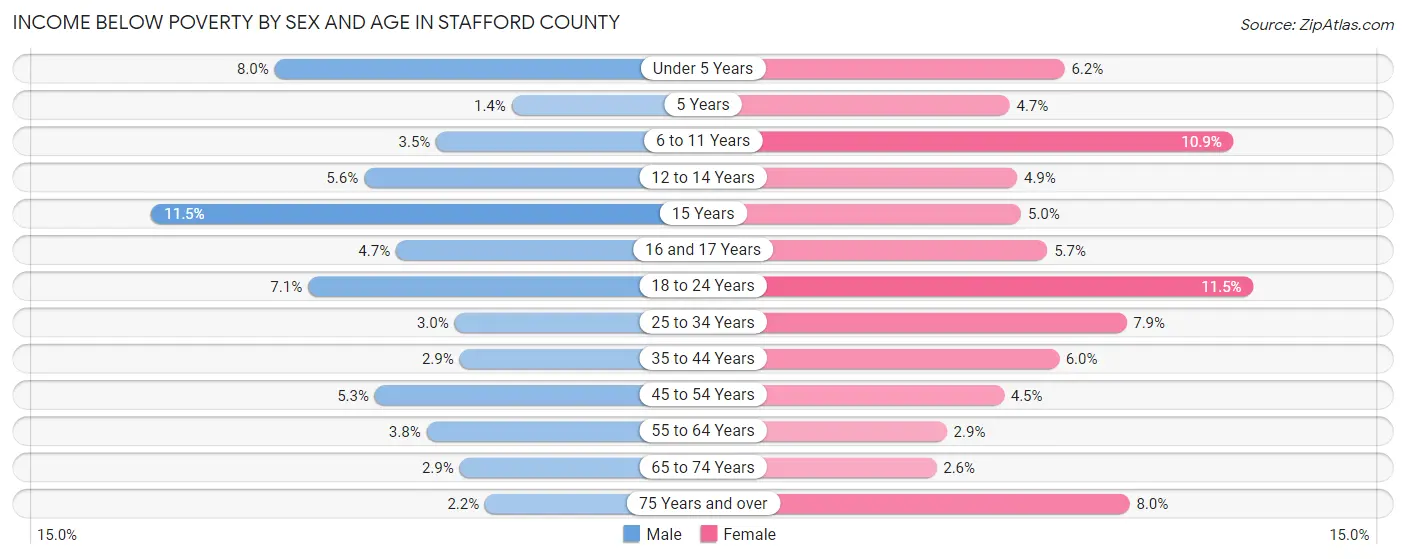
| Age Bracket | Male | Female |
| Under 5 Years | 399 (8.0%) | 291 (6.2%) |
| 5 Years | 11 (1.4%) | 43 (4.7%) |
| 6 to 11 Years | 262 (3.5%) | 750 (10.9%) |
| 12 to 14 Years | 214 (5.6%) | 174 (4.9%) |
| 15 Years | 142 (11.5%) | 84 (5.0%) |
| 16 and 17 Years | 124 (4.7%) | 119 (5.7%) |
| 18 to 24 Years | 488 (7.1%) | 767 (11.5%) |
| 25 to 34 Years | 286 (3.0%) | 751 (7.9%) |
| 35 to 44 Years | 326 (2.9%) | 680 (6.0%) |
| 45 to 54 Years | 584 (5.2%) | 494 (4.5%) |
| 55 to 64 Years | 363 (3.8%) | 276 (2.9%) |
| 65 to 74 Years | 149 (2.9%) | 151 (2.6%) |
| 75 Years and over | 57 (2.2%) | 283 (8.0%) |
| Total | 3,405 (4.4%) | 4,863 (6.3%) |
Income Above Poverty by Sex and Age in Stafford County
According to the poverty statistics in Stafford County, males aged 5 years and females aged 65 to 74 years are the age groups that are most secure financially, with 98.6% of males and 97.4% of females in these age groups living above the poverty line.
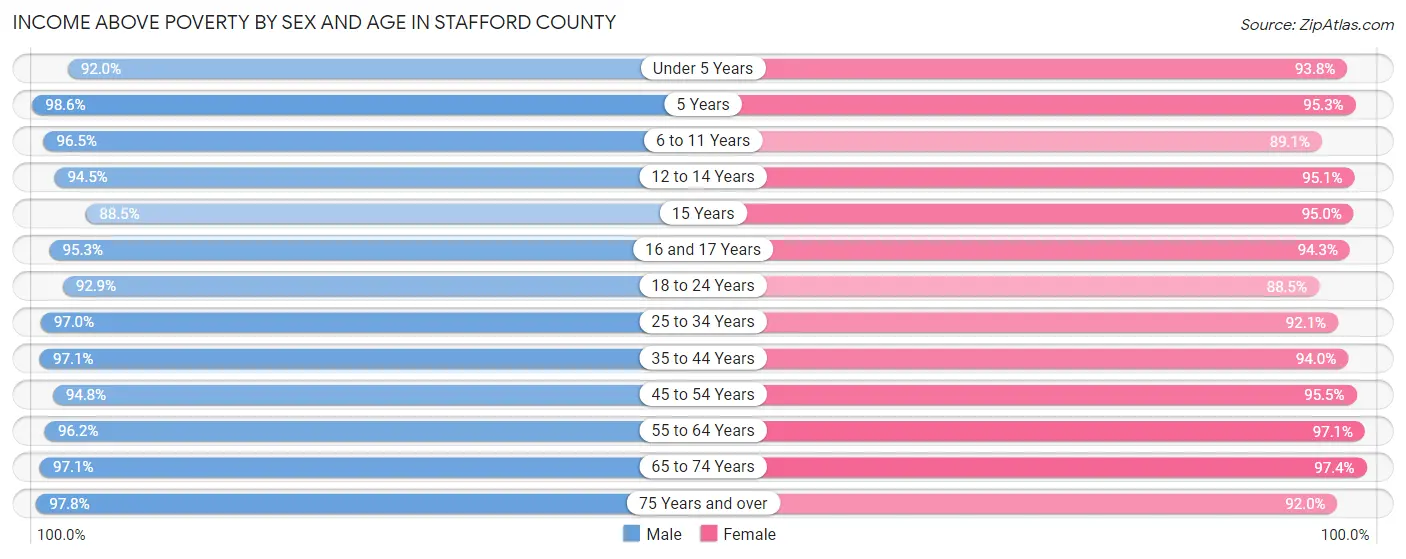
| Age Bracket | Male | Female |
| Under 5 Years | 4,565 (92.0%) | 4,405 (93.8%) |
| 5 Years | 753 (98.6%) | 877 (95.3%) |
| 6 to 11 Years | 7,147 (96.5%) | 6,123 (89.1%) |
| 12 to 14 Years | 3,639 (94.5%) | 3,393 (95.1%) |
| 15 Years | 1,096 (88.5%) | 1,600 (95.0%) |
| 16 and 17 Years | 2,538 (95.3%) | 1,960 (94.3%) |
| 18 to 24 Years | 6,374 (92.9%) | 5,927 (88.5%) |
| 25 to 34 Years | 9,165 (97.0%) | 8,729 (92.1%) |
| 35 to 44 Years | 10,945 (97.1%) | 10,575 (94.0%) |
| 45 to 54 Years | 10,540 (94.8%) | 10,461 (95.5%) |
| 55 to 64 Years | 9,156 (96.2%) | 9,163 (97.1%) |
| 65 to 74 Years | 5,007 (97.1%) | 5,584 (97.4%) |
| 75 Years and over | 2,560 (97.8%) | 3,249 (92.0%) |
| Total | 73,485 (95.6%) | 72,046 (93.7%) |
Income Below Poverty Among Married-Couple Families in Stafford County
The poverty statistics for married-couple families in Stafford County show that 2.2% or 715 of the total 32,086 families live below the poverty line. Families with 3 or 4 children have the highest poverty rate of 8.8%, comprising of 362 families. On the other hand, families with no children have the lowest poverty rate of 0.9%, which includes 140 families.
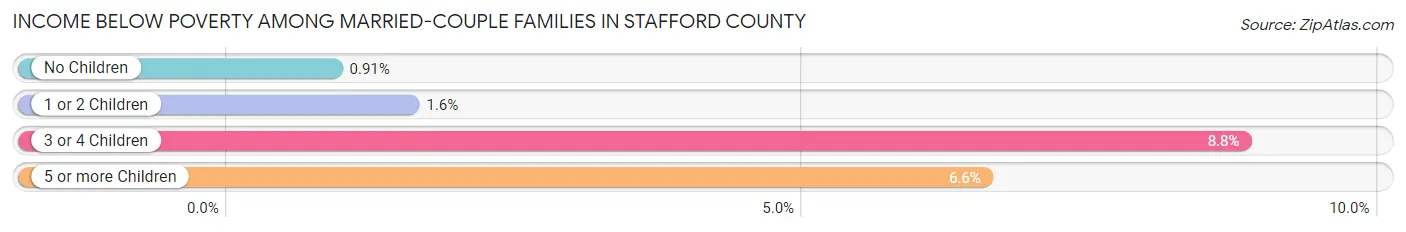
| Children | Above Poverty | Below Poverty |
| No Children | 15,231 (99.1%) | 140 (0.9%) |
| 1 or 2 Children | 12,140 (98.4%) | 195 (1.6%) |
| 3 or 4 Children | 3,744 (91.2%) | 362 (8.8%) |
| 5 or more Children | 256 (93.4%) | 18 (6.6%) |
| Total | 31,371 (97.8%) | 715 (2.2%) |
Income Below Poverty Among Single-Parent Households in Stafford County
According to the poverty data in Stafford County, 5.4% or 119 single-father households and 11.9% or 597 single-mother households are living below the poverty line. Among single-father households, those with 3 or 4 children have the highest poverty rate, with 52 households (20.6%) experiencing poverty. Likewise, among single-mother households, those with 5 or more children have the highest poverty rate, with 11 households (22.0%) falling below the poverty line.
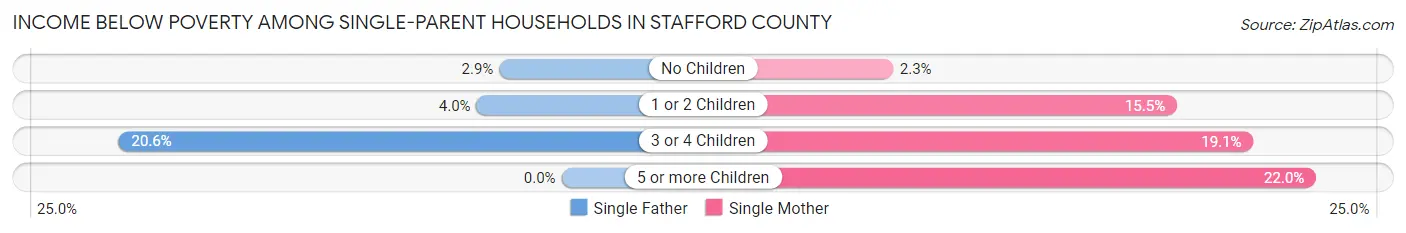
| Children | Single Father | Single Mother |
| No Children | 26 (2.9%) | 36 (2.3%) |
| 1 or 2 Children | 41 (4.0%) | 418 (15.5%) |
| 3 or 4 Children | 52 (20.6%) | 132 (19.1%) |
| 5 or more Children | 0 (0.0%) | 11 (22.0%) |
| Total | 119 (5.4%) | 597 (11.9%) |
Income Below Poverty Among Married-Couple vs Single-Parent Households in Stafford County
The poverty data for Stafford County shows that 715 of the married-couple family households (2.2%) and 716 of the single-parent households (9.9%) are living below the poverty level. Within the married-couple family households, those with 3 or 4 children have the highest poverty rate, with 362 households (8.8%) falling below the poverty line. Among the single-parent households, those with 3 or 4 children have the highest poverty rate, with 184 household (19.5%) living below poverty.
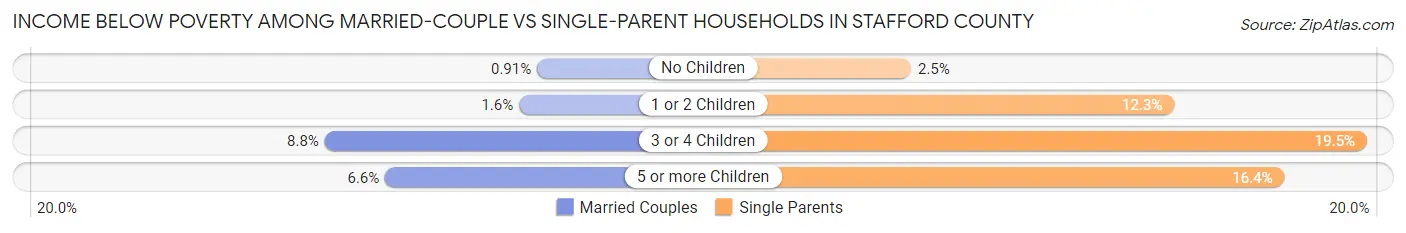
| Children | Married-Couple Families | Single-Parent Households |
| No Children | 140 (0.9%) | 62 (2.5%) |
| 1 or 2 Children | 195 (1.6%) | 459 (12.3%) |
| 3 or 4 Children | 362 (8.8%) | 184 (19.5%) |
| 5 or more Children | 18 (6.6%) | 11 (16.4%) |
| Total | 715 (2.2%) | 716 (9.9%) |
Race in Stafford County
The most populous races in Stafford County are White / Caucasian (94,088 | 59.7%), Black / African American (29,922 | 19.0%), and Hispanic or Latino (23,520 | 14.9%).
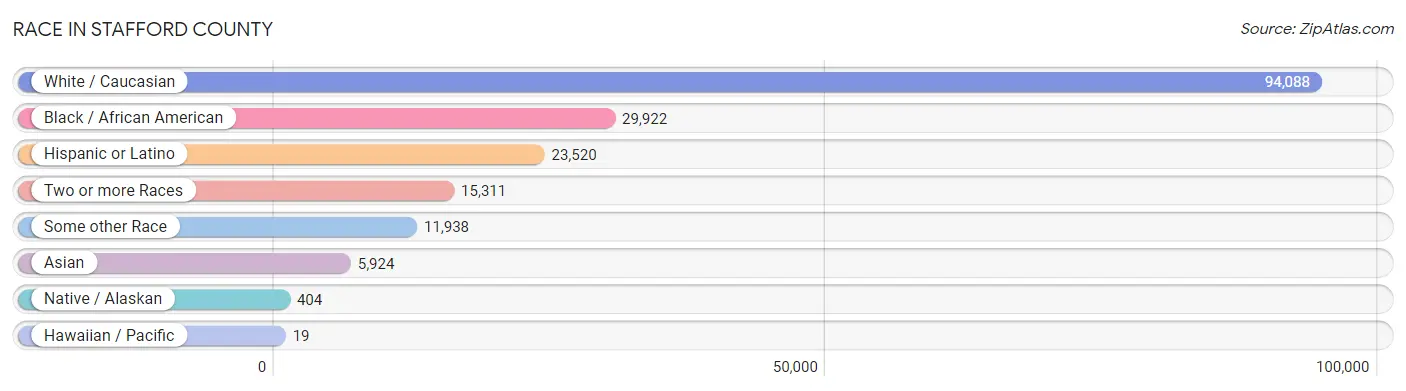
| Race | # Population | % Population |
| Asian | 5,924 | 3.8% |
| Black / African American | 29,922 | 19.0% |
| Hawaiian / Pacific | 19 | 0.0% |
| Hispanic or Latino | 23,520 | 14.9% |
| Native / Alaskan | 404 | 0.3% |
| White / Caucasian | 94,088 | 59.7% |
| Two or more Races | 15,311 | 9.7% |
| Some other Race | 11,938 | 7.6% |
| Total | 157,606 | 100.0% |
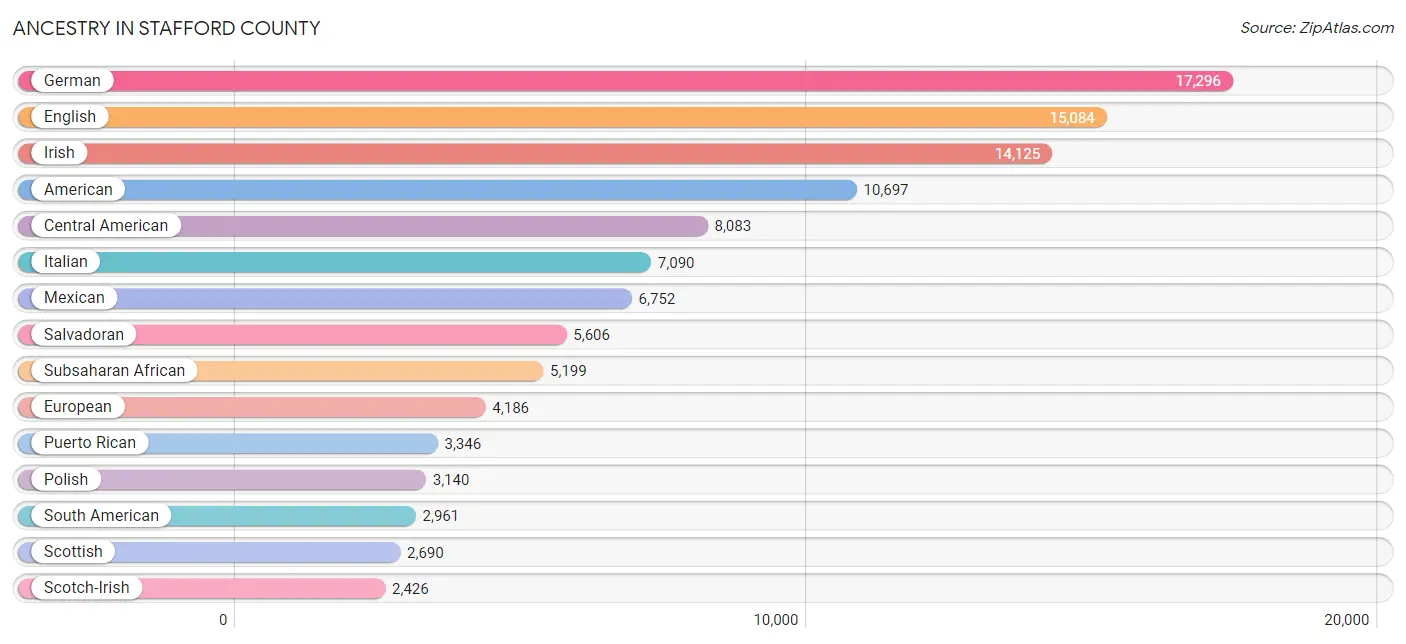
Ancestry in Stafford County
The most populous ancestries reported in Stafford County are German (17,296 | 11.0%), English (15,084 | 9.6%), Irish (14,125 | 9.0%), American (10,697 | 6.8%), and Central American (8,083 | 5.1%), together accounting for 41.4% of all Stafford County residents.
| Ancestry | # Population | % Population |
| Afghan | 589 | 0.4% |
| African | 1,701 | 1.1% |
| Alaskan Athabascan | 67 | 0.0% |
| Albanian | 82 | 0.1% |
| Alsatian | 10 | 0.0% |
| American | 10,697 | 6.8% |
| Apache | 19 | 0.0% |
| Arab | 1,037 | 0.7% |
| Argentinean | 81 | 0.1% |
| Armenian | 80 | 0.1% |
| Australian | 21 | 0.0% |
| Austrian | 281 | 0.2% |
| Bahamian | 9 | 0.0% |
| Bangladeshi | 39 | 0.0% |
| Barbadian | 147 | 0.1% |
| Belgian | 93 | 0.1% |
| Bhutanese | 811 | 0.5% |
| Blackfeet | 10 | 0.0% |
| Bolivian | 615 | 0.4% |
| Brazilian | 9 | 0.0% |
| British | 1,157 | 0.7% |
| British West Indian | 41 | 0.0% |
| Burmese | 1,655 | 1.1% |
| Cajun | 47 | 0.0% |
| Cambodian | 12 | 0.0% |
| Canadian | 360 | 0.2% |
| Central American | 8,083 | 5.1% |
| Central American Indian | 309 | 0.2% |
| Cherokee | 338 | 0.2% |
| Chickasaw | 1 | 0.0% |
| Chinese | 8 | 0.0% |
| Chippewa | 51 | 0.0% |
| Choctaw | 37 | 0.0% |
| Colombian | 606 | 0.4% |
| Comanche | 4 | 0.0% |
| Costa Rican | 51 | 0.0% |
| Cree | 3 | 0.0% |
| Creek | 42 | 0.0% |
| Croatian | 50 | 0.0% |
| Cuban | 501 | 0.3% |
| Czech | 530 | 0.3% |
| Czechoslovakian | 343 | 0.2% |
| Danish | 291 | 0.2% |
| Dominican | 580 | 0.4% |
| Dutch | 1,135 | 0.7% |
| Eastern European | 358 | 0.2% |
| Ecuadorian | 122 | 0.1% |
| Egyptian | 61 | 0.0% |
| English | 15,084 | 9.6% |
| Estonian | 17 | 0.0% |
| Ethiopian | 248 | 0.2% |
| European | 4,186 | 2.7% |
| Filipino | 10 | 0.0% |
| Finnish | 154 | 0.1% |
| French | 2,303 | 1.5% |
| French American Indian | 3 | 0.0% |
| French Canadian | 625 | 0.4% |
| German | 17,296 | 11.0% |
| German Russian | 53 | 0.0% |
| Ghanaian | 1,401 | 0.9% |
| Greek | 668 | 0.4% |
| Guamanian / Chamorro | 75 | 0.1% |
| Guatemalan | 745 | 0.5% |
| Guyanese | 94 | 0.1% |
| Haitian | 149 | 0.1% |
| Honduran | 781 | 0.5% |
| Hungarian | 466 | 0.3% |
| Indian (Asian) | 809 | 0.5% |
| Indonesian | 26 | 0.0% |
| Inupiat | 8 | 0.0% |
| Iranian | 168 | 0.1% |
| Irish | 14,125 | 9.0% |
| Iroquois | 127 | 0.1% |
| Italian | 7,090 | 4.5% |
| Jamaican | 673 | 0.4% |
| Japanese | 63 | 0.0% |
| Jordanian | 69 | 0.0% |
| Kenyan | 81 | 0.1% |
| Korean | 2,232 | 1.4% |
| Laotian | 10 | 0.0% |
| Latvian | 149 | 0.1% |
| Lebanese | 142 | 0.1% |
| Liberian | 15 | 0.0% |
| Lithuanian | 299 | 0.2% |
| Lumbee | 23 | 0.0% |
| Malaysian | 76 | 0.1% |
| Mexican | 6,752 | 4.3% |
| Mexican American Indian | 78 | 0.1% |
| Mongolian | 75 | 0.1% |
| Moroccan | 280 | 0.2% |
| Native Hawaiian | 122 | 0.1% |
| Navajo | 20 | 0.0% |
| Nicaraguan | 247 | 0.2% |
| Nigerian | 225 | 0.1% |
| Northern European | 234 | 0.2% |
| Norwegian | 998 | 0.6% |
| Okinawan | 31 | 0.0% |
| Pakistani | 340 | 0.2% |
| Palestinian | 98 | 0.1% |
| Panamanian | 535 | 0.3% |
| Paraguayan | 65 | 0.0% |
| Pennsylvania German | 9 | 0.0% |
| Peruvian | 1,123 | 0.7% |
| Pima | 18 | 0.0% |
| Polish | 3,140 | 2.0% |
| Portuguese | 566 | 0.4% |
| Pueblo | 41 | 0.0% |
| Puerto Rican | 3,346 | 2.1% |
| Romanian | 175 | 0.1% |
| Russian | 845 | 0.5% |
| Salvadoran | 5,606 | 3.6% |
| Samoan | 174 | 0.1% |
| Scandinavian | 743 | 0.5% |
| Scotch-Irish | 2,426 | 1.5% |
| Scottish | 2,690 | 1.7% |
| Serbian | 88 | 0.1% |
| Sierra Leonean | 405 | 0.3% |
| Sioux | 41 | 0.0% |
| Slavic | 165 | 0.1% |
| Slovak | 296 | 0.2% |
| Slovene | 73 | 0.1% |
| Somali | 7 | 0.0% |
| South African | 43 | 0.0% |
| South American | 2,961 | 1.9% |
| South American Indian | 34 | 0.0% |
| Soviet Union | 5 | 0.0% |
| Spaniard | 329 | 0.2% |
| Spanish | 154 | 0.1% |
| Sri Lankan | 348 | 0.2% |
| Subsaharan African | 5,199 | 3.3% |
| Sudanese | 174 | 0.1% |
| Swedish | 907 | 0.6% |
| Swiss | 167 | 0.1% |
| Syrian | 38 | 0.0% |
| Thai | 1,490 | 0.9% |
| Trinidadian and Tobagonian | 152 | 0.1% |
| Turkish | 52 | 0.0% |
| U.S. Virgin Islander | 40 | 0.0% |
| Ukrainian | 314 | 0.2% |
| Uruguayan | 31 | 0.0% |
| Venezuelan | 318 | 0.2% |
| Vietnamese | 101 | 0.1% |
| Welsh | 1,224 | 0.8% |
| West Indian | 124 | 0.1% |
| Yugoslavian | 204 | 0.1% |
| Yuman | 16 | 0.0% | View All 146 Rows |
Immigrants in Stafford County
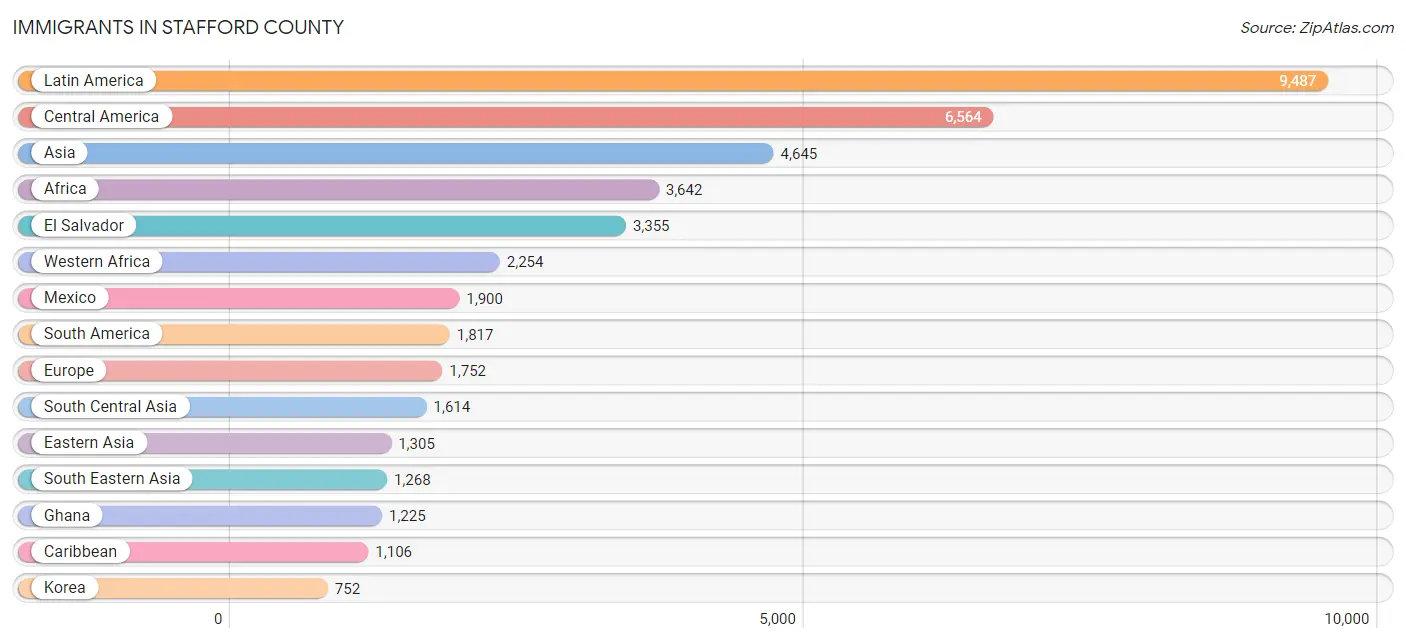
The most numerous immigrant groups reported in Stafford County came from Latin America (9,487 | 6.0%), Central America (6,564 | 4.2%), Asia (4,645 | 2.9%), Africa (3,642 | 2.3%), and El Salvador (3,355 | 2.1%), together accounting for 17.6% of all Stafford County residents.
| Immigration Origin | # Population | % Population |
| Afghanistan | 313 | 0.2% |
| Africa | 3,642 | 2.3% |
| Argentina | 68 | 0.0% |
| Asia | 4,645 | 2.9% |
| Australia | 15 | 0.0% |
| Austria | 61 | 0.0% |
| Bahamas | 9 | 0.0% |
| Bangladesh | 168 | 0.1% |
| Barbados | 114 | 0.1% |
| Belgium | 10 | 0.0% |
| Bolivia | 358 | 0.2% |
| Bosnia and Herzegovina | 37 | 0.0% |
| Brazil | 118 | 0.1% |
| Cambodia | 45 | 0.0% |
| Cameroon | 151 | 0.1% |
| Canada | 143 | 0.1% |
| Caribbean | 1,106 | 0.7% |
| Central America | 6,564 | 4.2% |
| China | 437 | 0.3% |
| Colombia | 308 | 0.2% |
| Costa Rica | 42 | 0.0% |
| Croatia | 2 | 0.0% |
| Cuba | 75 | 0.1% |
| Czechoslovakia | 45 | 0.0% |
| Dominican Republic | 67 | 0.0% |
| Eastern Africa | 387 | 0.3% |
| Eastern Asia | 1,305 | 0.8% |
| Eastern Europe | 666 | 0.4% |
| Ecuador | 35 | 0.0% |
| Egypt | 100 | 0.1% |
| El Salvador | 3,355 | 2.1% |
| England | 80 | 0.1% |
| Ethiopia | 183 | 0.1% |
| Europe | 1,752 | 1.1% |
| France | 61 | 0.0% |
| Germany | 513 | 0.3% |
| Ghana | 1,225 | 0.8% |
| Greece | 128 | 0.1% |
| Grenada | 100 | 0.1% |
| Guatemala | 422 | 0.3% |
| Guyana | 84 | 0.1% |
| Haiti | 102 | 0.1% |
| Honduras | 399 | 0.3% |
| India | 580 | 0.4% |
| Iran | 26 | 0.0% |
| Ireland | 11 | 0.0% |
| Israel | 19 | 0.0% |
| Italy | 71 | 0.1% |
| Jamaica | 422 | 0.3% |
| Japan | 104 | 0.1% |
| Jordan | 104 | 0.1% |
| Kazakhstan | 40 | 0.0% |
| Kenya | 79 | 0.1% |
| Korea | 752 | 0.5% |
| Laos | 65 | 0.0% |
| Latin America | 9,487 | 6.0% |
| Latvia | 43 | 0.0% |
| Lebanon | 44 | 0.0% |
| Liberia | 39 | 0.0% |
| Lithuania | 8 | 0.0% |
| Malaysia | 93 | 0.1% |
| Mexico | 1,900 | 1.2% |
| Middle Africa | 151 | 0.1% |
| Moldova | 31 | 0.0% |
| Morocco | 192 | 0.1% |
| Nicaragua | 146 | 0.1% |
| Nigeria | 105 | 0.1% |
| North Macedonia | 14 | 0.0% |
| Northern Africa | 546 | 0.4% |
| Northern Europe | 181 | 0.1% |
| Norway | 8 | 0.0% |
| Oceania | 25 | 0.0% |
| Pakistan | 460 | 0.3% |
| Panama | 300 | 0.2% |
| Peru | 662 | 0.4% |
| Philippines | 680 | 0.4% |
| Poland | 12 | 0.0% |
| Portugal | 28 | 0.0% |
| Romania | 78 | 0.1% |
| Russia | 152 | 0.1% |
| Saudi Arabia | 75 | 0.1% |
| Scotland | 12 | 0.0% |
| Serbia | 59 | 0.0% |
| Sierra Leone | 537 | 0.3% |
| Singapore | 31 | 0.0% |
| Somalia | 7 | 0.0% |
| South Africa | 61 | 0.0% |
| South America | 1,817 | 1.1% |
| South Central Asia | 1,614 | 1.0% |
| South Eastern Asia | 1,268 | 0.8% |
| Southern Europe | 260 | 0.2% |
| Spain | 33 | 0.0% |
| Sudan | 244 | 0.2% |
| Sweden | 48 | 0.0% |
| Syria | 7 | 0.0% |
| Taiwan | 90 | 0.1% |
| Thailand | 150 | 0.1% |
| Trinidad and Tobago | 184 | 0.1% |
| Turkey | 42 | 0.0% |
| Uganda | 16 | 0.0% |
| Ukraine | 29 | 0.0% |
| Venezuela | 147 | 0.1% |
| Vietnam | 204 | 0.1% |
| Western Africa | 2,254 | 1.4% |
| Western Asia | 441 | 0.3% |
| Western Europe | 645 | 0.4% | View All 106 Rows |
Sex and Age in Stafford County
Sex and Age in Stafford County
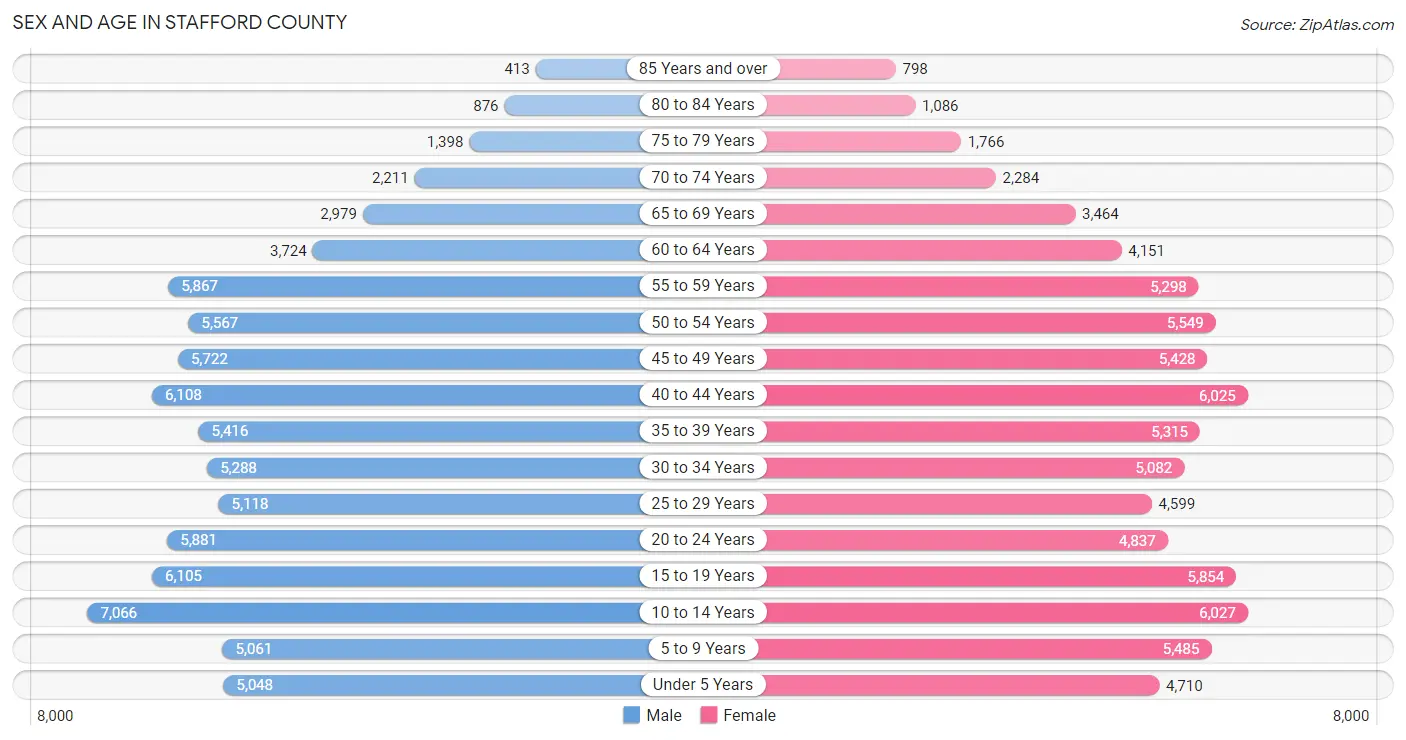
The most populous age groups in Stafford County are 10 to 14 Years (7,066 | 8.8%) for men and 10 to 14 Years (6,027 | 7.7%) for women.
| Age Bracket | Male | Female |
| Under 5 Years | 5,048 (6.3%) | 4,710 (6.1%) |
| 5 to 9 Years | 5,061 (6.3%) | 5,485 (7.0%) |
| 10 to 14 Years | 7,066 (8.8%) | 6,027 (7.7%) |
| 15 to 19 Years | 6,105 (7.6%) | 5,854 (7.5%) |
| 20 to 24 Years | 5,881 (7.4%) | 4,837 (6.2%) |
| 25 to 29 Years | 5,118 (6.4%) | 4,599 (5.9%) |
| 30 to 34 Years | 5,288 (6.6%) | 5,082 (6.5%) |
| 35 to 39 Years | 5,416 (6.8%) | 5,315 (6.8%) |
| 40 to 44 Years | 6,108 (7.6%) | 6,025 (7.7%) |
| 45 to 49 Years | 5,722 (7.2%) | 5,428 (7.0%) |
| 50 to 54 Years | 5,567 (7.0%) | 5,549 (7.1%) |
| 55 to 59 Years | 5,867 (7.3%) | 5,298 (6.8%) |
| 60 to 64 Years | 3,724 (4.7%) | 4,151 (5.3%) |
| 65 to 69 Years | 2,979 (3.7%) | 3,464 (4.4%) |
| 70 to 74 Years | 2,211 (2.8%) | 2,284 (2.9%) |
| 75 to 79 Years | 1,398 (1.8%) | 1,766 (2.3%) |
| 80 to 84 Years | 876 (1.1%) | 1,086 (1.4%) |
| 85 Years and over | 413 (0.5%) | 798 (1.0%) |
| Total | 79,848 (100.0%) | 77,758 (100.0%) |
Families and Households in Stafford County
Median Family Size in Stafford County
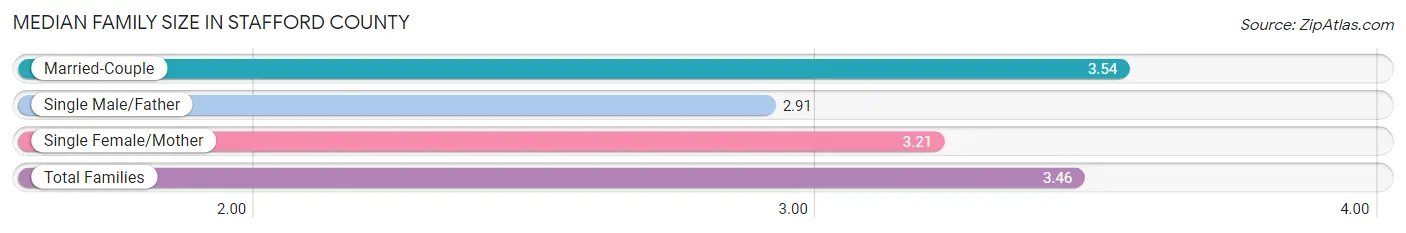
The median family size in Stafford County is 3.46 persons per family, with married-couple families (32,086 | 81.7%) accounting for the largest median family size of 3.54 persons per family. On the other hand, single male/father families (2,201 | 5.6%) represent the smallest median family size with 2.91 persons per family.
| Family Type | # Families | Family Size |
| Married-Couple | 32,086 (81.7%) | 3.54 |
| Single Male/Father | 2,201 (5.6%) | 2.91 |
| Single Female/Mother | 5,008 (12.7%) | 3.21 |
| Total Families | 39,295 (100.0%) | 3.46 |
Median Household Size in Stafford County
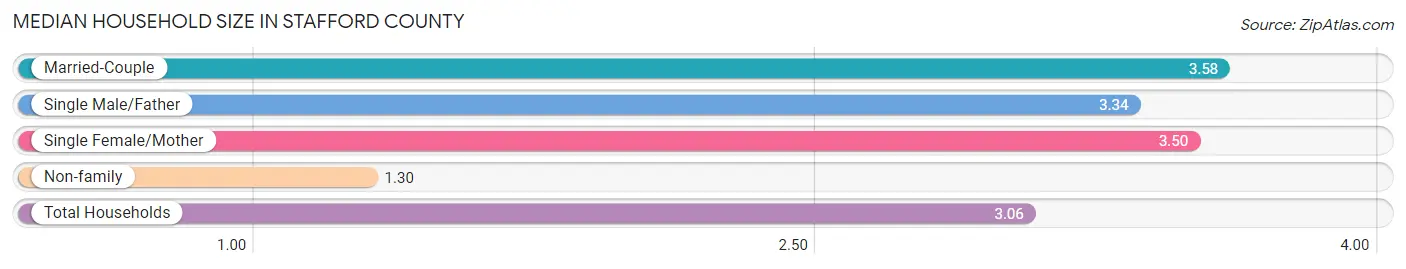
The median household size in Stafford County is 3.06 persons per household, with married-couple households (32,086 | 63.8%) accounting for the largest median household size of 3.58 persons per household. non-family households (11,018 | 21.9%) represent the smallest median household size with 1.30 persons per household.
| Household Type | # Households | Household Size |
| Married-Couple | 32,086 (63.8%) | 3.58 |
| Single Male/Father | 2,201 (4.4%) | 3.34 |
| Single Female/Mother | 5,008 (10.0%) | 3.50 |
| Non-family | 11,018 (21.9%) | 1.30 |
| Total Households | 50,313 (100.0%) | 3.06 |
Household Size by Marriage Status in Stafford County
Out of a total of 50,313 households in Stafford County, 39,295 (78.1%) are family households, while 11,018 (21.9%) are nonfamily households. The most numerous type of family households are 2-person households, comprising 13,061, and the most common type of nonfamily households are 1-person households, comprising 8,743.
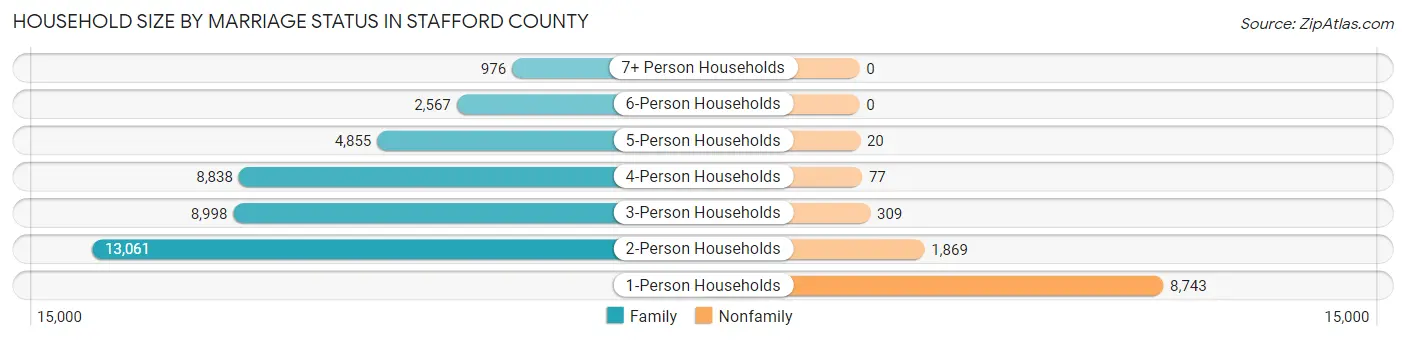
| Household Size | Family Households | Nonfamily Households |
| 1-Person Households | - | 8,743 (17.4%) |
| 2-Person Households | 13,061 (26.0%) | 1,869 (3.7%) |
| 3-Person Households | 8,998 (17.9%) | 309 (0.6%) |
| 4-Person Households | 8,838 (17.6%) | 77 (0.2%) |
| 5-Person Households | 4,855 (9.7%) | 20 (0.0%) |
| 6-Person Households | 2,567 (5.1%) | 0 (0.0%) |
| 7+ Person Households | 976 (1.9%) | 0 (0.0%) |
| Total | 39,295 (78.1%) | 11,018 (21.9%) |
Female Fertility in Stafford County
Fertility by Age in Stafford County
Average fertility rate in Stafford County is 62.0 births per 1,000 women. Women in the age bracket of 20 to 34 years have the highest fertility rate with 92.0 births per 1,000 women. Women in the age bracket of 20 to 34 years acount for 56.5% of all women with births.
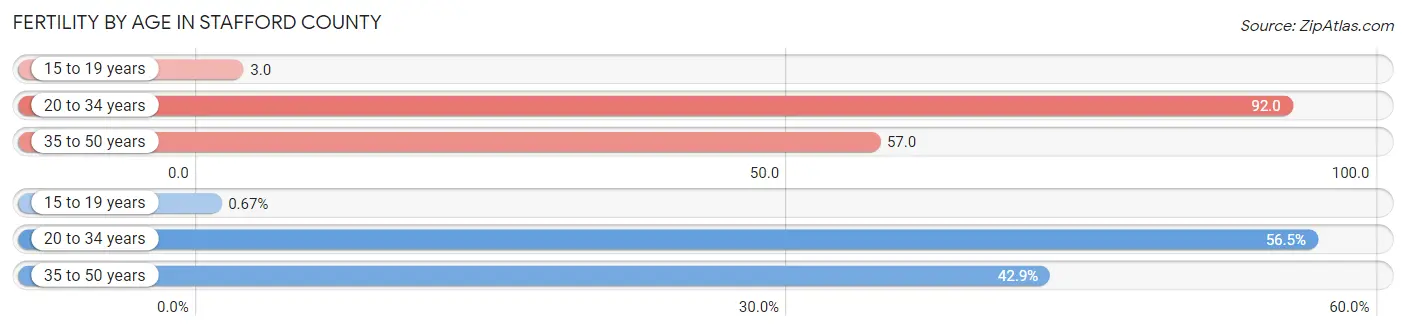
| Age Bracket | Women with Births | Births / 1,000 Women |
| 15 to 19 years | 16 (0.7%) | 3.0 |
| 20 to 34 years | 1,342 (56.5%) | 92.0 |
| 35 to 50 years | 1,018 (42.8%) | 57.0 |
| Total | 2,376 (100.0%) | 62.0 |
Fertility by Age by Marriage Status in Stafford County
84.4% of women with births (2,376) in Stafford County are married. The highest percentage of unmarried women with births falls into 15 to 19 years age bracket with 100.0% of them unmarried at the time of birth, while the lowest percentage of unmarried women with births belong to 35 to 50 years age bracket with 6.5% of them unmarried.
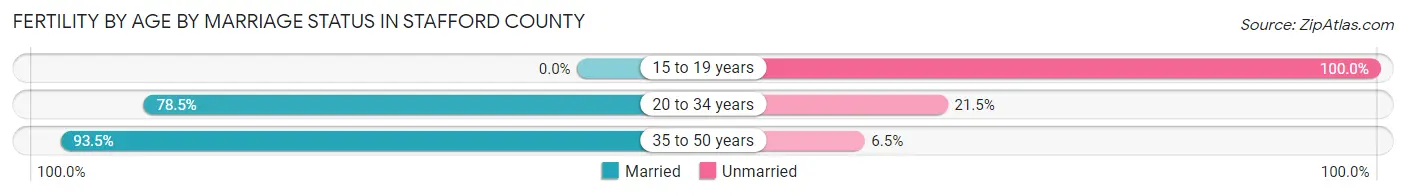
| Age Bracket | Married | Unmarried |
| 15 to 19 years | 0 (0.0%) | 16 (100.0%) |
| 20 to 34 years | 1,053 (78.5%) | 289 (21.5%) |
| 35 to 50 years | 952 (93.5%) | 66 (6.5%) |
| Total | 2,005 (84.4%) | 371 (15.6%) |
Fertility by Education in Stafford County
Average fertility rate in Stafford County is 62.0 births per 1,000 women. Women with the education attainment of graduate degree have the highest fertility rate of 88.0 births per 1,000 women, while women with the education attainment of college or associate's degree have the lowest fertility at 52.0 births per 1,000 women. Women with the education attainment of bachelor's degree represent 25.9% of all women with births.
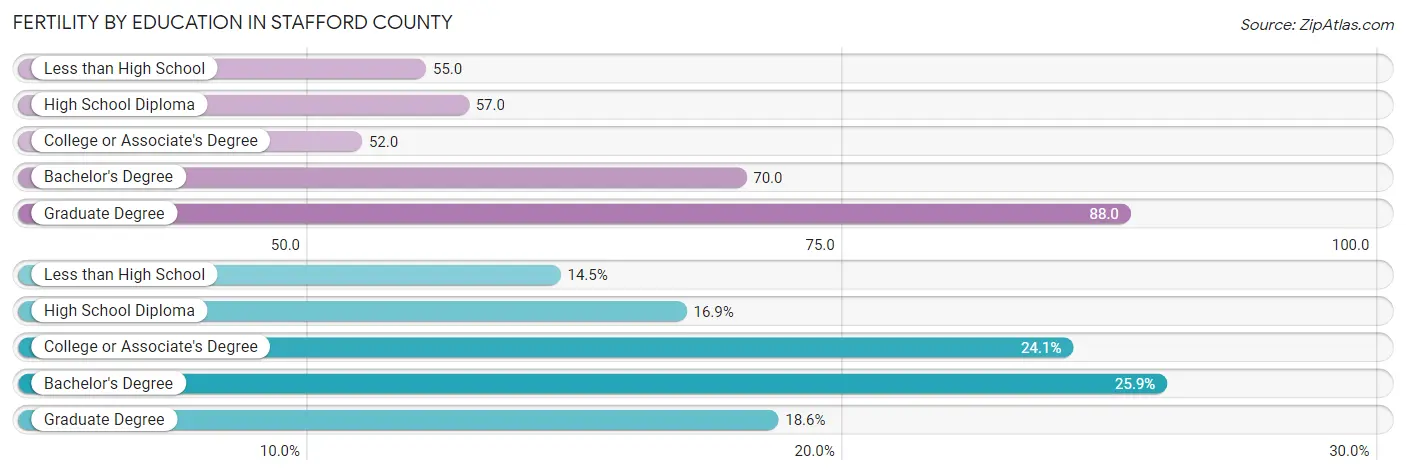
| Educational Attainment | Women with Births | Births / 1,000 Women |
| Less than High School | 345 (14.5%) | 55.0 |
| High School Diploma | 401 (16.9%) | 57.0 |
| College or Associate's Degree | 573 (24.1%) | 52.0 |
| Bachelor's Degree | 615 (25.9%) | 70.0 |
| Graduate Degree | 442 (18.6%) | 88.0 |
| Total | 2,376 (100.0%) | 62.0 |
Fertility by Education by Marriage Status in Stafford County
15.6% of women with births in Stafford County are unmarried. Women with the educational attainment of graduate degree are most likely to be married with 100.0% of them married at childbirth, while women with the educational attainment of high school diploma are least likely to be married with 31.9% of them unmarried at childbirth.
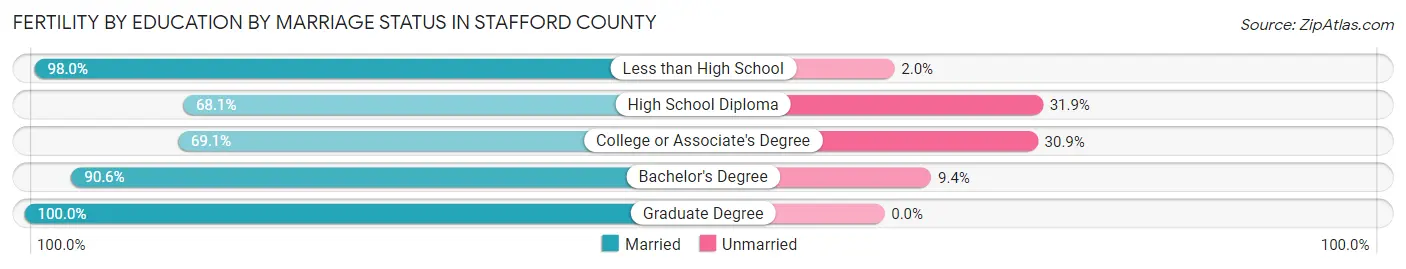
| Educational Attainment | Married | Unmarried |
| Less than High School | 338 (98.0%) | 7 (2.0%) |
| High School Diploma | 273 (68.1%) | 128 (31.9%) |
| College or Associate's Degree | 396 (69.1%) | 177 (30.9%) |
| Bachelor's Degree | 557 (90.6%) | 58 (9.4%) |
| Graduate Degree | 442 (100.0%) | 0 (0.0%) |
| Total | 2,005 (84.4%) | 371 (15.6%) |
Employment Characteristics in Stafford County
Employment by Class of Employer in Stafford County
Among the 78,696 employed individuals in Stafford County, private company employees (41,446 | 52.7%), federal government employees (19,363 | 24.6%), and local government employees (6,353 | 8.1%) make up the most common classes of employment.
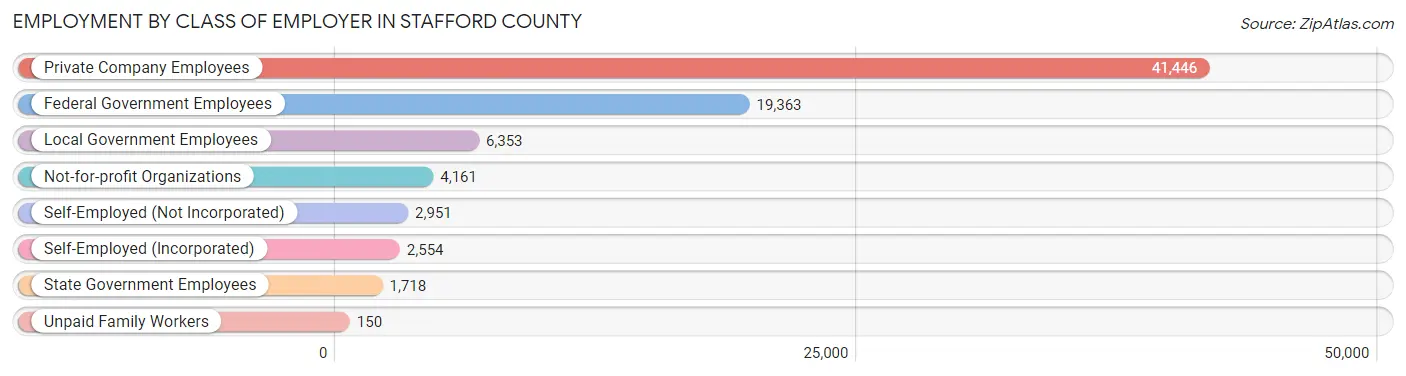
| Employer Class | # Employees | % Employees |
| Private Company Employees | 41,446 | 52.7% |
| Self-Employed (Incorporated) | 2,554 | 3.3% |
| Self-Employed (Not Incorporated) | 2,951 | 3.7% |
| Not-for-profit Organizations | 4,161 | 5.3% |
| Local Government Employees | 6,353 | 8.1% |
| State Government Employees | 1,718 | 2.2% |
| Federal Government Employees | 19,363 | 24.6% |
| Unpaid Family Workers | 150 | 0.2% |
| Total | 78,696 | 100.0% |
Employment Status by Age in Stafford County
According to the labor force statistics for Stafford County, out of the total population over 16 years of age (121,287), 69.0% or 83,688 individuals are in the labor force, with 3.9% or 3,264 of them unemployed. The age group with the highest labor force participation rate is 35 to 44 years, with 85.4% or 19,526 individuals in the labor force. Within the labor force, the 16 to 19 years age range has the highest percentage of unemployed individuals, with 14.2% or 535 of them being unemployed.
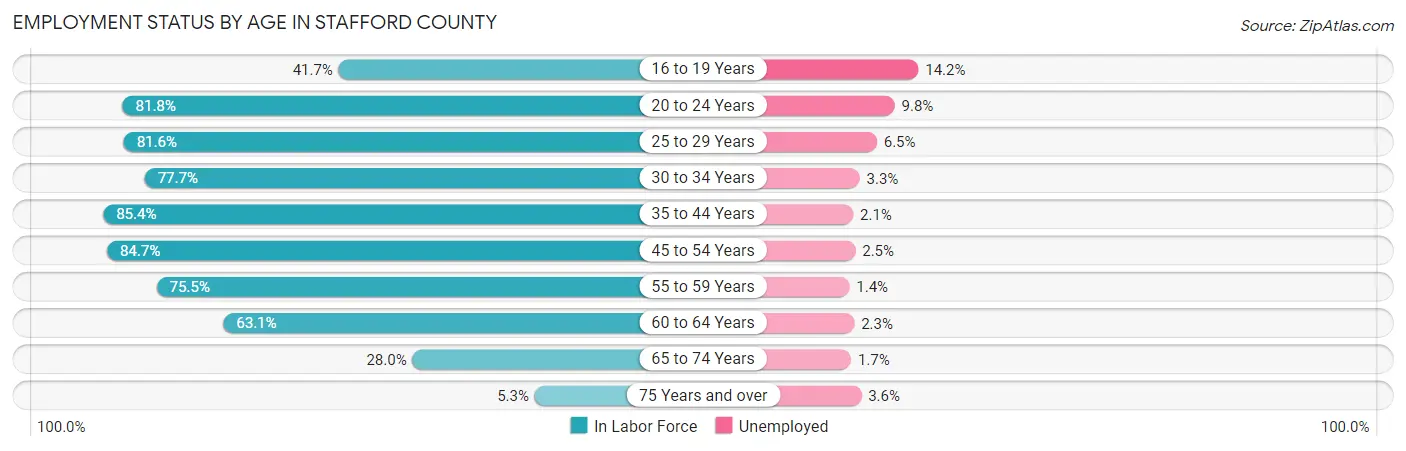
| Age Bracket | In Labor Force | Unemployed |
| 16 to 19 Years | 3,768 (41.7%) | 535 (14.2%) |
| 20 to 24 Years | 8,767 (81.8%) | 859 (9.8%) |
| 25 to 29 Years | 7,929 (81.6%) | 515 (6.5%) |
| 30 to 34 Years | 8,057 (77.7%) | 266 (3.3%) |
| 35 to 44 Years | 19,526 (85.4%) | 410 (2.1%) |
| 45 to 54 Years | 18,859 (84.7%) | 471 (2.5%) |
| 55 to 59 Years | 8,430 (75.5%) | 118 (1.4%) |
| 60 to 64 Years | 4,969 (63.1%) | 114 (2.3%) |
| 65 to 74 Years | 3,063 (28.0%) | 52 (1.7%) |
| 75 Years and over | 336 (5.3%) | 12 (3.6%) |
| Total | 83,688 (69.0%) | 3,264 (3.9%) |
Employment Status by Educational Attainment in Stafford County
According to labor force statistics for Stafford County, 80.4% of individuals (67,743) out of the total population between 25 and 64 years of age (84,257) are in the labor force, with 2.8% or 1,897 of them being unemployed. The group with the highest labor force participation rate are those with the educational attainment of bachelor's degree or higher, with 87.5% or 33,353 individuals in the labor force. Within the labor force, individuals with college / associate degree education have the highest percentage of unemployment, with 4.4% or 802 of them being unemployed.
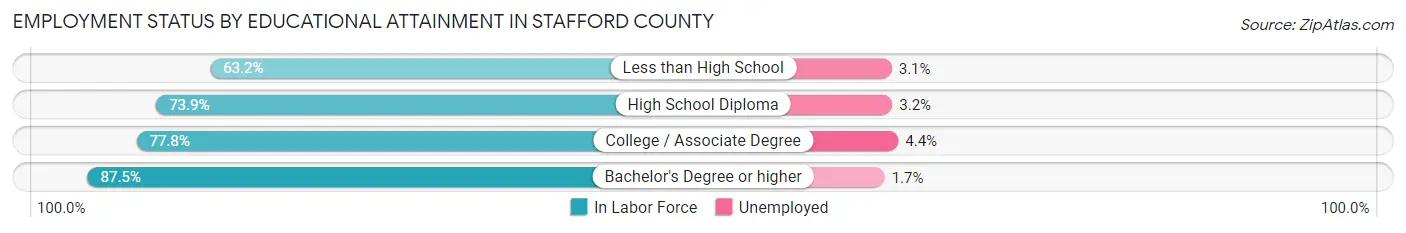
| Educational Attainment | In Labor Force | Unemployed |
| Less than High School | 3,464 (63.2%) | 170 (3.1%) |
| High School Diploma | 12,738 (73.9%) | 552 (3.2%) |
| College / Associate Degree | 18,222 (77.8%) | 1,031 (4.4%) |
| Bachelor's Degree or higher | 33,353 (87.5%) | 648 (1.7%) |
| Total | 67,743 (80.4%) | 2,359 (2.8%) |
Employment Occupations by Sex in Stafford County
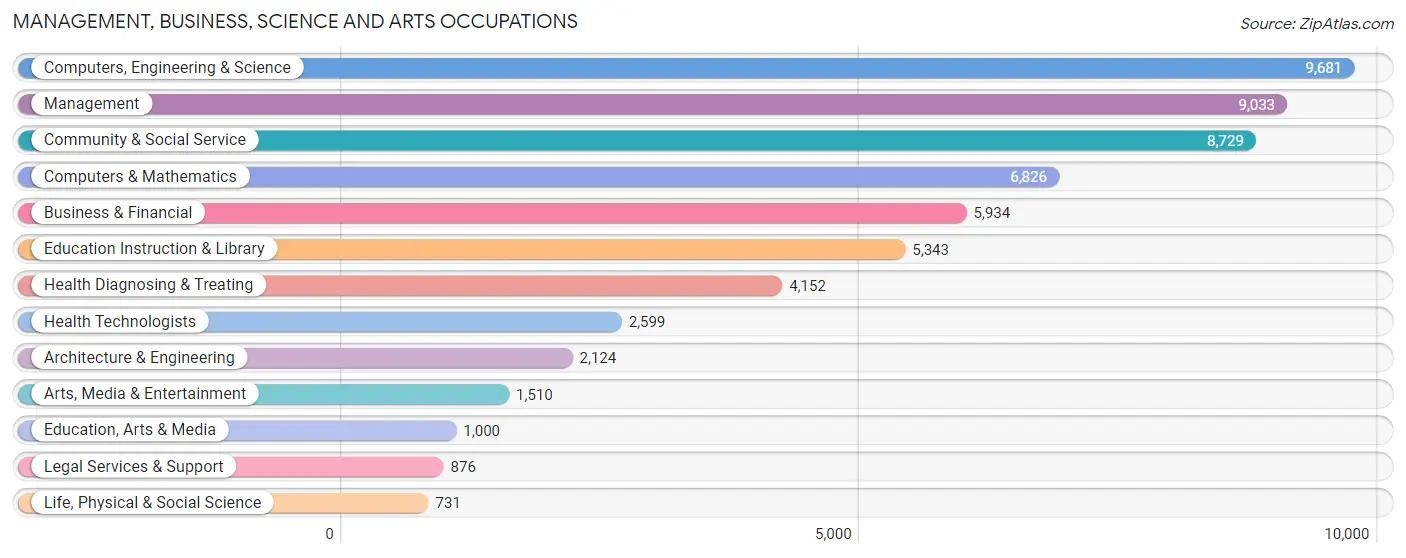
Management, Business, Science and Arts Occupations
The most common Management, Business, Science and Arts occupations in Stafford County are Computers, Engineering & Science (9,681 | 12.7%), Management (9,033 | 11.8%), Community & Social Service (8,729 | 11.4%), Computers & Mathematics (6,826 | 8.9%), and Business & Financial (5,934 | 7.7%).
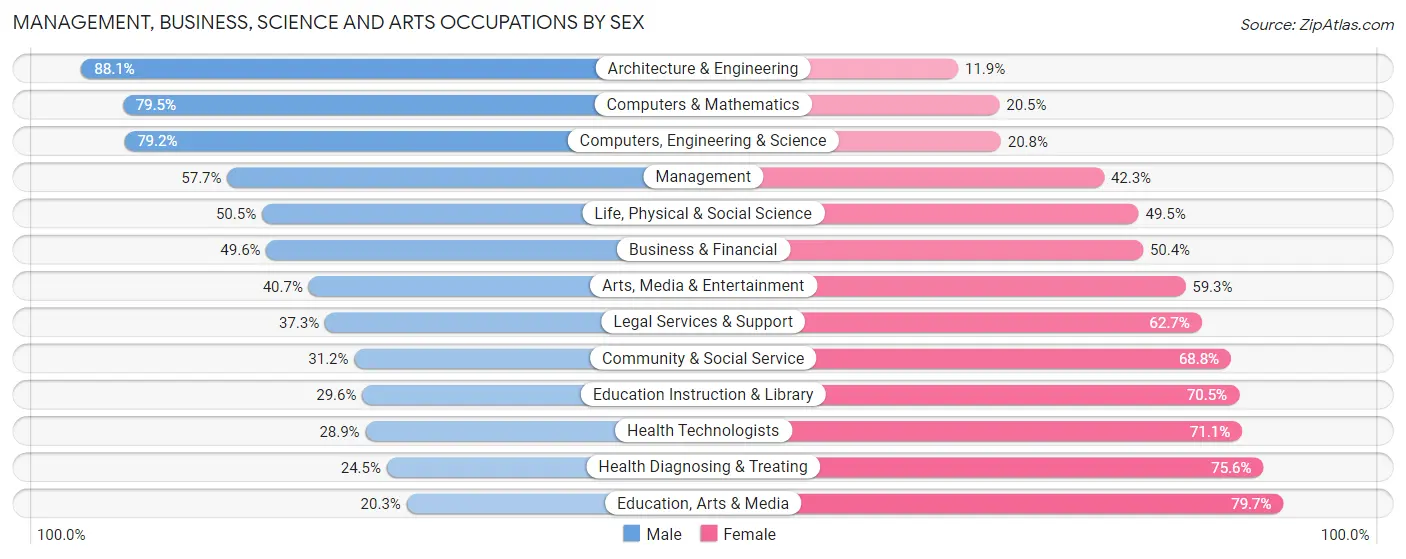
Management, Business, Science and Arts Occupations by Sex
Within the Management, Business, Science and Arts occupations in Stafford County, the most male-oriented occupations are Architecture & Engineering (88.1%), Computers & Mathematics (79.5%), and Computers, Engineering & Science (79.2%), while the most female-oriented occupations are Education, Arts & Media (79.7%), Health Diagnosing & Treating (75.5%), and Health Technologists (71.1%).
| Occupation | Male | Female |
| Management | 5,212 (57.7%) | 3,821 (42.3%) |
| Business & Financial | 2,941 (49.6%) | 2,993 (50.4%) |
| Computers, Engineering & Science | 7,669 (79.2%) | 2,012 (20.8%) |
| Computers & Mathematics | 5,428 (79.5%) | 1,398 (20.5%) |
| Architecture & Engineering | 1,872 (88.1%) | 252 (11.9%) |
| Life, Physical & Social Science | 369 (50.5%) | 362 (49.5%) |
| Community & Social Service | 2,724 (31.2%) | 6,005 (68.8%) |
| Education, Arts & Media | 203 (20.3%) | 797 (79.7%) |
| Legal Services & Support | 327 (37.3%) | 549 (62.7%) |
| Education Instruction & Library | 1,579 (29.5%) | 3,764 (70.5%) |
| Arts, Media & Entertainment | 615 (40.7%) | 895 (59.3%) |
| Health Diagnosing & Treating | 1,015 (24.4%) | 3,137 (75.5%) |
| Health Technologists | 751 (28.9%) | 1,848 (71.1%) |
| Total (Category) | 19,561 (52.1%) | 17,968 (47.9%) |
| Total (Overall) | 41,225 (53.8%) | 35,329 (46.2%) |
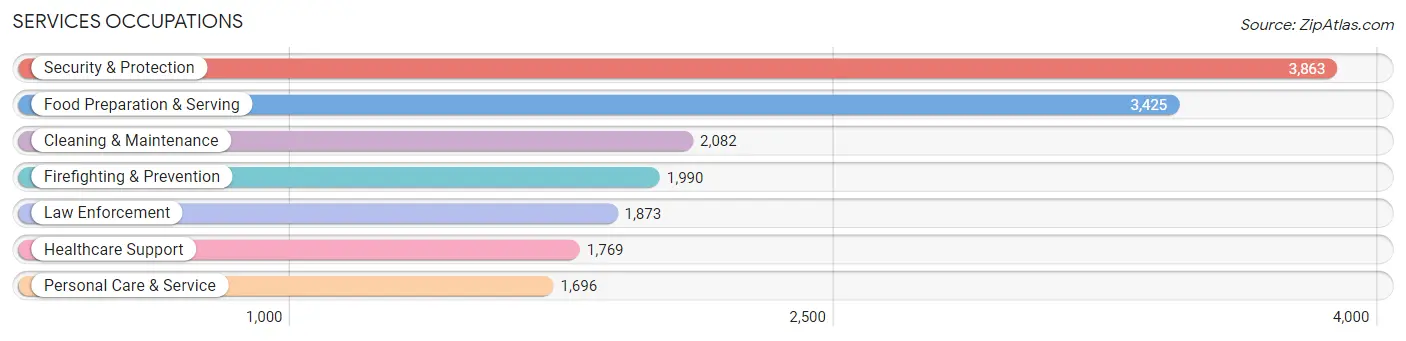
Services Occupations
The most common Services occupations in Stafford County are Security & Protection (3,863 | 5.1%), Food Preparation & Serving (3,425 | 4.5%), Cleaning & Maintenance (2,082 | 2.7%), Firefighting & Prevention (1,990 | 2.6%), and Law Enforcement (1,873 | 2.5%).
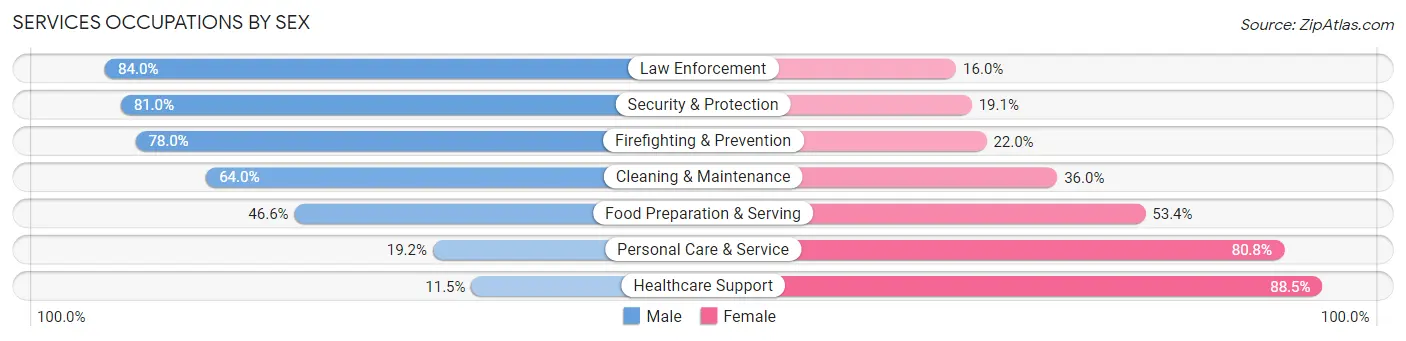
Services Occupations by Sex
Within the Services occupations in Stafford County, the most male-oriented occupations are Law Enforcement (84.0%), Security & Protection (80.9%), and Firefighting & Prevention (78.0%), while the most female-oriented occupations are Healthcare Support (88.5%), Personal Care & Service (80.8%), and Food Preparation & Serving (53.4%).
| Occupation | Male | Female |
| Healthcare Support | 204 (11.5%) | 1,565 (88.5%) |
| Security & Protection | 3,127 (80.9%) | 736 (19.1%) |
| Firefighting & Prevention | 1,553 (78.0%) | 437 (22.0%) |
| Law Enforcement | 1,574 (84.0%) | 299 (16.0%) |
| Food Preparation & Serving | 1,595 (46.6%) | 1,830 (53.4%) |
| Cleaning & Maintenance | 1,333 (64.0%) | 749 (36.0%) |
| Personal Care & Service | 325 (19.2%) | 1,371 (80.8%) |
| Total (Category) | 6,584 (51.3%) | 6,251 (48.7%) |
| Total (Overall) | 41,225 (53.8%) | 35,329 (46.2%) |
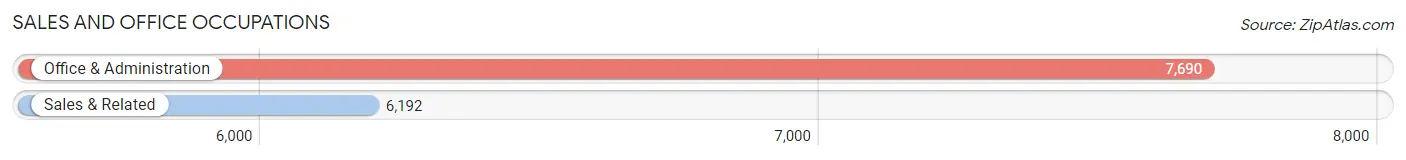
Sales and Office Occupations
The most common Sales and Office occupations in Stafford County are Office & Administration (7,690 | 10.1%), and Sales & Related (6,192 | 8.1%).
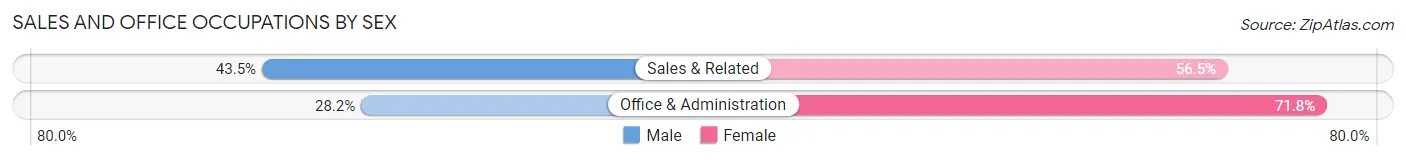
Sales and Office Occupations by Sex
| Occupation | Male | Female |
| Sales & Related | 2,693 (43.5%) | 3,499 (56.5%) |
| Office & Administration | 2,172 (28.2%) | 5,518 (71.8%) |
| Total (Category) | 4,865 (35.0%) | 9,017 (64.9%) |
| Total (Overall) | 41,225 (53.8%) | 35,329 (46.2%) |
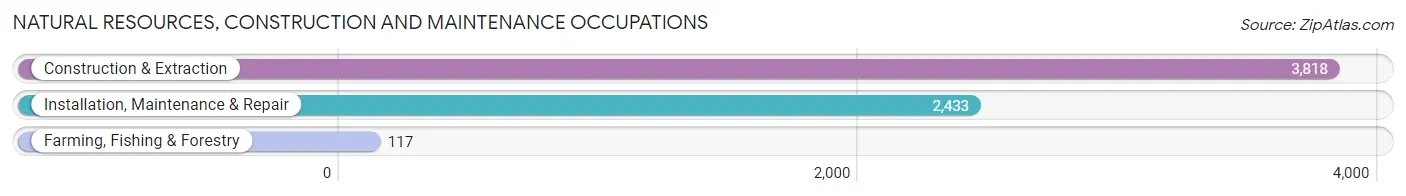
Natural Resources, Construction and Maintenance Occupations
The most common Natural Resources, Construction and Maintenance occupations in Stafford County are Construction & Extraction (3,818 | 5.0%), Installation, Maintenance & Repair (2,433 | 3.2%), and Farming, Fishing & Forestry (117 | 0.2%).
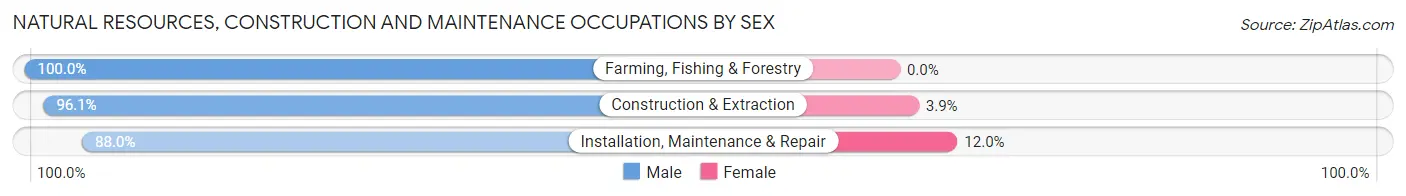
Natural Resources, Construction and Maintenance Occupations by Sex
| Occupation | Male | Female |
| Farming, Fishing & Forestry | 117 (100.0%) | 0 (0.0%) |
| Construction & Extraction | 3,668 (96.1%) | 150 (3.9%) |
| Installation, Maintenance & Repair | 2,142 (88.0%) | 291 (12.0%) |
| Total (Category) | 5,927 (93.1%) | 441 (6.9%) |
| Total (Overall) | 41,225 (53.8%) | 35,329 (46.2%) |
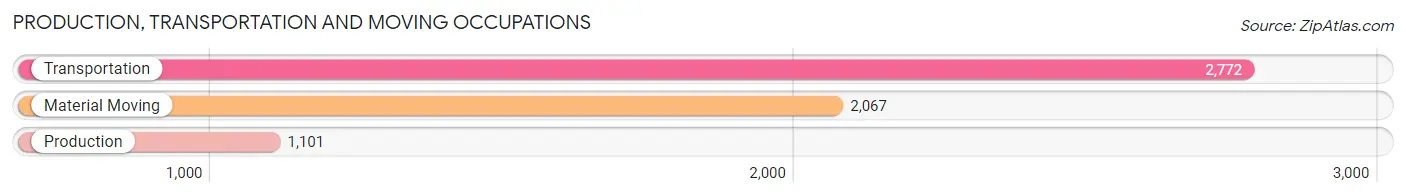
Production, Transportation and Moving Occupations
The most common Production, Transportation and Moving occupations in Stafford County are Transportation (2,772 | 3.6%), Material Moving (2,067 | 2.7%), and Production (1,101 | 1.4%).
Production, Transportation and Moving Occupations by Sex
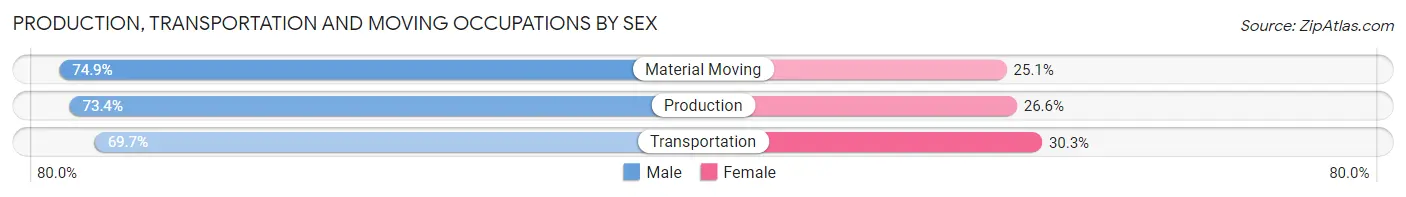
| Occupation | Male | Female |
| Production | 808 (73.4%) | 293 (26.6%) |
| Transportation | 1,932 (69.7%) | 840 (30.3%) |
| Material Moving | 1,548 (74.9%) | 519 (25.1%) |
| Total (Category) | 4,288 (72.2%) | 1,652 (27.8%) |
| Total (Overall) | 41,225 (53.8%) | 35,329 (46.2%) |
Employment Industries by Sex in Stafford County
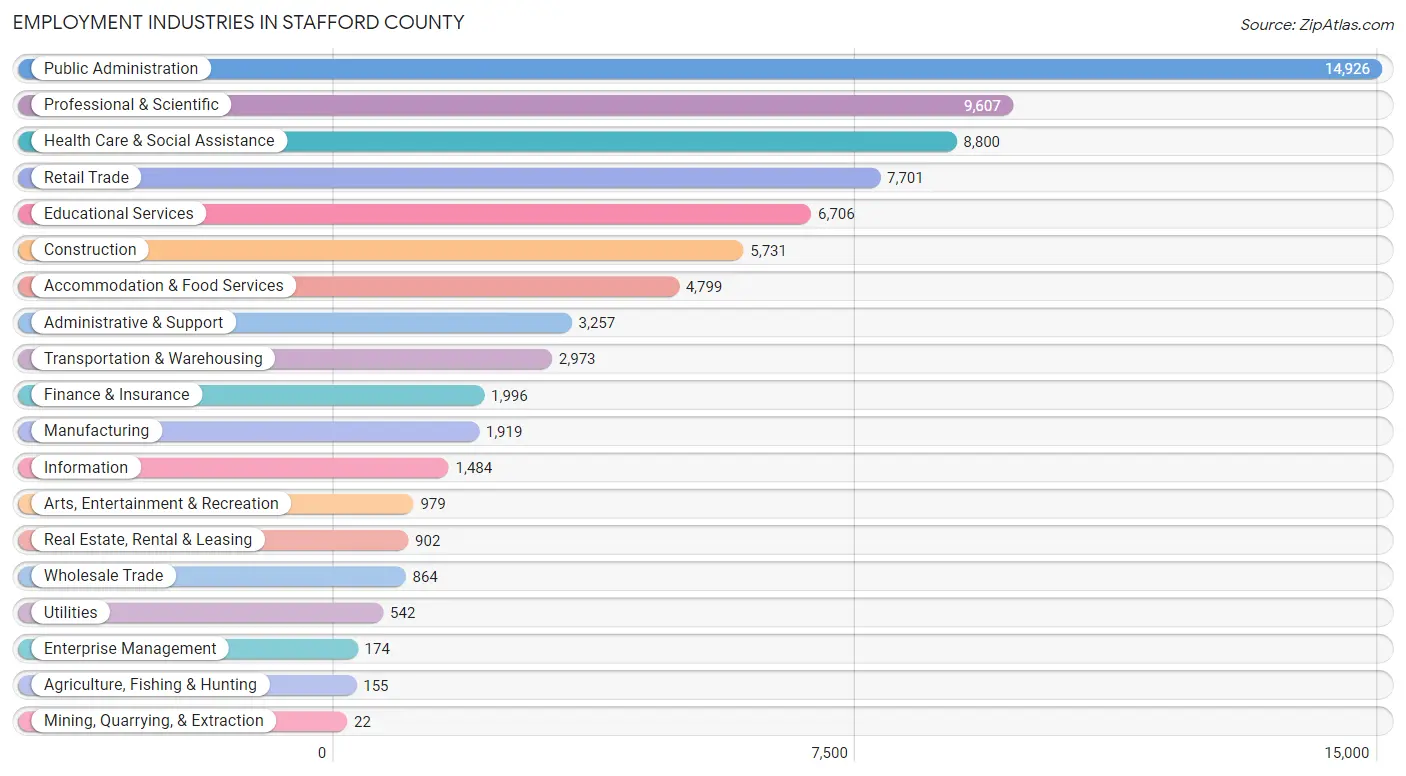
Employment Industries in Stafford County
The major employment industries in Stafford County include Public Administration (14,926 | 19.5%), Professional & Scientific (9,607 | 12.6%), Health Care & Social Assistance (8,800 | 11.5%), Retail Trade (7,701 | 10.1%), and Educational Services (6,706 | 8.8%).
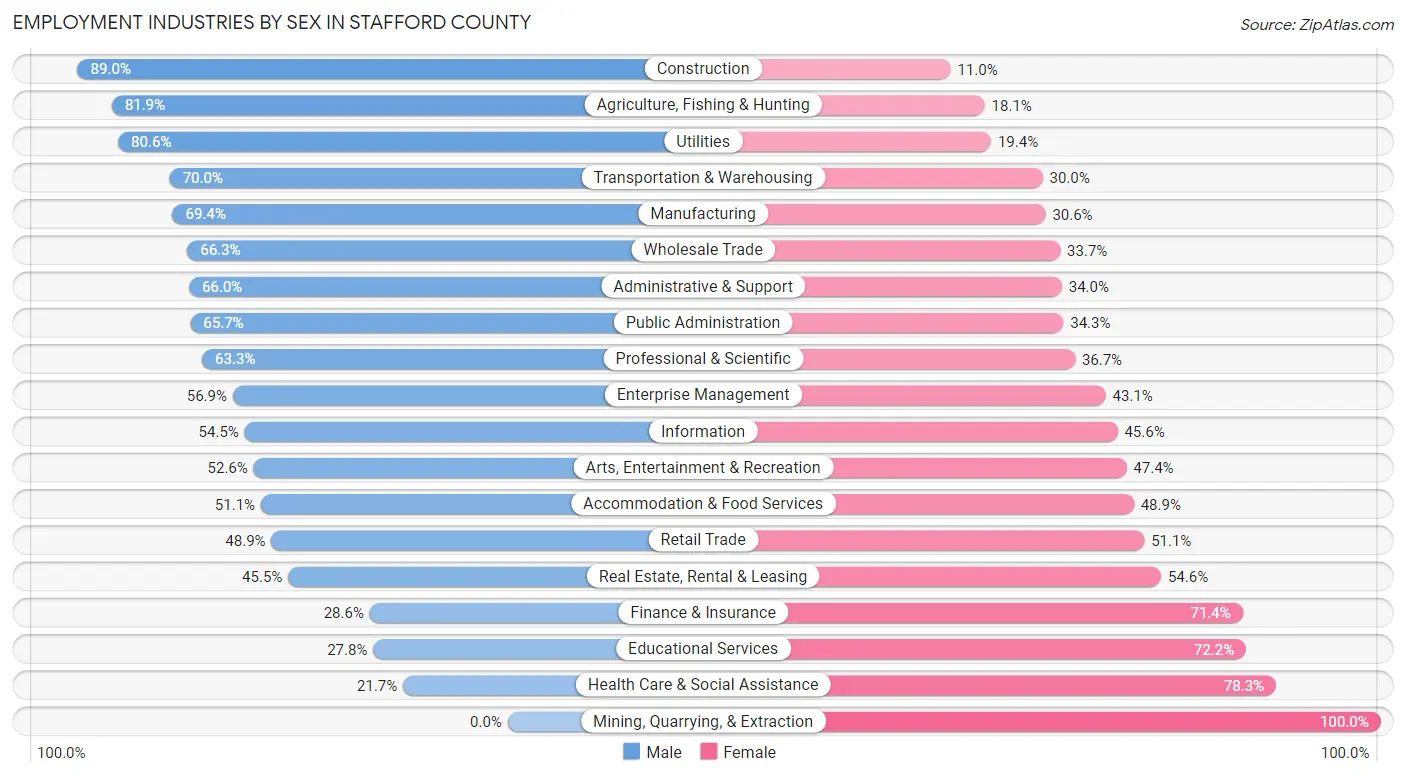
Employment Industries by Sex in Stafford County
The Stafford County industries that see more men than women are Construction (89.0%), Agriculture, Fishing & Hunting (81.9%), and Utilities (80.6%), whereas the industries that tend to have a higher number of women are Mining, Quarrying, & Extraction (100.0%), Health Care & Social Assistance (78.3%), and Educational Services (72.2%).
| Industry | Male | Female |
| Agriculture, Fishing & Hunting | 127 (81.9%) | 28 (18.1%) |
| Mining, Quarrying, & Extraction | 0 (0.0%) | 22 (100.0%) |
| Construction | 5,101 (89.0%) | 630 (11.0%) |
| Manufacturing | 1,331 (69.4%) | 588 (30.6%) |
| Wholesale Trade | 573 (66.3%) | 291 (33.7%) |
| Retail Trade | 3,767 (48.9%) | 3,934 (51.1%) |
| Transportation & Warehousing | 2,080 (70.0%) | 893 (30.0%) |
| Utilities | 437 (80.6%) | 105 (19.4%) |
| Information | 808 (54.4%) | 676 (45.6%) |
| Finance & Insurance | 570 (28.6%) | 1,426 (71.4%) |
| Real Estate, Rental & Leasing | 410 (45.5%) | 492 (54.5%) |
| Professional & Scientific | 6,077 (63.3%) | 3,530 (36.7%) |
| Enterprise Management | 99 (56.9%) | 75 (43.1%) |
| Administrative & Support | 2,149 (66.0%) | 1,108 (34.0%) |
| Educational Services | 1,867 (27.8%) | 4,839 (72.2%) |
| Health Care & Social Assistance | 1,906 (21.7%) | 6,894 (78.3%) |
| Arts, Entertainment & Recreation | 515 (52.6%) | 464 (47.4%) |
| Accommodation & Food Services | 2,452 (51.1%) | 2,347 (48.9%) |
| Public Administration | 9,802 (65.7%) | 5,124 (34.3%) |
| Total | 41,225 (53.8%) | 35,329 (46.2%) |
Education in Stafford County
School Enrollment in Stafford County
The most common levels of schooling among the 44,407 students in Stafford County are high school (10,538 | 23.7%), middle school (10,321 | 23.2%), and elementary school (8,840 | 19.9%).
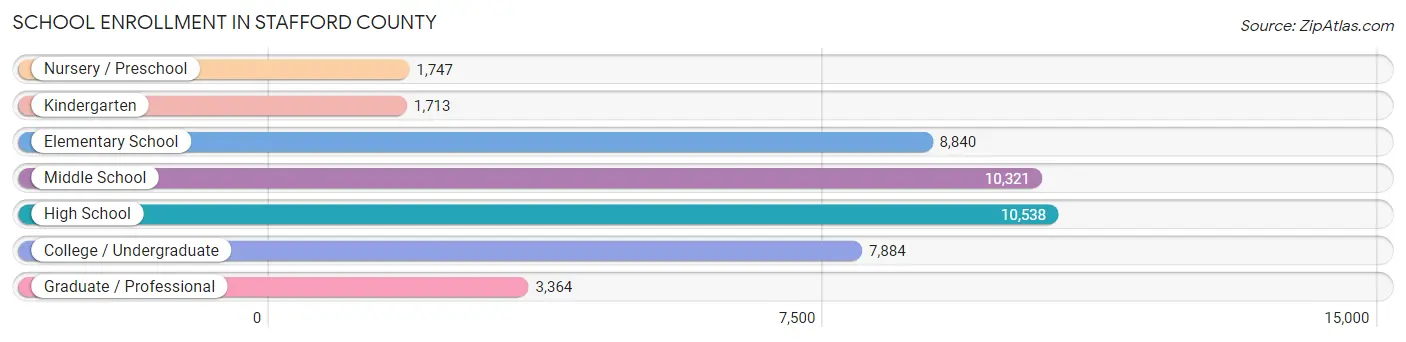
| School Level | # Students | % Students |
| Nursery / Preschool | 1,747 | 3.9% |
| Kindergarten | 1,713 | 3.9% |
| Elementary School | 8,840 | 19.9% |
| Middle School | 10,321 | 23.2% |
| High School | 10,538 | 23.7% |
| College / Undergraduate | 7,884 | 17.7% |
| Graduate / Professional | 3,364 | 7.6% |
| Total | 44,407 | 100.0% |
School Enrollment by Age by Funding Source in Stafford County
Out of a total of 44,407 students who are enrolled in schools in Stafford County, 6,306 (14.2%) attend a private institution, while the remaining 38,101 (85.8%) are enrolled in public schools. The age group of 3 to 4 year olds has the highest likelihood of being enrolled in private schools, with 565 (43.8% in the age bracket) enrolled. Conversely, the age group of 15 to 17 year olds has the lowest likelihood of being enrolled in a private school, with 6,935 (92.6% in the age bracket) attending a public institution.
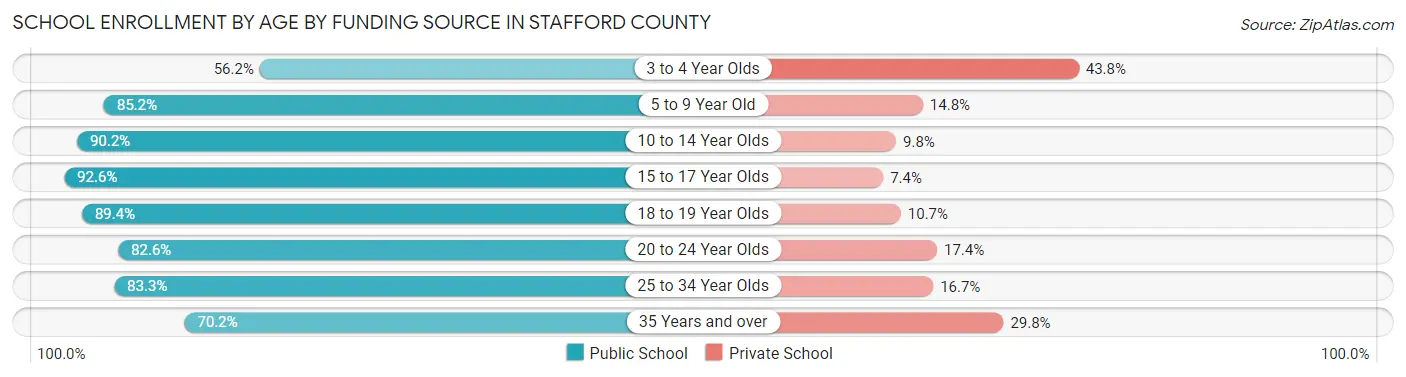
| Age Bracket | Public School | Private School |
| 3 to 4 Year Olds | 725 (56.2%) | 565 (43.8%) |
| 5 to 9 Year Old | 8,469 (85.2%) | 1,466 (14.8%) |
| 10 to 14 Year Olds | 11,537 (90.2%) | 1,248 (9.8%) |
| 15 to 17 Year Olds | 6,935 (92.6%) | 551 (7.4%) |
| 18 to 19 Year Olds | 2,560 (89.3%) | 305 (10.6%) |
| 20 to 24 Year Olds | 3,277 (82.6%) | 690 (17.4%) |
| 25 to 34 Year Olds | 1,968 (83.3%) | 394 (16.7%) |
| 35 Years and over | 2,611 (70.2%) | 1,106 (29.8%) |
| Total | 38,101 (85.8%) | 6,306 (14.2%) |
Educational Attainment by Field of Study in Stafford County
Business (9,209 | 19.4%), social sciences (4,361 | 9.2%), arts & humanities (4,332 | 9.1%), computers & mathematics (4,075 | 8.6%), and education (3,869 | 8.2%) are the most common fields of study among 47,376 individuals in Stafford County who have obtained a bachelor's degree or higher.
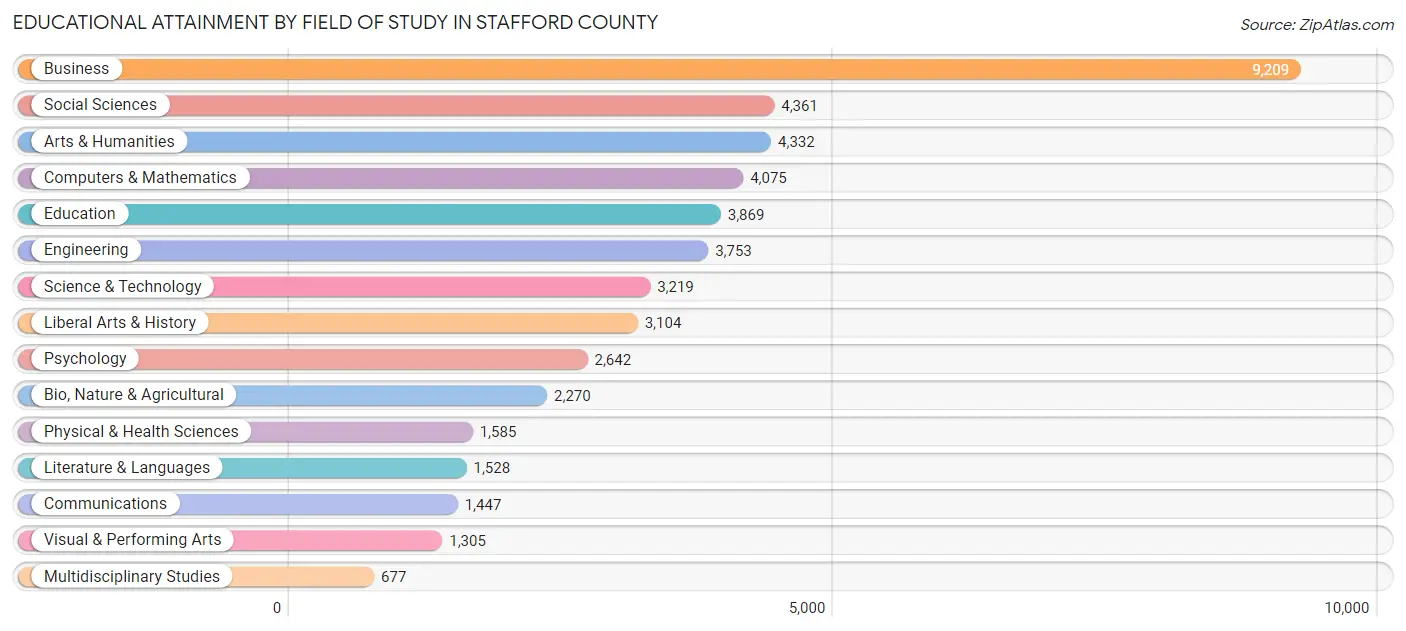
| Field of Study | # Graduates | % Graduates |
| Computers & Mathematics | 4,075 | 8.6% |
| Bio, Nature & Agricultural | 2,270 | 4.8% |
| Physical & Health Sciences | 1,585 | 3.4% |
| Psychology | 2,642 | 5.6% |
| Social Sciences | 4,361 | 9.2% |
| Engineering | 3,753 | 7.9% |
| Multidisciplinary Studies | 677 | 1.4% |
| Science & Technology | 3,219 | 6.8% |
| Business | 9,209 | 19.4% |
| Education | 3,869 | 8.2% |
| Literature & Languages | 1,528 | 3.2% |
| Liberal Arts & History | 3,104 | 6.6% |
| Visual & Performing Arts | 1,305 | 2.8% |
| Communications | 1,447 | 3.0% |
| Arts & Humanities | 4,332 | 9.1% |
| Total | 47,376 | 100.0% |
Transportation & Commute in Stafford County
Vehicle Availability by Sex in Stafford County
The most prevalent vehicle ownership categories in Stafford County are males with 2 vehicles (15,932, accounting for 37.6%) and females with 2 vehicles (12,355, making up 46.2%).
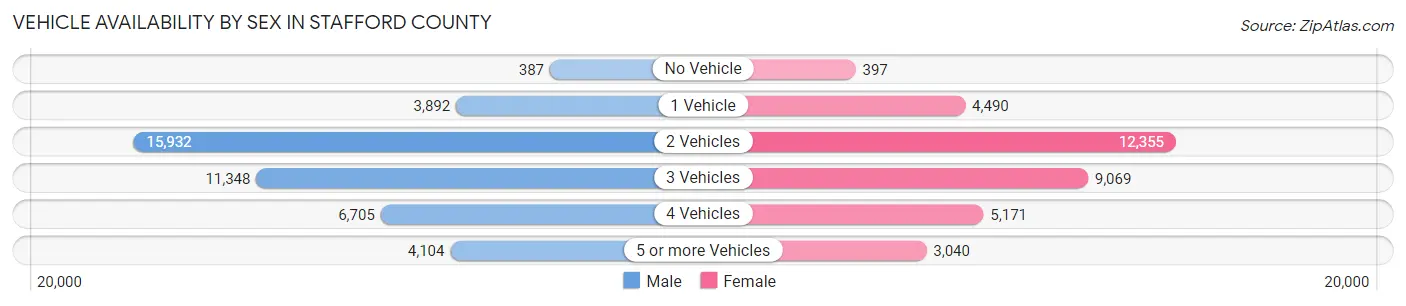
| Vehicles Available | Male | Female |
| No Vehicle | 387 (0.9%) | 397 (1.1%) |
| 1 Vehicle | 3,892 (9.2%) | 4,490 (13.0%) |
| 2 Vehicles | 15,932 (37.6%) | 12,355 (35.8%) |
| 3 Vehicles | 11,348 (26.8%) | 9,069 (26.3%) |
| 4 Vehicles | 6,705 (15.8%) | 5,171 (15.0%) |
| 5 or more Vehicles | 4,104 (9.7%) | 3,040 (8.8%) |
| Total | 42,368 (100.0%) | 34,522 (100.0%) |
Commute Time in Stafford County
The most frequently occuring commute durations in Stafford County are 60 to 89 minutes (11,466 commuters, 17.1%), 45 to 59 minutes (8,201 commuters, 12.3%), and 30 to 34 minutes (7,515 commuters, 11.2%).
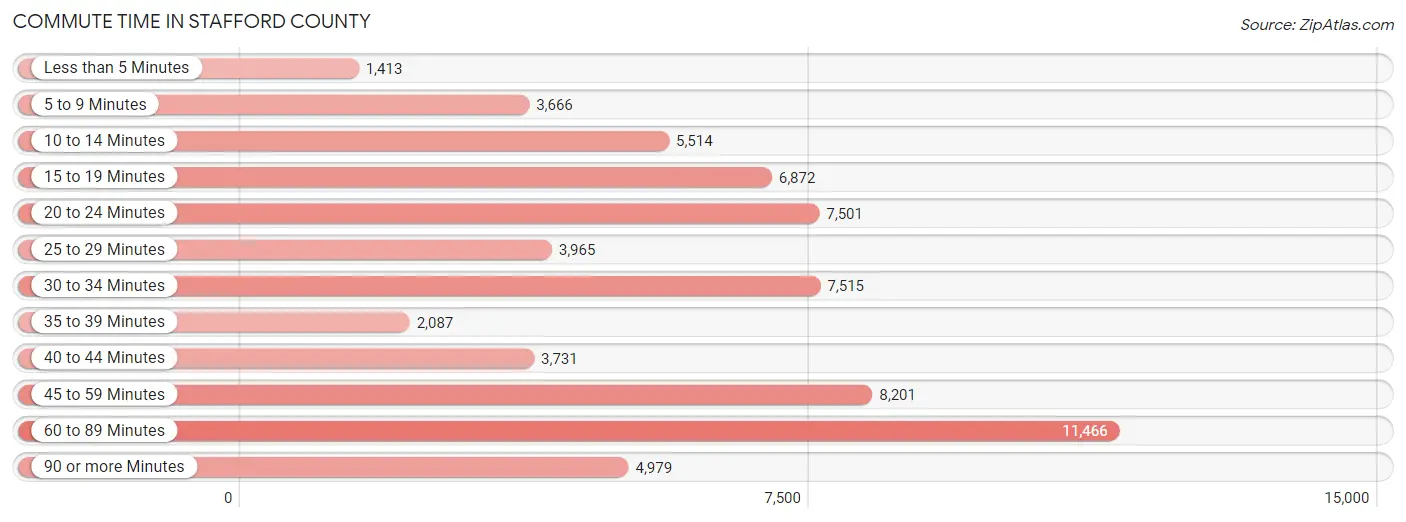
| Commute Time | # Commuters | % Commuters |
| Less than 5 Minutes | 1,413 | 2.1% |
| 5 to 9 Minutes | 3,666 | 5.5% |
| 10 to 14 Minutes | 5,514 | 8.2% |
| 15 to 19 Minutes | 6,872 | 10.3% |
| 20 to 24 Minutes | 7,501 | 11.2% |
| 25 to 29 Minutes | 3,965 | 5.9% |
| 30 to 34 Minutes | 7,515 | 11.2% |
| 35 to 39 Minutes | 2,087 | 3.1% |
| 40 to 44 Minutes | 3,731 | 5.6% |
| 45 to 59 Minutes | 8,201 | 12.3% |
| 60 to 89 Minutes | 11,466 | 17.1% |
| 90 or more Minutes | 4,979 | 7.4% |
Commute Time by Sex in Stafford County
The most common commute times in Stafford County are 60 to 89 minutes (7,692 commuters, 20.4%) for males and 20 to 24 minutes (4,245 commuters, 14.5%) for females.
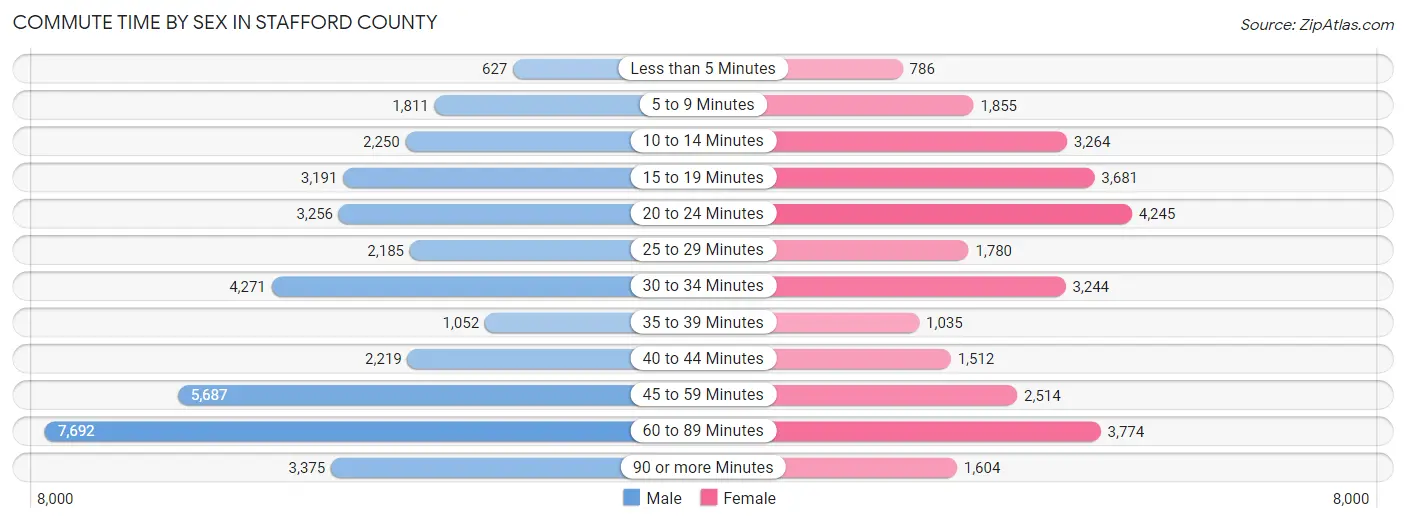
| Commute Time | Male | Female |
| Less than 5 Minutes | 627 (1.7%) | 786 (2.7%) |
| 5 to 9 Minutes | 1,811 (4.8%) | 1,855 (6.3%) |
| 10 to 14 Minutes | 2,250 (6.0%) | 3,264 (11.1%) |
| 15 to 19 Minutes | 3,191 (8.5%) | 3,681 (12.6%) |
| 20 to 24 Minutes | 3,256 (8.7%) | 4,245 (14.5%) |
| 25 to 29 Minutes | 2,185 (5.8%) | 1,780 (6.1%) |
| 30 to 34 Minutes | 4,271 (11.4%) | 3,244 (11.1%) |
| 35 to 39 Minutes | 1,052 (2.8%) | 1,035 (3.5%) |
| 40 to 44 Minutes | 2,219 (5.9%) | 1,512 (5.2%) |
| 45 to 59 Minutes | 5,687 (15.1%) | 2,514 (8.6%) |
| 60 to 89 Minutes | 7,692 (20.4%) | 3,774 (12.9%) |
| 90 or more Minutes | 3,375 (9.0%) | 1,604 (5.5%) |
Time of Departure to Work by Sex in Stafford County
The most frequent times of departure to work in Stafford County are 12:00 AM to 4:59 AM (5,171, 13.8%) for males and 7:00 AM to 7:29 AM (3,757, 12.8%) for females.
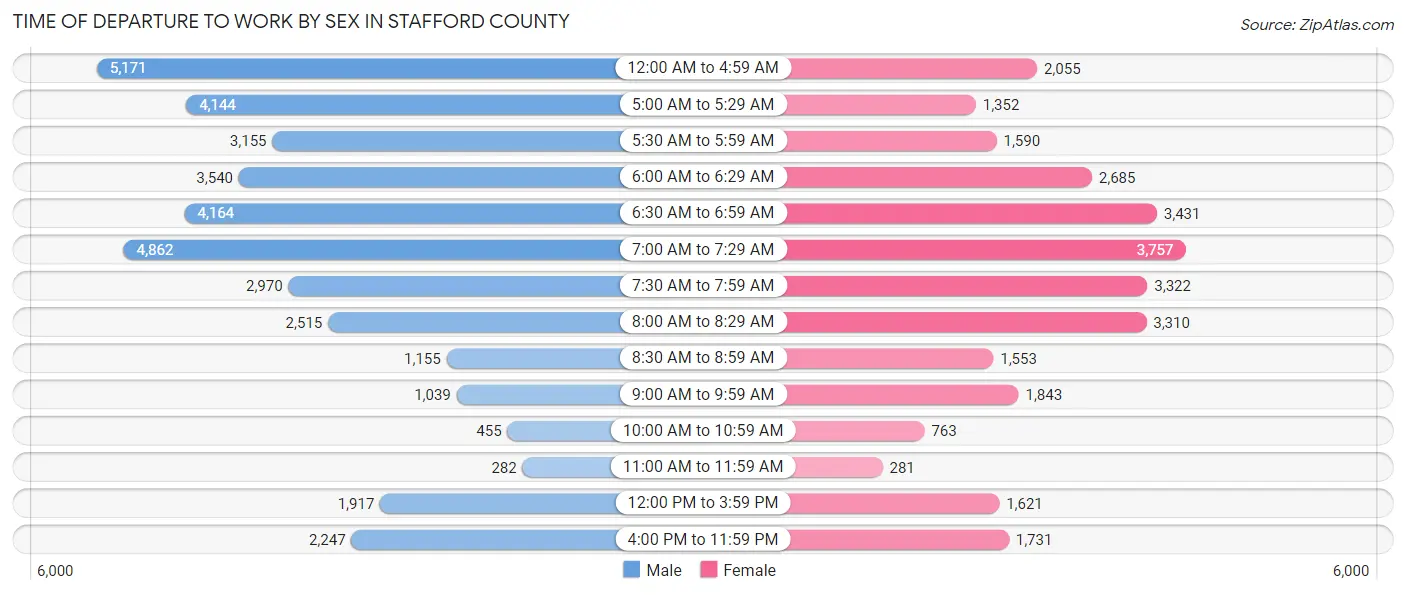
| Time of Departure | Male | Female |
| 12:00 AM to 4:59 AM | 5,171 (13.8%) | 2,055 (7.0%) |
| 5:00 AM to 5:29 AM | 4,144 (11.0%) | 1,352 (4.6%) |
| 5:30 AM to 5:59 AM | 3,155 (8.4%) | 1,590 (5.4%) |
| 6:00 AM to 6:29 AM | 3,540 (9.4%) | 2,685 (9.2%) |
| 6:30 AM to 6:59 AM | 4,164 (11.1%) | 3,431 (11.7%) |
| 7:00 AM to 7:29 AM | 4,862 (12.9%) | 3,757 (12.8%) |
| 7:30 AM to 7:59 AM | 2,970 (7.9%) | 3,322 (11.3%) |
| 8:00 AM to 8:29 AM | 2,515 (6.7%) | 3,310 (11.3%) |
| 8:30 AM to 8:59 AM | 1,155 (3.1%) | 1,553 (5.3%) |
| 9:00 AM to 9:59 AM | 1,039 (2.8%) | 1,843 (6.3%) |
| 10:00 AM to 10:59 AM | 455 (1.2%) | 763 (2.6%) |
| 11:00 AM to 11:59 AM | 282 (0.7%) | 281 (1.0%) |
| 12:00 PM to 3:59 PM | 1,917 (5.1%) | 1,621 (5.5%) |
| 4:00 PM to 11:59 PM | 2,247 (6.0%) | 1,731 (5.9%) |
| Total | 37,616 (100.0%) | 29,294 (100.0%) |
Housing Occupancy in Stafford County
Occupancy by Ownership in Stafford County
Of the total 50,313 dwellings in Stafford County, owner-occupied units account for 40,044 (79.6%), while renter-occupied units make up 10,269 (20.4%).
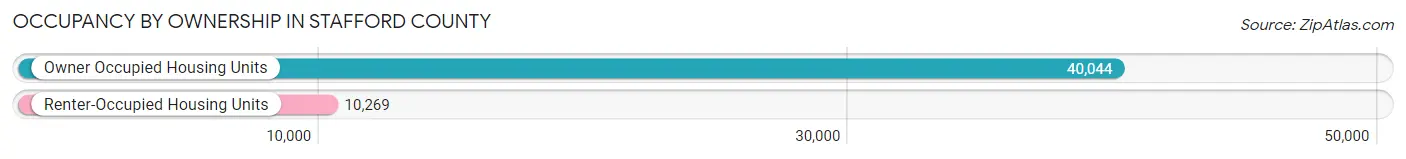
| Occupancy | # Housing Units | % Housing Units |
| Owner Occupied Housing Units | 40,044 | 79.6% |
| Renter-Occupied Housing Units | 10,269 | 20.4% |
| Total Occupied Housing Units | 50,313 | 100.0% |
Occupancy by Household Size in Stafford County
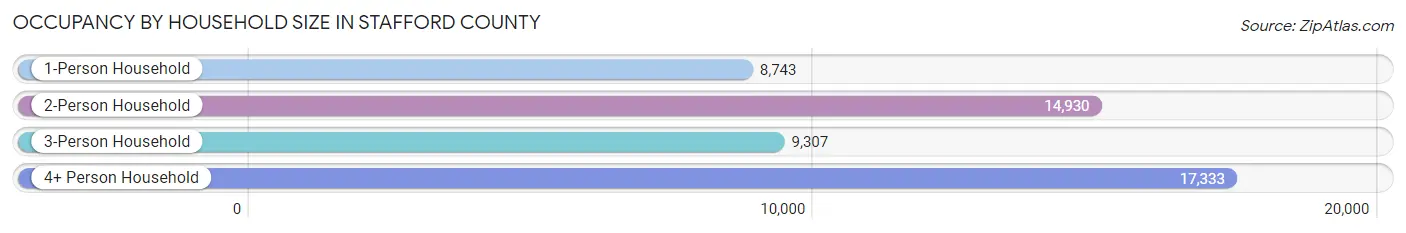
| Household Size | # Housing Units | % Housing Units |
| 1-Person Household | 8,743 | 17.4% |
| 2-Person Household | 14,930 | 29.7% |
| 3-Person Household | 9,307 | 18.5% |
| 4+ Person Household | 17,333 | 34.4% |
| Total Housing Units | 50,313 | 100.0% |
Occupancy by Ownership by Household Size in Stafford County
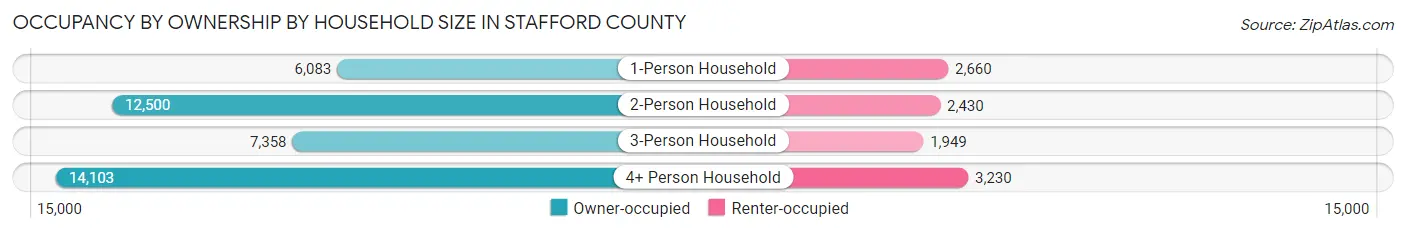
| Household Size | Owner-occupied | Renter-occupied |
| 1-Person Household | 6,083 (69.6%) | 2,660 (30.4%) |
| 2-Person Household | 12,500 (83.7%) | 2,430 (16.3%) |
| 3-Person Household | 7,358 (79.1%) | 1,949 (20.9%) |
| 4+ Person Household | 14,103 (81.4%) | 3,230 (18.6%) |
| Total Housing Units | 40,044 (79.6%) | 10,269 (20.4%) |
Occupancy by Educational Attainment in Stafford County
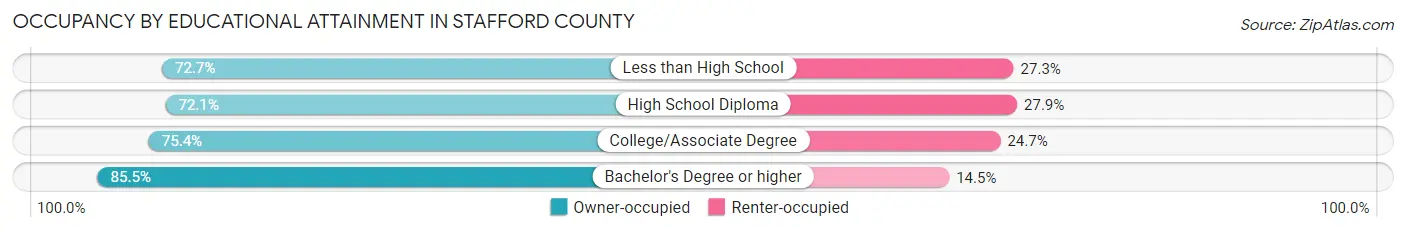
| Household Size | Owner-occupied | Renter-occupied |
| Less than High School | 2,073 (72.7%) | 777 (27.3%) |
| High School Diploma | 6,235 (72.1%) | 2,418 (27.9%) |
| College/Associate Degree | 10,751 (75.3%) | 3,518 (24.6%) |
| Bachelor's Degree or higher | 20,985 (85.5%) | 3,556 (14.5%) |
Occupancy by Age of Householder in Stafford County
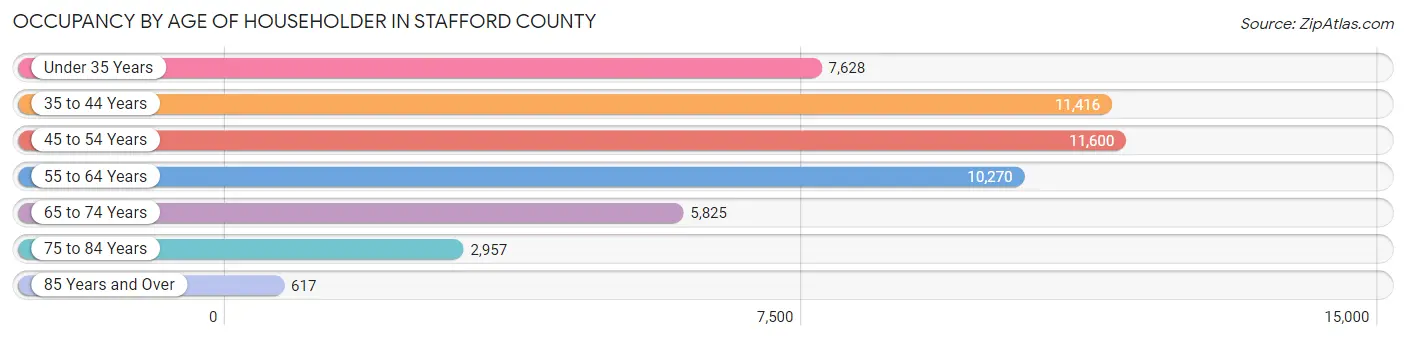
| Age Bracket | # Households | % Households |
| Under 35 Years | 7,628 | 15.2% |
| 35 to 44 Years | 11,416 | 22.7% |
| 45 to 54 Years | 11,600 | 23.1% |
| 55 to 64 Years | 10,270 | 20.4% |
| 65 to 74 Years | 5,825 | 11.6% |
| 75 to 84 Years | 2,957 | 5.9% |
| 85 Years and Over | 617 | 1.2% |
| Total | 50,313 | 100.0% |
Housing Finances in Stafford County
Median Income by Occupancy in Stafford County
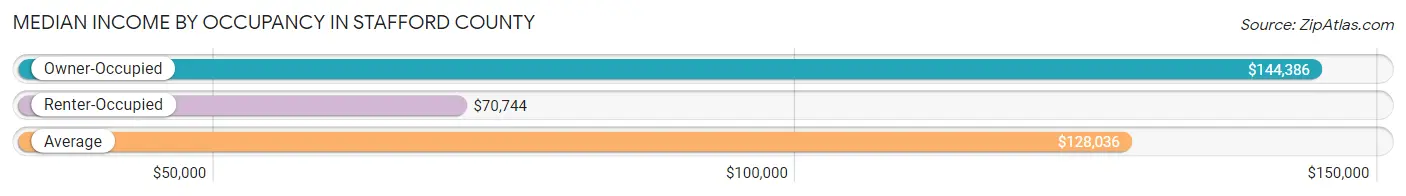
| Occupancy Type | # Households | Median Income |
| Owner-Occupied | 40,044 (79.6%) | $144,386 |
| Renter-Occupied | 10,269 (20.4%) | $70,744 |
| Average | 50,313 (100.0%) | $128,036 |
Occupancy by Householder Income Bracket in Stafford County
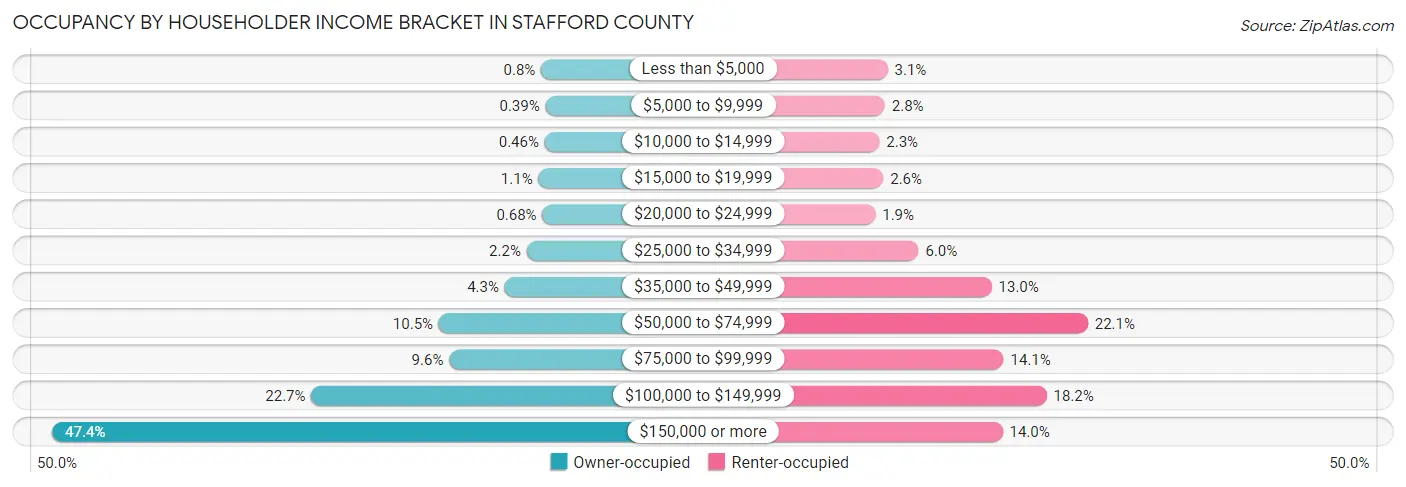
| Income Bracket | Owner-occupied | Renter-occupied |
| Less than $5,000 | 319 (0.8%) | 313 (3.0%) |
| $5,000 to $9,999 | 155 (0.4%) | 286 (2.8%) |
| $10,000 to $14,999 | 185 (0.5%) | 233 (2.3%) |
| $15,000 to $19,999 | 424 (1.1%) | 271 (2.6%) |
| $20,000 to $24,999 | 272 (0.7%) | 193 (1.9%) |
| $25,000 to $34,999 | 874 (2.2%) | 616 (6.0%) |
| $35,000 to $49,999 | 1,710 (4.3%) | 1,331 (13.0%) |
| $50,000 to $74,999 | 4,220 (10.5%) | 2,272 (22.1%) |
| $75,000 to $99,999 | 3,829 (9.6%) | 1,448 (14.1%) |
| $100,000 to $149,999 | 9,086 (22.7%) | 1,868 (18.2%) |
| $150,000 or more | 18,970 (47.4%) | 1,438 (14.0%) |
| Total | 40,044 (100.0%) | 10,269 (100.0%) |
Monthly Housing Cost Tiers in Stafford County
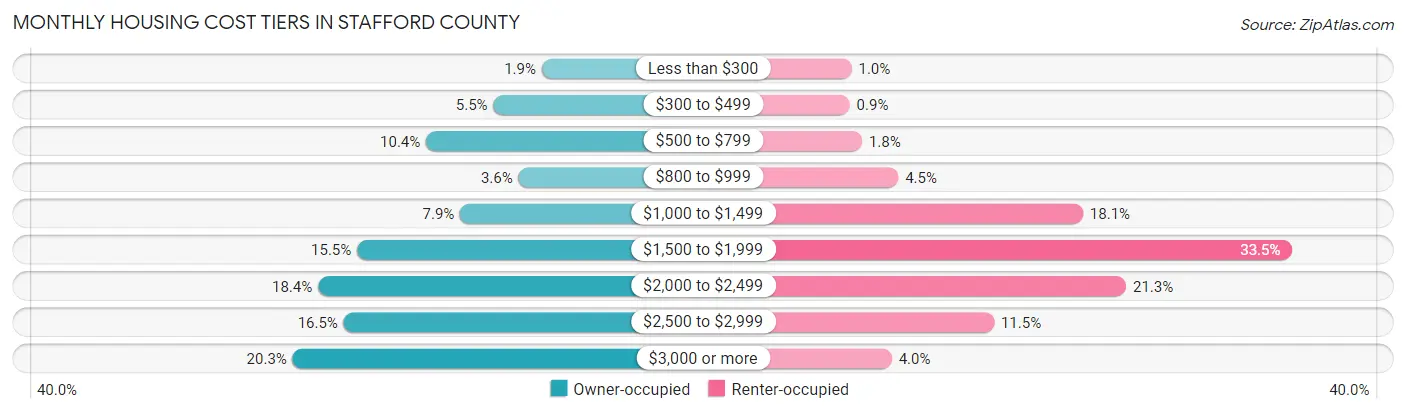
| Monthly Cost | Owner-occupied | Renter-occupied |
| Less than $300 | 764 (1.9%) | 107 (1.0%) |
| $300 to $499 | 2,192 (5.5%) | 92 (0.9%) |
| $500 to $799 | 4,176 (10.4%) | 186 (1.8%) |
| $800 to $999 | 1,449 (3.6%) | 460 (4.5%) |
| $1,000 to $1,499 | 3,171 (7.9%) | 1,857 (18.1%) |
| $1,500 to $1,999 | 6,209 (15.5%) | 3,440 (33.5%) |
| $2,000 to $2,499 | 7,365 (18.4%) | 2,183 (21.3%) |
| $2,500 to $2,999 | 6,606 (16.5%) | 1,184 (11.5%) |
| $3,000 or more | 8,112 (20.3%) | 411 (4.0%) |
| Total | 40,044 (100.0%) | 10,269 (100.0%) |
Physical Housing Characteristics in Stafford County
Housing Structures in Stafford County
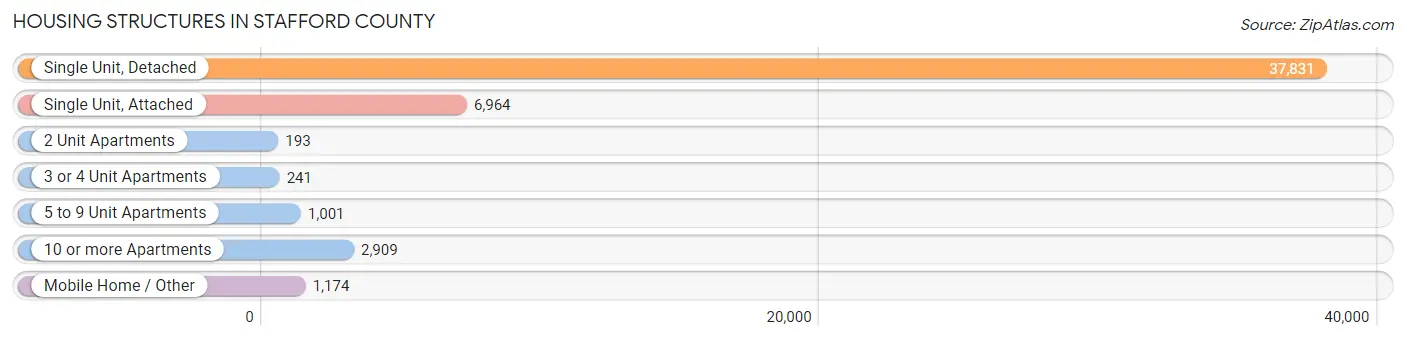
| Structure Type | # Housing Units | % Housing Units |
| Single Unit, Detached | 37,831 | 75.2% |
| Single Unit, Attached | 6,964 | 13.8% |
| 2 Unit Apartments | 193 | 0.4% |
| 3 or 4 Unit Apartments | 241 | 0.5% |
| 5 to 9 Unit Apartments | 1,001 | 2.0% |
| 10 or more Apartments | 2,909 | 5.8% |
| Mobile Home / Other | 1,174 | 2.3% |
| Total | 50,313 | 100.0% |
Housing Structures by Occupancy in Stafford County
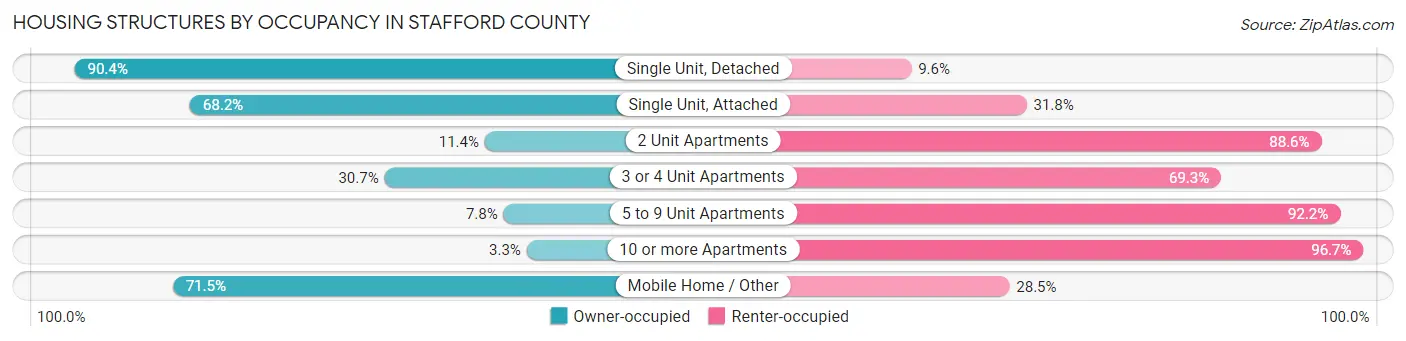
| Structure Type | Owner-occupied | Renter-occupied |
| Single Unit, Detached | 34,187 (90.4%) | 3,644 (9.6%) |
| Single Unit, Attached | 4,747 (68.2%) | 2,217 (31.8%) |
| 2 Unit Apartments | 22 (11.4%) | 171 (88.6%) |
| 3 or 4 Unit Apartments | 74 (30.7%) | 167 (69.3%) |
| 5 to 9 Unit Apartments | 78 (7.8%) | 923 (92.2%) |
| 10 or more Apartments | 97 (3.3%) | 2,812 (96.7%) |
| Mobile Home / Other | 839 (71.5%) | 335 (28.5%) |
| Total | 40,044 (79.6%) | 10,269 (20.4%) |
Housing Structures by Number of Rooms in Stafford County
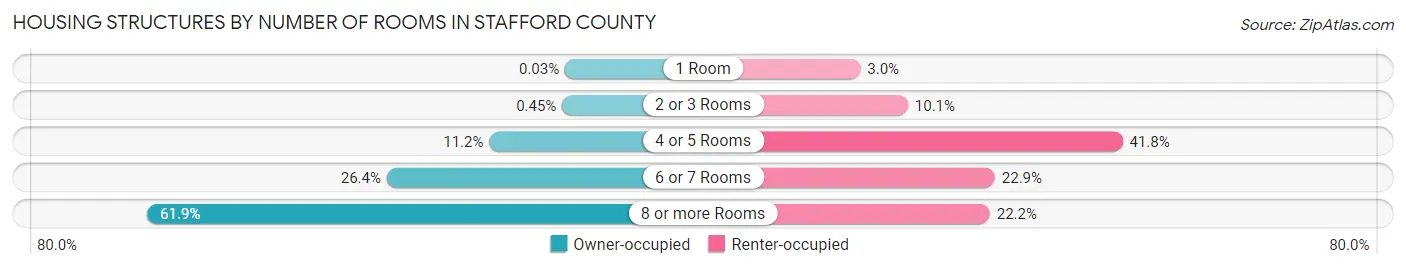
| Number of Rooms | Owner-occupied | Renter-occupied |
| 1 Room | 12 (0.0%) | 310 (3.0%) |
| 2 or 3 Rooms | 179 (0.4%) | 1,032 (10.1%) |
| 4 or 5 Rooms | 4,501 (11.2%) | 4,294 (41.8%) |
| 6 or 7 Rooms | 10,573 (26.4%) | 2,355 (22.9%) |
| 8 or more Rooms | 24,779 (61.9%) | 2,278 (22.2%) |
| Total | 40,044 (100.0%) | 10,269 (100.0%) |
Housing Structure by Heating Type in Stafford County
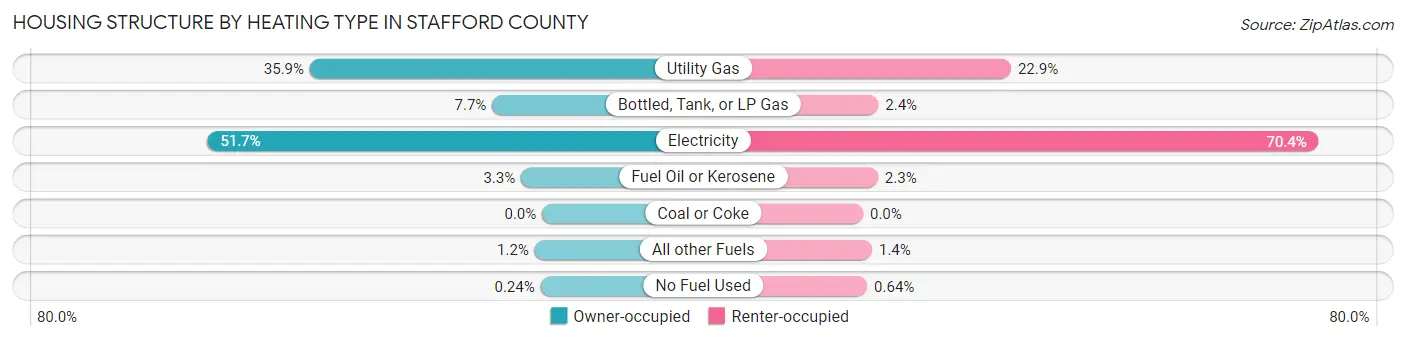
| Heating Type | Owner-occupied | Renter-occupied |
| Utility Gas | 14,374 (35.9%) | 2,349 (22.9%) |
| Bottled, Tank, or LP Gas | 3,092 (7.7%) | 243 (2.4%) |
| Electricity | 20,719 (51.7%) | 7,232 (70.4%) |
| Fuel Oil or Kerosene | 1,301 (3.3%) | 236 (2.3%) |
| Coal or Coke | 0 (0.0%) | 0 (0.0%) |
| All other Fuels | 462 (1.1%) | 143 (1.4%) |
| No Fuel Used | 96 (0.2%) | 66 (0.6%) |
| Total | 40,044 (100.0%) | 10,269 (100.0%) |
Household Vehicle Usage in Stafford County
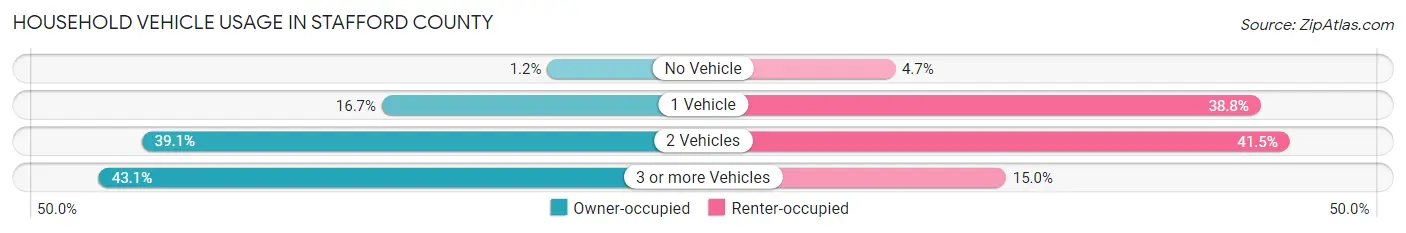
| Vehicles per Household | Owner-occupied | Renter-occupied |
| No Vehicle | 484 (1.2%) | 480 (4.7%) |
| 1 Vehicle | 6,668 (16.7%) | 3,985 (38.8%) |
| 2 Vehicles | 15,646 (39.1%) | 4,262 (41.5%) |
| 3 or more Vehicles | 17,246 (43.1%) | 1,542 (15.0%) |
| Total | 40,044 (100.0%) | 10,269 (100.0%) |
Real Estate & Mortgages in Stafford County
Real Estate and Mortgage Overview in Stafford County
| Characteristic | Without Mortgage | With Mortgage |
| Housing Units | 8,540 | 31,504 |
| Median Property Value | $373,300 | $443,600 |
| Median Household Income | $96,942 | $16,589 |
| Monthly Housing Costs | $597 | $8,112 |
| Real Estate Taxes | $2,950 | $1,451 |
Property Value by Mortgage Status in Stafford County
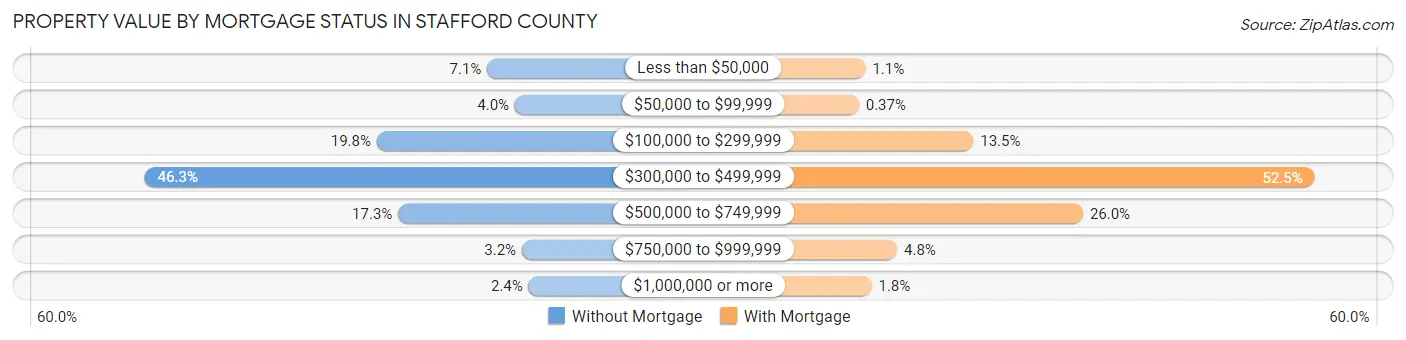
| Property Value | Without Mortgage | With Mortgage |
| Less than $50,000 | 609 (7.1%) | 357 (1.1%) |
| $50,000 to $99,999 | 338 (4.0%) | 118 (0.4%) |
| $100,000 to $299,999 | 1,687 (19.8%) | 4,242 (13.5%) |
| $300,000 to $499,999 | 3,953 (46.3%) | 16,523 (52.4%) |
| $500,000 to $749,999 | 1,478 (17.3%) | 8,188 (26.0%) |
| $750,000 to $999,999 | 270 (3.2%) | 1,498 (4.8%) |
| $1,000,000 or more | 205 (2.4%) | 578 (1.8%) |
| Total | 8,540 (100.0%) | 31,504 (100.0%) |
Household Income by Mortgage Status in Stafford County
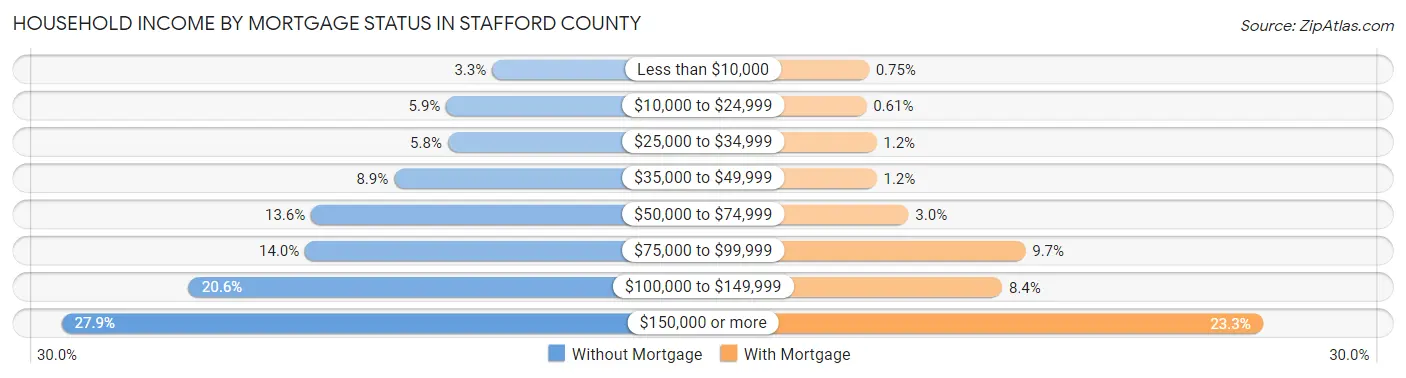
| Household Income | Without Mortgage | With Mortgage |
| Less than $10,000 | 281 (3.3%) | 236 (0.7%) |
| $10,000 to $24,999 | 505 (5.9%) | 193 (0.6%) |
| $25,000 to $34,999 | 497 (5.8%) | 376 (1.2%) |
| $35,000 to $49,999 | 759 (8.9%) | 377 (1.2%) |
| $50,000 to $74,999 | 1,164 (13.6%) | 951 (3.0%) |
| $75,000 to $99,999 | 1,193 (14.0%) | 3,056 (9.7%) |
| $100,000 to $149,999 | 1,760 (20.6%) | 2,636 (8.4%) |
| $150,000 or more | 2,381 (27.9%) | 7,326 (23.3%) |
| Total | 8,540 (100.0%) | 31,504 (100.0%) |
Property Value to Household Income Ratio in Stafford County
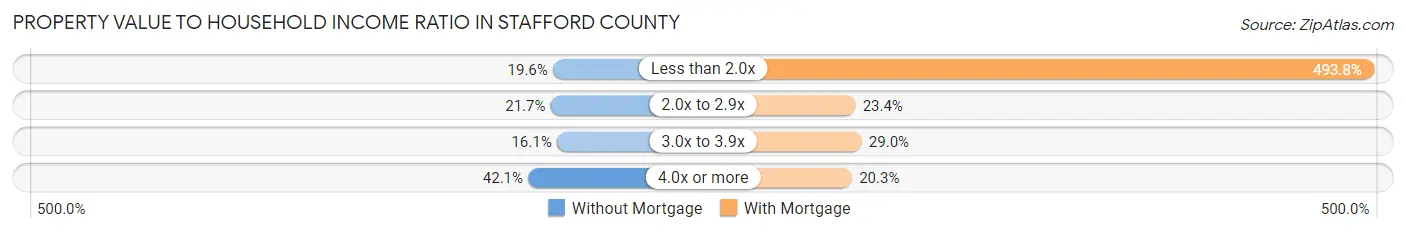
| Value-to-Income Ratio | Without Mortgage | With Mortgage |
| Less than 2.0x | 1,674 (19.6%) | 155,558 (493.8%) |
| 2.0x to 2.9x | 1,853 (21.7%) | 7,375 (23.4%) |
| 3.0x to 3.9x | 1,375 (16.1%) | 9,148 (29.0%) |
| 4.0x or more | 3,595 (42.1%) | 6,388 (20.3%) |
| Total | 8,540 (100.0%) | 31,504 (100.0%) |
Real Estate Taxes by Mortgage Status in Stafford County
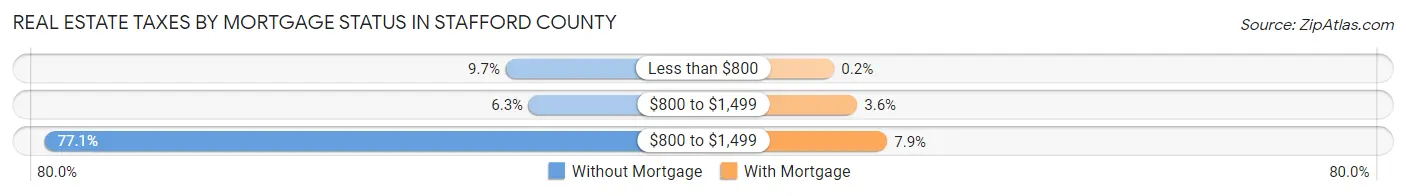
| Property Taxes | Without Mortgage | With Mortgage |
| Less than $800 | 828 (9.7%) | 62 (0.2%) |
| $800 to $1,499 | 539 (6.3%) | 1,118 (3.5%) |
| $800 to $1,499 | 6,582 (77.1%) | 2,498 (7.9%) |
| Total | 8,540 (100.0%) | 31,504 (100.0%) |
Health & Disability in Stafford County
Health Insurance Coverage by Age in Stafford County
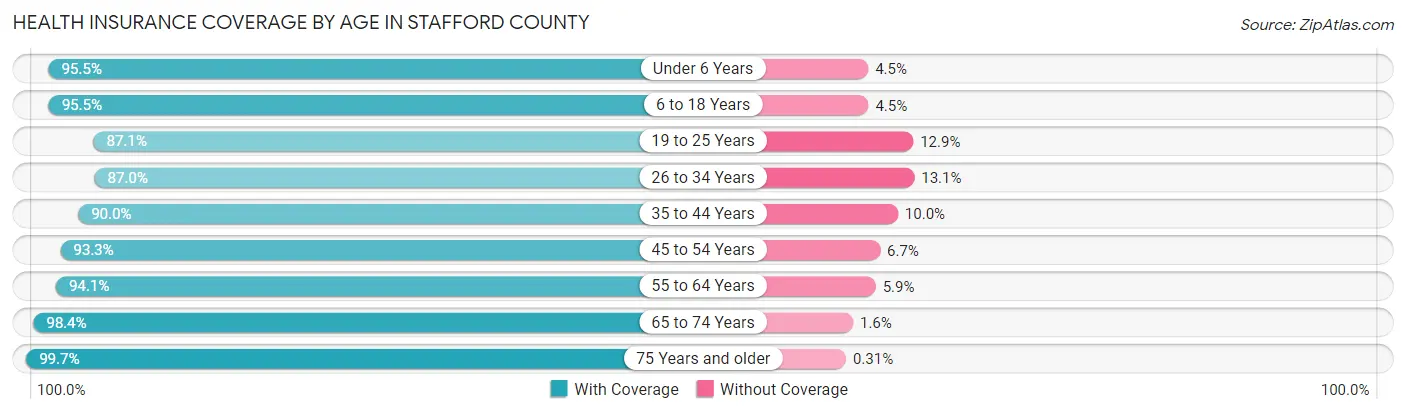
| Age Bracket | With Coverage | Without Coverage |
| Under 6 Years | 10,962 (95.5%) | 512 (4.5%) |
| 6 to 18 Years | 30,536 (95.5%) | 1,442 (4.5%) |
| 19 to 25 Years | 11,203 (87.1%) | 1,653 (12.9%) |
| 26 to 34 Years | 14,086 (87.0%) | 2,115 (13.1%) |
| 35 to 44 Years | 19,345 (90.0%) | 2,149 (10.0%) |
| 45 to 54 Years | 20,353 (93.3%) | 1,454 (6.7%) |
| 55 to 64 Years | 17,829 (94.1%) | 1,110 (5.9%) |
| 65 to 74 Years | 10,713 (98.4%) | 178 (1.6%) |
| 75 Years and older | 6,130 (99.7%) | 19 (0.3%) |
| Total | 141,157 (93.0%) | 10,632 (7.0%) |
Health Insurance Coverage by Citizenship Status in Stafford County
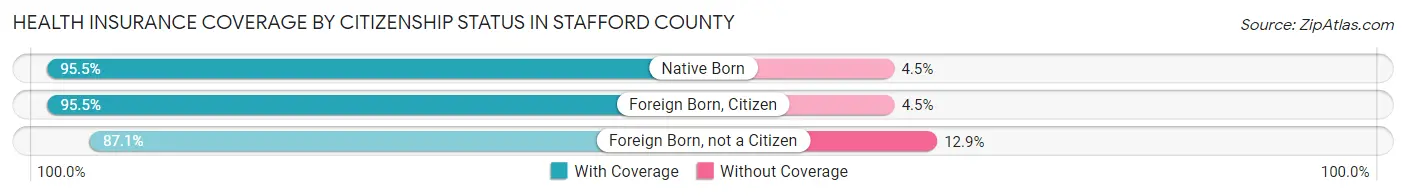
| Citizenship Status | With Coverage | Without Coverage |
| Native Born | 10,962 (95.5%) | 512 (4.5%) |
| Foreign Born, Citizen | 30,536 (95.5%) | 1,442 (4.5%) |
| Foreign Born, not a Citizen | 11,203 (87.1%) | 1,653 (12.9%) |
Health Insurance Coverage by Household Income in Stafford County
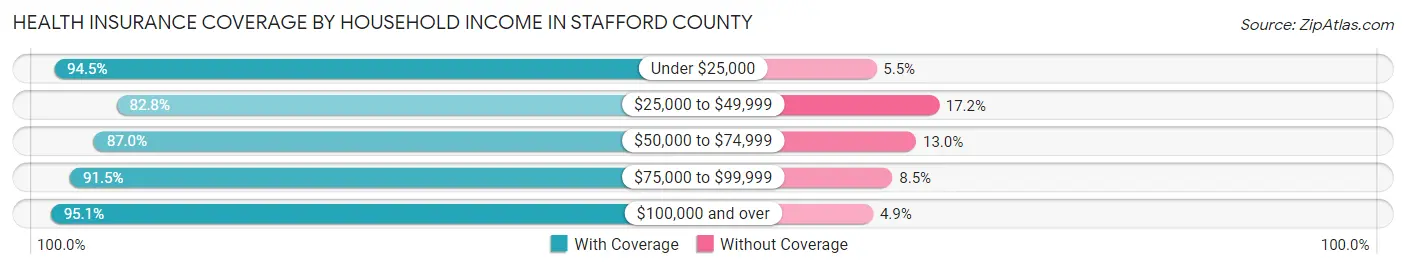
| Household Income | With Coverage | Without Coverage |
| Under $25,000 | 4,304 (94.5%) | 252 (5.5%) |
| $25,000 to $49,999 | 9,068 (82.8%) | 1,889 (17.2%) |
| $50,000 to $74,999 | 13,951 (87.0%) | 2,079 (13.0%) |
| $75,000 to $99,999 | 13,207 (91.5%) | 1,233 (8.5%) |
| $100,000 and over | 100,518 (95.1%) | 5,175 (4.9%) |
Public vs Private Health Insurance Coverage by Age in Stafford County
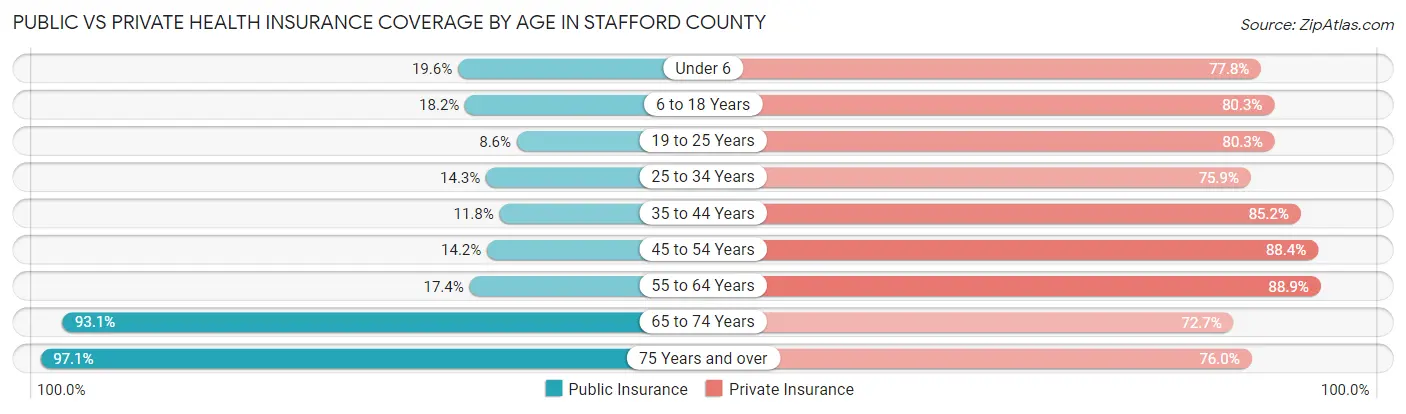
| Age Bracket | Public Insurance | Private Insurance |
| Under 6 | 2,244 (19.6%) | 8,931 (77.8%) |
| 6 to 18 Years | 5,830 (18.2%) | 25,661 (80.2%) |
| 19 to 25 Years | 1,110 (8.6%) | 10,327 (80.3%) |
| 25 to 34 Years | 2,323 (14.3%) | 12,296 (75.9%) |
| 35 to 44 Years | 2,545 (11.8%) | 18,308 (85.2%) |
| 45 to 54 Years | 3,086 (14.1%) | 19,272 (88.4%) |
| 55 to 64 Years | 3,298 (17.4%) | 16,833 (88.9%) |
| 65 to 74 Years | 10,136 (93.1%) | 7,919 (72.7%) |
| 75 Years and over | 5,970 (97.1%) | 4,676 (76.0%) |
| Total | 36,542 (24.1%) | 124,223 (81.8%) |
Disability Status by Sex by Age in Stafford County
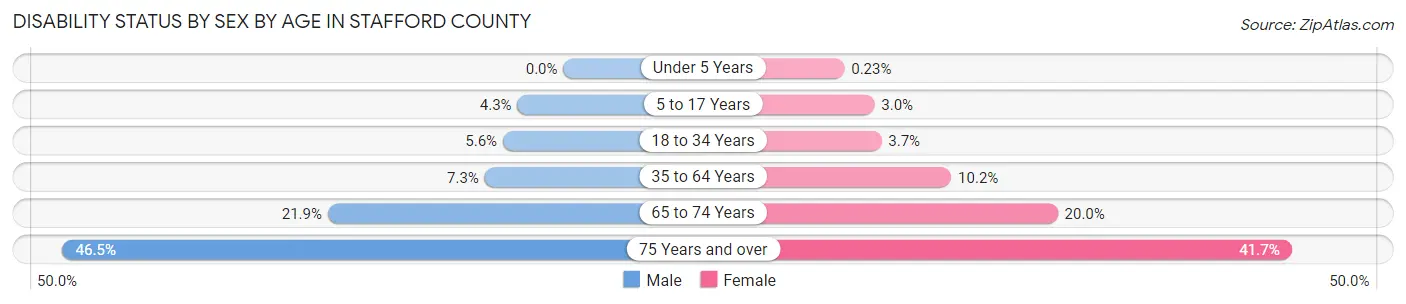
| Age Bracket | Male | Female |
| Under 5 Years | 0 (0.0%) | 11 (0.2%) |
| 5 to 17 Years | 682 (4.3%) | 461 (3.0%) |
| 18 to 34 Years | 858 (5.6%) | 593 (3.7%) |
| 35 to 64 Years | 2,249 (7.3%) | 3,189 (10.2%) |
| 65 to 74 Years | 1,127 (21.9%) | 1,149 (20.0%) |
| 75 Years and over | 1,216 (46.5%) | 1,474 (41.7%) |
Disability Class by Sex by Age in Stafford County
Disability Class: Hearing Difficulty
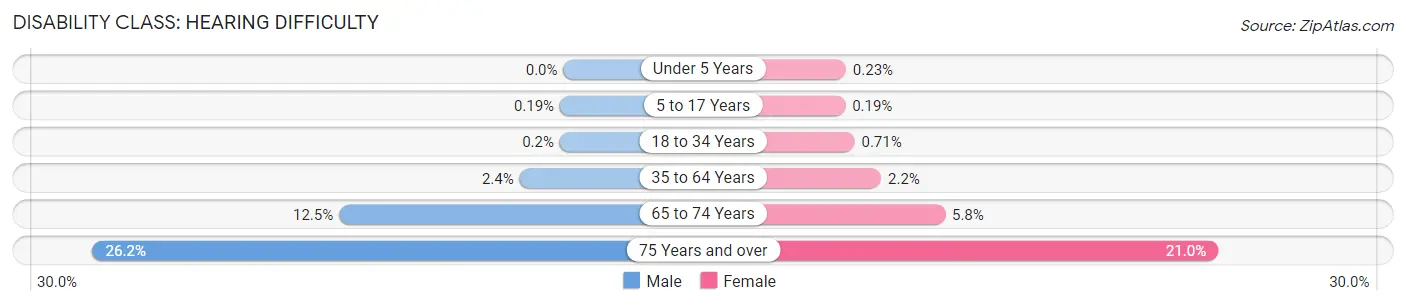
| Age Bracket | Male | Female |
| Under 5 Years | 0 (0.0%) | 11 (0.2%) |
| 5 to 17 Years | 31 (0.2%) | 29 (0.2%) |
| 18 to 34 Years | 30 (0.2%) | 114 (0.7%) |
| 35 to 64 Years | 753 (2.4%) | 687 (2.2%) |
| 65 to 74 Years | 644 (12.5%) | 330 (5.8%) |
| 75 Years and over | 686 (26.2%) | 740 (20.9%) |
Disability Class: Vision Difficulty
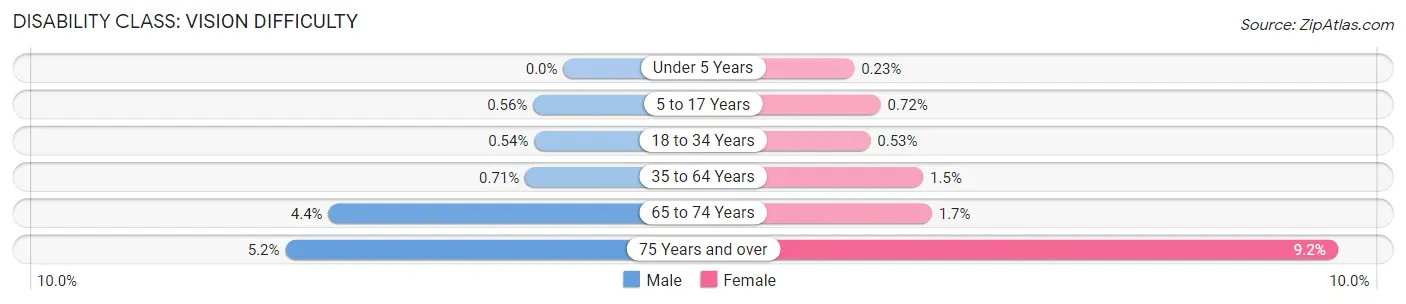
| Age Bracket | Male | Female |
| Under 5 Years | 0 (0.0%) | 11 (0.2%) |
| 5 to 17 Years | 90 (0.6%) | 110 (0.7%) |
| 18 to 34 Years | 82 (0.5%) | 85 (0.5%) |
| 35 to 64 Years | 220 (0.7%) | 474 (1.5%) |
| 65 to 74 Years | 225 (4.4%) | 96 (1.7%) |
| 75 Years and over | 135 (5.2%) | 325 (9.2%) |
Disability Class: Cognitive Difficulty
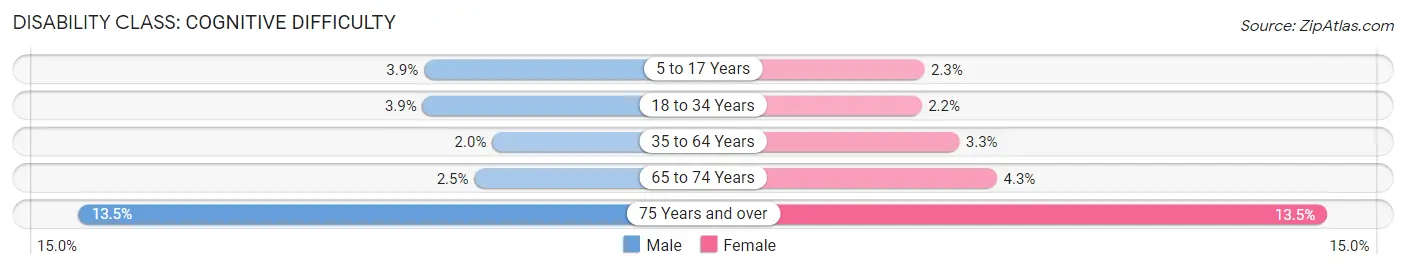
| Age Bracket | Male | Female |
| 5 to 17 Years | 622 (3.9%) | 349 (2.3%) |
| 18 to 34 Years | 599 (3.9%) | 357 (2.2%) |
| 35 to 64 Years | 611 (2.0%) | 1,023 (3.3%) |
| 65 to 74 Years | 128 (2.5%) | 247 (4.3%) |
| 75 Years and over | 353 (13.5%) | 477 (13.5%) |
Disability Class: Ambulatory Difficulty
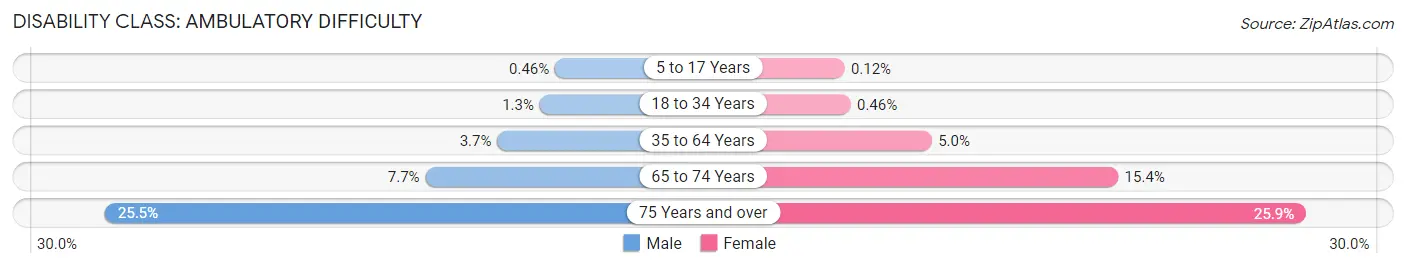
| Age Bracket | Male | Female |
| 5 to 17 Years | 73 (0.5%) | 18 (0.1%) |
| 18 to 34 Years | 201 (1.3%) | 75 (0.5%) |
| 35 to 64 Years | 1,135 (3.7%) | 1,564 (5.0%) |
| 65 to 74 Years | 396 (7.7%) | 881 (15.4%) |
| 75 Years and over | 668 (25.5%) | 913 (25.9%) |
Disability Class: Self-Care Difficulty
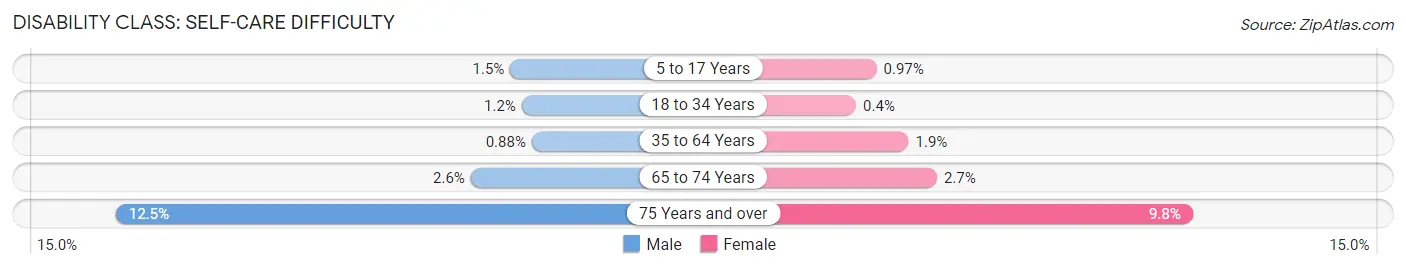
| Age Bracket | Male | Female |
| 5 to 17 Years | 237 (1.5%) | 148 (1.0%) |
| 18 to 34 Years | 178 (1.2%) | 64 (0.4%) |
| 35 to 64 Years | 271 (0.9%) | 583 (1.9%) |
| 65 to 74 Years | 133 (2.6%) | 152 (2.6%) |
| 75 Years and over | 326 (12.5%) | 345 (9.8%) |
Technology Access in Stafford County
Computing Device Access in Stafford County
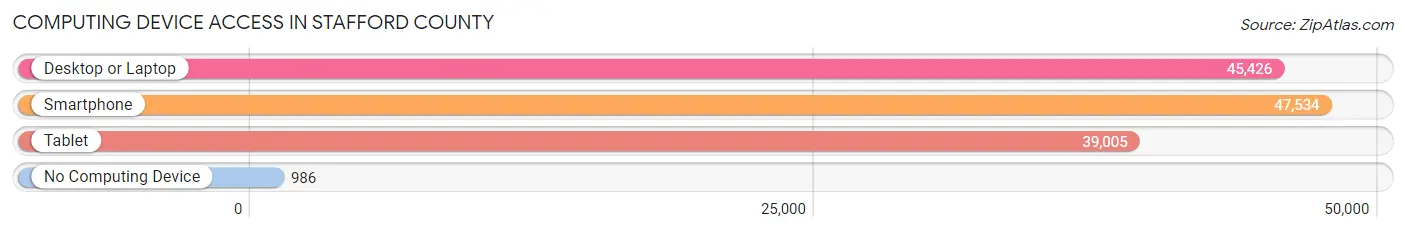
| Device Type | # Households | % Households |
| Desktop or Laptop | 45,426 | 90.3% |
| Smartphone | 47,534 | 94.5% |
| Tablet | 39,005 | 77.5% |
| No Computing Device | 986 | 2.0% |
| Total | 50,313 | 100.0% |
Internet Access in Stafford County
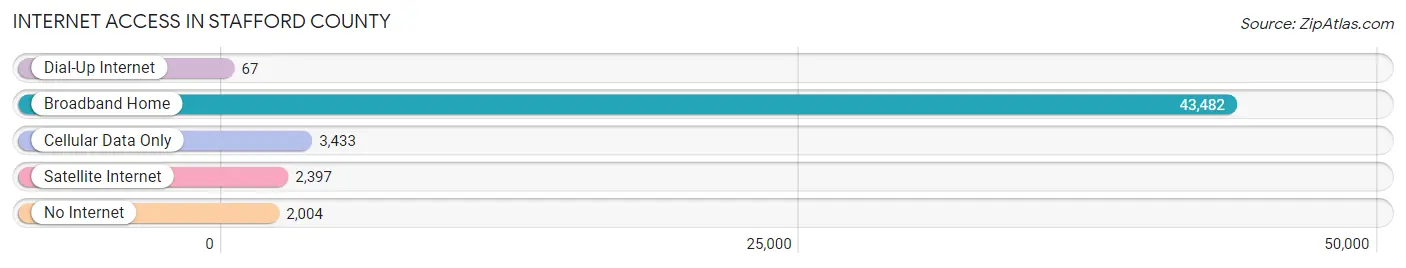
| Internet Type | # Households | % Households |
| Dial-Up Internet | 67 | 0.1% |
| Broadband Home | 43,482 | 86.4% |
| Cellular Data Only | 3,433 | 6.8% |
| Satellite Internet | 2,397 | 4.8% |
| No Internet | 2,004 | 4.0% |
| Total | 50,313 | 100.0% |
Stafford County Summary
Stafford County is located in the Commonwealth of Virginia, in the United States of America. It is situated in the northern part of the state, along the Potomac River, and is part of the Washington Metropolitan Area. The county is bordered by Prince William County to the north, Spotsylvania County to the south, and the City of Fredericksburg to the east. The county seat is the town of Stafford.
History
Stafford County was formed in 1664 from parts of Westmoreland and King George counties. It was named for Staffordshire, England, the ancestral home of many of the county's early settlers. The county was originally part of the Northern Neck Proprietary, a large tract of land granted to seven Englishmen by King Charles II in 1649.
The county was the site of several battles during the American Revolutionary War and the Civil War. During the Revolutionary War, the Battle of Aquia Creek was fought in the county in 1775. During the Civil War, the Battle of Fredericksburg was fought in the county in 1862.
Geography
Stafford County is located in the northern part of the Commonwealth of Virginia. It is bordered by Prince William County to the north, Spotsylvania County to the south, and the City of Fredericksburg to the east. The county is situated along the Potomac River, and is part of the Washington Metropolitan Area.
The county has a total area of 286 square miles, of which 279 square miles is land and 7 square miles is water. The terrain is generally flat, with some rolling hills in the northern part of the county. The county is drained by the Potomac River and its tributaries, including Aquia Creek, Accokeek Creek, and Potomac Creek.
Economy
The economy of Stafford County is largely based on government and military jobs, as well as tourism. The county is home to the Quantico Marine Corps Base, which is the largest employer in the county. Other major employers include the Federal Bureau of Investigation, the United States Department of Defense, and the United States Department of Homeland Security.
The county is also home to several tourist attractions, including the Aquia Creek Battlefield Park, the Fredericksburg and Spotsylvania National Military Park, and the Potomac Point Winery.
Demographics
As of the 2010 United States Census, there were 128,961 people, 45,945 households, and 34,945 families residing in the county. The population density was 459.3 people per square mile. The racial makeup of the county was 79.2% White, 11.7% Black or African American, 0.5% Native American, 3.2% Asian, 0.1% Pacific Islander, 2.7% from other races, and 2.7% from two or more races.
The median income for a household in the county was $87,845, and the median income for a family was $99,945. The per capita income for the county was $37,945. About 4.2% of families and 5.7% of the population were below the poverty line, including 6.7% of those under age 18 and 4.2% of those age 65 or over.
Common Questions
What is Per Capita Income in Stafford County?
Per Capita income in Stafford County is $48,971.
What is the Median Family Income in Stafford County?
Median Family Income in Stafford County is $141,167.
What is the Median Household income in Stafford County?
Median Household Income in Stafford County is $128,036.
What is Income or Wage Gap in Stafford County?
Income or Wage Gap in Stafford County is 41.3%.
Women in Stafford County earn 58.7 cents for every dollar earned by a man.
What is Family Income Deficit in Stafford County?
Family Income Deficit in Stafford County is $9,455.
Families that are below poverty line in Stafford County earn $9,455 less on average than the poverty threshold level.
What is Inequality or Gini Index in Stafford County?
Inequality or Gini Index in Stafford County is 0.38.
What is the Total Population of Stafford County?
Total Population of Stafford County is 157,606.
What is the Total Male Population of Stafford County?
Total Male Population of Stafford County is 79,848.
What is the Total Female Population of Stafford County?
Total Female Population of Stafford County is 77,758.
What is the Ratio of Males per 100 Females in Stafford County?
There are 102.69 Males per 100 Females in Stafford County.
What is the Ratio of Females per 100 Males in Stafford County?
There are 97.38 Females per 100 Males in Stafford County.
What is the Median Population Age in Stafford County?
Median Population Age in Stafford County is 36.4 Years.
What is the Average Family Size in Stafford County
Average Family Size in Stafford County is 3.5 People.
What is the Average Household Size in Stafford County
Average Household Size in Stafford County is 3.1 People.
How Large is the Labor Force in Stafford County?
There are 83,688 People in the Labor Forcein in Stafford County.
What is the Percentage of People in the Labor Force in Stafford County?
69.0% of People are in the Labor Force in Stafford County.
What is the Unemployment Rate in Stafford County?
Unemployment Rate in Stafford County is 3.9%.